Pattern Recognition 2cs4243/lecture/tsim-prec-2.pdfK-Nearest Neighbor Performance Evaluation...
43
More on Bayes’ Classifier K-Nearest Neighbor Performance Evaluation Features Summary Pattern Recognition 2 KNN, PCA, LDA Dr. Terence Sim School of Computing National University of Singapore Dr. Terence Sim Pattern Recognition 2
-
Upload
truongkiet -
Category
Documents
-
view
230 -
download
0
Transcript of Pattern Recognition 2cs4243/lecture/tsim-prec-2.pdfK-Nearest Neighbor Performance Evaluation...

More on Bayes’ ClassifierK-Nearest Neighbor
Performance EvaluationFeatures
Summary
Pattern Recognition 2KNN, PCA, LDA
Dr. Terence Sim
School of ComputingNational University of Singapore
Dr. Terence Sim Pattern Recognition 2

More on Bayes’ ClassifierK-Nearest Neighbor
Performance EvaluationFeatures
Summary
Outline
1 More on Bayes’ Classifier
2 K-Nearest Neighbor
3 Performance Evaluation
4 FeaturesPCALDA
5 Summary
Dr. Terence Sim Pattern Recognition 2

More on Bayes’ ClassifierK-Nearest Neighbor
Performance EvaluationFeatures
Summary
Outline
1 More on Bayes’ Classifier
2 K-Nearest Neighbor
3 Performance Evaluation
4 FeaturesPCALDA
5 Summary
Dr. Terence Sim Pattern Recognition 2

More on Bayes’ ClassifierK-Nearest Neighbor
Performance EvaluationFeatures
Summary
More on Bayes’ Classifier
The Bayes’ Classifier is theoretically optimum.That is, prob. of error (misclassification), P(error), issmallest, given the set of features.
But this requires knowing the true class-conditional pdfs.In reality, we don’t know, so we estimate from training data.This may break the optimality, because our training data isnot representative of all possible data.
Nevertheless, the Bayes’ Classifier is commonly used.See also: [1]
Dr. Terence Sim Pattern Recognition 2

More on Bayes’ ClassifierK-Nearest Neighbor
Performance EvaluationFeatures
Summary
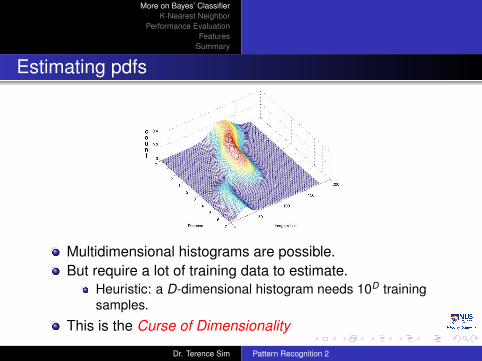
Estimating pdfs
One common method is to use histograms.Normalized histogram = pdf.
Dr. Terence Sim Pattern Recognition 2
More on Bayes’ ClassifierK-Nearest Neighbor
Performance EvaluationFeatures
Summary
Estimating pdfs
Multidimensional histograms are possible.But require a lot of training data to estimate.
Heuristic: a D-dimensional histogram needs 10D trainingsamples.
This is the Curse of Dimensionality
Dr. Terence Sim Pattern Recognition 2

More on Bayes’ ClassifierK-Nearest Neighbor
Performance EvaluationFeatures
Summary
Naive Bayes’
To overcome the Curse of Dimensionality, one way is toassume that the D features are statistically independent.
Recap: two random variables X , Y are statisticallyindependent iff P(X , Y ) = P(X ) P(Y )
Suppose feature vector x = [x1, . . . , xD]>, then:
ω∗ = arg maxωj
P(x | ωj) P(ωj)
= arg maxωj
P(ωj)D∏
i=1
P(xi | ωj)
In practice, use log probabilities to avoid underflow.
This is called the Naive Bayes assumption.Surprisingly, it works well in practice!
Dr. Terence Sim Pattern Recognition 2

More on Bayes’ ClassifierK-Nearest Neighbor
Performance EvaluationFeatures
Summary
Face Detection using Naive Bayes’ [2]
Dr. Terence Sim Pattern Recognition 2

More on Bayes’ ClassifierK-Nearest Neighbor
Performance EvaluationFeatures
Summary
Outline
1 More on Bayes’ Classifier
2 K-Nearest Neighbor
3 Performance Evaluation
4 FeaturesPCALDA
5 Summary
Dr. Terence Sim Pattern Recognition 2

More on Bayes’ ClassifierK-Nearest Neighbor
Performance EvaluationFeatures
Summary
K -Nearest Neighbor
Instead of using pdfs, why not simply estimate the decisionboundary?The K -Nearest Neighbor (KNN) method estimates thisimplicitly.
Dr. Terence Sim Pattern Recognition 2

More on Bayes’ ClassifierK-Nearest Neighbor
Performance EvaluationFeatures
Summary
K -Nearest Neighbor
All training data are simply stored, with their class labels.Given a point x to be classified,
Select the K nearest neighbors of x.Assign to x the majority label of these K neighbors.
Usually, K is odd.Ties can still occur: e.g. 3 classes, and K = 3.
This is not optimal classifier, but given “enough” trainingdata, P(errorKNN) ≤ 2 P(errorBayes)
Notion of “nearness”: Distance metric important.Choice of distance metric affects accuracy.
Pros: easy to implement. Cons: cannot scale.
Dr. Terence Sim Pattern Recognition 2

More on Bayes’ ClassifierK-Nearest Neighbor
Performance EvaluationFeatures
Summary
Implicit Decision Boundary
Each Voronoi cell is a region whose nearest neighbor isthe training sample enclosed in the cell.
Dr. Terence Sim Pattern Recognition 2

More on Bayes’ ClassifierK-Nearest Neighbor
Performance EvaluationFeatures
Summary
Outline
1 More on Bayes’ Classifier
2 K-Nearest Neighbor
3 Performance Evaluation
4 FeaturesPCALDA
5 Summary
Dr. Terence Sim Pattern Recognition 2

More on Bayes’ ClassifierK-Nearest Neighbor
Performance EvaluationFeatures
Summary
How Good is the Classifier?
Test it with another set of labelled data (not training set).
ω1 ω2 ω3 ω4
ω1 20 3 1ω2 14 10ω3 5 15 4ω4 3 3 18
Confusion Matrix
The row labels are the true labels of the test data; thecolumns labels are the ones assigned by the classifier.Diagonal entries are the number of correct classifications.Off-diagonal entries are misclassifications.Ideally, matrix should be diagonal, meaning 0 error.Accuracy = trace/total = 63/96 = 65.6 %
Dr. Terence Sim Pattern Recognition 2

More on Bayes’ ClassifierK-Nearest Neighbor
Performance EvaluationFeatures
Summary
Cross Validation
To guard against a “fluke test”.Divide T training samples into N equal bins.Leave out 1st bin. Train using the rest. Test using 1st bin.Repeat by leaving out each bin in turn, training using therest, and testing using the omitted bin.Average the accuracies from all runs.This is called N-fold Cross Validation.Leave-1-out cross validation: when N = T
Dr. Terence Sim Pattern Recognition 2

More on Bayes’ ClassifierK-Nearest Neighbor
Performance EvaluationFeatures
Summary
PCALDA
Outline
1 More on Bayes’ Classifier
2 K-Nearest Neighbor
3 Performance Evaluation
4 FeaturesPCALDA
5 Summary
Dr. Terence Sim Pattern Recognition 2

More on Bayes’ ClassifierK-Nearest Neighbor
Performance EvaluationFeatures
Summary
PCALDA
What Features to Use?
Choosing features more of an art than a science.No theory says which feature is best for given problem.Experience, insight, familiarity help.
Why not try all possible sets of features?NP-hard!
Greedy approach:From F possible features, select 1 that gives best accuracy.From F − 1 possible features, select 1 that, when combinedwith previous feature, gives best accuracy.etc.Common features: edges, lines, color histogram, wavelets,Fourier transform, shape, derivatives.
Dr. Terence Sim Pattern Recognition 2

More on Bayes’ ClassifierK-Nearest Neighbor
Performance EvaluationFeatures
Summary
PCALDA
Desirable Properties
Easy to compute (efficient)Compact (less storage)Good discriminative powerEfficient distance metricRobust to image distortions (e.g. rotation, illumination)
Dr. Terence Sim Pattern Recognition 2

More on Bayes’ ClassifierK-Nearest Neighbor
Performance EvaluationFeatures
Summary
PCALDA
Principal Components Analysis (PCA)
a.k.a. Discrete Karhunen Loeve Transform, HotellingTransformLet y ∈ Rk be feature vector computed from image (oranother feature vector) x ∈ Rd , where k � d .
y = W>x (1)
W is d × k and orthogonal.W to be determined from statistics of x.Let’s suppose mean and covariance matrix are:E [x] = 0, E [xx>] = Cx
We want expected error to be small. How to compute W ?
Dr. Terence Sim Pattern Recognition 2

More on Bayes’ ClassifierK-Nearest Neighbor
Performance EvaluationFeatures
Summary
PCALDA
RecapExpectation is the mean (average) of random variable x :
E [x ] =
∫x p(x)dx
Variance is the expected squared difference from mean m :
Var [x ] = E [(x −m)2] = E [x2]− (E(x))2
For vectors,
Mean: m = E [x] = [E [x1] E [x2] · · ·E [xd ]]>
Covariance matrix: Var [x] = E [(x−m)(x−m)>]
= E [xx>]−mm>
Note: covariance matrix is symmetric and positive semi-definiteDr. Terence Sim Pattern Recognition 2

More on Bayes’ ClassifierK-Nearest Neighbor
Performance EvaluationFeatures
Summary
PCALDA
PCA
Recovered vector xr = WyError: ε = x− xr = x−WW>xWe want small expected error:
||ε||2 = ε>ε
= (x−WW>x)>(x−WW>x)
= x>x− x>WW>x− x>WW>x + x>WW>WW>x
= x>x− x>WW>x
Note that W>W = I.
Dr. Terence Sim Pattern Recognition 2

More on Bayes’ ClassifierK-Nearest Neighbor
Performance EvaluationFeatures
Summary
PCALDA
PCA
Let k = 1, i.e. W is vector, y is scalar. Then
E [ε>ε] = E [x>x]− E [(x>w)(w>x)]
= E [x>x]− E [w>xx>w]
= E [x>x]−w>E [xx>]w= E [x>x]−w>Cxw
Dr. Terence Sim Pattern Recognition 2

More on Bayes’ ClassifierK-Nearest Neighbor
Performance EvaluationFeatures
Summary
PCALDA
PCA
We need to find w that minimizes E [ε>ε]
This is the same as maximizing the 2nd term on right-hand side:
maxw
w>Cx w
But we should normalize by length of w, so define
J =w>Cx w
w>w(2)
Goal: find w to maximize J
Dr. Terence Sim Pattern Recognition 2

More on Bayes’ ClassifierK-Nearest Neighbor
Performance EvaluationFeatures
Summary
PCALDA
PCA
Take derivatives and set to 0:
dJdw
=(w>w)2Cx w− (w>Cx w)2w
(w>w)2 = 0
0 =2Cx ww>w
−[
w>Cx ww>w
]• 2w
w>w
Note: term in brackets is J, so we rearrange to get:
Cx w = J w ←− Eigenvalue problem!
Thus, w is eigenvector of Cx corresponding to largesteigenvalue (= J).
Dr. Terence Sim Pattern Recognition 2

More on Bayes’ ClassifierK-Nearest Neighbor
Performance EvaluationFeatures
Summary
PCALDA
PCA
In general, PCA is: y = W>(x−m)
where m = E [x] mean, and W is d × k matrix containing the keigenvectors of Var [x] (covariance matrix) corresponding to thetop k eigenvalues.
W =
p p pw1 w2 · · · wkp p p
w1: First principal component,w2: Second principal component, etc.
Dr. Terence Sim Pattern Recognition 2

More on Bayes’ ClassifierK-Nearest Neighbor
Performance EvaluationFeatures
Summary
PCALDA
PCA notes
PCA is a shift and rotation ofthe axes.w1 : direction of greatestelongationw2 : direction of next greatestelongation, and orthogonal toprevious eigenvector; etc.W is orthogonal because Cx issymmetric.WW> 6= I unless k = d
Dr. Terence Sim Pattern Recognition 2

More on Bayes’ ClassifierK-Nearest Neighbor
Performance EvaluationFeatures
Summary
PCALDA
PCA notes
Best compression of r.v. x, in the "least-squares error"sense.
Guaranteed by the derivation of PCA.
De-correlation: y = W>(x−m)Var [y] = Cy = W>CxW = Λ diagonal eigenvalue matrixi.e. elements of y = [y1 · · · yk ]> are uncorrelated.
Dr. Terence Sim Pattern Recognition 2

More on Bayes’ ClassifierK-Nearest Neighbor
Performance EvaluationFeatures
Summary
PCALDA
PCA notes
Dimensionality Reduction: x ∈ Rd , y ∈ Rk , k � d
Typically, choose k so that ratioPk
i=1 λiPd
j=1 λj> 90% "Energy"
But how to get Cx , m? Statistics of xGiven data x1, x2, . . . xN , estimate m, CxSample mean m = 1
N∑N
i=1 xiSample covariance matrix:
Cx =1N
N∑i=1
(xi −m)(xi −m)>
or1
N − 1
N∑i=1
(xi −m)(xi −m)>
or Scatter matrix S =N∑
i=1
(xi −m)(xi −m)>Dr. Terence Sim Pattern Recognition 2

More on Bayes’ ClassifierK-Nearest Neighbor
Performance EvaluationFeatures
Summary
PCALDA
PCA notes
Usually, N � d , so Cx is rank-deficient, also Cx is too large.d × d matrix. Computational trick: use inner products.
Let A =
p p px1 −m x2 −m · · · xN −m
p p p
, A is d × N
Then A>A is N × N. Find eigenvectors/values of A>A
⇒ A>Av = λv
(AA>)Av = λ(Av)
⇒ Av is eigenvector of AA>
Note that AA> =∑N
i=1(xi −m)(xi −m)> = S, scatter matrixThus we avoid calculating AA>
Dr. Terence Sim Pattern Recognition 2

More on Bayes’ ClassifierK-Nearest Neighbor
Performance EvaluationFeatures
Summary
PCALDA
PCA example
1 Perhaps the most famous use of PCA is in face recognition, asexemplified in the classic paper by Turk and Pentland [3].
2 Start with a set of face images, vectorize them, then computethe PCA. The mean and eigenfaces look like this:
Dr. Terence Sim Pattern Recognition 2

More on Bayes’ ClassifierK-Nearest Neighbor
Performance EvaluationFeatures
Summary
PCALDA
PCA examplehttp://www.cs.princeton.edu/~mhibbs/class/cs496/eigenfaces/
1 A face image is then a weighted sum of these eigenfaces, +mean.
2 Using more eigenfaces leads to better approximation.
Orig. image 1 EF 5 EF 15 EF 25 EF
Dr. Terence Sim Pattern Recognition 2

More on Bayes’ ClassifierK-Nearest Neighbor
Performance EvaluationFeatures
Summary
PCALDA
PCA example
1 Each face is thus represented as the PCA weights.2 Recognition can be done by finding closest weight.3 What about images of non-faces?
Image Approximation
Dr. Terence Sim Pattern Recognition 2

More on Bayes’ ClassifierK-Nearest Neighbor
Performance EvaluationFeatures
Summary
PCALDA
Linear Discriminant Analysis (LDA)
a.k.a. Fisher Linear Discriminant
PCA has been used as features in e.g. face recognition.See [3]But PCA is good for pattern representation rather than forpattern discriminationNevertheless, PCA is still useful for DimensionalityReduction
Dr. Terence Sim Pattern Recognition 2
More on Bayes’ ClassifierK-Nearest Neighbor
Performance EvaluationFeatures
Summary
PCALDA
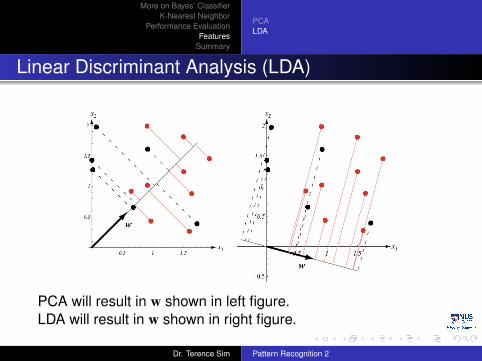
Linear Discriminant Analysis (LDA)
PCA will result in w shown in left figure.LDA will result in w shown in right figure.
Dr. Terence Sim Pattern Recognition 2

More on Bayes’ ClassifierK-Nearest Neighbor
Performance EvaluationFeatures
Summary
PCALDA
LDA
Suppose we have C = 2 classes: ω1, ω2Define the within-class scatter matrix as:
SW =C∑
i=1
∑x∈ωi
(x−mi)(x−mi)>
where mi is the mean of class ωi .
Think of this as the sum of the covariance matrix of each class.It measures the spread of each class.
Dr. Terence Sim Pattern Recognition 2

More on Bayes’ ClassifierK-Nearest Neighbor
Performance EvaluationFeatures
Summary
PCALDA
LDA
Also define the between-class scatter matrix as:
SB = (m1 −m2)(m1 −m2)>
This measures the separation of the two classes.
Dr. Terence Sim Pattern Recognition 2

More on Bayes’ ClassifierK-Nearest Neighbor
Performance EvaluationFeatures
Summary
PCALDA
LDA
Fisher’s Criterion is defined as:
JF =w>SBww>SW w
(3)
Goal: maximize JF , i.e. find a vector w such that differentclasses are well separated, while spread in each class isreduced.Compare this with PCA criteria Equation (2)
Total scatter matrix S = SW + SB, so PCA is maximizing thespread in the total scatter matrix.
Dr. Terence Sim Pattern Recognition 2
More on Bayes’ ClassifierK-Nearest Neighbor
Performance EvaluationFeatures
Summary
PCALDA
LDA
It can be shown that the solution to Equation (3) is:
SBw = λSW w (4)
This is called the Generalized Eigenvalue problem.If SW is invertible, then
S−1W SBw = λw
which is the regular eigenvalue problem involving S−1W SB
Dr. Terence Sim Pattern Recognition 2

More on Bayes’ ClassifierK-Nearest Neighbor
Performance EvaluationFeatures
Summary
PCALDA
LDA
Once w is found, feature is computed as: y = w>x.Using this feature, we can then classify using, say, KNN.If more than 2 classes, then re-define between-classmatrix as:
SB =C∑
i=1
ni(mi −m)(mi −m)>
where ni is the number of training samples in ωi , and m isthe mean of all training samples (ignoring classes).
Dr. Terence Sim Pattern Recognition 2

More on Bayes’ ClassifierK-Nearest Neighbor
Performance EvaluationFeatures
Summary
PCALDA
LDA
There will be C − 1 eigenvectors wi , i = 1 . . . C, eachsolved using Equation (4).These eigenvectors are not necessarily orthogonal!
Because S−1W B may not be symmetric.
These eigenvectors form a linear subspace such thatFisher’s Criterion is maximized.Put them into a W matrix, and compute feature as before:y = W>x.
Dr. Terence Sim Pattern Recognition 2

More on Bayes’ ClassifierK-Nearest Neighbor
Performance EvaluationFeatures
Summary
Outline
1 More on Bayes’ Classifier
2 K-Nearest Neighbor
3 Performance Evaluation
4 FeaturesPCALDA
5 Summary
Dr. Terence Sim Pattern Recognition 2

More on Bayes’ ClassifierK-Nearest Neighbor
Performance EvaluationFeatures
Summary
Summary
1 The Bayes’ Classifier is the theoretical best, but estimatingthe pdfs is a problem.
2 The K -nearest neighbor classifier is easy to implement, butdoesn’t scale up well. Also: choice of distance metricimportant.
3 Deciding what features are best for a given patternrecognition problem is an art, not a science.
4 Two common techniques to compute useful features are:PCA and LDA.
Dr. Terence Sim Pattern Recognition 2

More on Bayes’ ClassifierK-Nearest Neighbor
Performance EvaluationFeatures
Summary
References
R. Duda, P. Hart, and D. Stork.Pattern Classification, 2nd edition.John Wiley and Sons, 2000.
H. Schneiderman and T. Kanade.A statistical method for 3d object detection applied to facesand cars.In IEEE Conference on Computer Vision and PatternRecognition, 2000.
M. Turk and A. Pentland.Eigenfaces for Recognition.Journal of Cognitive Neuroscience, 3(1), 1991.
Dr. Terence Sim Pattern Recognition 2