Pattern classification of response inhibition in ADHD: Toward the development of neurobiological...
12
Pattern Classification of Response Inhibition in ADHD: Toward the Development of Neurobiological Markers for ADHD Heledd Hart, 1 Kaylita Chantiluke, 1 Ana I. Cubillo, 1 Anna B. Smith, 1 Andrew Simmons, 2 Michael J. Brammer, 2 Andre F. Marquand, 2 and Katya Rubia 1 * 1 Department of Child and Adolescent Psychiatry, Institute of Psychiatry, King’s College London, De Crespigny Park, London, SE5 8AF, United Kingdom 2 Department of Neuroimaging, Institute of Psychiatry, King’s College London, De Crespigny Park, London, SE5 8AF, United Kingdom r r Abstract: The diagnosis of Attention Deficit Hyperactivity Disorder (ADHD) is based on subjective measures despite evidence for multisystemic structural and functional deficits. ADHD patients have consistent neurofunctional deficits in motor response inhibition. The aim of this study was to apply pattern classification to task-based functional magnetic resonance imaging (fMRI) of inhibition, to accu- rately predict the diagnostic status of ADHD. Thirty adolescent ADHD and thirty age-matched healthy boys underwent fMRI while performing a Stop task. fMRI data were analyzed with Gaussian process classifiers (GPC), a machine learning approach, to predict individual ADHD diagnosis based on task- based activation patterns. Traditional univariate case-control analyses were also performed to replicate previous findings in a relatively large dataset. The pattern of brain activation correctly classified up to 90% of patients and 63% of controls, achieving an overall classification accuracy of 77%. The regions of the discriminative network most predictive of controls included later developing lateral prefrontal, striatal, and temporo-parietal areas that mediate inhibition, while regions most predictive of ADHD were in earlier developing ventromedial fronto-limbic regions, which furthermore correlated with symptom severity. Univariate analysis showed reduced activation in ADHD in bilateral ventrolateral prefrontal, striatal, and temporo-parietal regions that overlapped with areas predictive of controls, sug- gesting the latter are dysfunctional areas in ADHD. We show that significant individual classification of ADHD patients of 77% can be achieved using whole brain pattern analysis of task-based fMRI inhibition data, suggesting that multivariate pattern recognition analyses of inhibition networks can provide objective diagnostic neuroimaging biomarkers of ADHD. Hum Brain Mapp 35:3083–3094, 2014. V C 2013 Wiley Periodicals, Inc. Contract grant sponsors: NIHR Biomedical Research Centre (BRC) for Mental Health at South London and Maudsley NHS Founda- tion Trust and Institute of Psychiatry, Kings College London and Lilly Pharmaceuticals, Kids Company, NIHR BRC, King’s College London Centre of Excellence in Medical Engineering; Contract grant sponsor: Well-come Trust and EPSRC; Contract grant num- ber: Nr WT088641/Z/09/Z. *Correspondence to: Katya Rubia, Department of Child & Adoles- cent Psychiatry, Institute of Psychiatry, King’s College London, De Crespigny Park, London, SE5 8AF, UK. E-mail: [email protected] Received for publication 23 May 2013; Revised 19 July 2013; Accepted 22 July 2013. DOI 10.1002/hbm.22386 Published online 11 October 2013 in Wiley Online Library (wileyonlinelibrary.com). r Human Brain Mapping 35:3083–3094 (2014) r V C 2013 The Authors. Human Brain Mapping published by Wiley Periodicals, Inc. This is an open access article under the terms of the Creative Commons Attribution-Non-Commercial-NoDerivs License, which permits use and distribution in any medium, provided the original work is properly cited, the use is non-commercial and no modifications or adaptations are made.
Transcript of Pattern classification of response inhibition in ADHD: Toward the development of neurobiological...

Pattern Classification of Response Inhibition inADHD: Toward the Development ofNeurobiological Markers for ADHD
Heledd Hart,1 Kaylita Chantiluke,1 Ana I. Cubillo,1 Anna B. Smith,1
Andrew Simmons,2 Michael J. Brammer,2 Andre F. Marquand,2 andKatya Rubia1*
1Department of Child and Adolescent Psychiatry, Institute of Psychiatry, King’sCollege London, De Crespigny Park, London, SE5 8AF, United Kingdom
2Department of Neuroimaging, Institute of Psychiatry, King’s College London,De Crespigny Park, London, SE5 8AF, United Kingdom
r r
Abstract: The diagnosis of Attention Deficit Hyperactivity Disorder (ADHD) is based on subjectivemeasures despite evidence for multisystemic structural and functional deficits. ADHD patients haveconsistent neurofunctional deficits in motor response inhibition. The aim of this study was to applypattern classification to task-based functional magnetic resonance imaging (fMRI) of inhibition, to accu-rately predict the diagnostic status of ADHD. Thirty adolescent ADHD and thirty age-matched healthyboys underwent fMRI while performing a Stop task. fMRI data were analyzed with Gaussian processclassifiers (GPC), a machine learning approach, to predict individual ADHD diagnosis based on task-based activation patterns. Traditional univariate case-control analyses were also performed to replicateprevious findings in a relatively large dataset. The pattern of brain activation correctly classified up to90% of patients and 63% of controls, achieving an overall classification accuracy of 77%. The regions ofthe discriminative network most predictive of controls included later developing lateral prefrontal,striatal, and temporo-parietal areas that mediate inhibition, while regions most predictive of ADHDwere in earlier developing ventromedial fronto-limbic regions, which furthermore correlated withsymptom severity. Univariate analysis showed reduced activation in ADHD in bilateral ventrolateralprefrontal, striatal, and temporo-parietal regions that overlapped with areas predictive of controls, sug-gesting the latter are dysfunctional areas in ADHD. We show that significant individual classification ofADHD patients of 77% can be achieved using whole brain pattern analysis of task-based fMRI inhibitiondata, suggesting that multivariate pattern recognition analyses of inhibition networks can provideobjective diagnostic neuroimaging biomarkers of ADHD. Hum Brain Mapp 35:3083–3094, 2014. VC 2013 Wiley
Periodicals, Inc.
Contract grant sponsors: NIHR Biomedical Research Centre (BRC)for Mental Health at South London and Maudsley NHS Founda-tion Trust and Institute of Psychiatry, Kings College London andLilly Pharmaceuticals, Kids Company, NIHR BRC, King’s CollegeLondon Centre of Excellence in Medical Engineering; Contractgrant sponsor: Well-come Trust and EPSRC; Contract grant num-ber: Nr WT088641/Z/09/Z.
*Correspondence to: Katya Rubia, Department of Child & Adoles-cent Psychiatry, Institute of Psychiatry, King’s College London,
De Crespigny Park, London, SE5 8AF, UK. E-mail:[email protected]
Received for publication 23 May 2013; Revised 19 July 2013;Accepted 22 July 2013.
DOI 10.1002/hbm.22386Published online 11 October 2013 in Wiley Online Library(wileyonlinelibrary.com).
r Human Brain Mapping 35:3083–3094 (2014) r
VC 2013 The Authors. Human Brain Mapping published by Wiley Periodicals, Inc.This is an open access article under the terms of the Creative Commons Attribution-Non-Commercial-NoDerivs License,which permits use and distribution in any medium, provided the original work is properly cited, the use is non-commercialand no modifications or adaptations are made.

Key words: ADHD; biomarker; diagnosis; functional magnetic resonance imaging; Gaussian processclassifier; inhibition
r r
INTRODUCTION
Attention Deficit Hyperactivity Disorder (ADHD) is themost commonly diagnosed child psychiatric disorder,defined by age-inappropriate problems with inattention,impulsivity, and hyperactivity [American Psychiatric Asso-ciation, 2000]. One of the most consistent deficits is inmotor response inhibition during the Stop task [Aldersonet al., 2007; Rubia et al., 2007a; Willcutt et al., 2005], under-pinned by functional magnetic resonance imaging (fMRI)findings of reduced activation in key inhibition areas ofventrolateral prefrontal cortex (VLPFC), supplementarymotor area (SMA) and caudate, as well as temporo-parietal regions [Cubillo et al., 2010, 2012; Hart et al., 2013;Passarotti et al., 2010; Pliszka et al., 2006; Rubia, 2011;Rubia et al., 1999, 2005, 2008, 2010, 2011a, 2013; Smithet al., 2006].
Despite the fact that ADHD is a neurodevelopmental dis-order with consistent evidence for brain structure and func-tion deficits [Cubillo et al., 2012; Nakao et al., 2011; Hartet al., 2012, 2013; Rubia, 2011; Valera et al., 2007], currentlyADHD is diagnosed solely on the basis of subjective clinicaland rating measures, which are often unreliable, leading todiagnostic variability between clinicians, cultures and coun-tries [Polanczyk et al., 2007]. Sensitivity of classification ofADHD children with clinical measures based on Diagnosticand Statistical Manual (DSM)-IV criteria has been shown tobe 70–90% [Weiler et al., 2000], thus misdiagnoses arearound 10–30%. It is thus highly desirable to develop addi-tional and more reliable diagnostic methods for ADHDpatients that rely on objectively measurable neuroimagingdata. Attempts to find objective neuroimaging biomarkersfor ADHD, however, have been limited by the fact that intraditional univariate group statistical analyses, subjects inboth groups tend to overlap in measures that show groupdifferences and effect sizes have been relatively small[Valera et al., 2007], which has made it difficult to makediagnostic predictions at the level of individual subjects.
In contrast, multivariate pattern analyses (MVPA) forimaging data take into account interactions between regions(i.e., brain structure or function patterns) and can make pre-dictions (e.g., of class membership) for individual subjectsas opposed to group-level inferences. These methods havebeen shown to provide sensitive and specific diagnosticindicators for individual patients with other pathologiessuch as autism, depression, and Alzheimer’s disease [Eckeret al., 2010; Marquand et al., 2008; Orru et al., 2012].
To date, few imaging studies have used multivariate pat-tern recognition analyses techniques to classify ADHDpatients. A recent competition to apply multivariate methods
on a multicenter resting state functional and anatomicalimaging dataset of 285 children and adolescents with ADHDand 491 healthy controls (ADHD-200 Consortium; http://fcon_1000.projects.nitrc.org/indi/adhd200/) was met by arange of classification approaches including random forests,gradient boosting, multi-kernel learning and support vectormachines [Cheng et al., 2012; Colby et al., 2012; Dai et al.,2012; Eloyan et al., 2012]. Accuracies derived by internalcross-validation ranged from 55–78%, although the accura-cies reported on an external test dataset for which diagnosticlabels were withheld were substantially lower [61% for thewinning team (Eloyan et al., 2012)]. This difference wasattributed to a lack of standardization between sites, leadingto multiple confounds including missing data, site-specificdifferences in behavioural measurements, imaging acquisi-tion, processing, and protocols, scanner quality and otherunmeasured confounding and mediating variables. Further-more, the competition dataset was highly unbalanced, withmore control subjects than ADHD patients (63% and 37%respectively) and balanced accuracy measures, caclulated asthe mean of sensitivity and specificity, that accommodatethis imbalance [Broderson et al., 2012] are consistently lowerthan the figures reported (e.g., 57.5% for the winning team).In addition, the competition scoring rewarded specificitymore than sensitivity so that all teams reported high specific-ity, but poor sensitivity (21% for the winning team). Also,none of the studies used probabilistic classification modelssuch as Gaussian Process Classifiers (GPCs). GPCs are kernelclassifiers used in machine learning, similar to support vectormachines (SVMs), which have good performance for fMRI[Marquand et al., 2010]. Their main advantage over alterna-tive methods is that they provide estimates of predictiveuncertainty and can accommodate unbalanced diagnostic set-tings or variations in disease prevalence, which are crucialfor clinical applications [Hahn et al., 2012]. The only studythat used GPC in structural imaging data in ADHD showedthat it is possible to accurately classify 29 ADHD patients rel-ative to controls and patients with autism with an accuracyof over 79% based on structural MRI data [Lim et al., 2013].Lastly, to our knowledge, no study in ADHD has used mul-tivariate classification methods to task-related functionalimaging data.
The aim of the present study was therefore to test thehypothesis that GPCs of task-based fMRI data during thetracking Stop task in 30 boys with and 30 healthy boys canidentify distributed neurofunctional patterns that will pro-vide accurate diagnostic predictors of ADHD. The trackingStop task is individually adjusted for accuracy andinvolves the inhibition of a pre-potent motor response to aStop signal that infrequently and unexpectedly follows a
r Hart et al. r
r 3084 r

go signal. We considered the functional neuroanatomy ofthe Stop task to be an excellent candidate for a diagnosticbiomarker for ADHD since (1) deficits in motor responseinhibition in the Stop task are one of the most consistentfindings in ADHD [Alderson et al., 2007; Rubia et al.,2007a; Willcutt et al., 2005] and (2) fMRI studies using theStop task consistently report reduced activation in ADHDpatients relative to healthy controls in key areas of motorresponse inhibition such as right VLPFC, SMA, caudateand thalamus [Cubillo et al., 2010; Hart et al., 2013; Pliszkaet al., 2006; Rubia et al., 1999, 2005, 2008, 2010, 2011a].
A secondary aim was to use traditional univariate analy-ses to replicate previous findings of reduced function ininhibitory regions of VLPFC and the basal ganglia in a rel-atively large cohort of 30 ADHD patients, given that previ-ous studies were typically conducted in less than 20subjects [Cubillo et al., 2010; 2013; Passarotti et al., 2010;Pliszka et al., 2006; Rubia et al., 1999, 2008, 2010, 2011a,b,2005] and to test whether discriminating activation patternsfrom the MVPA overlapped with activations identified inconventional univariate analysis group comparisons.
METHODS AND MATERIALS
Participants
Sixty right-handed boys aged between 10–17 years par-ticipated. Thirty boys were recruited from clinics with aclinical diagnosis of ADHD, hyperactive-impulsive/inat-tentive combined subtype, as assessed by an experiencedchild psychiatrist using the standardized Maudsley diag-nostic interview [Goldberg and Murray, 2002] that assessesADHD according to DSM-IV-TR criteria [American Psychi-atric Association, 1994]. ADHD boys scored above clinicalthreshold for hyperactive-impulsive/inattentive symptomson the Strengths and Difficulties Questionnaire for parents(SDQ) [Goodman et al., 2000], the Conners’ Parent RatingScale (CPRS-R) [Conners et al., 1998], and below clinicalthreshold on the Social Communication Questionnaire(SCQ) [Rutter et al., 2003]. The majority of the ADHD boyswere medication naive (N 5 20). The remainder were tak-ing methylphenidate but discontinued treatment for a 48hrwashout period prior to scanning (N 5 9) or had takenmethylphenidate in the past but had discontinued treat-ment for over a year prior to scanning (N 5 1).
Thirty healthy control boys were recruited throughadvertisement in the same geographical area. They scoredbelow clinical threshold on the SDQ, SCQ and CPRS-R.
Exclusion criteria for all participants were IQ<70 on theWechsler Abbreviated Scale of Intelligence (WASI)[Wechsler, 1999], history of substance abuse or neurologi-cal deficits, presence of other psychiatric disorder (exceptfor conduct/oppositional defiant disorder in the ADHDgroup, N 5 2), learning disability, reading, speech or lan-guage disorder (see Table I for demographic and clinicalmeasures).
One-way analyses of variance (ANOVAs) showed no sig-nificant group differences for age (F(1,58)50.63; P 5 0.43),but for IQ ((F(1,58)530.379; P< 0.001) which is typical inthis population [Kuntsi et al., 2004; Polderman et al., 2006].Although ANCOVA is commonly conducted in case-control studies, this is statistically illegitimate when thecovariate is typically associated with the disorder andwhen, as in this study, groups were not randomly selected.It then becomes meaningless to “adjust” the group effectsfor differences in the covariate, and ANCOVA cannot beused to control group assignment independent of the cova-riate as it would alter the group effect in potentially prob-lematic ways, leading to spurious results [Dennis et al.,2009; Miller and Chapman, 2001]. Therefore, all analyseswere conducted without IQ as a covariate. However, toassess the potential impact of IQ on the classification find-ings, GPC predictive probabilities were correlated with IQwithin each group.
Originally 34 ADHD boys were scanned, but 3 ADHDboys had to be excluded due to high motion and 1 ADHDboy was excluded due to extreme outlying task performance.
Participants received £50 per scanning session. Parentaland child informed consent/assent and approval from thelocal Ethical Committee were obtained.
Stop Task
Participants practiced the 9-min mixed-trial, event-related tracking fMRI Stop task, which measures the abil-ity to suppress an already triggered motor response[Cubillo et al., 2013; Rubia et al., 2003, 2005, 2007b, 2008,2010, 2013], once prior to scanning. The basic go trials arechoice reaction time trials with a mean ITI of 1.8 s, where
TABLE I. Demographic and clinical data for 30 boys with ADHD and 30 healthy control boys
Demographic/clinical measures Controls Mean (SD) ADHD Mean (SD)
Age (years, month) 14.1 (2.5) 13.9 (2)IQ 109 (12) 92 (11)Conners Parent Rating Scale 45 (4) 79 (8)SDQ Hyperactive-impulsive/inattentive behaviours 1.9 (2) 8.6 (1.5)Social Communication Questionnaire 1.0 (1) 9 (4.6)
SDQ, strength and difficulty questionnaire.
r Pattern Classification of fMRI of Response Inhibition in ADHD r
r 3085 r

participants have to respond to go arrows (80% of trials,236 trials, 1 s duration) pointing either right or left with aright or left button response with the right/left thumb. In20% of trials (60 trials), the go-signals are followed bystop-signals �250 ms later and participants have to inhibittheir motor responses. A tracking algorithm changes thetime interval between go-signal and stop-signal onsets insteps of 50 ms according to each subject’s performance onprevious trials based on the average percentage of inhibi-tion over previous stop trials, recalculated after each stoptrial, resulting in 50% successful and 50% unsuccessfulinhibition trials [Cubillo et al., 2013; Rubia et al., 2003,2005, 2007b, 2008, 2010, 2013]. The dependent task varia-bles is the Stop Signal Reaction Time (SSRT), calculated bysubtracting the mean stop-signal delay (SSD: average timebetween go- and stop-signal, at which the subject inhibited50% of stop trials) from the mean reaction time (MRT) togo trials, i.e. MRT-SSD [Logan et al., 1997]. Measures ofthe Go process of the task are the MRT to go trials andintra-subject standard deviation of MRT (SD of MRT) andpremature responses (defined as responses made 200 msbefore stimulus appearance).
fMRI Data Acquisition
Gradient-echo echoplanar MR imaging (EPI) data wereacquired on a GE Signa 3T Horizon HDx system (GeneralElectric, Milwaukee, WI) at the Centre for NeuroimagingSciences, Institute of Psychiatry, King’s College London,UK. A semi-automated quality control procedure ensuredconsistent image quality [Simmons, 1999]. The body coilwas used for RF transmission and an 8 channel headcoilfor RF reception. In each of 28 noncontiguous planes par-allel to the anterior-posterior commissure, 296 T2*-weighted MR images depicting BOLD (Blood OxygenLevel Dependent) contrast covering the whole brain wereacquired with TE 5 30 ms, TR 5 1.8 s, flip angle 5 75�, in-plane resolution 5 3 mm, slice thickness 5 5.5 mm (includ-ing slice-skip 5 0.5 mm). A high-resolution gradient echoplanar image was also acquired in the inter-commissuralplane, with TE 5 30 ms, TR 5 1.8 s, flip angle 59 0�, 43 sli-ces, slice thickness 5 3.0 mm, slice skip 5 0.3 mm, 1.875mm in-plane voxel size (matrix size 128x128), providingcomplete brain coverage.
Univariate fMRI Data Analysis
The software package XBAM was used for univariateanalysis (http://www.brainmap.co.uk) [Brammer et al.,1997]. fMRI data were first processed to minimise motionrelated artifacts [Bullmore et al., 1999]. A 3D volume con-sisting of the average intensity at each voxel over thewhole experiment was calculated and used as a template.The 3D image volume at each time point was then real-igned to this template by computing the combination ofrotations (around the x y and z axes) and translations (in x
y and z) that maximized the correlation between the imageintensities of the volume in question and the template(rigid body registration). Following realignment, data werethen smoothed using a Gaussian filter (FWHM 2.354 * in-plane fMRI voxel size mm) to improve the signal to noisecharacteristics of the images [Bullmore et al., 1999].
After preprocessing, time series analysis for each subjectwas based on a wavelet-based data resampling method forfMRI data [Bullmore et al., 1999, 2001]. At the individualsubject level, a standard general linear modelling (GLM)approach was used to obtain estimates of the responsesize (beta) to the Stop task condition (successful stop trials)against an implicit baseline (go trials). After first-levelanalysis, the individual statistical maps were normalisedinto Talairach standard space [Bullmore et al., 2001].
A group brain activation map was then produced forthe contrast successful stop–go trials and hypothesis test-ing was carried out at the cluster level. The detection ofactivated voxels is extended from voxel to cluster levelusing a two-pass method [Bullmore et al., 1999]. We firstused a voxel-level threshold of p< 0.05 to give maximumsensitivity and to avoid type II errors. 3D clusters werethen built by joining together adjacent significant voxels.Cluster mass (rather than a cluster extent) threshold wasused as a second-pass cluster statistic, to minimize dis-crimination against possible small, strongly respondingfoci of activation [Bullmore et al., 1999]. The cluster-levelthreshold was then computed in such a way as to ensurethat the final expected number of type I error cluster wasless than one per whole brain. For univariate between-group comparisons an ANOVA was carried out compar-ing controls with ADHD adolescents.
Pattern Recognition Analysis
GPCs were used to classify ADHD patients from con-trols on the basis of whole-brain individual beta maps/GLM coefficients for the Stop task obtained from the uni-variate analysis, i.e., for the contrast of successful Stop –Go trials. GPC models are Bayesian extensions of logisticregression that aim to learn statistical properties of a set of“training” data that enables accurate prediction of thelabel of unseen (“test”) data using the rules of probability.For theoretical background and implementation details see[Marquand et al., 2010; Rasmussen, 2006]. The mainadvantage GPCs hold over alternative methods such assupport vector machines is that they provide probabilisticclass predictions, thereby accurately quantifying the pre-dictive confidence assigned to each data point. In thiswork, the GPC modelled the probability of each scanbeing assigned to the ADHD class (equivalent to 1 minusthe probability of each scan being assigned to the controlclass).
Classifier performance was evaluated using: (i) areceiver operating characteristic (ROC) curve, which plotsthe classifier’s true positive rate (sensitivity) against its
r Hart et al. r
r 3086 r

false positive rate (1-specificity) as the decision thresholdis varied, (ii) the area under the ROC curve (AUC), whichsummarises classifier performance across all decisionthresholds, and (iii) classification accuracy, whichdescribes the proportion of correct predictions based at aparticular decision threshold. The GPC classifier wastrained with leave-one-out cross-validation using the PRO-BID software package (http://www.brainmap.co.uk/PRO-BID). For each cross-validation iteration, the data werepartitioned into training and test sets, excluding a differentparticipant from each group each time. This process wasrepeated leaving each participant out once, allowing thesensitivity and specificity to be computed respectively asthe number of ADHD and control examples correctly clas-sified over all trials. Statistical significance of the classifierwas determined by permutation testing, as described pre-viously [Marquand et al., 2010; Rasmussen, 2006]. Briefly,permutation testing was performed by repeatedly retrain-ing the classifier after permuting the class labels (1000 per-mutations). A P-value was computed by counting thenumber of permutations for which the permuted accuracywas equal or greater than the true (nonpermuted) accu-racy, then dividing by 1000. The classifier was trained on aset of whole brain images with only nonbrain tissuemasked out. At the given image resolution, this resulted in21,658 features.
To examine the discriminative value of different brainregions an unthresholded GPC weight map which showsthe relative contribution of each voxel to the classifier deci-sion was generated. In addition, two-tailed Pearson corre-lation analyses were carried out between GPC predictiveprobability and ADHD symptom severity using the CPRSADHD T-scores and SDQ hyperactive-impulsive/inatten-tion scores.
RESULTS
Task Performance
The probability of inhibition (PI) did not differ betweengroups showing that the tracking algorithm worked asexpected (t 5 0.8; df 5 58; P 5 0.4). A multivariate ANOVAbetween controls and ADHD patients showed a significantgroup effect (F (df 5 6, 53) 5 3, P< 0.01), due to significantlyincreased intra-subject variance to go trials (P< 0.02), andpremature responses to go trials (defined as responsesmade 200 ms before stimulus onset) (P< 0.05) in ADHDrelative to control boys. However, groups did not differ inthe inhibitory measure of the task, the SSRT (Table II).
Brain Activation
Motion
MANOVAs showed no significant group effects in thethree dimensional extent of maximum rotation and trans-lation movement parameters for the x, y, and z axes
(F(3,56)52.6; P 5 n.s.) or in the three-dimensional Euclid-ean space (F (1,59) 5 0.02, P 5 n.s.).
Gaussian process analysis
The ROC curve showed that GPC discriminatedbetween ADHD and control subjects above chance acrossall decision thresholds (Fig. 1A). Accordingly, the AUC forthis classifier was 0.81, well above the 0.50 level thatwould be predicted by chance. At the default decisionthreshold (i.e., defined by thresholding the probabilisticpredictions at 0.5, where a value> 0.5 was deemed to bean ADHD patient), diagnostic classification of patientsreached a sensitivity of 90% and specificity of 63%, leadingto a diagnostic accuracy of 77% (P< 0.001) (Fig. 1B). Thepositive predictive value (PPV) was 71.05% and the nega-tive predictive value (NPP) was 86.36%. Notably, only 3ADHD patients were misclassified as healthy controls. Theprobabilistic predictions derived from the classifier areshown in Figure 1B along with the decision threshold.
The discriminating global activation pattern was mappedfor the Stop task unthresholded (Fig. 2A). Although thediscriminating activation pattern is multivariate and there-fore encompasses the whole brain, the regions with thehighest weight vector coefficients contributing to the delin-eation between ADHD and healthy boys corresponded to adistributed network of brain regions involved in responseinhibition including VLPFC, dorsolateral prefrontal cortex(DLPFC), basal ganglia, thalamus, cingulate, cerebellumand parietal, temporal, and occipital cortices. This discrimi-nating pattern included clusters with magnitude (positive)weights predictive of healthy controls in bilateral VLPFC,DLPFC, and rostromedial frontal cortex, as well as ACC,SMA, and premotor cortices, the basal ganglia (caudate,putamen, and globus pallidus), thalamus, inferior parietallobes, predominantly right superior temporal areas, poste-rior cingulate cortex (PCC) and precuneus, parahippocam-pal gyri, right hippocampus, superior lateral cerebellarregions and cerebellar vermis and some medial and lateraloccipital areas. The discriminating patterns with high mag-nitude (negative) weights predictive of ADHD patientsincluded predominantly ventromedial frontal cortex and
TABLE II. Performance data for 30 boys with ADHD
and 30 healthy control boys
Performance variable Controls mean (SD) ADHD mean (SD)
PI (%) 50.7 (2.8) 50.1 (3.4)SSRT (ms) 168.0 (102.4) 131.2 (93.3)SSD (ms) 427.4 (139.1) 472.2 (81.0)MRT go trials (ms) 586.8 (114.6) 587.5 (96.6)SD go trials (ms) 161.6 (50.6) 189.3 (36.0)Premature responses (%) 1.2 (1.7) 3.2 (5.2)
PI, probability of inhibition; SSRT, stop signal reaction time; SSD,average stop signal delay, i.e. time between go and stop signal;MRT, mean reaction time; SD, intra-subject standard deviation.
r Pattern Classification of fMRI of Response Inhibition in ADHD r
r 3087 r

Figure 2.
A: Unthresholded GPC weights overlaid on an anatomical tem-
plate. The color code shows the relative weight of each voxel for
the decision boundary (red/yellow scales: higher weights for
ADHD boys and blue scales: higher weights for healthy control
boys). B: The univariate ANOVA group comparison map at
P< 0.05 for voxel and P< 0.01 for clusters, showing brain areas
that are decreased in activation in ADHD relative to healthy con-
trol boys in blue and brain areas that are increased in activation in
ADHD relative to healthy control boys in red/yellow. [Color fig-
ure can be viewed in the online issue, which is available at
wileyonlinelibrary.com.]
Figure 1.
A: Receiver operating characteristic (ROC) curve. Each point on
the ROC curve describes the performance of the classifier at a
particular decision threshold. Points on the lower left-hand side
of the ROC graph are “conservative,” requiring strong evidence
for a positive classification and therefore have low true and false
positive rates (TPR/FPR). Points on the upper right-hand side of
the graph are “liberal,” making positive classifications with weak
evidence and therefore have a high TPR but also a high FPR. A
classifier is more accurate than another if it is closer to the
point (1,0), which reflects perfect classification. Chance level is
indicated by the dotted diagonal line. B: Classification accuracies
for GPC predictions for classifying individuals into either the
ADHD or the control group. The x-axis describes the probabil-
ity with which each subject is predicted to be an ADHD patient
(equal to 1- the probability of being a control). The dotted line
indicates the decision threshold.
r Hart et al. r
r 3088 r
ACC, with small areas in DLPFC, left precentral gyrus,anterior and posterior insula, thalamus, predominantly leftsuperior temporal areas, in mid-cingulate, precuneus, bilat-eral amygdala, hippocampus, inferior caudate tail, occipitalareas, and more inferior cerebellar regions than the onespredictive of controls.
Pearson correlation analyses between GPC predictiveprobabilities and ADHD symptom severity across all sub-jects were significant for both CPRS-R ADHD t-scores(r 5 0.4; P< 0.001) and SDQ hyperactivity scores (r 5 0.4;P< 0.005).
To test whether IQ impacted upon the GPC predictiveprobabilities, we correlated betwen the two measureswithin each group and across all participants. We foundno significant correlations with IQ within each group.However, there was a significant negative correlationbetween GPC predictive values and IQ across all partici-pants (r5 20.3; P< 0.014). Given that a predictive valueof> 0.5 was deemed to be classifying ADHD patients,while a value of< 0.5 was deemed to classify controls (seeFig. 1B), the findings suggest that the higher the predictivevalue for ADHD, the lower the IQ which is in line withthe finding of lower IQ values in ADHD relative to con-trols. There was no correlation across all participantsbetween GPC predictive values and the extent of maxi-mum rotation and translation movement parameters for x,y, and z axes in the three-dimensional Euclidian space.
Given that the brain function patterns that classifiedADHD patients were in earlier developing regions, wetested whether the GPC classifier was correlated with ageacross all subjects. In fact there was a trend for a signifi-cant negative correlation with age (r 5 20.25; P< 0.057).
For comparative purposes, to test whether the imaging-based GPC classification was comparable to a classificationbased on the clinical behavioral scores, we also conducted adiscriminant analysis from group sizes using leave-one-out
classification and applying cross-validation to test for sensi-tivity and specificity of the clinical behavioral scores (i.e. theCPRS and the SDQ for hyperactive/impulsive and inatten-tive behaviors). The sensitivity (classifying patients) andspecificity (classifying controls) were relatively high for bothmeasures: for the CPRS, the sensitivity was 96.3%, the speci-ficity was 100%, and the overall accuracy was 98%; for theSDQ, the sensitivity was 93.3%, the specificity was 100%and the overall accuracy was 96.7%. However, given thatgroups were selected based on these clinical questionnaires,higher accuracy was to be expected than from the imaging-based GPC measures.
Univariate analysis results
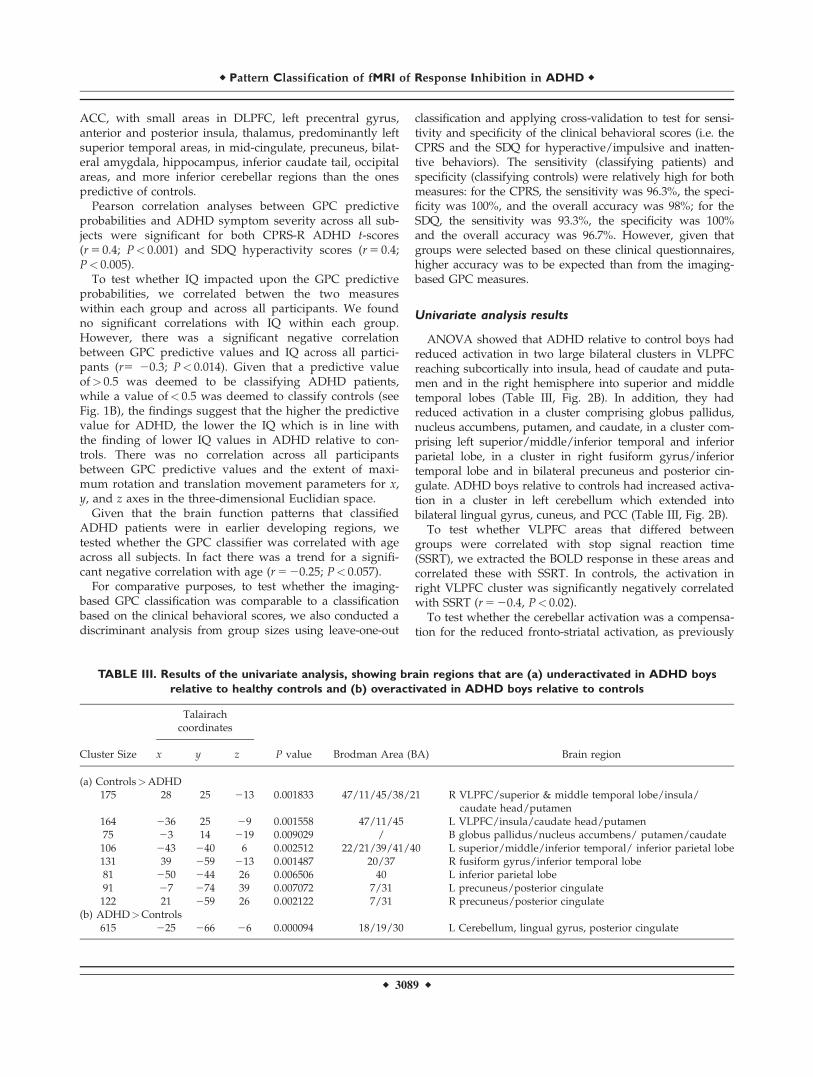
ANOVA showed that ADHD relative to control boys hadreduced activation in two large bilateral clusters in VLPFCreaching subcortically into insula, head of caudate and puta-men and in the right hemisphere into superior and middletemporal lobes (Table III, Fig. 2B). In addition, they hadreduced activation in a cluster comprising globus pallidus,nucleus accumbens, putamen, and caudate, in a cluster com-prising left superior/middle/inferior temporal and inferiorparietal lobe, in a cluster in right fusiform gyrus/inferiortemporal lobe and in bilateral precuneus and posterior cin-gulate. ADHD boys relative to controls had increased activa-tion in a cluster in left cerebellum which extended intobilateral lingual gyrus, cuneus, and PCC (Table III, Fig. 2B).
To test whether VLPFC areas that differed betweengroups were correlated with stop signal reaction time(SSRT), we extracted the BOLD response in these areas andcorrelated these with SSRT. In controls, the activation inright VLPFC cluster was significantly negatively correlatedwith SSRT (r 5 20.4, P< 0.02).
To test whether the cerebellar activation was a compensa-tion for the reduced fronto-striatal activation, as previously
TABLE III. Results of the univariate analysis, showing brain regions that are (a) underactivated in ADHD boys
relative to healthy controls and (b) overactivated in ADHD boys relative to controls
Cluster Size
Talairachcoordinates
P value Brodman Area (BA) Brain regionx y z
(a) Controls>ADHD175 28 25 213 0.001833 47/11/45/38/21 R VLPFC/superior & middle temporal lobe/insula/
caudate head/putamen164 236 25 29 0.001558 47/11/45 L VLPFC/insula/caudate head/putamen75 23 14 219 0.009029 / B globus pallidus/nucleus accumbens/ putamen/caudate
106 243 240 6 0.002512 22/21/39/41/40 L superior/middle/inferior temporal/ inferior parietal lobe131 39 259 213 0.001487 20/37 R fusiform gyrus/inferior temporal lobe81 250 244 26 0.006506 40 L inferior parietal lobe91 27 274 39 0.007072 7/31 L precuneus/posterior cingulate
122 21 259 26 0.002122 7/31 R precuneus/posterior cingulate(b) ADHD>Controls
615 225 266 26 0.000094 18/19/30 L Cerebellum, lingual gyrus, posterior cingulate
r Pattern Classification of fMRI of Response Inhibition in ADHD r
r 3089 r

observed during attention tasks [Christakou et al., 2013;Cubillo et al., 2012; Rubia et al., 2009], we tested for correla-tions within ADHD patients between this cluster and leftand right VLPFC and the basal ganglia clusters. The(increased) cerebellar activation cluster in fact correlatednegatively with the (decreased) activation cluster in thebasal ganglia (r 5 20.4, P< 0.03).
To test whether IQ had an impact on the group differ-ence findings, statistical BOLD response in each clusterthat differed between groups was extracted for each sub-ject and correlated with IQ in each group. No correlationswith IQ were observed.
DISCUSSION
We demonstrate that it is possible to classify individualADHD patients based on their functional neuroanatomypattern of motor response inhibition, at an accuracy of77%, with 90% sensitivity to correctly identify ADHD boysand 63% specificity to classify controls. Furthermore, thecomponent regions of the discriminative pattern most pre-dictive of controls were in later developing typical inhibi-tion areas of lateral VLPFC and DLPFC, SMA, ACC,striatal, temporo-parietal and superior cerebellar regions,whilst regions most predictive of ADHD were in earlierdeveloping mostly ventromedial fronto-limbic areas suchas ventromedial frontal cortex, ACC, insula, amygdala,hippocampus, and inferior cerebellum. In addition, theGPC predictive probabilities for ADHD patients were cor-related with ADHD severity scores, reinforcing their diag-nostic utility. The univariate group difference analysisshowed that ADHD patients relative to controls hadreduced activation in bilateral VLPFC, caudate andtemporo-parietal regions, which mostly overlapped withthe areas that were predictive of classifying controls, sug-gesting that these areas that classify controls are dysfunc-tional areas in ADHD. The overall classification accuracyfindings of 77% are promising and, if replicated, suggestthat it may be possible in the future to use machine learn-ing based pattern recognition analyses to aid in the diag-nostic classification of ADHD with a more objective andreliable measure such as a short task-based fMRI scan.
The classification accuracy of 77% observed in this studyis larger than that obtained in other machine learningstudies of resting state functional and anatomical data inADHD [Cheng et al., 2012; Dai et al., 2012, Colby et al.,2012; Eloyan et al., 2012]. They demonstrate for the firsttime that individuals with ADHD can be differentiatedfrom controls on the basis of their discriminative task-based neurofunctional activation patterns during inhibi-tory performance. As GPC is a multivariate technique andconsiders inter-regional correlations, discriminative brainnetworks should be interpreted cautiously as a spatiallydistributed pattern rather than permitting inference on theconstituent regions. GPC identified a distributed networkpredictive of controls in later developing lateral and
medial fronto-striatal and parieto-temporal regions thatare crucial for motor response inhibition [Aron and Pol-drack, 2006; Cai et al., 2012; Chambers et al., 2006, 2009;Juan and Muggleton, 2012; Rubia et al., 2003, 2007b, 2013].Structurally [Sowell et al., 1999, 2004] and functionallyduring inhibition tasks (Adleman et al., 2002; Bunge et al.,2002; Rubia et al., 2000; Rubia et al., 2007b; Rubia et al.,2006, Rubia et al., 2013) [for review see (Rubia, 2013)],these lateral prefrontal, striatal and parietal brain regionsdevelop later than the ventromedial prefrontal, limbic (i.e.,hippocampus, amygdala) and paralimbic areas (insula)that were predictive of ADHD patients. Our finding ofhigh magnitude weights predictive of controls in laterdeveloping lateral fronto-striato-parietal regions and forADHD in earlier developing ventromedial fronto-limbicregions hence suggest that the ADHD discrimination net-works are reflective of more immature activation patterns,while the control discrimination patterns are reflective of amore mature activation pattern for Stop task performance.This was also confirmed in the trend-wise correlationbetween age and the GPC probabilistic classification pat-tern. This would be in line with the notion that ADHD isa disorder of developmental delay, as demonstrated inunivariate structural longitudinal analyses that showed a2–5 year delay in ADHD patients in the maturation ofcortical thickness and surface morphology, most promi-nently in DLPFC and VLPFC, superior temporal and infe-rior parietal brain regions [Rubia, 2007; Shaw et al., 2007,2012].
The significant correlation between the GPC predictiveprobabilities and ADHD symptom severity suggests thatthe most severely impaired ADHD patients are more con-fidently predicted by their immature fronto-limbic activa-tion patterns than the less severely impaired ones, whichfurther reinforces the potential diagnostic value of GPCpattern recognition analyses combined with fMRI forADHD.
The univariate ANOVA showed that ADHD boys had asignificant reduction in the activation of left and rightVLPFC, reaching into caudate and superior temporallobes, as well as in parieto-temporal regions, replicatingprevious evidence for consistent fronto-striatal as well astemporo-parietal underactivations in ADHD patients dur-ing Stop task performance [Cubillo et al., 2010, 2013; Pas-sarotti et al., 2010; Pliszka et al., 2006; Rubia et al., 1999,2005, 2011b, 2008, 2010], as also confirmed in a recentmeta-analysis [Hart et al., 2013]. While our findings repli-cate previous work, this study is, to our knowledge, thelargest fMRI ADHD dataset on the Stop task, with previ-ous fMRI studies including less than 20 ADHD patientsand controls [Cubillo et al., 2010; 2013; Passarotti et al.,2010; Pliszka et al., 2006; Rubia et al., 1999, 2005, 2011b,2010, 2008]. Interestingly, the key region for inhibitory con-trol, the right VLPFC [Aron et al., 2003; Aron and Pol-drack, 2006; Chambers et al., 2006; Rubia et al., 2001, 2003,2007b, 2013], that was reduced in ADHD patients relative
r Hart et al. r
r 3090 r
to controls, was also correlated with the main inhibitory
task variable, the SSRT, in controls, even though patients
were not impaired in this measure. Patients, however, had
a more premature and variable response to go trials. The
lack of inhibitory performance deficits despite brain func-
tion deficits replicates previous fMRI findings in patients
with ADHD [Cubillo et al., 2010, 2013; Pliszka et al., 2006;
Rubia et al., 1999, 2005, 2011b, 2008] and is likely related
to the fact that fMRI stop tasks generally have less behav-
ioral sensitivity than neuropsychological task versions due
to the target separation and hence larger predictability of
stop trials. Also, neuropsychological studies are typically
conducted in children, while we studied an older age
group of adolescescents who may have grown out of their
performance deficits. It is also possible that the enhanced
inferior cerebellar and visual cortex activation in ADHD
patients relative to controls may have compensated for the
reduced fronto-striatal-activations, sparing inhibitory per-
formance deficits. This hypothesis was supported by the
negative correlation between cerebellar and striatal activa-
tion in ADHD.Multivariate pattern recognition analyses reveal discrimi-
nating activation patterns without necessarily defining thedirection of activation. However, the coanalysis of univari-ate analyses in this study showed that several of the brainareas that were reduced in activation in ADHD relative tocontrol boys in the univariate analyses, in particular leftand right VLPFC, the basal ganglia and inferior parietallobes, overlapped with regions that showed higher weightsfor discriminating the control group from the ADHD groupin the multivariate analysis (see Fig. 2A,B), suggesting thatthey reflect brain areas that are dysfunctional (i.e., underac-tivated) in ADHD children.
The fMRI stop task-based classifier was significantly bet-ter than inhibitory performance to discriminate betweengroups, given that performance did not differ betweenpatients and controls. However, while the task-based fMRIclassification accuracy of 77% was relatively higher thanprevious attempts to use MVPRA combined with restingstate fMRI data, which achieved only a maximum classifi-cation accuracy of 61% for the best classification [Eloyanet al., 2012], and was comparable to our accuracy of 79%using GPC analyses combined with brain structure data[Lim et al., 2013], the classification accuracy is neverthelessnot high enough to be used in isolation, even if replicated.The discriminant analysis based on clinical measures wassubstantially higher, in particular for specificity, whichwas 100% relative to only 77% for the fMRI based GPCclassification, while the sensitivity measures for the ADHDclassification were relatively comparable, with 93.3% and96.3% for the clinical measures, and 90% for the fMRI-based GPC analysis. However, given that disorders wereselected based on these clinical measures, the higher classi-fication accuracy based on these measures was to beexpected as clinical diagnostic measures were used as
labels for the fMRI-based classifier. Studies that tested forthe sensitivity of classification of ADHD children withclinical measures based on Diagnostic and Statistical Man-ual (DSM)-IV criteria have shown that this is between 70–90% [Weiler et al., 2000], thus misdiagnoses are around10–30%. Task-based fMRI classification, if replicated acrosscenters and scanners, may therefore have its use as anadjunct to clinical diagnostic measures, in particular fordifficult to diagnose cases. However, for its potential useas aid for clinical diagnosis, future studies will have toshow disorder-specificity of fMRI based individual classifi-cations relative to other childhood disorders, as differentialdiagnosis is typically more challenging than differentiationfrom controls. For structural MRI classifications we haveshown relatively high disorder-specific accuracy relative tochildren with autism of over 80% [Lim et al., 2013].
A strength of the study is the relatively large sample, inparticular for the univariate analysis. A limitation is thepotential confound of IQ differences between cases andcontrols. However, GPC probabilistic predictors did notcorrelate with IQ in either group and hence are unlikely tohave affected the findings. The univariate analysis resultsdid not correlate with IQ in either group. Furthermore,Stop task performance has been shown to be independentof IQ [Friedman et al., 2006]. IQ correlated with GPC pre-dictive values across both groups, which is, however to beexpected, given that both groups differed in IQ and in pre-dictive GPC values (the latter, by definition). Another limi-tation is that we only included males and the combinedhyperactive-impulsive/inattentive subtype of ADHDwhich limits the generalizability of the diagnostic classifi-cation patterns. Also, future diagnostic utility of patternclassification analyses will rely on its ability to classifyADHD subgroups as to determine disorder-specificity ofclassification patterns.
In summary, to our knowledge this is the first study touse multivariate machine-learning techniques to predictADHD diagnosis based on task-based fMRI imaging datashowing a classification accuracy of 77%. Whilst classifica-tion algorithms are not meant as a substitute for clinicalassessment and diagnosis, they may be a useful objective,automated, and reliable complementary diagnostic toolthat could reduce variability in clinical practice and, ulti-mately, may help to improve diagnostic accuracy or torevise clinical diagnosis through biomarker classificationof uncertain diagnostic cases.
ACKNOWLEDGMENT
Lilly Pharmaceuticals had no input into the design, analy-sis, data interpretation or write-up.
REFERENCES
Adleman NE, Menon V, Blasey CM, White CD, Warsofsky IS,Glover GH, Reiss AL (2002): A developmental fMRI study ofthe stroop color-word task. Neuroimage 16:61–75.
r Pattern Classification of fMRI of Response Inhibition in ADHD r
r 3091 r

Alderson R, Rapport M, Kofler M (2007): Attention-deficit/hyper-activity disorder and behavioral inhibition: A meta-analyticreview of the stop-signal paradigm. J Abnormal Child Psychol35:745–758.
American Psychiatric Association (2000): Diagnostic and StatisticalManual of Mental Disorders.American Psychiatric Association.Association. AP, editor. Washington, DC.
Aron AR, Fletcher PC, Bullmore ET, Sahakian BJ, Robbins TW(2003): Stop-signal inhibition disrupted by damage to rightinferior frontal gyrus in humans. Nat Neurosci 6:1329–1329.
Aron AR, Poldrack RA (2006): Cortical and subcortical contribu-tions to stop signal response inhibition: Role of the subthala-mic nucleus. J Neurosci 26:2424–2433.
Brammer MJ, Bullmore ET, Simmons A, Williams SC, Grasby PM,Howard RJ, Woodruff PW, Rabe-Hesketh S (1997): Genericbrain activation mapping in functional magnetic resonanceimaging: A nonparametric approach. Magn Resonance Imaging15:763–770.
Bullmore ET, Brammer MJ, Rabe-Hesketh S, Curtis VA, MorrisRG, Williams SCR, Sharma T, McGuire PK (1999): Methods fordiagnosis and treatment of stimulus-correlated motion ingeneric brain activation studies using fMRI. Hum Brain Mapp7:38–48.
Bullmore E, Long C, Suckling J, Fadili J, Calvert G, Zelaya F,Carpenter TA, Brammer M (2001): Colored noise and computa-tional inference in neurophysiological (fMRI) time series analy-sis: Resampling methods in time and wavelet domains. HumBrain Mapp 12:61–78.
Bunge SA, Dudukovic NM, Thomason ME, Vaidya CJ, GabrieliJDE (2002): Immature frontal lobe contributions to cognitivecontrol in children: Evidence from fMRI. Neuron 33:301–311.
Cai W, George JS, Verbruggen F, Chambers CD, Aron AR (2012):The role of the right presupplementary motor area in stoppingaction: Two studies with event-related transcranial magneticstimulation. J Neurophysiol 108:380–389.
Chambers CD, Bellgrove MA, Stokes MG, Henderson TR,Garavan H, Robertson IH, Morris AP, Mattingley JB (2006):Executive "brake failure" following deactivation of humanfrontal lobe. J Cogn Neurosci 18:444–455.
Chambers CD, Garavan H, Bellgrove MA (2009): Insights into theneural basis of response inhibition from cognitive and clinicalneuroscience. Neurosci Biobehav Rev 33:631–646.
Cheng W, Ji X, Zhang J, Feng J (2012): Individual classification ofADHD patients by integrating multiscale neuroimagingmarkers and advanced pattern recognition techniques. FrontSyst Neurosci 6.
Christakou A, Murphy CM, Chantiluke K, Cubillo AI, Smith AB,Giampietro V, Daly E, Ecker C, Robertson D, Murphy DG,et al. (2013): Disorder-specific functional abnormalities duringsustained attention in youth with Attention Deficit Hyperactiv-ity Disorder (ADHD) and with Autism. Mol Psychiatry 18:236–244.
Colby JB, Rudie JD, Brown JA, Douglas PK, Cohen MS, ShehzadZ (2012): Insights into multimodal imaging classification ofADHD. Front Syst Neurosci 6.
Conners CK, Sitarenios G, Parker JDA, Epstein JN (1998): Revisionand restandardization of the Conners Teacher Rating Scale(CTRS-R): Factor structure, reliability, and criterion validity.J Abnormal Child Psychol 26:279–291.
Cubillo A, Halari R, Ecker C, Giampietro V, Taylor E, Rubia K(2010): Reduced activation and inter-regional functional con-nectivity of fronto-striatal networks in adults with childhood
Attention Deficit Hyperactivity Disorder (ADHD) and persist-ing symptoms during tasks of motor inhibition and cognitiveswitching. J Psychiatr Res 44:629–639.
Cubillo A, Halari R, Smith A, Taylor E, Rubia K (2012): A reviewof fronto-striatal and fronto-cortical brain abnormalities in chil-dren and adults with Attention Deficit Hyperactivity Disorder(ADHD) and new evidence for dysfunction in adults withADHD during motivation and attention. Cortex 48:194–215.
Cubillo A, Smith A, Barrett N, Simmons A, Brammer M,Giampietro V, Rubia K: Shared and drug-specific effects of atom-oxetine and methylphenidate on inhibitory brain dysfunction inmedication-naive ADHD boys. Cerebral Cortex. DOI: http://dx.doi.org/10.1017/S0033291713000676.
Dai D, Wang J, Hua J, He H (2012): Classification of ADHD chil-dren through multimodal magnetic resonance imaging. FrontSyst Neurosci 6.
Dennis M, Francis DJ, Cirino PT, Schachar R, Barnes MA, FletcherJM (2009): Why IQ is not a covariate in cognitive studies of neu-rodevelopmental disorders. J Int Neuropsychol Soc 15:331–343.
Ecker C, Rocha-Rego V, Johnston P, Mourao-Miranda J,Marquand A, Daly EM, Brammer MJ, Murphy C, Murphy DG,Consortium MA (2010): Investigating the predictive value ofwhole-brain structural MR scans in autism: A pattern classifi-cation approach. Neuroimage 49:44–56.
Eloyan A, Muschelli J, Nebel MB, Liu H, Han F, Zhao T, BarberAD, Joel S, Pekar JJ, Mostofsky SH, et al. (2012): Automateddiagnoses of attention deficit hyperactive disorder using mag-netic resonance imaging. Front Syst Neurosci 6.
Friedman NP, Miyake A, Corley RP, Young SE, Defries JC, HewittJK (2006): Not all executive functions are related to intelli-gence. Psychol Sci 18:172–179.
Goldberg D, Murray R. 2002. Maudsley Handbook of PracticalPsychiatry. Press. OU, editor. Oxford.
Goodman R, Ford T, Simmons H, Gatward R, Meltzer H (2000):Using the strengths and difficulties questionnaire (SDQ) toscreen for child psychiatric disorders in a community sample.Br J Psychiatry 177:534–539.
Hahn T, Marquand AF, Plichta MM, Ehlis AC, Schecklmann MW,Dresler T, Jarczok TA, Eirich E, Leonhard C, Reif A, et al.(2013): A novel approach to probabilistic biomarker-based clas-sification using functional near-infrared spectroscopy. HumBrain Mapp 34:1102–1114.
Hart H, Radua J, Mataix D, Rubia K (2012): Meta-analysis of fMRIstudies of timing functions in ADHD. Neurosci Biobehav Rev36:2248–2256.
Hart H, Radua J, Nakao T, Mataix-Cols D, Rubia K (2013): Meta-analysis of fMRI studies of inhibition and attention in ADHD:exploring task-specific, stimulant medication and age effects.Archives General Psychiatry 70:185–198.
Juan C-H, Muggleton NG (2012): Brain stimulation and inhibitorycontrol. Brain Stimulation 5:63–69.
Kuntsi J, Eley TC, Taylor A, Hughes C, Asherson P, Caspi A,Moffitt TE (2004): Co-occurrence of ADHD and low IQ hasgenetic origins. Am J Med Gene Part B: Neuropsychiatric Gene124:41–47.
Lim L, Cubillo A, Smith A, Chantiluke K, Marquand A, SimmonsA, Mehta M, Rubia K (2013): Disorder-specific predictive clas-sification of adolescents with Attention Deficit HyperactivityDisorder (ADHD) relative to autism using structural magneticresonance imaging. PLOS One 8:e63660.
Logan GD, Schachar RJ, Tannock R (1997): Impulsivity and inhibi-tory control. Psychological Sci 8:60–64.
r Hart et al. r
r 3092 r

Marquand AF, Mour ~A£o-Miranda J, Brammer MJ, Cleare AJ, FuCHY (2008): Neuroanatomy of verbal working memory as adiagnostic biomarker for depression. Neuroreport 19:1507–151110.1097/WNR.0b013e328310425e.
Marquand A, Howard M, Brammer M, Chu C, Coen S, Mourao-Miranda J (2010): Quantitative prediction of subjective painintensity from whole-brain fMRI data using Gaussian proc-esses. Neuroimage 49:2178–2189.
Miller G, Chapman J (2001): Misunderstanding analysis of covari-ance. J Abnormal Psychol 110:40–48.
Nakao T, Radua C, Rubia K, Mataix-Cols D (2011): Gray mattervolume abnormalities in ADHD and the effects of stimulantmedication: Voxel-based meta-analysis. Am J Psychiatry 168:1154–1163.
Orru G, Pettersson-Yeo W, Marquand AF, Sartori G, Mechelli A(2012): Using Support Vector Machine to identify imaging bio-markers of neurological and psychiatric disease: A criticalreview. Neurosci Biobehav Rev 36:1140–1152.
Passarotti AM, Sweeney JA, Pavuluri MN (2010): Neural corre-lates of response inhibition in pediatric bipolar disorder andattention deficit hyperactivity disorder. Psychiatry Res-Neuroi-maging 181:36–43.
Pliszka SR, Glahn DC, Semrud-Clikeman M, Franklin C, Perez R,Xiong JJ (2006): Neuroimaging of inhibitory control areas inchildren with attention deficit hyperactivity disorder who weretreatment naive or in long-term treatment. Am J Psychiatry163:1052–1060.
Polanczyk G, de Lima MS, Horta BL, Biederman J, Rohde LA(2007): The worldwide prevalence of ADHD: A systematicreview and metaregression analysis. Am J Psychiatry 164:942–948.
Polderman T, Gosso M, Posthuma D, Van Beijsterveldt T, HeutinkP, Verhulst F, Boomsma D (2006): A longitudinal twin studyon IQ, executive functioning, and attention problems duringchildhood and early adolescence. Acta Neurol Belg 106:191–207.
Rasmussen C, Williams CKI. 2006. Gaussian Processes forMachine Learning. The MIT Press: Cambridge MA.
Rubia K (2007): Neuro-anatomic evidence for the maturationaldelay hypothesis of ADHD. Proc Natl Acad Sci USA 104:19663–19664.
Rubia K (2011): “Cool” inferior fronto-striatal dysfunction inAttention Deficit Hyperactivity Disorder (ADHD) versus “hot”ventromedial orbitofronto-limbic dysfunction in conduct disor-der: A review. Biol Psychiatry 69:e69–e87.
Rubia K (2013): Functional brain imaging across development. EurChild Adolescent Psychiatry 1–13. published online first: DOI10.1007/s00787-012-0291-8.
Rubia K, Overmeyer S, Taylor E, Brammer M, Williams SC,Simmons A, Bullmore ET (1999): Hypofrontality in attentiondeficit hyperactivity disorder during higher-order motor con-trol: A study with functional MRI. Am J Psychiatry 156:891–896.
Rubia K, Overmeyer S, Taylor E, Brammer M, Williams S,Simmons A, Andrew C, Bullmore E (2000): Functional frontali-sation with age: Mapping neurodevelopmental trajectorieswith fMRI. Neurosci Biobehav Rev 24:13–19.
Rubia K, Overmeyer S, Taylor E, Brammer M, Williams SCR,Simmons A, Andrew C, Giampietro V, Bullmore ET (2001):Mapping motor inhibition: Conjunctive brain activations acrossdifferent versions of go/no-go and stop tasks. NeuroImage 13:250–261.
Rubia K, Smith AB, Brammer MJ, Taylor E (2003): Right inferiorprefrontal cortex mediates response inhibition while mesialprefrontal cortex is responsible for error detection. Neuro-image 20:351–358.
Rubia K, Smith AB, Brammer MJ, Toone B, Taylor E. (2005):Abnormal brain activation during inhibition and error detec-tion in medication-naive adolescents with ADHD. Am J Psy-chiatry 162:1067–1075.
Rubia K, Smith AB, Woolley J, Nosarti C, Heyman I, Taylor E,Brammer M (2006): Progressive increase of frontostriatal brainactivation from childhood to adulthood during event-relatedtasks of cognitive control. Hum Brain Mapp 27:973–993.
Rubia K, Smith A, Brammer M, Taylor E (2007a): Performance ofchildren with Attention Deficit Hyperactivity Disorder (ADHD)on a test battery for impulsiveness. Child Neuropsychol 30:659–695.
Rubia K, Smith AB, Taylor E, Brammer M (2007b): Linear age-correlated functional development of right inferior fronto-striato-cerebellar networks during response inhibition andanterior Cingulate during error-related processes. Hum BrainMapp 28:1163–1177.
Rubia K, Halari R, Smith AB, Mohammed M, Scott S, GiampietroV, Taylor E, Brammer MJ (2008): Dissociated functional brainabnormalities of inhibition in boys with pure conduct disorderand in boys with pure attention deficit hyperactivity disorder.Am J Psychiatry 165:889–897.
Rubia K, Halari R, Cubillo A, Mohammad M, Taylor E (2009):Methylphenidate normalises activation and functional connectiv-ity deficits in attention and motivation networks in medication-na€ıve children with ADHD during a Rewarded ContinuousPerformance Task. Neuropharmacology 57:640–652.
Rubia K, Cubillo A, Smith AB, Woolley J, Heyman I, Brammer MJ(2010): Disorder-specific dysfunction in right inferior prefrontalcortex during two inhibition tasks in boys with attention-deficithyperactivity disorder compared to boys with obsessive-compulsive disorder. Hum Brain Mapp 31:287–299.
Rubia K, Halari R, Cubillo A, Smith A, Mohammad M, BrammerM, Taylor E (2011a): Methylphenidate normalises fronto-striatalunderactivation during interference inhibition in medication-naive boys. Neuropsychopharmacology 36:1575–1586.
Rubia K, Halari R, Mohammad AM, Taylor E, Brammer M(2011b): Methylphenidate normalizes frontocingulate underacti-vation during error processing in attention-deficit/hyperactivitydisorder. Biol Psychiatry 70:255–262.
Rubia K, Lim L, Ecker C, Halari R, Giampietro V, Simmons A,Brammer M, Smith A (2013): Effects of age and gender on neu-ral networks of motor response inhibition: From adolescenceto adulthood. Neuroimage, published online first: 10.1016/j.neuroimage.2013.06.078.
Rutter M, Bailey L, Lord C, editors. 2003. Social CommunicationQuestion. Los Angeles, USA: Western Psychological Services.
Shaw P, Eckstrand K, Sharp W, Blumenthal J, Lerch JP,Greenstein D, Clasen L, Evans A, Giedd J, Rapoport JL (2007):Attention-deficit/hyperactivity disorder is characterized by adelay in cortical maturation. Proc Natl Acad Sci USA 104:19649–19654.
Shaw P, Malek M, Watson B, Sharp W, Evans A, Greenstein D(2012): Development of cortical surface area and gyrification inattention-deficit/hyperactivity disorder. Biol Psychiatry 72:191–197.
Simmons A, Moore E, Williams SCR (1999): Quality control forfunctional magnetic resonance imaging using automated data
r Pattern Classification of fMRI of Response Inhibition in ADHD r
r 3093 r

analysis and Shewhart Charting. Magn Resonance Med 41:1274–1278.
Smith AB, Taylor E, Brammer M, Toone B, Rubia K (2006):Task-specific hypoactivation in prefrontal and temporoparie-tal brain regions during motor inhibition and task switchingin medication-naive children and adolescents with attentiondeficit hyperactivity disorder. Am J Psychiatry 163:1044–1051.
Sowell ER, Thompson PM, Holmes CJ, Batth R, Jernigan TL, TogaAW (1999): Localizing age-related changes in brain structurebetween childhood and adolescence using statistical paramet-ric mapping. Neuroimage 9:587–597.
Sowell ER, Thompson PM, Toga AW (2004): Mapping changes inthe human cortex throughout the span of life. Neuroscientist10:372–392.
Wechsler D (1999): Wechsler Abbreviated Scale of Intelligence.San Antonio, Texas: The Psychological Corporation.
Weiler MD, Bellinger D, Simmons E, et al. (2000): Reliability andvalidity of a DSM-IV based ADHD screener. Child Neuropsy-chol 6:3–23.
Willcutt EG, Doyle AE, Nigg JT, Faraone SV, Pennington BF(2005): Validity of the executive function theory of attention-deficit/hyperactivity disorder: A meta-analytic review. BiolPsychiatry 57:1336–1346.
r Hart et al. r
r 3094 r