Pattern Analysis of World Conflicts over the past …Pattern Analysis of World Conflicts over the...
13
Pattern Analysis of World Conflicts over the past 600 years Gianluca Martelloni 1,3 , Francesca Di Pa 1 , Ugo Bardi 2* , 1 Interuniversity Consorum For Science and Technology of Materials (INSTM) 2 Diparmento di Chimica, Università di Firenze Via della Lastruccia 3, 50019 Firenze, Italy 3 INAF (Naonal Instute for AstroPhysics) *corresponding author: ugo.bardi@unifi.it Keywords: wars, paern analysis, conflict stascs, self organized complexity Abstract We analyze the database prepared by Brecke (Brecke 2011) for violent conflict, covering some 600 years of human history. Aſter normalizing the data for the global human populaon, we find that the number of casuales tends to follow a power law over the whole data series for the period considered, with no evidence of periodicity. We also observe that the number of conflicts, again normalized for the human populaon, show a decreasing trend as a funcon of me. Our result agree with previous analyses on this subject and tend to support the idea that war is a stascal phenomenon related to the network structure of the human society. Introducon The causes of human conflicts remain largely an unresolved subject, especially for the large conflicts that we call “wars.” Historians oſten tend to see wars arising from specific decisions of human actors, in turn the result of specific economic or polical strains ping naons or social groups against each other. But another possible interpretaon is that wars are related to the structure of the human society as a whole. Perhaps the first to argue in favor of war as a collecve phenomenon was Leon Tolstoy in his War and Peace novel (1869) (Emerson 2009). Tolstoy intuion couldn’t be verified in quantave terms unl databases about historical wars became available during the 20 th century. Among the earliest sets of data, we can cite that of Sorokin (Sorokin 1937) and Quincey Wright (Wright 1942). The laer study, published in 1942, listed a total of 284 wars and some 3000 bales from 1500 A.D. to about 1940. The milestone in this field was the series of studies on “deadly quarrels” published by Lewis Fry Richardson (Richardson L. F. 1960), later discussed in (Wilkinson 1980), (Hess 1995), (Hayes 2002), and (Gallo 2015). Richardson’s data cover 315 conflicts, each one involving more than 300 deaths from 1820 to 1949. Richardson himself performed an extensive paern analysis of the set finding support for the idea that war is a stascal phenomenon embedded throughout human history for the period considered. In parcular, Richardson found that, as expected, large wars are less frequent than small ones and that the probability of a war of a certain dimension can be described using a Poisson distribuon. Later on, other authors performed similar studies: for instance, Sarkees et al. (Sarkees, Wayman, and Singer 2003) examined a
Transcript of Pattern Analysis of World Conflicts over the past …Pattern Analysis of World Conflicts over the...

Pattern Analysis of World Conflictsover the past 600 years
Gianluca Martelloni1,3, Francesca Di Patti1, Ugo Bardi2*, 1Interuniversity Consortium For Science and Technology of Materials (INSTM)2Dipartimento di Chimica, Università di Firenze
Via della Lastruccia 3, 50019 Firenze, Italy3INAF (National Institute for AstroPhysics)
*corresponding author: [email protected]
Keywords: wars, pattern analysis, conflict statistics, self organized complexity
Abstract
We analyze the database prepared by Brecke (Brecke 2011) for violent conflict, covering some 600 years ofhuman history. After normalizing the data for the global human population, we find that the number ofcasualties tends to follow a power law over the whole data series for the period considered, with noevidence of periodicity. We also observe that the number of conflicts, again normalized for the humanpopulation, show a decreasing trend as a function of time. Our result agree with previous analyses on thissubject and tend to support the idea that war is a statistical phenomenon related to the network structureof the human society.
Introduction
The causes of human conflicts remain largely an unresolved subject, especially for the large conflicts thatwe call “wars.” Historians often tend to see wars arising from specific decisions of human actors, in turn theresult of specific economic or political strains pitting nations or social groups against each other. Butanother possible interpretation is that wars are related to the structure of the human society as a whole.Perhaps the first to argue in favor of war as a collective phenomenon was Leon Tolstoy in his War andPeace novel (1869) (Emerson 2009). Tolstoy intuition couldn’t be verified in quantitative terms untildatabases about historical wars became available during the 20th century. Among the earliest sets of data,we can cite that of Sorokin (Sorokin 1937) and Quincey Wright (Wright 1942). The latter study, published in1942, listed a total of 284 wars and some 3000 battles from 1500 A.D. to about 1940.
The milestone in this field was the series of studies on “deadly quarrels” published by Lewis Fry Richardson(Richardson L. F. 1960), later discussed in (Wilkinson 1980), (Hess 1995), (Hayes 2002), and (Gallo 2015).Richardson’s data cover 315 conflicts, each one involving more than 300 deaths from 1820 to 1949.Richardson himself performed an extensive pattern analysis of the set finding support for the idea that waris a statistical phenomenon embedded throughout human history for the period considered. In particular,Richardson found that, as expected, large wars are less frequent than small ones and that the probability ofa war of a certain dimension can be described using a Poisson distribution. Later on, other authorsperformed similar studies: for instance, Sarkees et al. (Sarkees, Wayman, and Singer 2003) examined a

similar time interval, but they didn’t perform a statistical pattern analysis. Alvarez-Ramirez et al. (Alvarez-Ramirez et al. 2007) studied the patterns of conflicts during the Iraq war from 2003 onward, finding clearevidence of power laws in the distribution of the military casualties. Gonzales studied a data set of modernwars (González-Val 2016) while Friedman used a reverse approach, that of using power laws to reduce theuncertainty in the historical data (Friedman 2015). Other analyses evidenced the presence of power laws ina variety of datasets involving human conflict, for instance (Bohorquez et al. 2009) and (Johnson et al.2013). For a review of these studies, see Ward et al., 2013 (Ward et al. 2013) and, more recently. (Clauset2018), and (Clauset and Gleditsch 2018), confirming previous analyses and discussing the likelihood of anew major conflicts.
Our contribution in this paper is the statistical analysis of the conflict catalog provided by Peter Brecke(Brecke 2011). It is among the largest datasets existing today, reporting data for war fatalities from 1400 to2000 AD, even though Cirillo and Taleb examined an even longer database, starting from the 1 st century AS,although including only relatively large conflicts (Cirillo and Taleb 2015). We examine the trends of theBrecke database, as well as the autocorrelation and the Fourier analysis applied to the time series offatalities. We consider also the same data normalized to the world population. In the latter case the fatalitydistribution clearly follows a power law. War seems to follow the same statistical laws as other catastrophicphenomena, such as hurricanes, earthquakes, tsunamis, floods and landslides, whose distribution followsapproximate power law (P Bak 1996).
Materials and method
Starting from Brecke’s database (Brecke 2011), we build the time series that will be statistically analyzed. Asa first approach, we examined the number of wars over time. The plot of Brecke’s data is shown in figure 1.
Figure 1: number of war over time according to Brecke database.

At a first qualitative examination, the data show an increasing trend, especially noticeable as we get closerto our time, a relatively peaceful period during the 18 th century is noticeable. As a further step, wenormalized the data for the world population, using the data provided by the History Database of theGlobal Environment – http://themasites.pbl.nl/tridion/en/themasites/hyde/). In this case (fig. 2) the trendis reversed with the number of wars per unit population clearly decreasing, although the relatively peaceful18th century remains noticeable.
.
Figure 2: number of war normalized for the world population.
In itself, the number of wars is a poor indication of the trends of violent conflicts, hence we proceeded withthe analysis of the number of fatalities. Brecke’s database provides only the fatalities per war, so weexamined the data on the basis of the assumption that, if the duration of a war is greater than one year, thefatalities of that war are summed and collocated in the end war year. The results are reported in figure 3 interms of total fatalities per year. In figure 4, we show the total fatalities for each war in chronological order.In figures 5-6 we show the same data normalized with respect to to the world population. In these figures,note how there exist years without wars and fatalities (138 out of a total of 601 years).

Figure 3: Total war fatalities per year from Brecke’s Database.
Figure 4: Total war fatalities per war the numeration is referred to each single war in chronological order.

Figure 5: Total war fatalities over time per year normalized to the world population.
Figure 6: Total war fatalities per war normalized with world population (the numeration is referred to single war in chronologicalorder).

We have therefore four data series: fatalities per year and per conflict, normalized or not for the world’spopulation increase. We analyzed the data in terms of a power law (equation 1) or of a lognormaldistribution (equation 2) simply obtained considering the logarithm of data whose correspondingdistribution is Gaussian. For the analytical proof of the latter statement, see Martelloni and Bagnoli (2014)(Martelloni and Bagnoli 2014).
y=a∙ xb (1)
y=a1∗exp (−((x−b1)/c1)2) (2)
The parameters a, b, a1, b1, and c1 of equations 1-2 can be estimated by means of a fitting procedure. Thestatistics was completed calculating the autocorrelation function and using the classical Fourier analysis bymeans of the Power Spectrum on the basis of the Fast Fourier Transform (FFT) algorithm. Theautocorrelation for lag i (where i = 0, 1, …, I) between the data yt and yt+i is expressed by equation 3
r i=c ic0
, (3)
while c0 is the sample variance of considered time series and ci is represented by equation 4,
c i=1T∑t=1
T−i
( y t− y) ( y t+i− y ) (4)
where T is the length of series. If q is the lag beyond which the theoretical autocorrelation function iseffectively zero, the estimated standard error of the autocorrelation at lag i > q (i.e., q=i - 1) is
SE (r i)=√ 1T (1+2∑k= 1
q
r k2 ) . (5)
If the time series is completely random the series term of equation 5 tend to zero and therefore thestandard error SE approaches to square root of 1/T. In the result section the autocorrelations arecalculated up to the length of the time series, i.e., to T-1.
Results
If we consider the uncorrected data of the yearly war fatalities (x) from 1400 to 2000 AD and thecorresponding probability P(X≥x), plotted every 1000 fatalities, we obtain the empirical distribution offigure 7. The best fit of the distribution is obtained by means of a lognormal function. This result does notexclude a power law distribution, as argued by (González-Val 2016), (Friedman 2015). In particular thecentral part of the distribution and the tail at the right (the largest conflicts) can be fitted by a power law. Intable 1 we report the results of fitting according to figure 7.
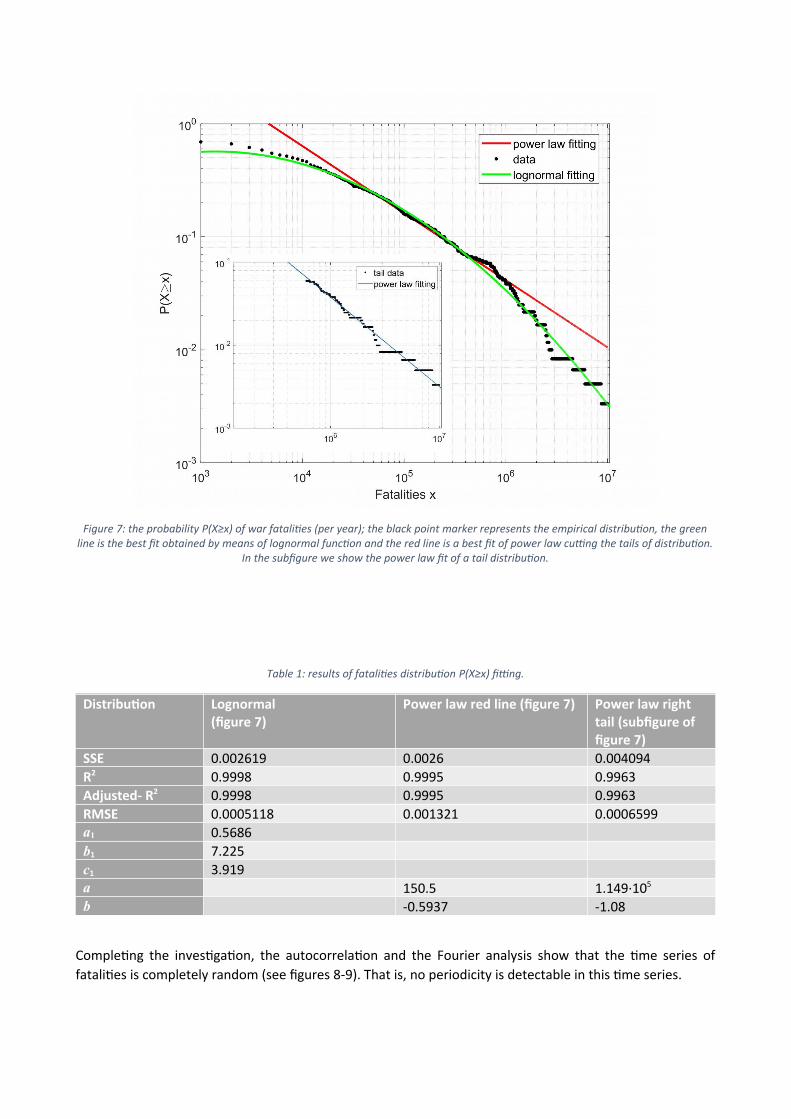
Figure 7: the probability P(X≥x) of war fatalities (per year); the black point marker represents the empirical distribution, the greenline is the best fit obtained by means of lognormal function and the red line is a best fit of power law cutting the tails of distribution.
In the subfigure we show the power law fit of a tail distribution.
Table 1: results of fatalities distribution P(X≥x) fitting.
Distribution Lognormal (figure 7)
Power law red line (figure 7) Power law right tail (subfigure of figure 7)
SSE 0.002619 0.0026 0.004094R2 0.9998 0.9995 0.9963Adjusted- R2 0.9998 0.9995 0.9963RMSE 0.0005118 0.001321 0.0006599a1 0.5686b1 7.225c1 3.919a 150.5 1.149∙105
b -0.5937 -1.08
Completing the investigation, the autocorrelation and the Fourier analysis show that the time series offatalities is completely random (see figures 8-9). That is, no periodicity is detectable in this time series.

Figure 8: the fatalities autocorrelation; the two blue lines represent the standard error of the autocorrelation (the value is 0.0408equal to the root square of 1/T that indicates the series is completely random).
Figure 9: analysis of time series of war fatalities by means of Power Spectrum (by means of FFT).
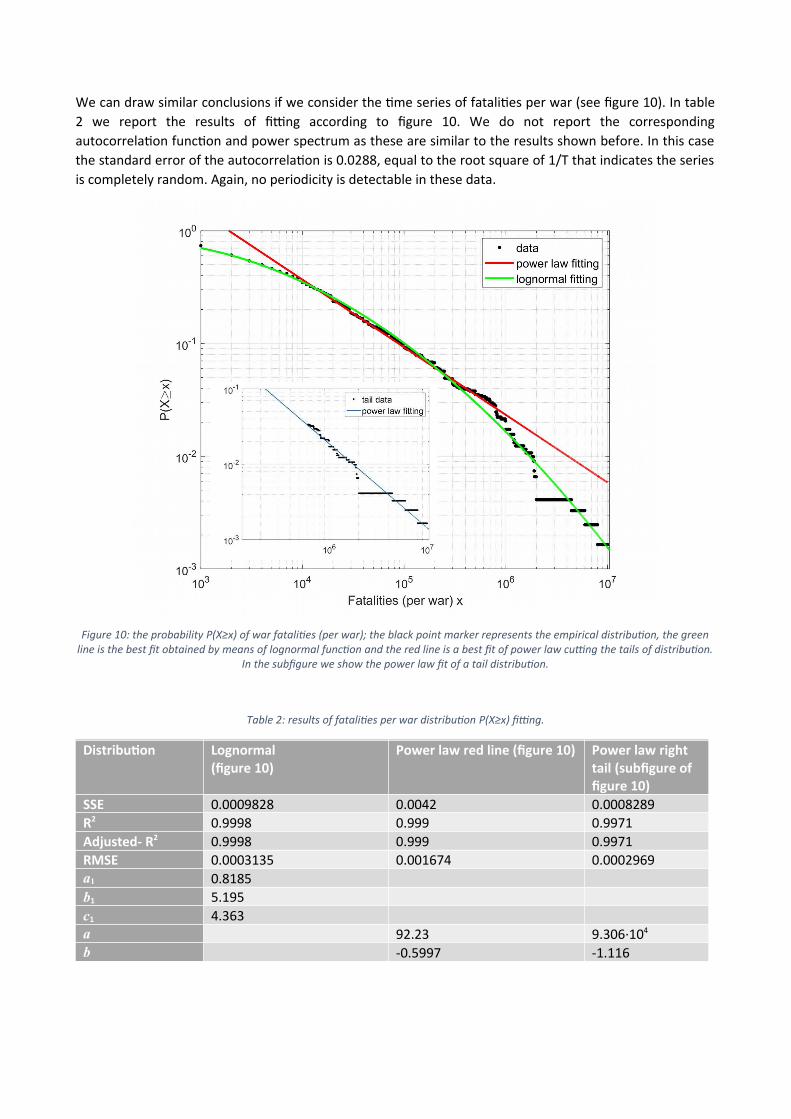
We can draw similar conclusions if we consider the time series of fatalities per war (see figure 10). In table2 we report the results of fitting according to figure 10. We do not report the correspondingautocorrelation function and power spectrum as these are similar to the results shown before. In this casethe standard error of the autocorrelation is 0.0288, equal to the root square of 1/T that indicates the seriesis completely random. Again, no periodicity is detectable in these data.
Figure 10: the probability P(X≥x) of war fatalities (per war); the black point marker represents the empirical distribution, the greenline is the best fit obtained by means of lognormal function and the red line is a best fit of power law cutting the tails of distribution.
In the subfigure we show the power law fit of a tail distribution.
Table 2: results of fatalities per war distribution P(X≥x) fitting.
Distribution Lognormal (figure 10)
Power law red line (figure 10) Power law right tail (subfigure of figure 10)
SSE 0.0009828 0.0042 0.0008289R2 0.9998 0.999 0.9971Adjusted- R2 0.9998 0.999 0.9971RMSE 0.0003135 0.001674 0.0002969a1 0.8185b1 5.195c1 4.363a 92.23 9.306∙104
b -0.5997 -1.116

A further step in the analysis is to examine the data after normalizing for the world population. In this casethe distributions clearly follow a power law, not a lognormal one. The normalization impacts mainly on theleft tail, that is magnifying the importance of ancient, relatively small wars. The results are shown in figures11-12.
Figure 11: Distribution of war fatalities world population normalized fitted by power law (equation 1) - a=0.0003873, b=-0.8708,SSE=0.007736, R2=0.9869, Adjusted- R2=0.9868, RMSE=0.009376.

Figure 12: Distribution of war fatalities per war world population normalized fitted by power law (equation 1) - a=0.000332, b=-0.8869, SSE=0.0005404, R2=0.9991, Adjusted- R2=0.9991, RMSE=0.002478.
Also, in these cases, the autocorrelation and the Fourier analysis show that the time series of fatalities iscompletely random. The data are not reported here since the results are similar to those obtained for thenon-normalized time series. The standard error of the autocorrelation is 0.0408 for war fatalities worldpopulation normalized and 0.0288 for war fatalities per war world population normalized, equal to the rootsquare of 1/T that indicates the series is completely random.
Conclusions
Our contribution in this field consists in validating the Brecke conclict database (Brecke 2011), among thelongest and most complete ones available. This analysis confirms previous work, see e.g. (Clauset 2018) ,(Clauset and Gleditsch 2018) for a general discussion. The data indicate that power laws are common in thedistribution of violent conflicts in human history: in this case, the trend is clear when the number ofcasualties are normalized for the increasing world population. Note also that the normalized number ofconflicts per year tend to decrease with time – this result indicates that in modern times wars have tendedto become less frequent but more destructive. In practice, these result confirm that there is little evidencesupporting the idea popularized by Pinker (Pinker 2011) that humankind is progressing toward a morepeaceful world. A new major conflict might be possible in a non-remote future, as discussed among othersby Clauset (Clauset 2018). These result seem to indicate that human conflicts are a critical phenomenon:we could say that humans worldwide tend to form societies existing in a self-organized critical condition, asdefined by Bak et al. (Per Bak, Tang, and Wiesenfeld 1988). In these conditions, war is simply one of themethods that the system has to dissipate entropy at the fastest possible speed (Kleidon, Malhi, and Cox2010),(Trinn 2018). In other words, war appears to be an unavoidable consequence of the behavior of

human beings, and perhaps of other primate species (de Waal 2000). On the other hand, we need also toremark that the available data series involves only a small fraction of human history, corresponding to aperiod of tumultuous and rapid expansion of both the economy and the population. A future of decliningnatural resources might show different trends.
Acknowledgement: the authors are grateful to Aaron Clauset for his comments and suggestions.
REFERENCES
Alvarez-Ramirez, J., C. Ibarra-Valdez, E. Rodriguez, and Urrea R. 2007. “Fractality and Time Correlation in Contemporary War.” Chaos, Solitons & Fractals 34 (27): 1021–1376. https://www.sciencedirect.com/journal/chaos-solitons-and-fractals/vol/34/issue/4.
Bak, P. 1996. How Nature Works. The Science of Self-Organized Criticality. 1996. New York: Copernicus. https://scholar.google.it/scholar?cluster=5030422883073743908&hl=en&as_sdt=2005&sciodt=0,5#0.
Bak, Per, Chao Tang, and Kurt Wiesenfeld. 1988. “Self-Organized Criticality.” Physical Review A 38 (1). American Physical Society: 364–74. https://doi.org/10.1103/PhysRevA.38.364.
Bohorquez, Juan Camilo, Sean Gourley, Alexander R. Dixon, Michael Spagat, and Neil F. Johnson. 2009. “Common Ecology Quantifies Human Insurgency.” Nature 462 (7275). Nature Publishing Group: 911–14. https://doi.org/10.1038/nature08631.
Brecke, Peter. 2011. “Conflict.” 2011. http://brecke.inta.gatech.edu/research/conflict/.
Cirillo, Pasquale, and Nassim Nicholas Taleb. 2015. “On the Statistical Properties and Tail Risk of Violent Conflicts,” May. https://doi.org/10.1016/j.physa.2016.01.050.
Clauset, Aaron. 2018. “Trends and Fluctuations in the Severity of Interstate Wars.” Science Advances 4 (2). American Association for the Advancement of Science: eaao3580. https://doi.org/10.1126/sciadv.aao3580.
Clauset, Aaron, and Kristian Skrede Gleditsch. 2018. Trends in Conflict. Edited by Alexandra Gheciu and William C. Wohlforth. Vol. 1. Oxford University Press. https://doi.org/10.1093/oxfordhb/9780198777854.013.16.
Emerson, Caryl. 2009. “Leo Tolstoy on Peace and War.” PMLA 124 (5): 1855–58.
Friedman, Jeffrey A. 2015. “Using Power Laws to Estimate Conflict Size.” Journal of Conflict Resolution 59 (7). SAGE PublicationsSage CA: Los Angeles, CA: 1216–41. https://doi.org/10.1177/0022002714530430.
Gallo, Giorgio. 2015. “Richardson Revisited: An Analysis of ‘Action-Reaction’ Conflict Models.” https://www.researchgate.net/publication/282184822_Richardson_Revisited_an_Analysis_of_’Action-Reaction’_Conflict_Models.
González-Val, Rafael. 2016. “War Size Distribution: Empirical Regularities Behind Conflicts.” Defence and Peace Economics 27 (6). Routledge: 838–53. https://doi.org/10.1080/10242694.2015.1025486.
Hayes, Brian. 2002. “Statistics of Deadly Quarrels.” American Scientist, no. January-February: 10–15.
Hess, G. D. 1995. “An Introduction To Lewis Fry Richardson and His Mathematical Theory of War and Peace.” Conflict Management and Peace Science 14 (1). SAGE PublicationsSage UK: London, England: 77–113. https://doi.org/10.1177/073889429501400104.
Johnson, Neil F., Pablo Medina, Guannan Zhao, Daniel S. Messinger, John Horgan, Paul Gill, Juan Camilo Bohorquez, et al. 2013. “Simple Mathematical Law Benchmarks Human Confrontations.” Scientific Reports 3 (1). Nature Publishing Group: 3463. https://doi.org/10.1038/srep03463.
Kleidon, Axel, Yadvinder Malhi, and Peter M Cox. 2010. “Maximum Entropy Production in Environmental and Ecological Systems.” Philosophical Transactions of the Royal Society of London. Series B, BiologicalSciences 365 (1545): 1297–1302. https://doi.org/10.1098/rstb.2010.0018.
Martelloni, Gianluca, and Franco Bagnoli. 2014. “Infiltration Effects on a Two-Dimensional Molecular Dynamics Model of Landslides.” Natural Hazards 73 (1). Springer Netherlands: 37–62. https://doi.org/10.1007/s11069-013-0944-z.
Pinker, Steven. 2011. The Better Angels of Our Nature. Viking Books.
Richardson L. F. 1960. Statistics of Deadly Quarrels. Pittsburgh: The Boxwood Press. https://doi.org/10.1371/journal.pone.0048633.
Sarkees, Meredith Reid, Frank Whelon Wayman, and J. David Singer. 2003. “Inter-State, Intra-State, and Extra-State Wars: A Comprehensive Look at Their Distribution over Time, 1816-1997.” International Studies Quarterly 47 (1). Wiley/Blackwell (10.1111): 49–70. https://doi.org/10.1111/1468-2478.4701003.
Sorokin, P.A. 1937. Social and Cultural Dynamics: Vol. 3: Fluctuation of Social Relationships, War, and Revolution. New York: American Book Company.
Trinn, Christoph. 2018. “Criticality, Entropy and Conflict.” Systems Research and Behavioral Science, June. https://doi.org/10.1002/sres.2516.
Waal, F B de. 2000. “Primates--a Natural Heritage of Conflict Resolution.” Science (New York, N.Y.) 289 (5479). American Association for the Advancement of Science: 586–90. https://doi.org/10.1126/SCIENCE.289.5479.586.
Ward, Michael D., Nils W. Metternich, Cassy L. Dorff, Max Gallop, Florian M. Hollenbach, Anna Schultz, and Simon Weschle. 2013. “Learning from the Past and Stepping into the Future: Toward a New Generation of Conflict Prediction.” International Studies Review 15 (4). Oxford University Press: 473–90. https://doi.org/10.1111/misr.12072.
Wilkinson, David. 1980. Deadly Quarrels. Berkeley and los Angeles, California: University of California Press.
Wright, Q. 1942. A Study of War (2 Vols). University of Chicago Press.