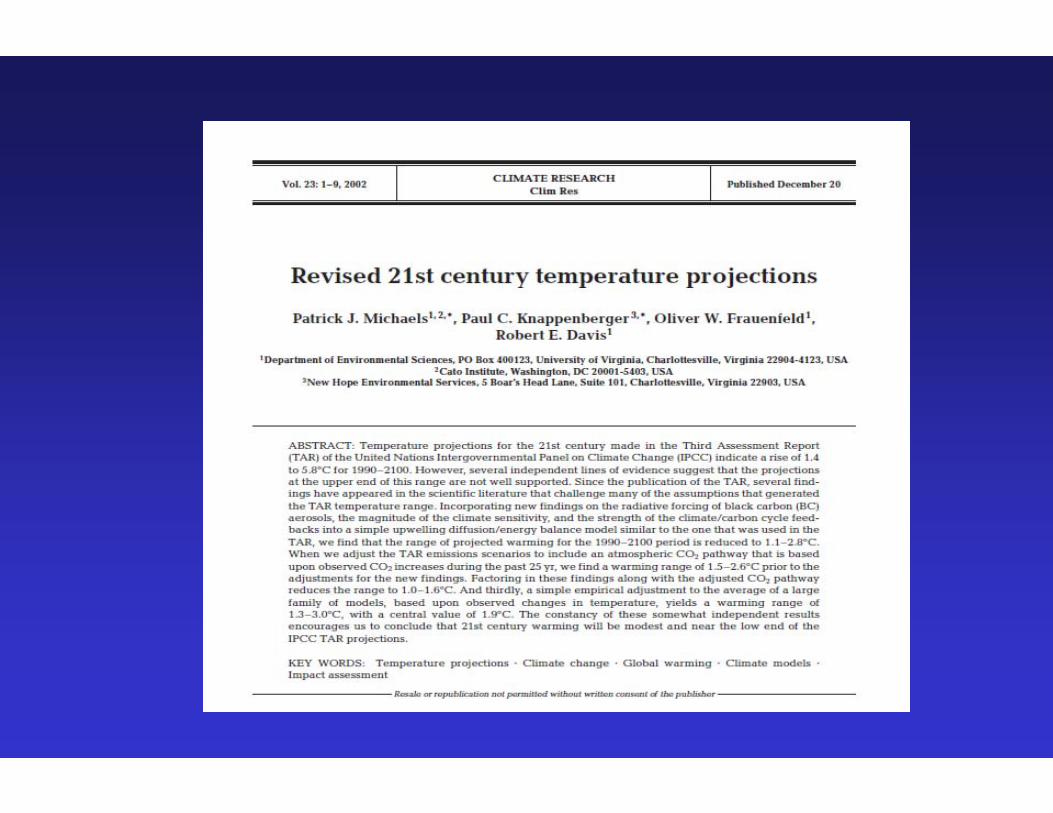
Patrick J. Michaels Center for the Study of Science ... - CIPA · Patrick J. Michaels Center for...
62
HOW THE GOVERNMENT USES SCIENCE TO KEEP PEOPLE FROM BUYING YOUR STUFF Patrick J. Michaels Center for the Study of Science Cato Institute
Transcript of Patrick J. Michaels Center for the Study of Science ... - CIPA · Patrick J. Michaels Center for...
HOW THE GOVERNMENT USES SCIENCETO KEEP PEOPLE FROM BUYING YOUR STUFF
Patrick J. MichaelsCenter for the Study of Science
Cato Institute

…AND HOW TO STOP IT
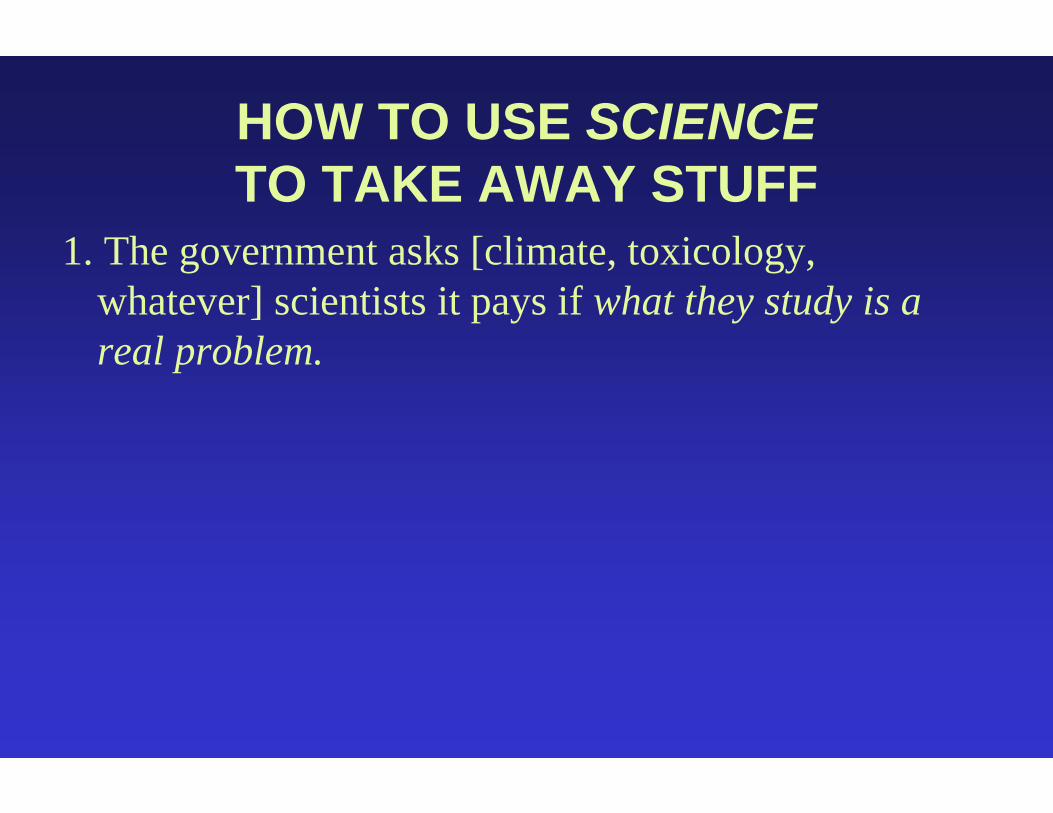
HOW TO USE SCIENCE TO TAKE AWAY STUFF
1. The government asks [climate, toxicology, whatever] scientists it pays if what they study is a real problem.
2. The scientists produce a “comprehensive” report
3. It’s the most important problem on earth!
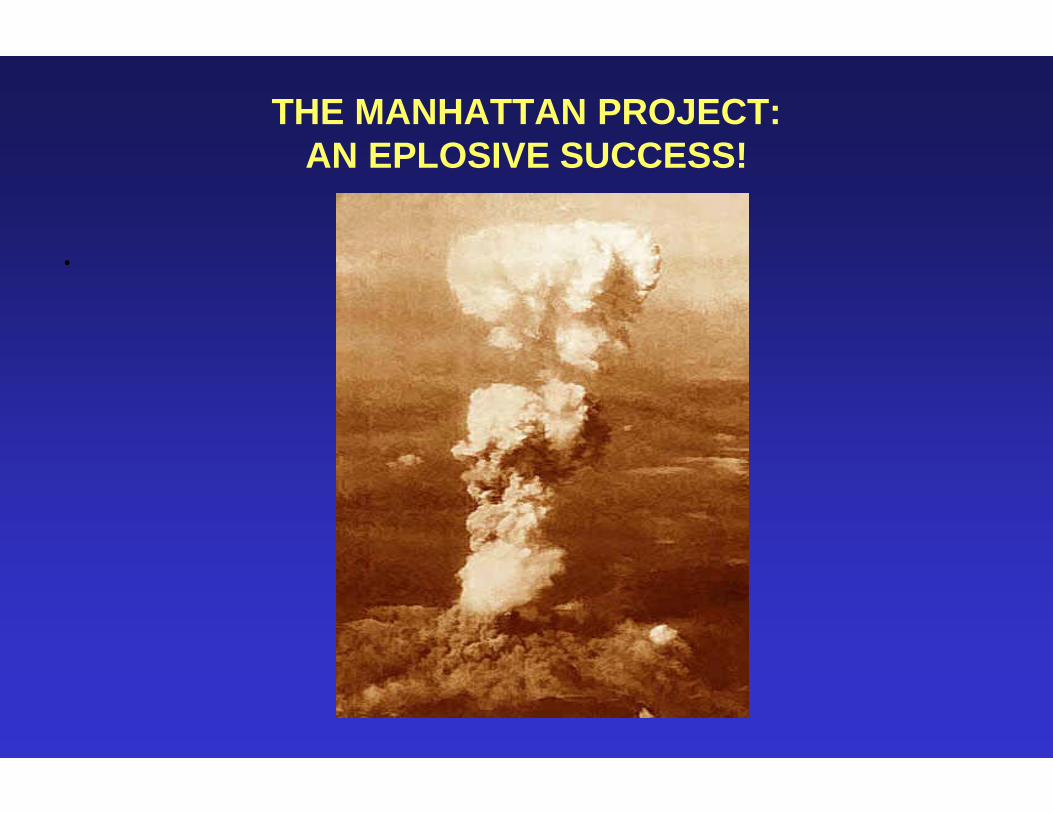
THE MANHATTAN PROJECT:AN EPLOSIVE SUCCESS!
.


State Science Institute
Dwight D. Eisenhower, Farewell Adress
The free university, historically the fountainhead of freeideas and scientific discovery, has experienced arevolution in the conduct of research. Partly because ofthe huge costs involved, a government contract becomesvirtually a substitute for intellectual curiosity…
Yet, in holding scientific research and discovery inrespect, as we should, we must also be alert to the equaland opposite danger that public policy could itselfbecome the captive of a scientific-technological elite.The prospect of domination of the nation's scholars byFederal employment, project allocations, and the powerof money is ever present – and is gravely to be regarded.


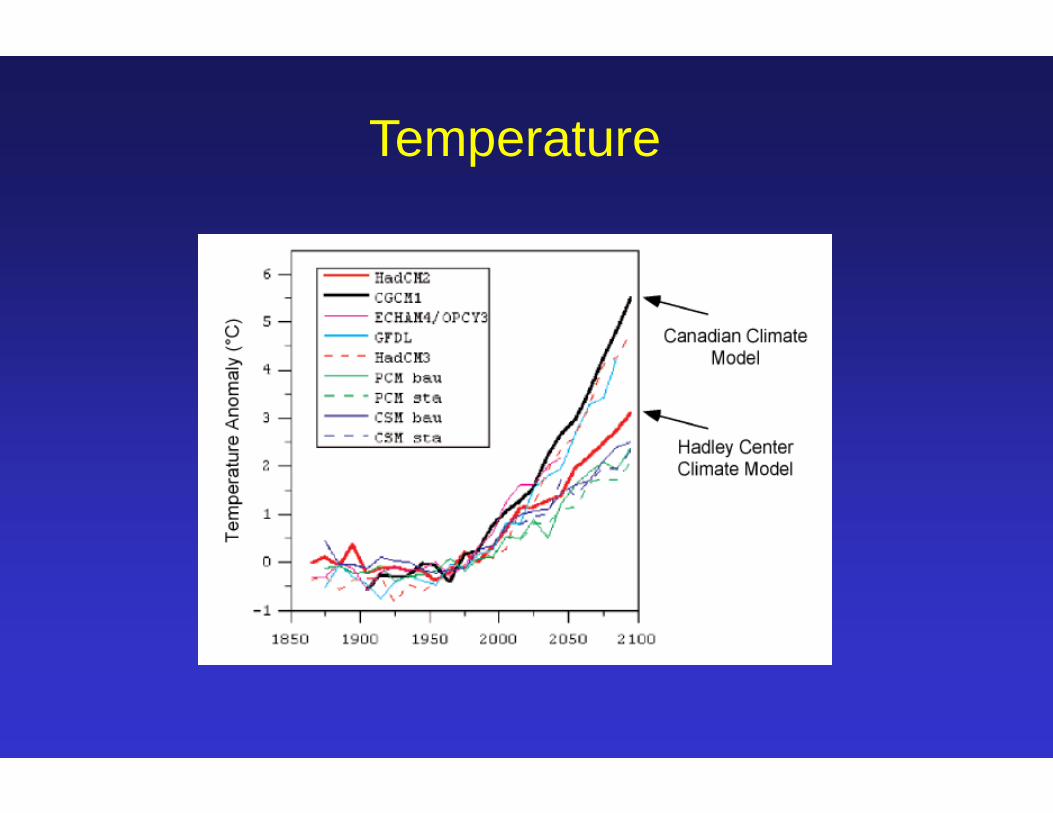
Temperature
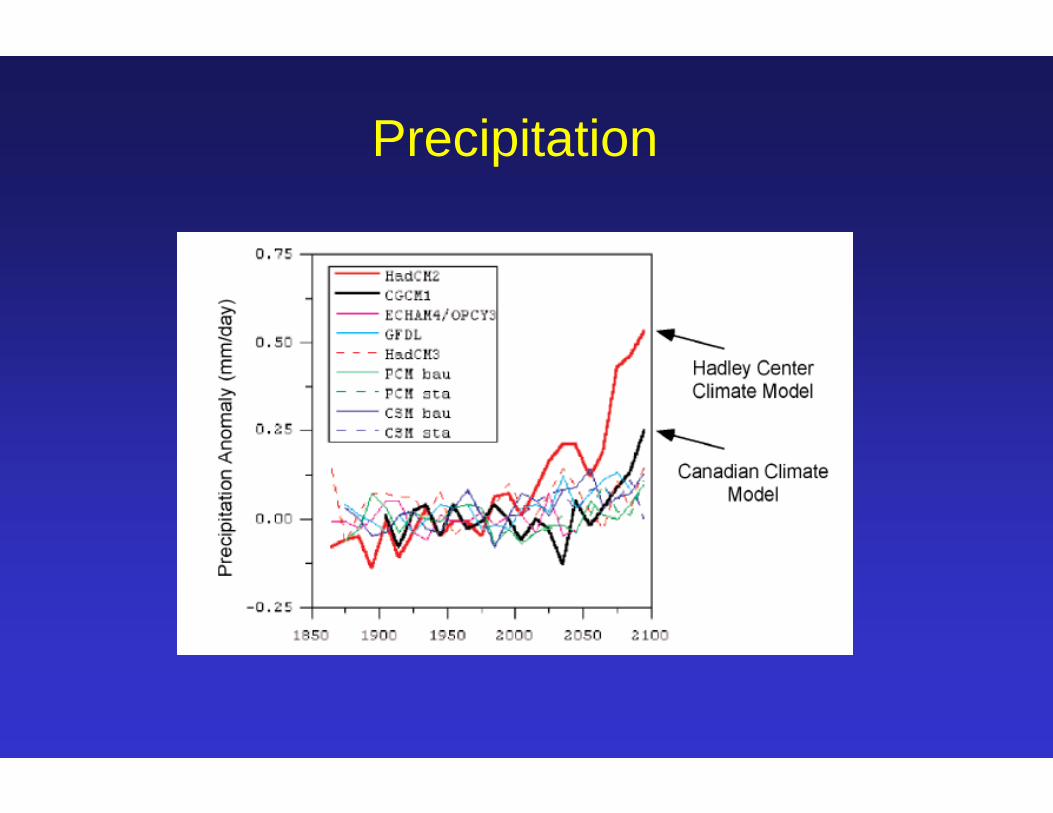
Precipitation
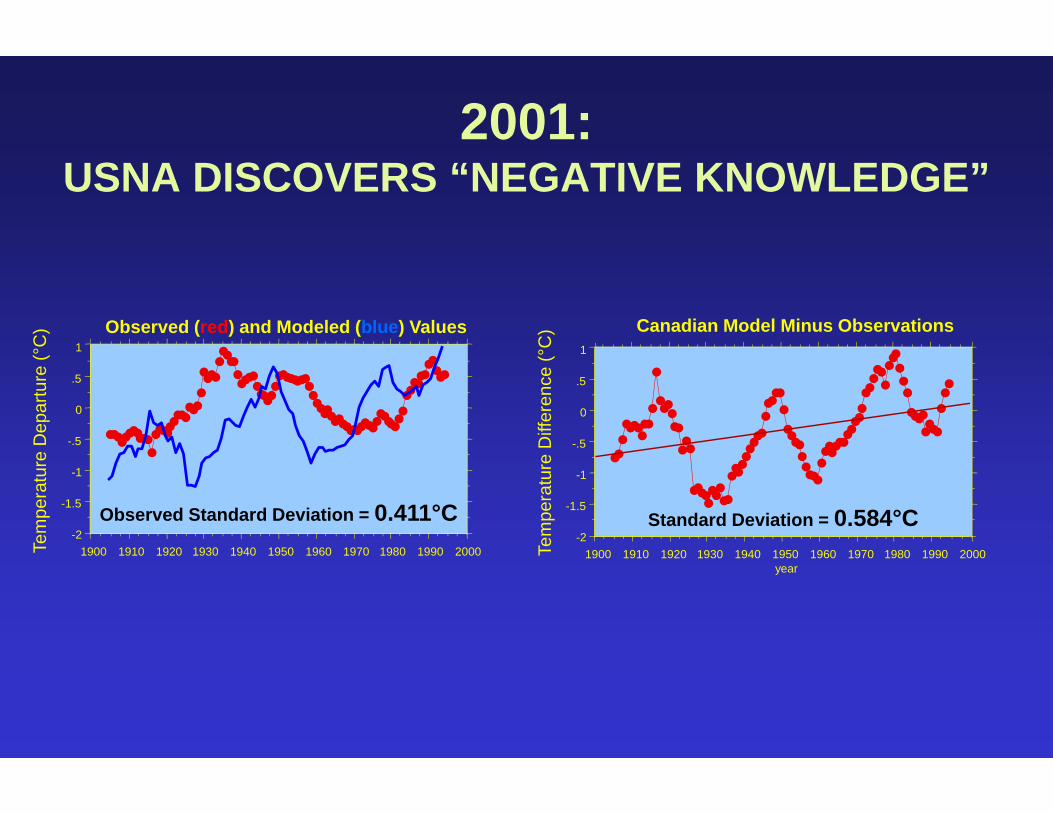
2001:USNA DISCOVERS “NEGATIVE KNOWLEDGE”
-2
-1.5
-1
-.5
0
.5
1
1900 1910 1920 1930 1940 1950 1960 1970 1980 1990 2000Tem
pera
ture
Dep
artu
re (°
C) Observed (red) and Modeled (blue) Values Canadian Model Minus Observations
Tem
pera
ture
Diff
eren
ce (°
C)
-2
-1.5
-1
-.5
0
.5
1
1900 1910 1920 1930 1940 1950 1960 1970 1980 1990 2000year
Standard Deviation = 0.584°CObserved Standard Deviation = 0.411°C

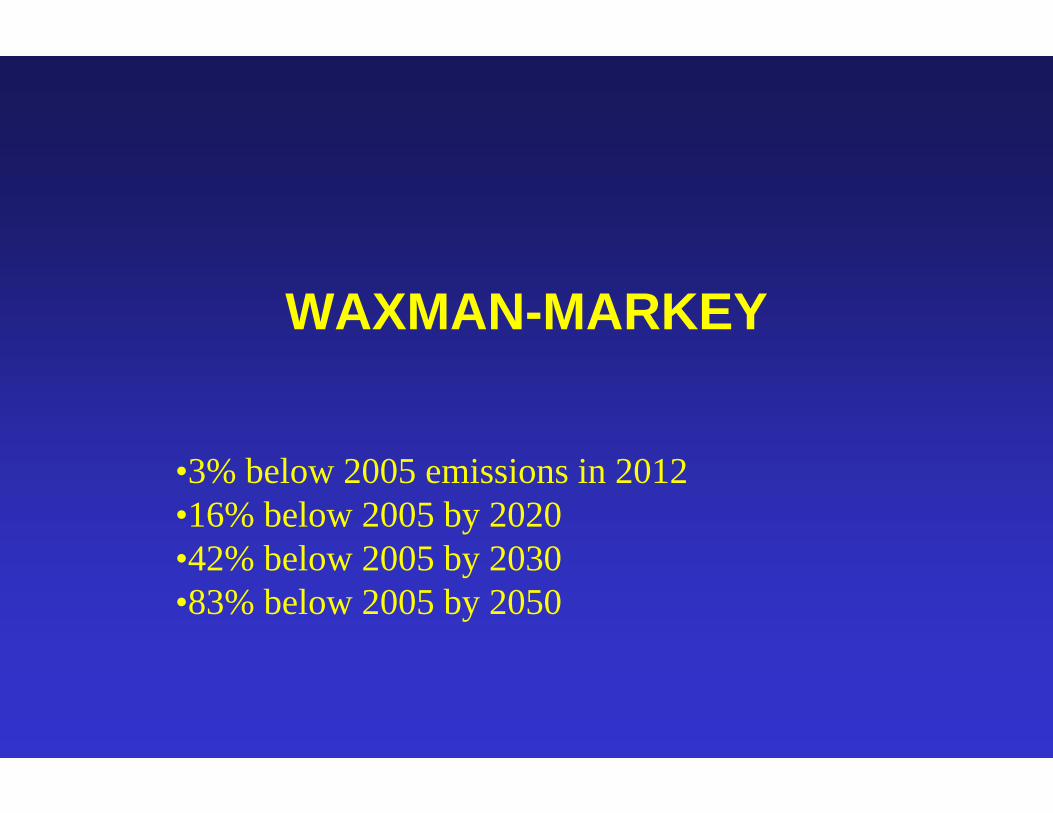
WAXMAN-MARKEY
•3% below 2005 emissions in 2012•16% below 2005 by 2020•42% below 2005 by 2030•83% below 2005 by 2050
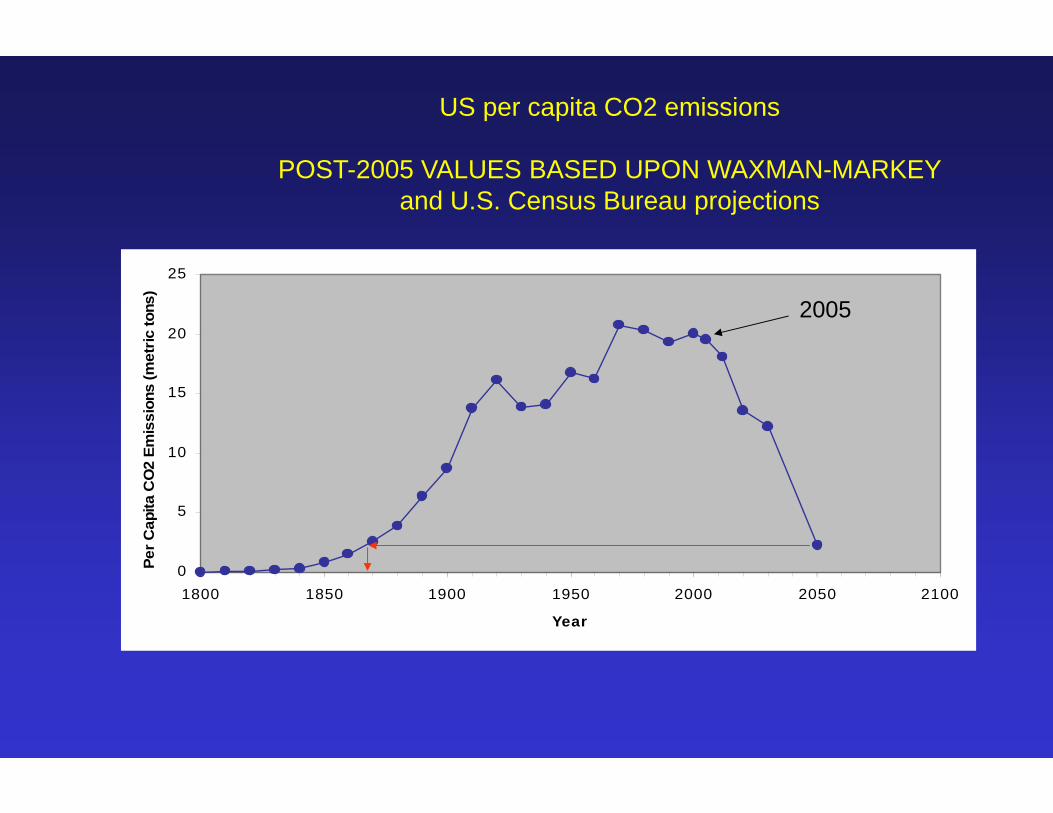
0
5
10
15
20
25
1800 1850 1900 1950 2000 2050 2100
Year
Per C
apita
CO
2 Em
issi
ons
(met
ric to
ns)
2005
US per capita CO2 emissions
POST-2005 VALUES BASED UPON WAXMAN-MARKEYand U.S. Census Bureau projections
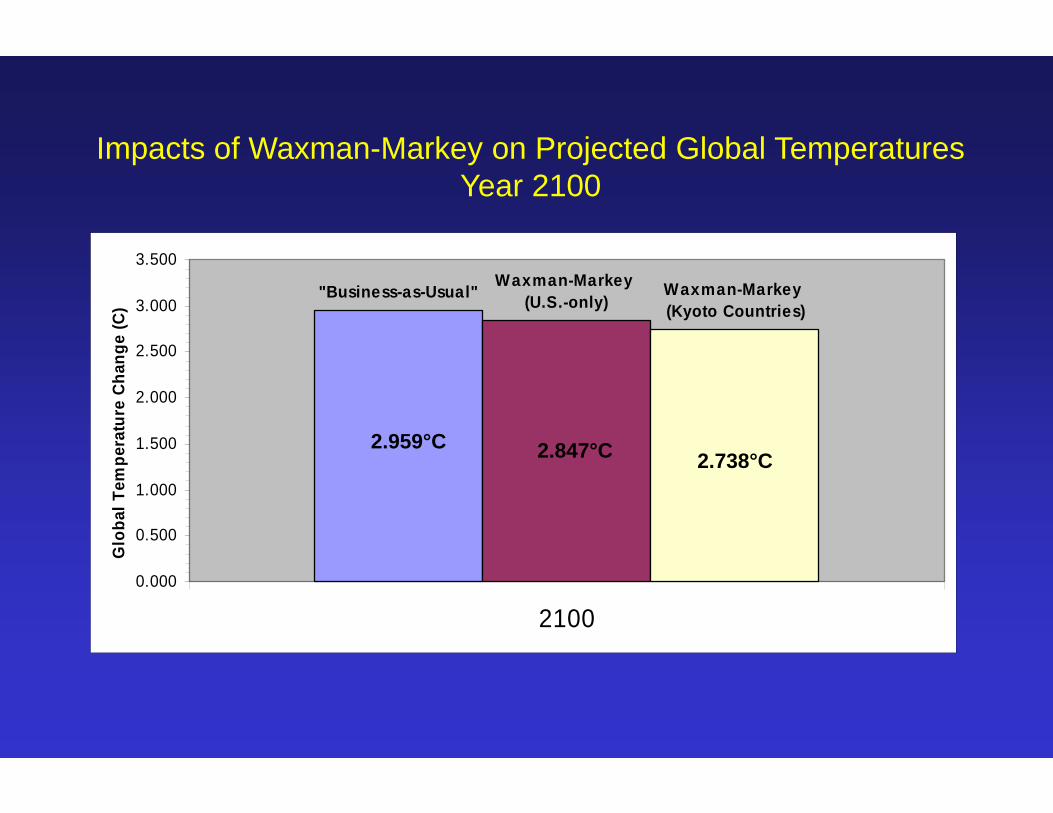
Waxman-Markey (U.S.-only)
Waxman-Markey (Kyoto Countries)
"Business-as-Usual"
0.000
0.500
1.000
1.500
2.000
2.500
3.000
3.500
2100
Glo
bal T
empe
ratu
re C
hang
e (C
)
Impacts of Waxman-Markey on Projected Global TemperaturesYear 2100
2.959°C 2.847°C 2.738°C
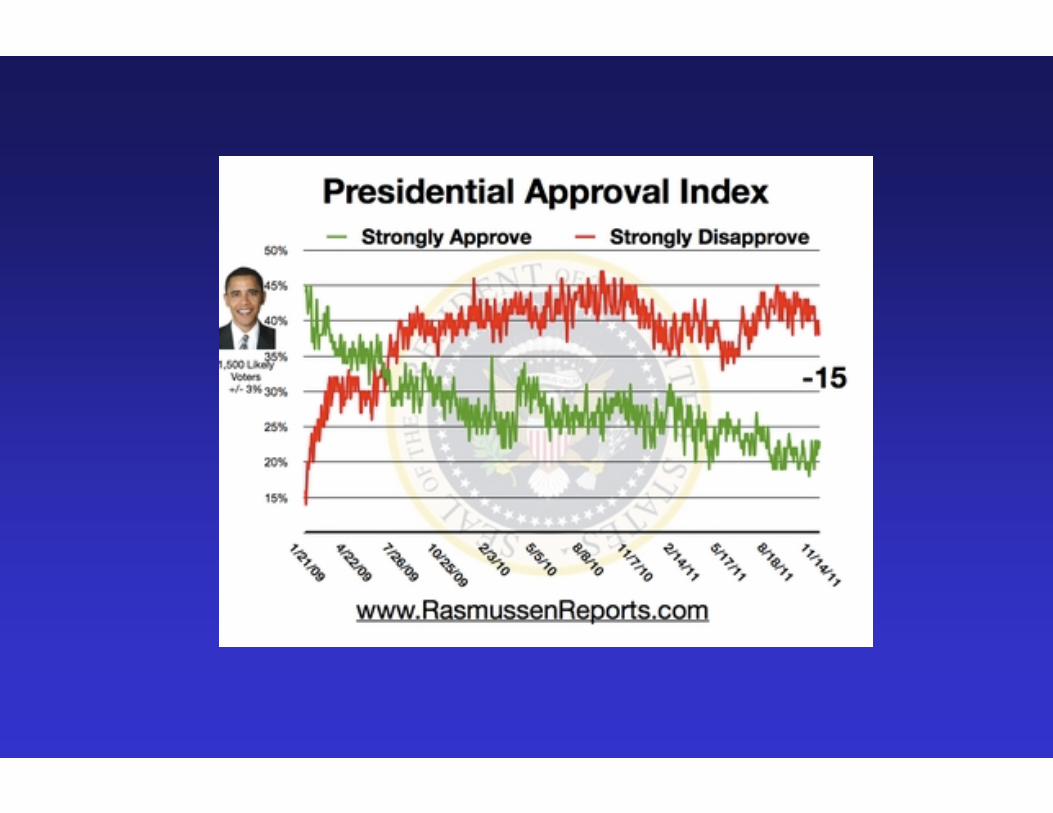
NOVEMBER 3, 2010
In response to question on cap-and-trade:
“There’s more than one way to skin a cat”--Barack Obama
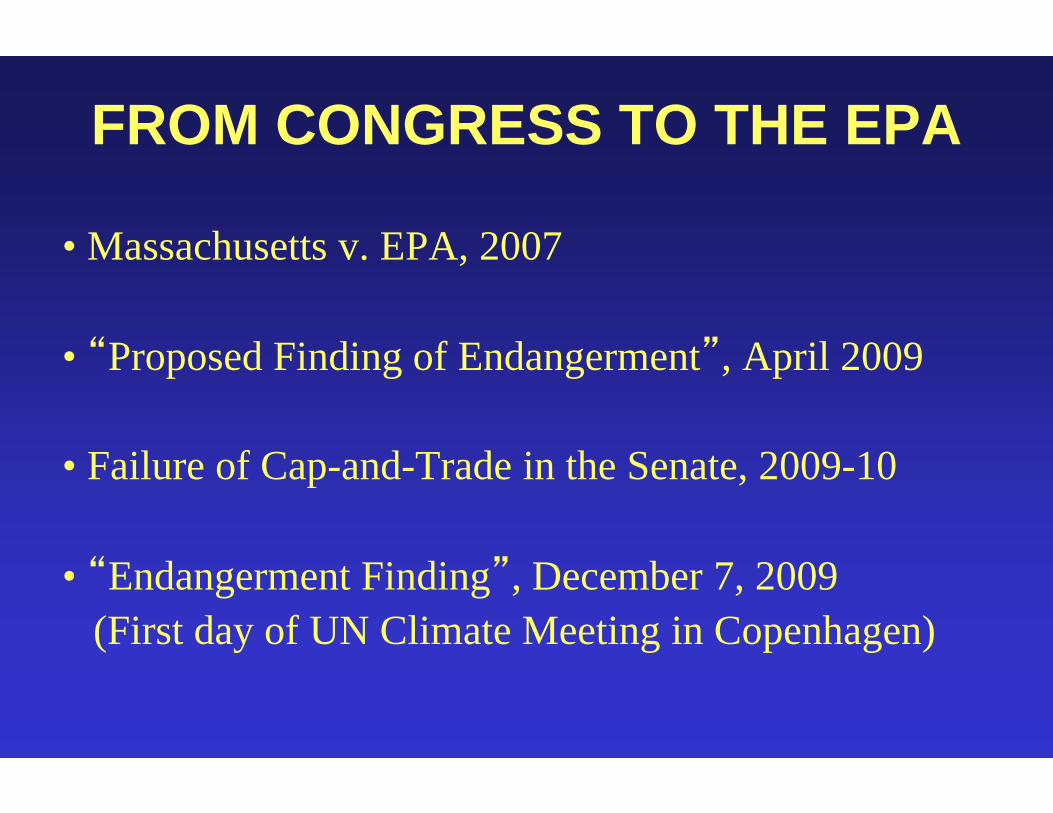
FROM CONGRESS TO THE EPA
• Massachusetts v. EPA, 2007
• “Proposed Finding of Endangerment”, April 2009
• Failure of Cap-and-Trade in the Senate, 2009-10
• “Endangerment Finding”, December 7, 2009(First day of UN Climate Meeting in Copenhagen)
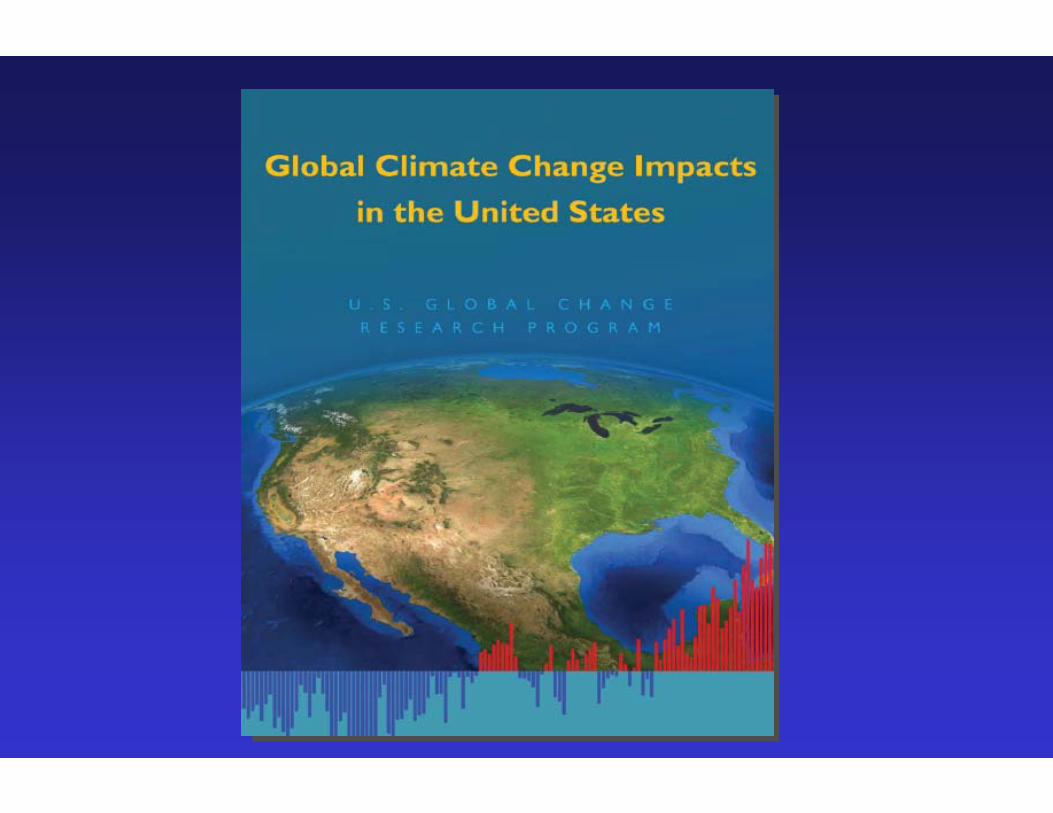
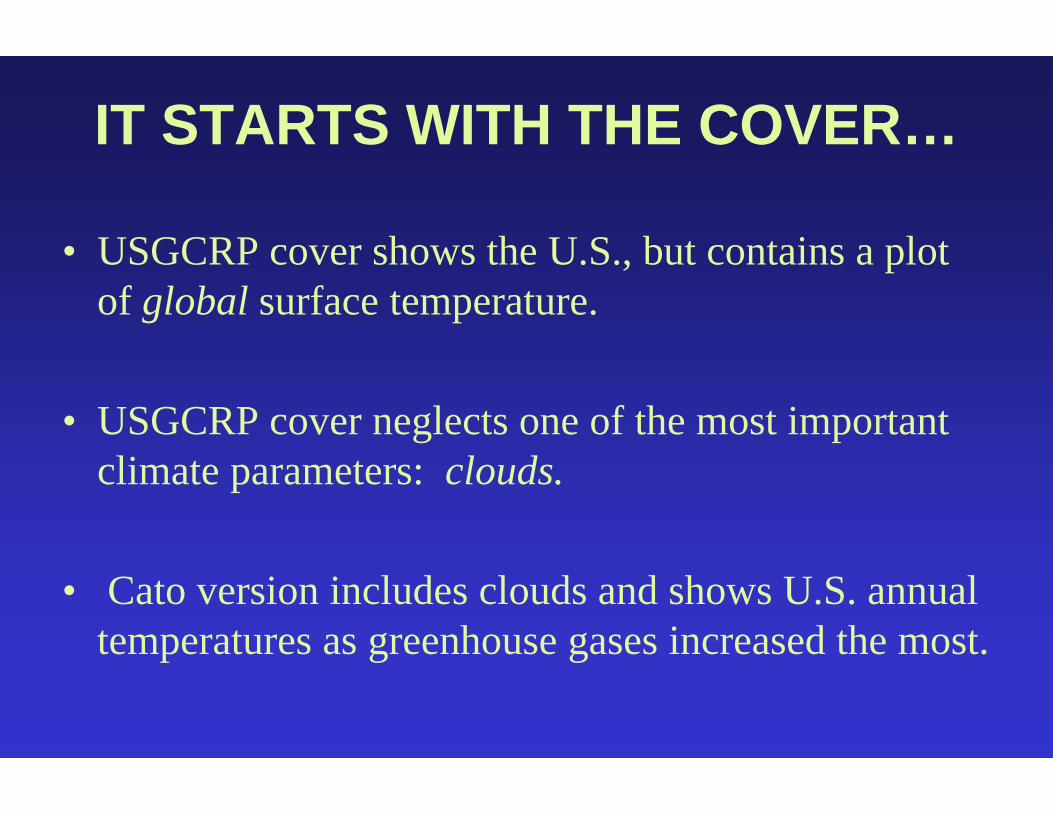
IT STARTS WITH THE COVER…
• USGCRP cover shows the U.S., but contains a plot of global surface temperature.
• USGCRP cover neglects one of the most important climate parameters: clouds.
• Cato version includes clouds and shows U.S. annual temperatures as greenhouse gases increased the most.


“KEY POINTS” in both reports are analogous, and provide reference pages in text.
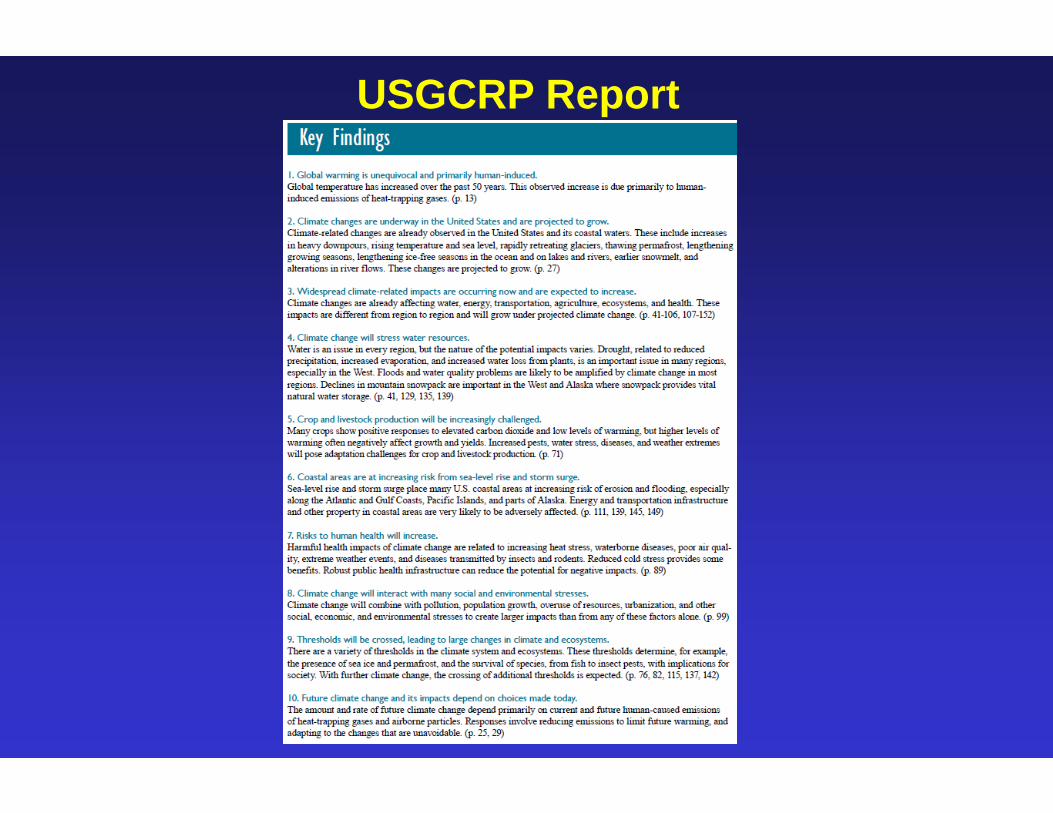
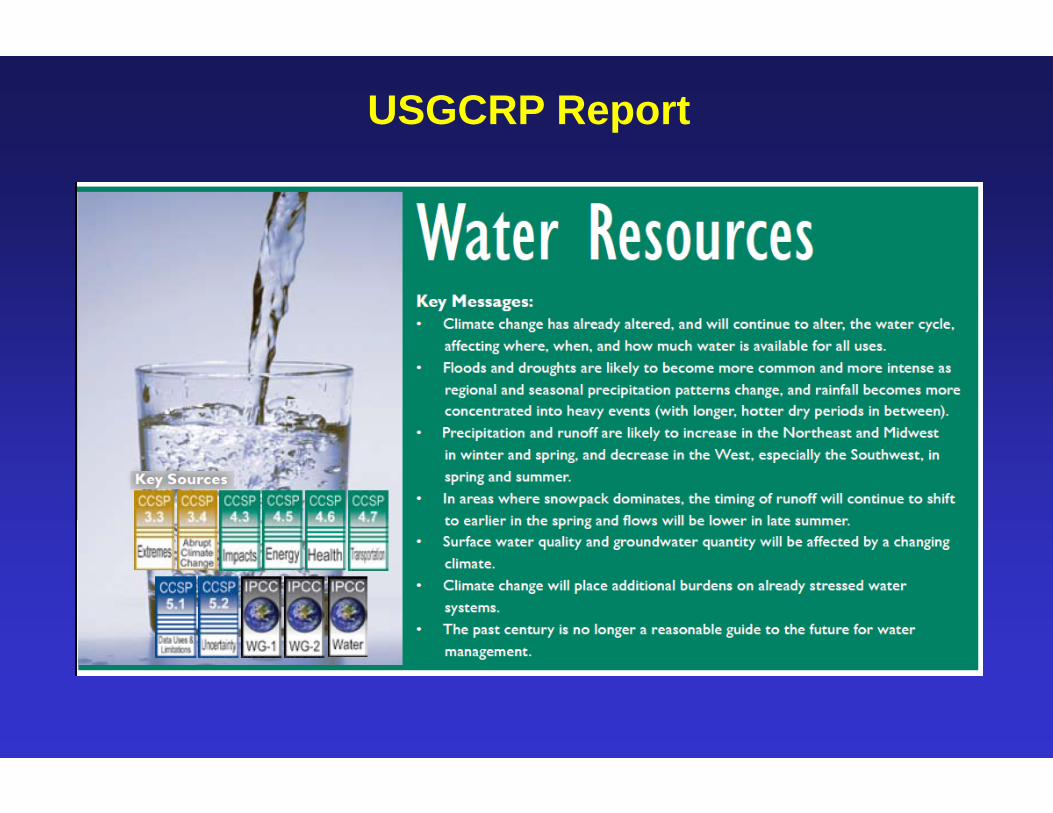
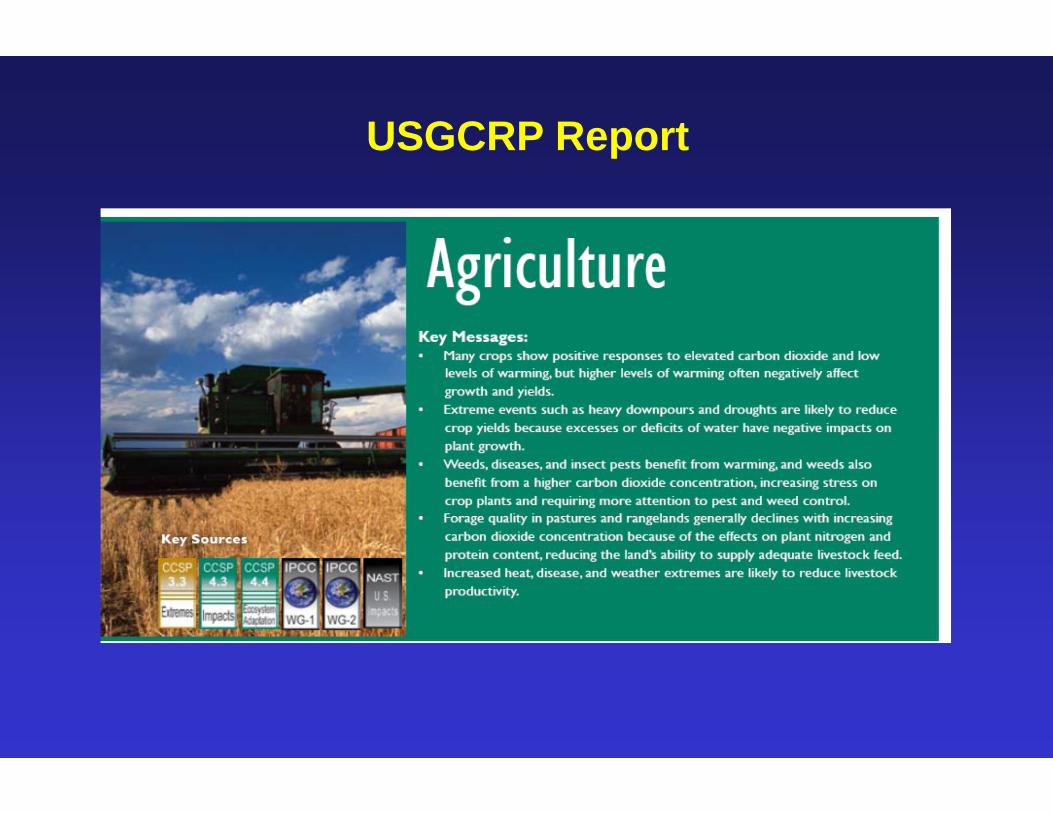
USGCRP Report
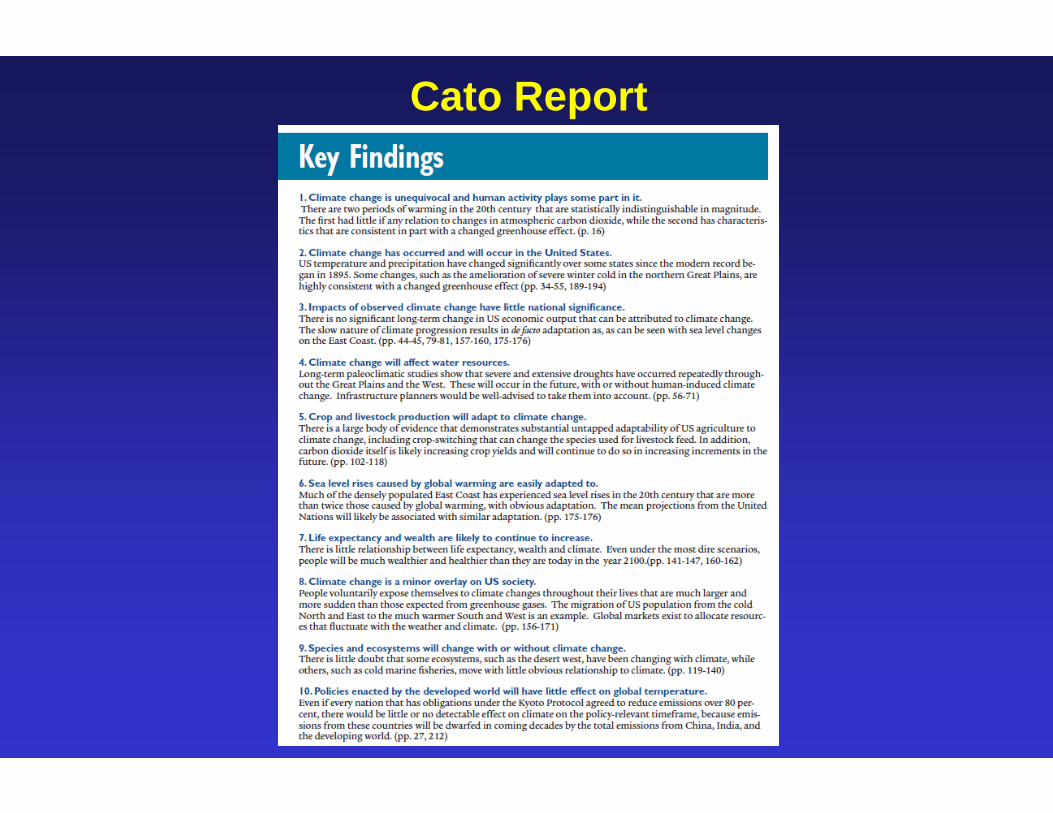
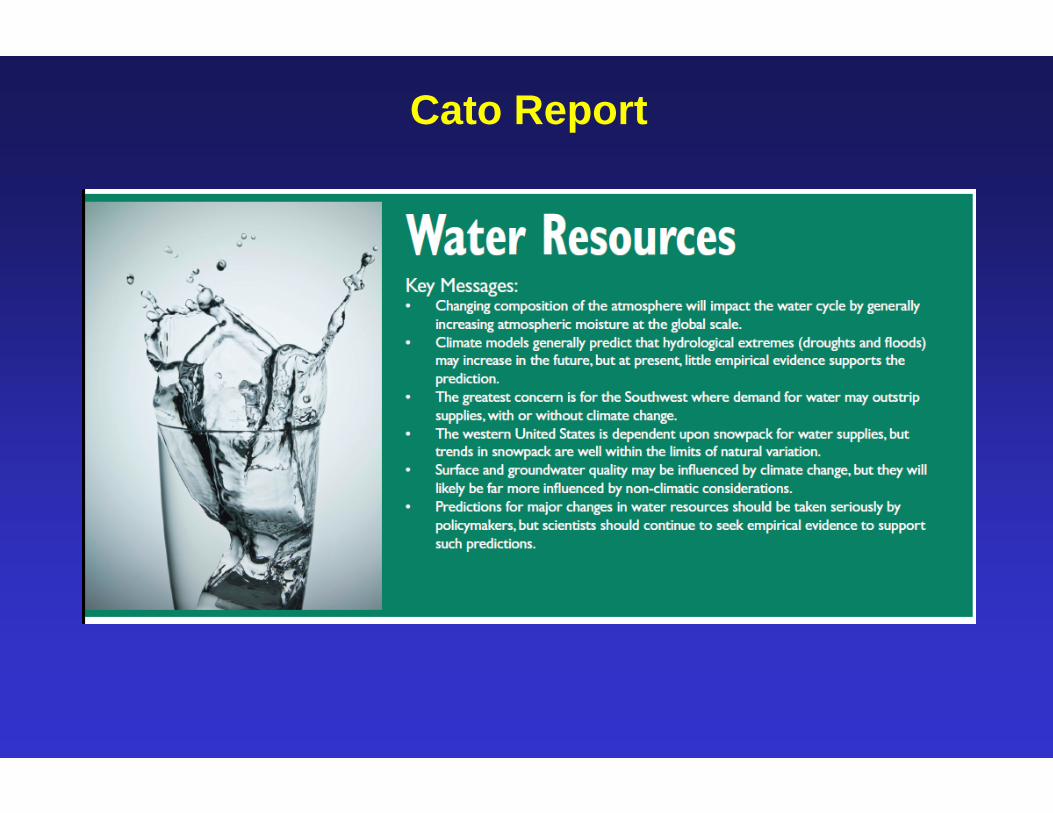
Cato Report
USGCRP Report
Cato Report
USGCRP Report
Cato Report
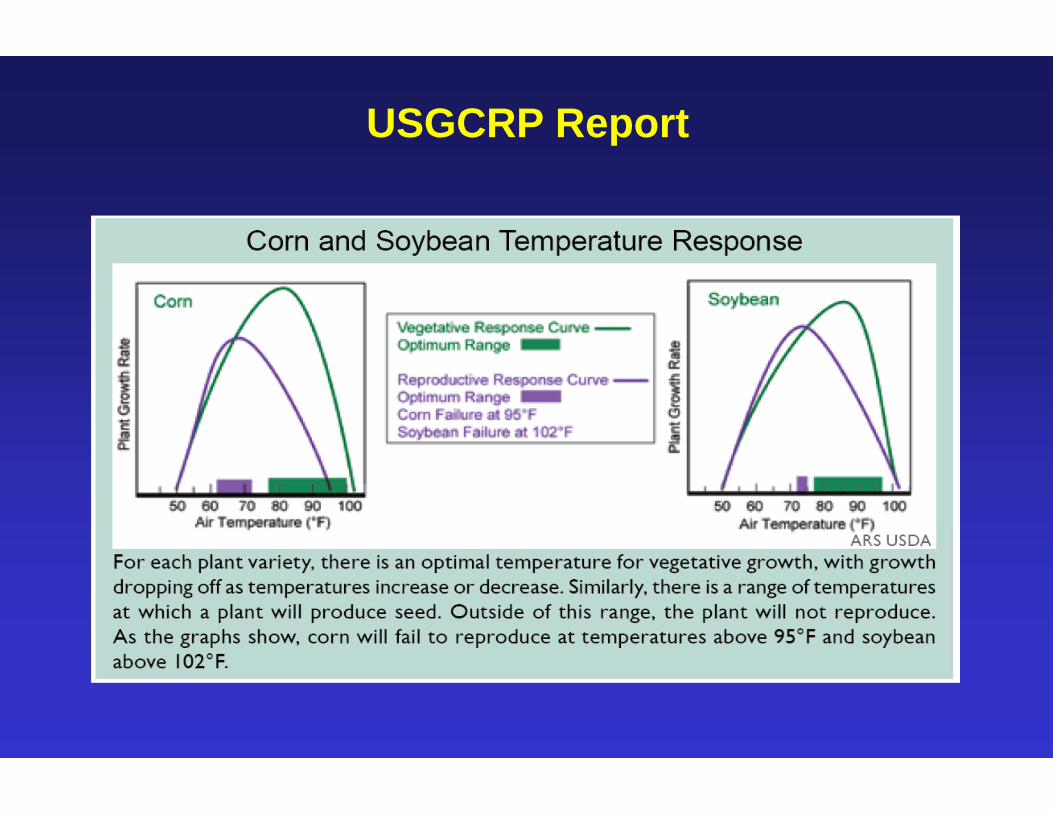
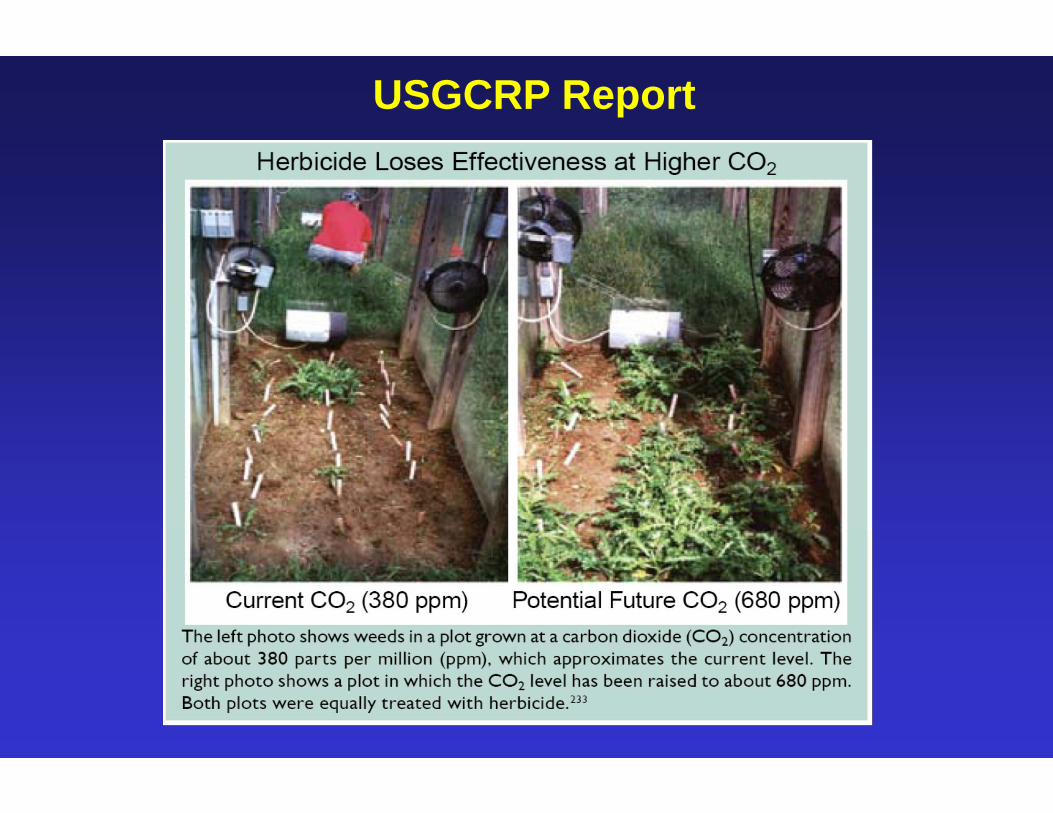
USGCRP Report
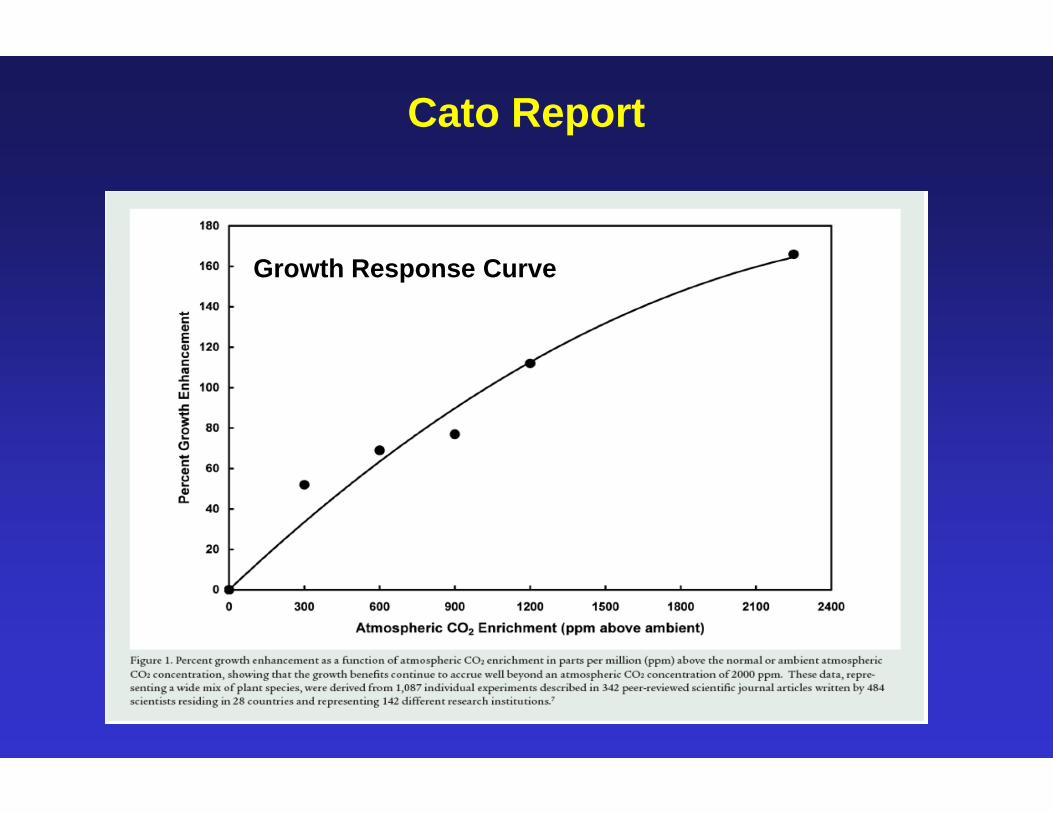
• USGCRP neglects fundamental crop physiology by portraying growth response as static when atmospheric carbon dioxide increases.
• In reality, the temperature optimum for photosynthesis increases with the carbon dioxide concentration.
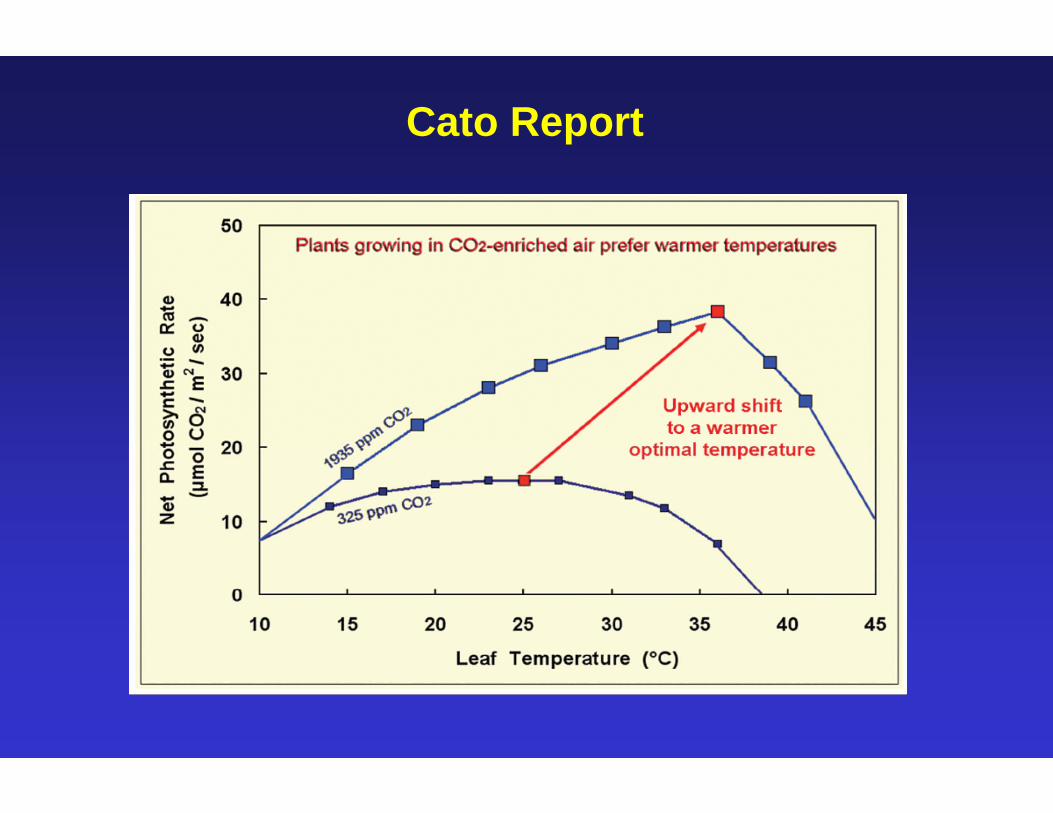
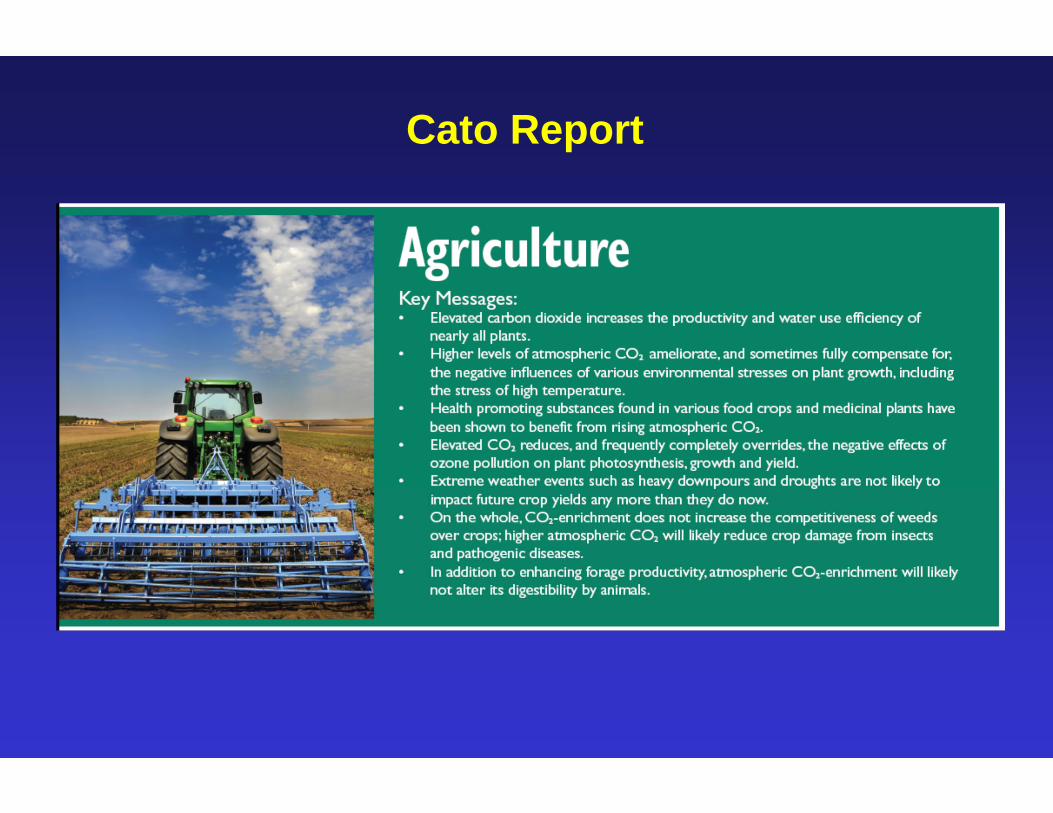
Cato Report
USGCRP Report
Cato Report
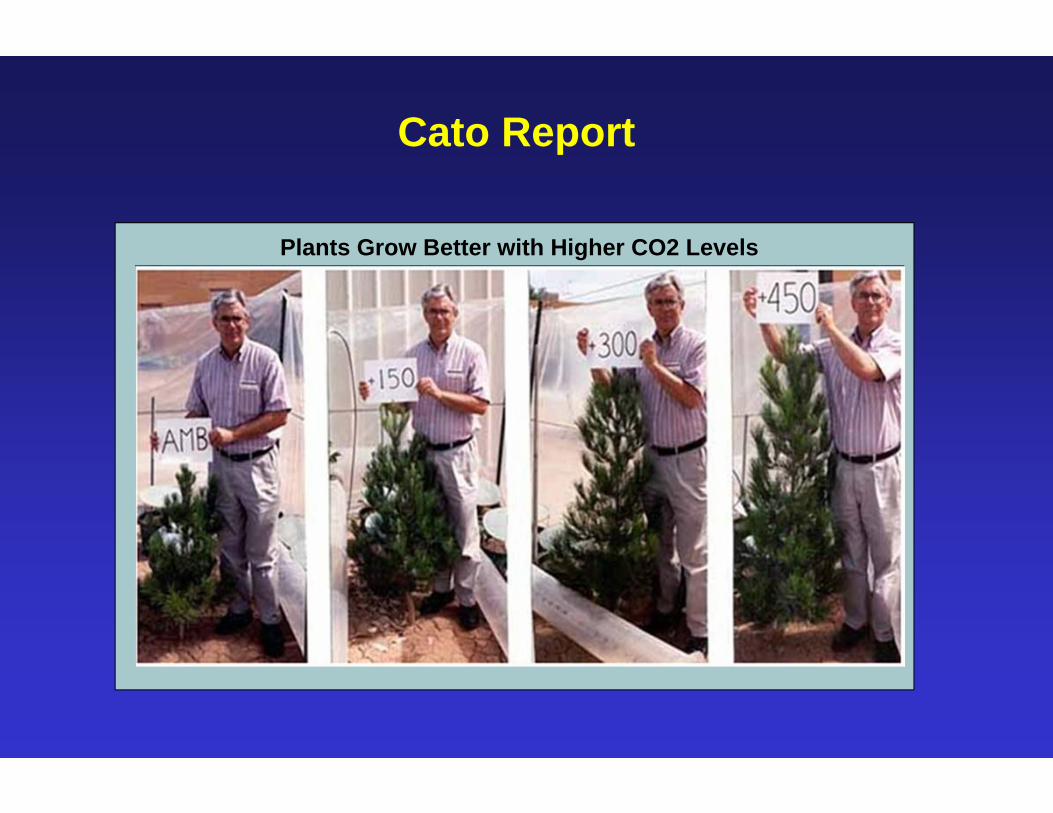
Plants Grow Better with Higher CO2 Levels
Cato Report
Growth Response Curve
REGIONAL ANALYSIS:ALASKAN EXAMPLE
I CHOOSE MY WORDS CAREFULLY:
THE FEDERAL GOVERNMENT LIES ABOUT CLIMATE CHANGE AND ITS EFFECTS
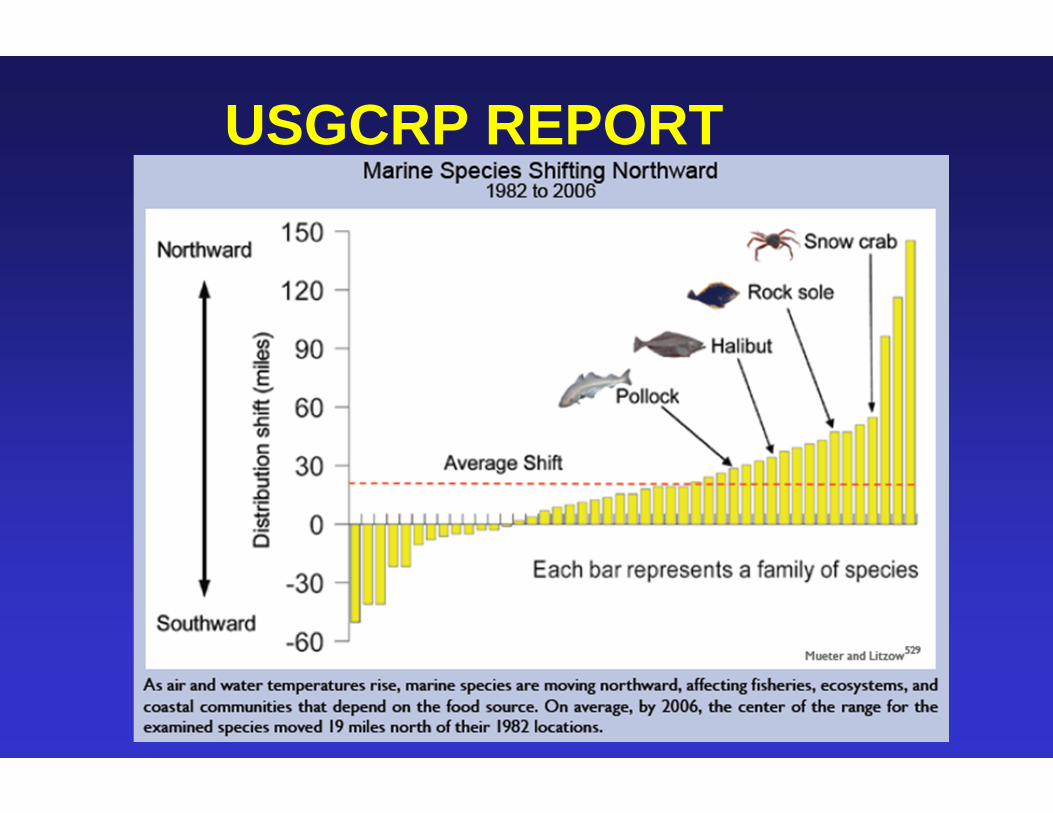
USGCRP REPORT
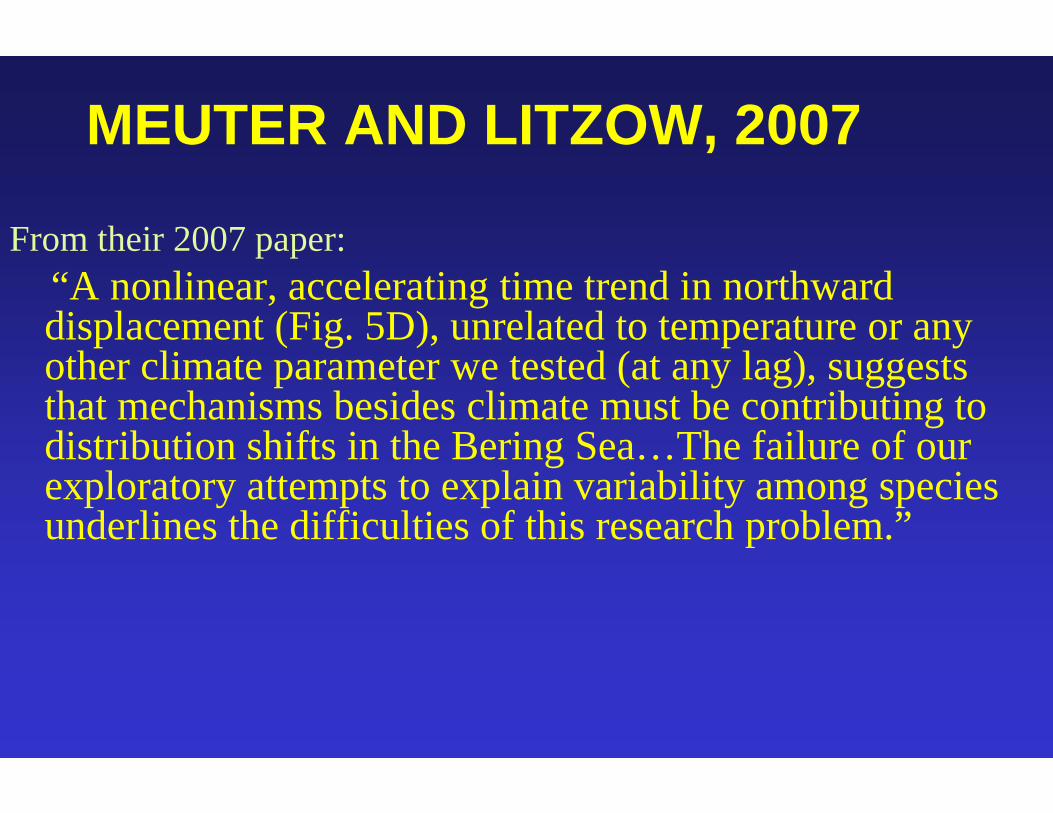
MEUTER AND LITZOW, 2007
From their 2007 paper:“A nonlinear, accelerating time trend in northward displacement (Fig. 5D), unrelated to temperature or any other climate parameter we tested (at any lag), suggests that mechanisms besides climate must be contributing to distribution shifts in the Bering Sea…The failure of our exploratory attempts to explain variability among species underlines the difficulties of this research problem.”
Download the USGCRP Report:
http://downloads.globalchange.gov/usimpacts/pdfs/climate-impacts-report.pdf
Download the Cato Addendum Report:
http://www.cato.org/pubs/Global-Climate-Change-Impacts.pdf


THE EPA HAS A FAT TAIL
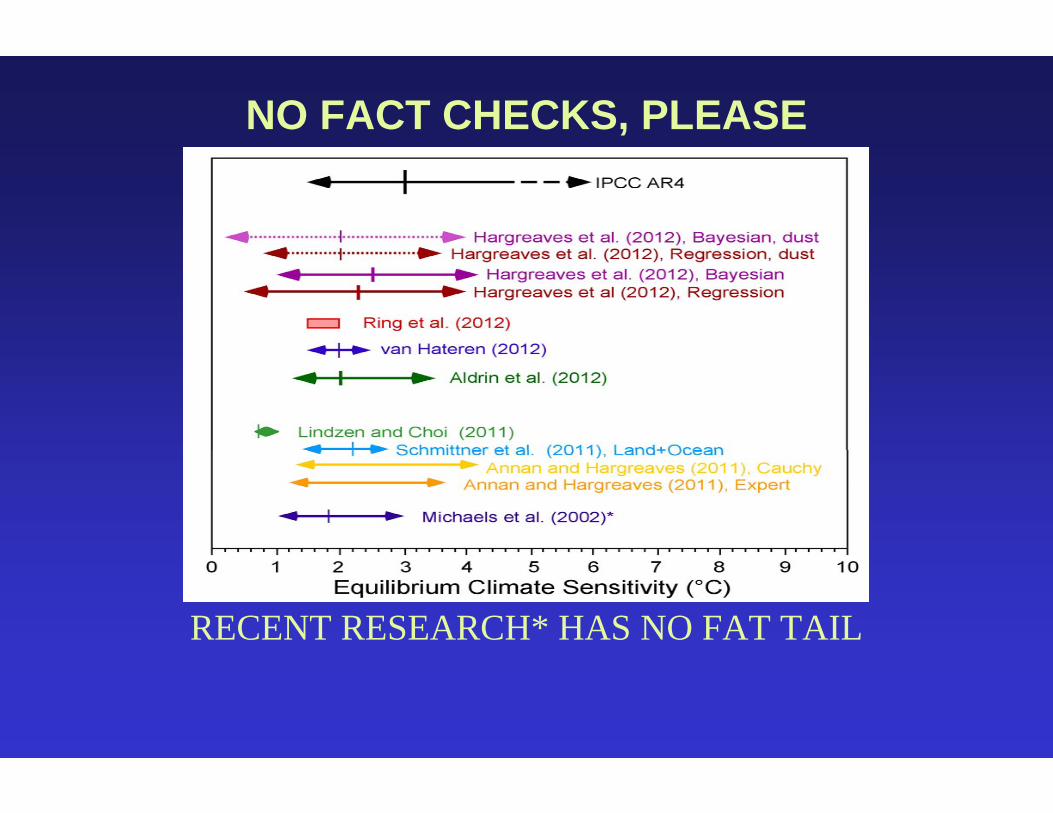
NO FACT CHECKS, PLEASE
RECENT RESEARCH* HAS NO FAT TAIL
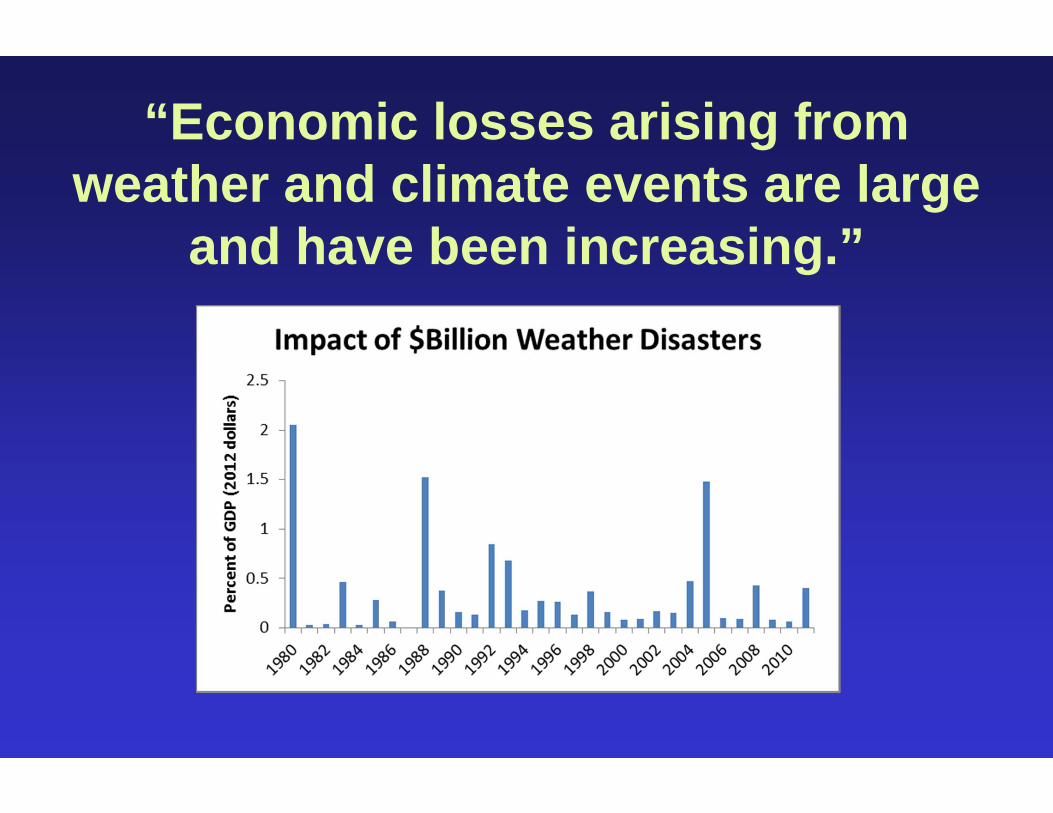
“Economic losses arising from weather and climate events are large
and have been increasing.”
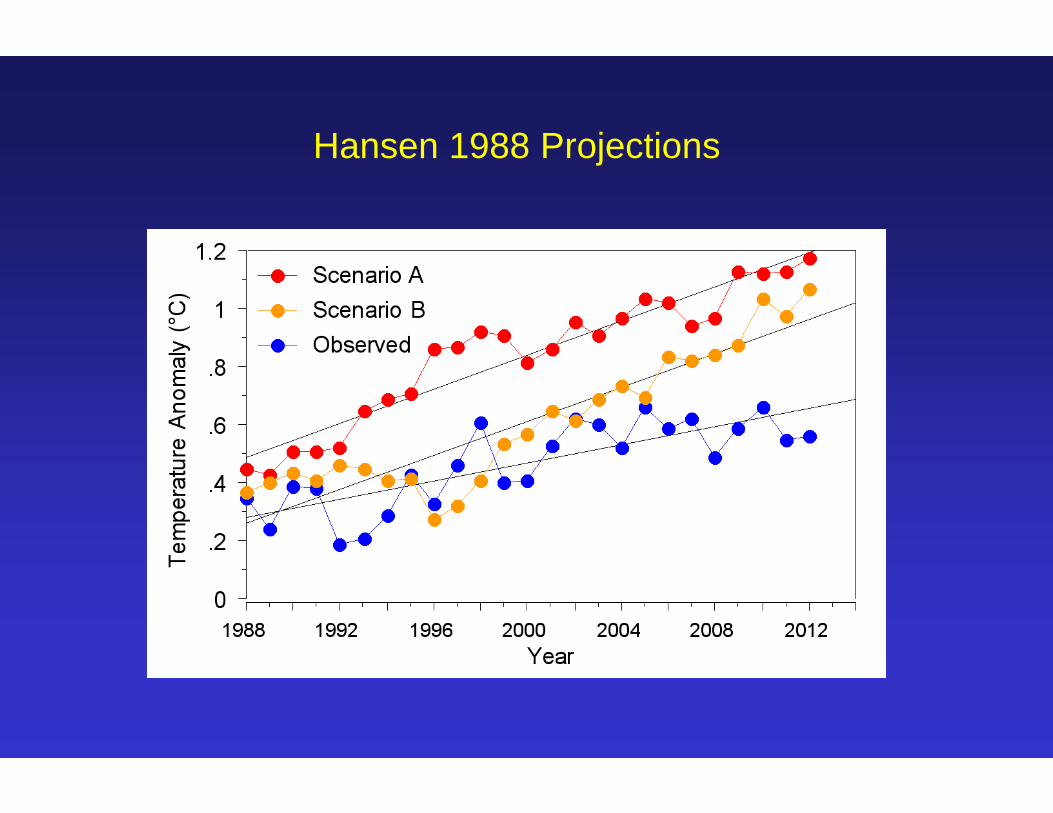
Hansen 1988 Projections
Why is Warming Rate so Low?
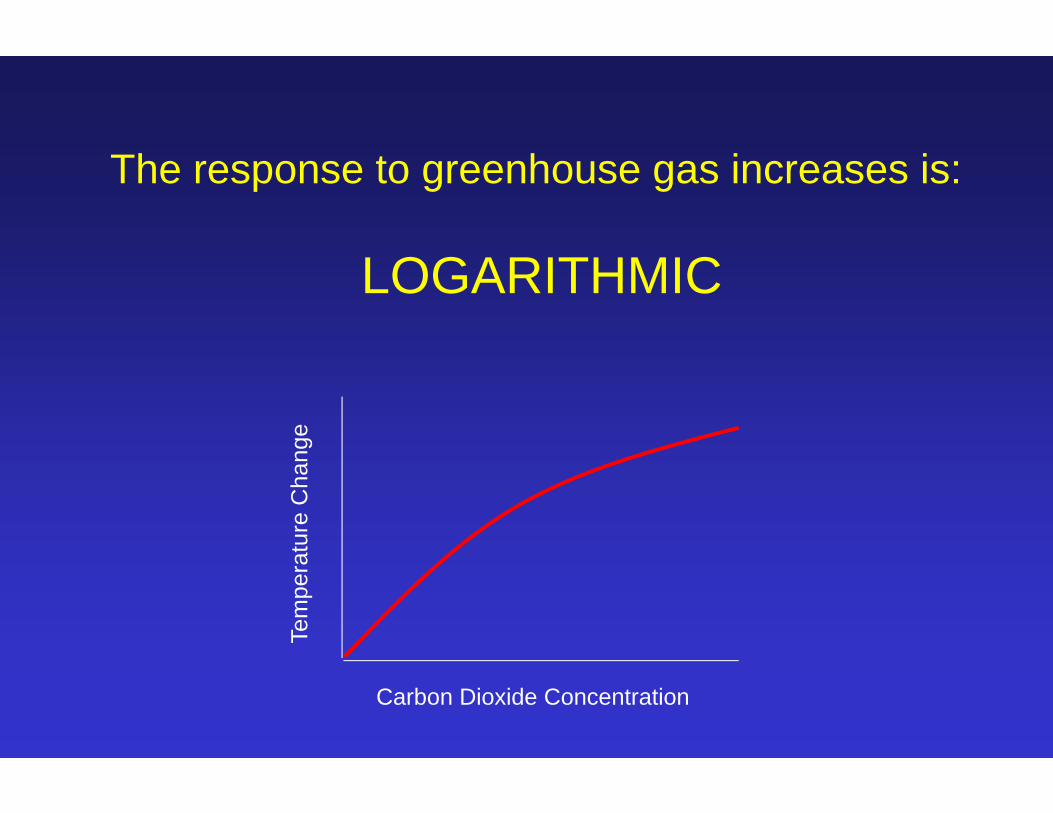
The response to greenhouse gas increases is:
LOGARITHMIC
Carbon Dioxide Concentration
Tem
pera
ture
Cha
nge
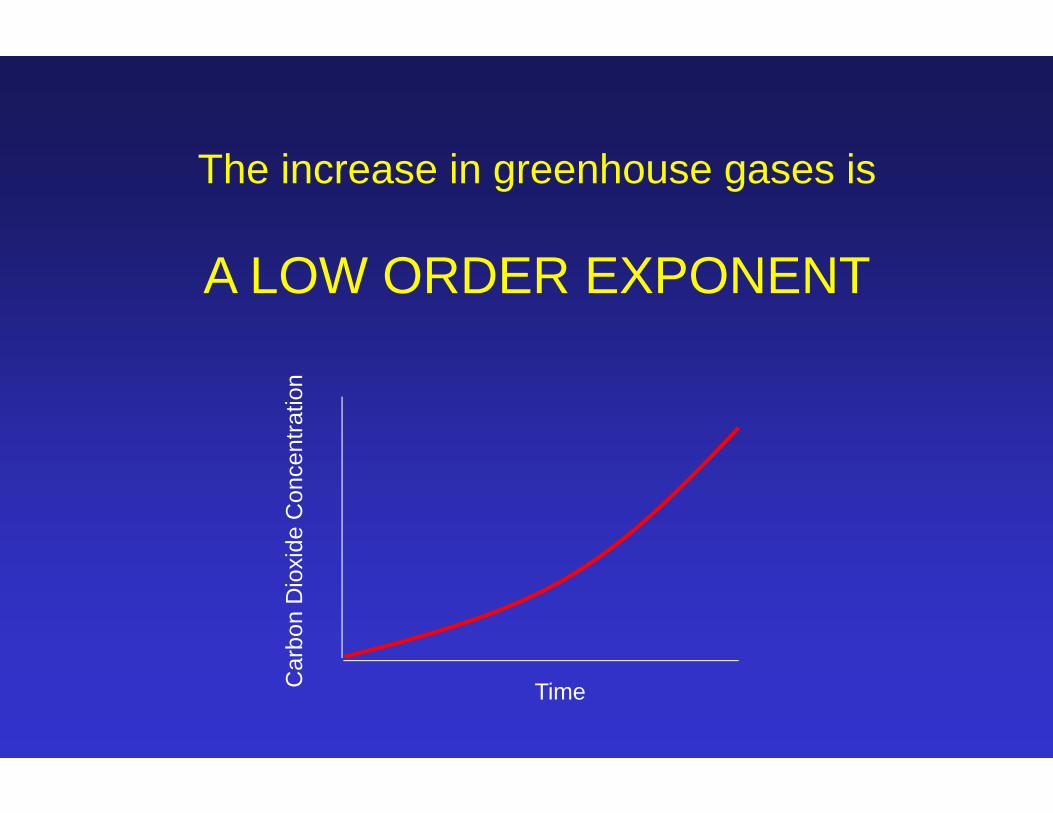
The increase in greenhouse gases is
A LOW ORDER EXPONENTC
arbo
n D
ioxi
de C
once
ntra
tion
Time
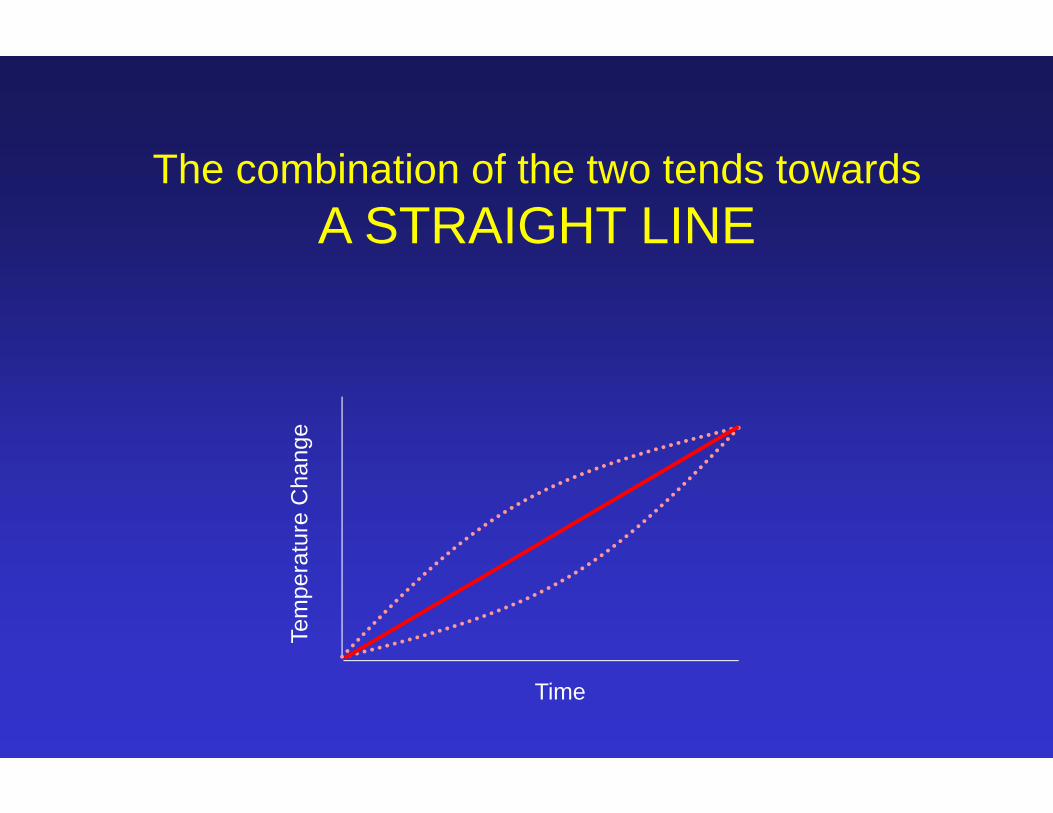
The combination of the two tends towardsA STRAIGHT LINE
Time
Tem
pera
ture
Cha
nge
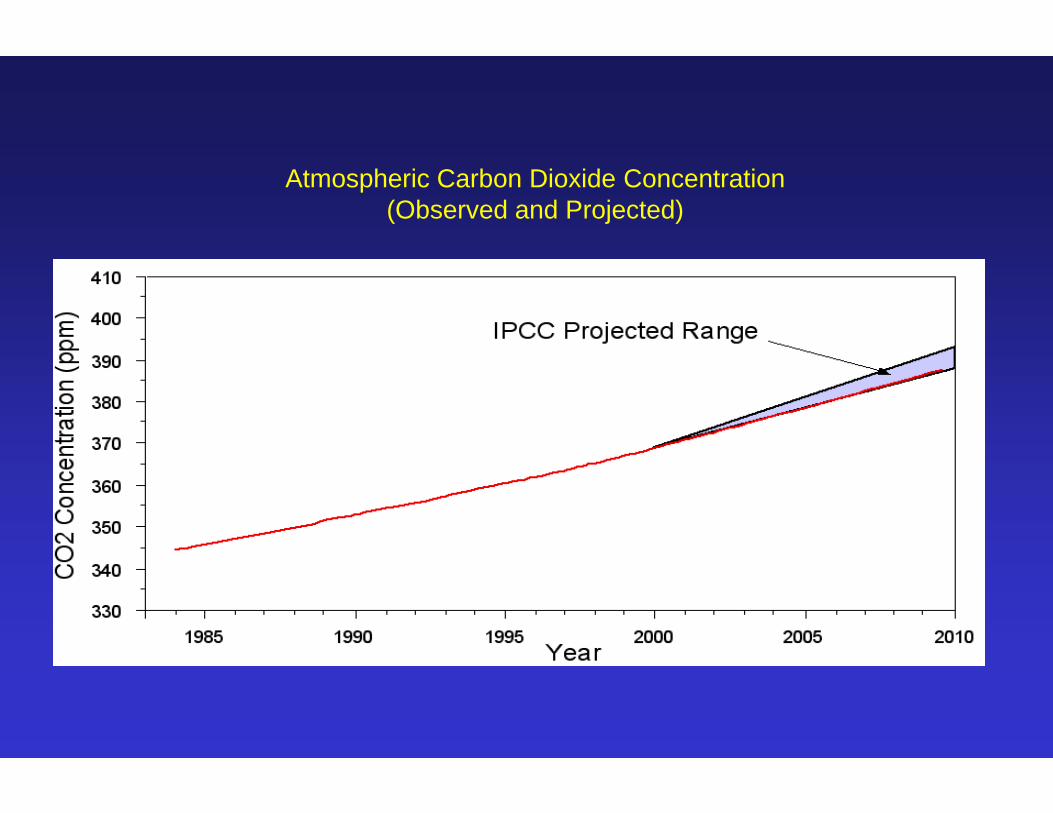
Atmospheric Carbon Dioxide Concentration(Observed and Projected)
METHANE
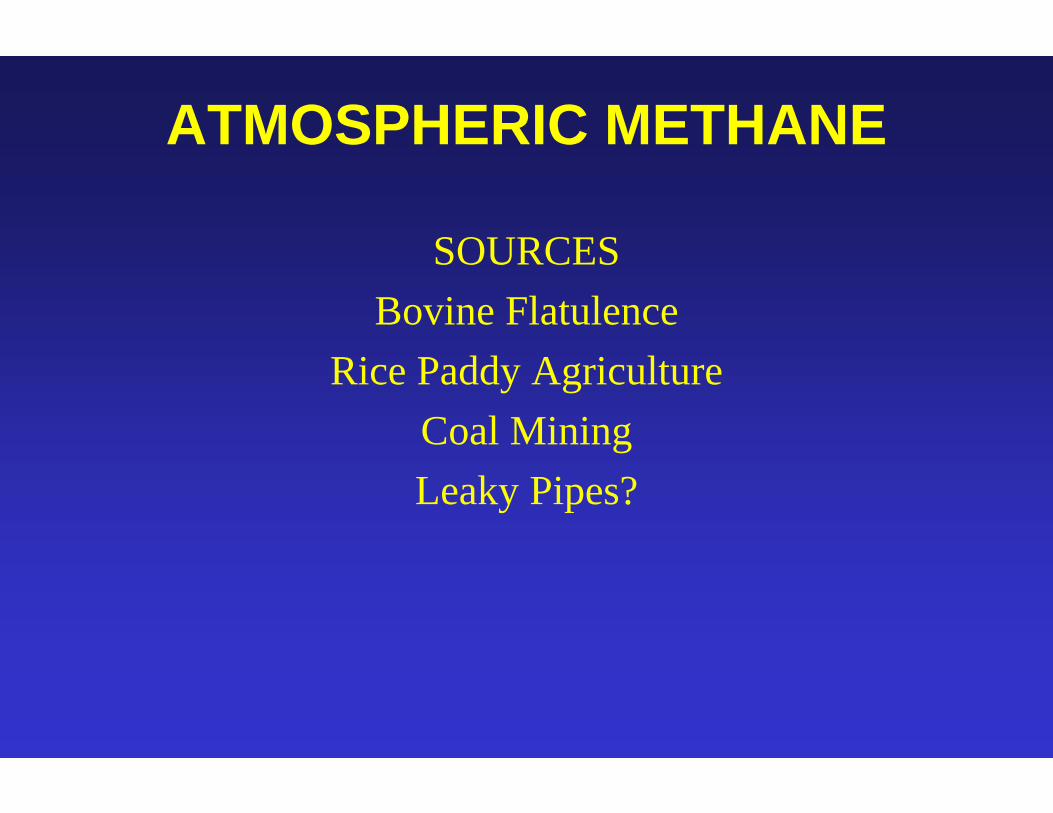
ATMOSPHERIC METHANE
SOURCESBovine Flatulence
Rice Paddy AgricultureCoal MiningLeaky Pipes?

Atmospheric Methane (Duglokenky 09)IPCC 2001 (same as 2007) Overlay
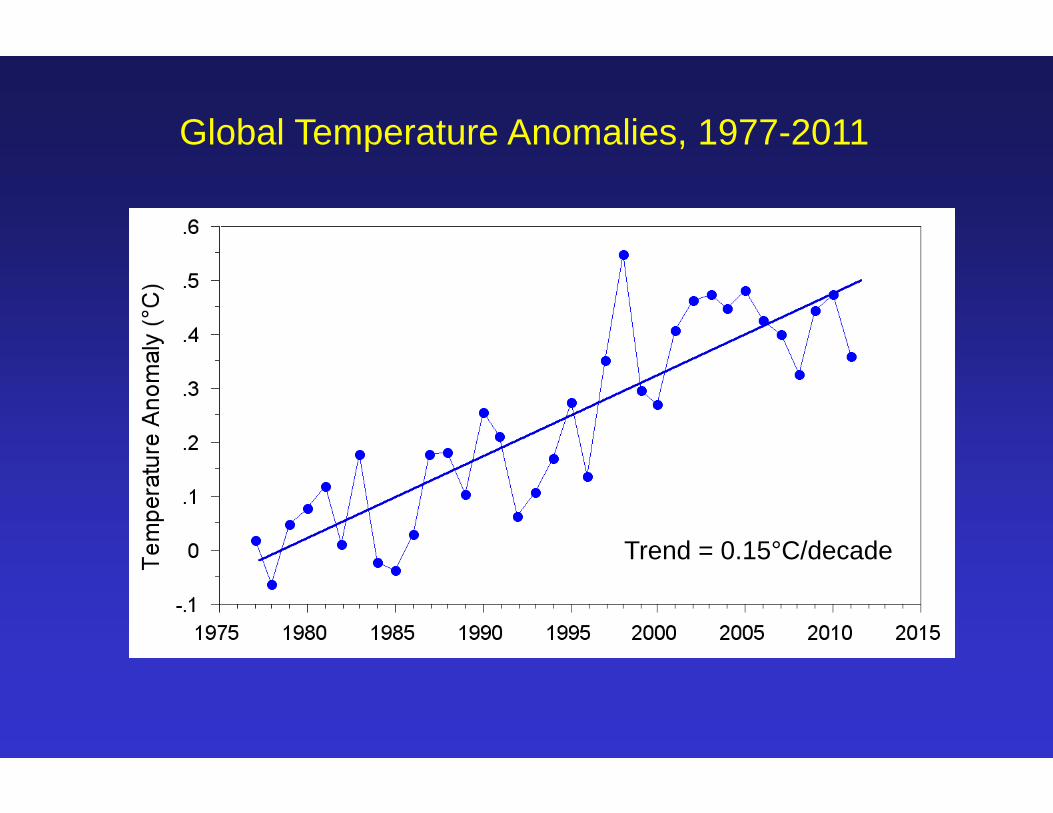
Global Temperature Anomalies, 1977-2011
Trend = 0.15°C/decade

Projected (A1B) and Observed Temperatures
Observed Trend
Model Projections