PATHWAYS TO FORECLOSURE: A Longitudinal Study of …
30
PATHWAYS TO FORECLOSURE: A Longitudinal Study of Mortgage Loans, Cleveland and Cuyahoga County, 2005-2008 Claudia Coulton Tsui Chan Michael Schramm Kristen Mikelbank June 2008 Center on Urban Poverty and Community Development Mandel School of Applied Social Sciences Case Western Reserve University Cleveland OH http://povertycenter.case.edu http://neocando.case.edu This is one of a series of reports on the foreclosure and lending crisis made possible through the generous support of The Cleveland Foundation and The George Gund Foundation. April Hirsh and Brian Wibby assisted in the preparation of the report and members of the Vacant and Abandoned Property Action Council provided advice and comments. For more information contact Claudia Coulton, [email protected] or 216-368-2304.
Transcript of PATHWAYS TO FORECLOSURE: A Longitudinal Study of …

PATHWAYS TO FORECLOSURE: A Longitudinal Study of Mortgage Loans,
Cleveland and Cuyahoga County, 2005-2008
Claudia Coulton Tsui Chan
Michael Schramm Kristen Mikelbank
June 2008
Center on Urban Poverty and Community Development Mandel School of Applied Social Sciences
Case Western Reserve University Cleveland OH
http://povertycenter.case.edu
http://neocando.case.edu
This is one of a series of reports on the foreclosure and lending crisis made possible through the generous support of The Cleveland Foundation and The George Gund Foundation. April Hirsh and Brian Wibby assisted in the preparation of the report and members of the Vacant and Abandoned Property Action Council provided advice and comments. For more information contact Claudia Coulton, [email protected] or 216-368-2304.

http://povertycenter.case.edu Pathways to Foreclosure
Center on Urban Poverty and Community Development 1
PATHWAYS TO FORECLOSURE: A Longitudinal Study of Mortgage Loans,
Cleveland and Cuyahoga County, 2005-2008
Introduction: Purpose and summary of findings
Foreclosure rates in Northeast Ohio have grown exponentially in recent years and present unprecedented challenges for communities, governments and households. Subprime lending has also increased markedly as a proportion of all mortgage loans originated in the region during this period and is widely believed to have played an important role in the current foreclosure crisis. The purpose of this study is to take a deeper look at the connection between foreclosures and the circumstances surrounding the mortgage loans that are the subject of these foreclosure filings. The focus of the analysis is on mortgage loans that were originated in Cuyahoga County in 2005 and 2006 and foreclosed between 2005 and early 2008. The study is unique in that it uses probabilistic matching techniques to link mortgage records from HMDA (Home Mortgage Disclosure Act) with locally recorded mortgage documents and foreclosure filings. The HMDA record contains information on whether the interest rate on the mortgage exceeds a threshold and in this study these are referred to as high cost subprime loans. By linking HMDA and local records, it is possible to examine the influence of high cost subprime lending on foreclosures while also taking into account other characteristics of lenders, loans, borrowers and neighborhoods. Furthermore, local records can be tapped to describe the pathway that high cost subprime loans traverse from origination to foreclosure.
The study finds that by far the strongest predictor of a loan foreclosing is its status as a high cost subprime loan. Holding other factors constant, home purchase loans that were high cost subprime had an 816 percent higher chance of going into foreclosure than other loans. Indeed subprime lending accounted for 84 percent of the foreclosures on home purchase and refinance loans in the study period. And because the study tracked loans for only three years at the most, this is an underestimate of the ultimate subprime foreclosure impact. Foreclosure rates on high cost subprime loans peaked early in the second year after origination and again as year three approached suggesting that some loans are in trouble from the outset while others become problematic due to events later on. A large racial disparity was identified in that African American borrowers at all income levels were much more likely to receive high cost subprime loans than their white counterparts leading to high rates of foreclosure in this population. High cost subprime foreclosures were also concentrated geographically fueling additional foreclosures in these areas. Although hundreds of lenders were active in the Cleveland area market, a relatively short list of lenders was responsible for originating most of high cost subprime loans that foreclosed. National mortgage companies, not local banks, dominated this list. As a result of securitization and servicing agreements, the plaintiffs filing the foreclosure actions were seldom the lenders who originated the loans. A few big companies dominated this stage in the process too, with five companies accounting for 70 percent of all high cost subprime loan foreclosure filings. When served with a foreclosure notice, only 16 percent of borrowers filed an answer with the court. Thus, without intervention, most of these high cost subprime foreclosed properties will proceed to sheriff’s sale and vacancy with all of the losses that entails for households and communities.

http://povertycenter.case.edu Pathways to Foreclosure
Center on Urban Poverty and Community Development 2
Background: Origins of the foreclosure crisis
Foreclosure rates have reached unprecedented levels in Cuyahoga County1 and across the State of Ohio. In Cuyahoga County, the number of foreclosures filings fourfold in just the past 12 years (See Figure 1).2 Subprime lending has been implicated as a key factor responsible for these soaring foreclosure rates and projections are that foreclosures will continue to rise as interest rates on these loans adjust and housing values decline.3
Figure 1: Foreclosure filings in Cuyahoga County, 1995-2007
Foreclosure Filings, Cuyahoga County
6959
8686
11120
33453645
3989
49255387
5900
8987
13943
14946
9773
0
2000
4000
6000
8000
10000
12000
14000
16000
1995 1996 1997 1998 1999 2000 2001 2002 2003 2004 2005 2006 2007
Year
Num
ber o
f For
eclo
sure
s
Prepared by: Center on Urban Poverty and Community Development, Mandel School of Applied Social Sciences, Case Western Reserve UniversitySource: Policy Matters Ohio. (2008). Foreclosure filings in Ohio, 1995-2007; Cuyahoga County.
Subprime lending has been a burgeoning part of the mortgage lending market. Nationally, subprime loans constituted less than 5 percent of mortgage originations in 1994 but had risen to 20 percent by 2005.4 In Cuyahoga County, 22.9 percent of the 2005 mortgage loans were originated by subprime lenders.5 These are lenders that are designated as such by U.S. Department of Housing and Urban Development (HUD) because the majority of their lending is determined to be subprime. Loans in this sector are generally made to borrowers with lower incomes and weaker credit histories than in the prime market. The loans have higher costs both in interest rates and fees than do prime loans. Moreover, these loans often require little or no
1 Coulton, C.J., Mikelbank, K. & Schramm, M. (2007). Foreclosure and Beyond: A report on ownership and housing values following sheriff’s sales, Cleveland and Cuyahoga County, 2000-2007. Cleveland, Case Western Reserve University, Center on Urban Poverty and Community Development. 2 Schiller, Z. & Hirsh, A. (2008). Foreclosure Growth in Ohio. Cleveland, Policy Matters Ohio. 3 See Schloemer, E., Wei, L., Ernst, K. & Kneest, K. (2006). Losing Ground: Foreclosures in the Subprime Market and their Cost to Homeowners. Washington DC, Center for Responsible Lending. 4 Gramlich, E. (2007). America’s Second Housing Boom. Washington DC, The Urban Institute. 5 Pleasants, C. & Brown, D.M. (2007). Cuyahoga County Community Lending Factbook. Cleveland, Housing Research and Advocacy Center.

http://povertycenter.case.edu Pathways to Foreclosure
Center on Urban Poverty and Community Development 3
down payment and have introductory interest rates that later reset higher. The lenders in the subprime sector are predominately mortgage companies, not depository institutions, and do not come under the same scrutiny of bank regulators. Within the sector, some operators use predatory tactics such as aggressive marketing in underserved areas, hidden fees and costs and loose standards for qualifying buyers.6 Moreover, the growing reliance on independent mortgage brokers in the subprime sector has led to considerable variation in the range of mortgage products offered to particular groups and neighborhoods.7 Broker originated subprime loans have higher interest and fees than those originated directly by lenders.8
Subprime lending and the resulting foreclosures are likely to have a disproportionate impact on the groups and communities that have been targeted for and attracted to this type of mortgage product. Indeed, mortgage markets, like housing markets, are segregated by race and income.9 There is, therefore, a geographic pattern to where the subprime lending occurs and where the foreclosures are concentrated in low income and minority neighborhoods. 10,11 Additionally, in some highly affected areas, speculators have compounded the problem by quick turnover of distressed properties at inflated prices.12
The sheer volume, along with the geographically concentrated pattern of subprime lending and the resulting foreclosures, has led to enormous cost burdens for homeowners, neighborhoods and local governments in the disproportionately affected areas. As foreclosures cumulate in an area they can undermine surrounding property values, fueling loss of equity and additional foreclosures over time.13 Moreover, if they are not quickly reoccupied, foreclosure can lead to abandoned properties that are projected to cost millions in terms of nuisance abatement and clean up.14
6 For a thorough analysis see Engel, K.C. & McCoy, P. (2002). Tale of three markets: The law and economics of predatory lending. Texas Law Review, 80 (6), 1255-1367. 7 For a discussion of variation in loan processing channels see Avery, R.B., Brevoort, K.P., and Canner, G.B. (2006). Higher price home lending in the 2005 HMDA data. Federal Reserve Bulletin, A123-A166. 8 A study of borrowers who were matched on credit-worthiness and subprime loan status compared those who used mortgage brokers versus those who went directly to the lender. The brokered loans had higher costs. Ernst, K., Bocian, D. & Li, W. Steered Wrong: Brokers, Borrowers and Subprime Loans. Washington DC, Center for Responsible Lending. 9 Lauria, M. & Baxter, V. (1999). Residential mortgage foreclosure and racial transition in New Orleans. Urban Affairs Review, 34 (6), 757-786. 10 For documentation of these patterns in Chicago, see Immergluck, D. & Smith, G. (2005). Measuring the effect of subprime lending on neighborhood foreclosures. Evidence from Chicago. Urban Affairs Review, 40 (3), 362-389. 11 For documentation of these patterns in Shaker Heights, see Apgar, W.C. & Duda, M. (2007). Understanding Mortgage Foreclosure Trends in Shaker Heights, OH. Boston, Joint Center for Housing Studies, Harvard University. 12 Known as flipping, a study released in June 2008 by the Slavic Village Vacant and Abandoned Property Task Force documents many instances of this activity and its contribution to the foreclosure crisis there. 13 Foreclosures have spillover effects on property values. For evidence from Chicago Immergluck, D. & Smite, G. (2006). The external costs of foreclosure: The impact of single-family mortgage foreclosures on property values. Housing Policy Debate, 17 (1), 57-79. For evidence that proximity to foreclosed houses affects sales prices of Cleveland homes see Dubin, Robin (2008). Foreclosures in Cleveland, Working Paper, Economics Department, Case Western Reserve University. For a discussion of the potential impact of on cities, see Squires, G.D. (2008). Do subprime loans create subprime cities? Washington DC, Economic Policy Institute. 14 A report issued by Rebuild Ohio (2008) documents the costs in selected Ohio counties and neighborhoods.

http://povertycenter.case.edu Pathways to Foreclosure
Center on Urban Poverty and Community Development 4
Methodology: How the study was done
We created a special data file for this analysis that linked loan origination documents with local property information and transaction documents and court records. This data file is referred to as the Loan Origination and Foreclosure Matched Data File. This file is comprised of a sample of loan origination records from the 2005 and 2006 HMDA files15 that we were able to link to loan documents filed with the Cuyahoga County Recorder. A full description of the record linkage methodology appears in Appendix A. We were able to match 68 percent of the HMDA records to their local loan origination documents. As demonstrated in Appendix A, there were no statistically significant differences between the matched and unmatched loans on their loan, lender or borrower characteristics.16
From the local loan origination documents we obtained the date of the loan and the parcel number for the property, which then allowed us to search the foreclosure filings records of the Cuyahoga County Clerk of Courts to determine if and when a foreclosure was filed. Additionally, by linking the parcel number to Cuyahoga County Auditor records it was possible to determine the assessed market value and the sales price of the property at the time of loan origination, as well as whether there was a sheriff’s auction of the property.
This study based on linked HMDA records with local records provides an advantage over previous studies of the relationship between subprime lending and foreclosure. A number of studies17 have inferred that subprime loans are at higher risk of foreclosure than prime loans from examining whether rates of subprime lending are correlated with foreclosure rates in census tracts. However, such studies are not able to take into account individual borrower characteristics or other features of the lender in estimating the chances that loans will go into foreclosure. An alternative has been to mine lending industry databases to investigate the influence of loan and borrower characteristics on default rates. A limitation, though, is that these databases are incomplete and do not cover all of the mortgages that are in HMDA, and may miss a number of the foreclosed loans in any particular local area.
Data sources
HMDA (Home Mortgage Disclosure Act) records are supplied by lenders, who are required by law to submit information on loan originations. For this analysis, we selected home purchase loans and refinance loans. Home improvement loans are not included as they are a very small percentage of the loans originated and reporting on these is incomplete. In addition, we use the following information from the HMDA record:
• High cost subprime loan: If the annual percentage rate (APR) of the loan is more than 3 percent (or 5 percent in the case of junior-liens) above the yield of a Treasury security of comparable maturity at the time the loan was made, the loan is classified as high cost.
15 This study begins with 2005 loans because the Cuyahoga County Clerk of Courts did not add parcel number to the foreclosure filing docket information until November 2005. There was no practical way to link mortgage documents to foreclosure filings prior to this change. 16 Given this close match and the large sample sizes we can have a high degree of statistical confidence in estimates that come from these data (CI.95=±0.5 percent). 17 See for example, Apgar & Duda, 2007 cited previously.
http://povertycenter.case.edu Pathways to Foreclosure
Center on Urban Poverty and Community Development 5
This is a proxy for subprime lending. In the study, we refer to these as high cost subprime loans. It should be noted that such high cost loans can be made by any lender, not just those classified as subprime lenders by HUD. Additionally, there is no other information in HMDA to indicate whether the loan has other features such as variable interest or prepayment penalties that could affect foreclosure.
• Race of borrower: Race and Hispanic origin of the borrower are reported by the lender.
• Income of borrower: Income of the borrower is reported on the loan application (it may or may not be verified by the lender).
• Owner occupied: This information is self reported by the borrower to the lender.
• Piggy back loan: If there is a junior-lien on the property, taken at the same time as the first lien, the mortgage is classified as having a piggy back loan. A piggy back loan is sometimes used so that there is no down payment or to keep a loan under the conforming size amount.
• Name of lender: This is the company name of the lender who originated the loan.
The Cuyahoga County Recorder maintains records on mortgage loan actions. From this data source, we matched the HMDA loan with the local record(s) filed at loan origination. The parcel number of the property, date and amount of the loan(s) were ascertained from this record. We also tracked the parcel to determine whether a record was filed showing that the loan was satisfied, allowing us be confident that foreclosure filings were linked to the correct loan .
We then searched the docket of the Cuyahoga County Clerk of Courts through April 30, 2008 to determine whether there was a record of a foreclosure filing on the parcel at any time after the date of the loan origination but before any loan satisfaction record was filed.18 Since our interest was in mortgage foreclosures, we did not count foreclosure filings that were for unpaid property taxes. As a check on whether foreclosure filings may have been missing in the computerized Clerk of Courts’ docket, we also searched the Cuyahoga County Sheriff’s auction records to determine whether the property was sold at auction. For those few properties with a sheriff’s sale but no foreclosure filing, we estimated the foreclosure filing date using information about the median length of time that elapsed between foreclosure and sheriff’s auction in the County. Finally, for a random sample (N=1,185) of high cost subprime loans that had foreclosure filings, we examined the actual court documents to determine the name of the company listed as the plaintiff and to find out whether the homeowner defendant filed an answer or was represented by an attorney in the foreclosure action.
Variable specification and data analysis
Using the above data sources, we created a number of variables for the analysis. Foreclosure timing was defined as the number of days from loan origination to foreclosure and was calculated by comparing the date of loan origination in the County records with the date of
18 Foreclosure filings in Federal court are not included in this study because they are small in number and would have required seeking an additional data source.
http://povertycenter.case.edu Pathways to Foreclosure
Center on Urban Poverty and Community Development 6
foreclosure filing in the court. For home purchase loans, we calculated the loan to sales price ratio by dividing the sum of the senior and junior loan (if applicable) by the recorded sales price at the time the loan was originated. For refinance loans, we calculated the loan to value ratio by dividing the total loan amount by the County Auditor’s assessed market value of the property.19 Borrower income was categorized based on the ratio of income to HUD’s classification based on area median income (AMI). Borrower’s race/ethnicity was categorized into Non-Hispanic white, Non-Hispanic black, Hispanic and Other. In some analyses, Hispanics and others could not be included due to small sample sizes. Using the names of lenders in the HMDA records we categorized type of lender as local bank, other bank or non-bank. Non-banks are lenders that are not listed in the FDIC institutions. Local banks are ones with offices within or a short distance from Cuyahoga County.20
A central purpose of the data analysis is to examine the characteristics of loans, lenders and borrowers that are associated with the risk of foreclosure. Home purchase loans and refinance loans are analyzed separately because their foreclosure rates differ, and it is anticipated that the risk factors for foreclosure may differ as well. In order to jointly examine the several factors that may influence the chances that a loan forecloses we estimate a survival model. A survival model was chosen for the analysis because the loans in this study are only observed for a limited period of time and some will undoubtedly foreclose after the study period ends. Survival models allow this limitation on observation period to be taken into account while estimating the influence of the risk factors on the time to the foreclosure for the cases that do foreclose.21
Findings: From loan origination to foreclosure
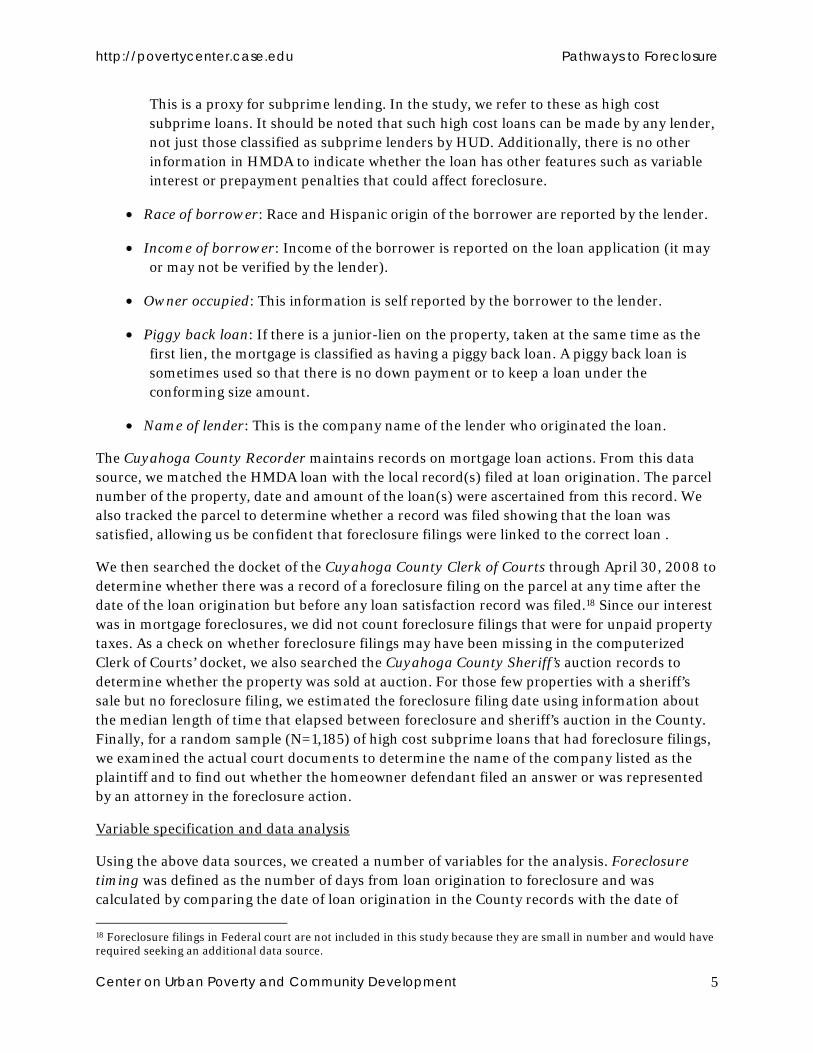
Loans that were originated in 2005 and 2006 were tracked through April 2008 to determine whether they had gone into foreclosure by that point. It should be noted that loans made at the beginning of 2005 were tracked for approximately three years while those made at the end of 2006 were tracked for less than two years. Table 1 presents the foreclosure rates by year of loan origination for all loans as well as separately for home purchase and refinance loans. By April 2008, 13.40 percent of the 2005 loans and 10.17 percent of the 2006 loans had gone into foreclosure. Foreclosure rates were higher for home purchase loans than for refinance loans. Home purchase loans made in 2005 and 2006 had foreclosure rates during the study period of 17.64 percent and 13.55 percent respectively. For refinance loans, foreclosure rates were 9.72 percent on 2005 loans and 6.71 percent on 2006 loans.
19 Properties in Cuyahoga County were reassessed in 2003 and 2006. For properties with loans made in 2005, we had to adjust the 2003 assessments to 2005 market values. This was accomplished by applying a repeat sales index that was developed by Ricardo Bodini as part of the Dynamic Neighborhood Typologies Project, RW Ventures, Chicago IL. Since the County completed a reappraisal in 2006, it was not necessary to adjust the assessed market values for the 2006 loan to value ratios. 20 The lender classification by name was provided by O. Emre Ergungor, Economist, Federal Reserve Bank of Cleveland. 21 When the observation period is limited, the problem is known as right censoring. Survival models are appropriate for censored outcomes or events. The Cox proportional hazards model was chosen for the analysis because the time to foreclosure is a continuous measure and the proportional hazards assumption was met. Even though foreclosures are spatially clustered, the residuals from the model were not spatially autocorrelated when we included the number of foreclosures within 500 feet of the property as a variable in the model.

http://povertycenter.case.edu Pathways to Foreclosure
Center on Urban Poverty and Community Development 7
Risk factors for foreclosure
A variety of factors can trigger foreclosure including events that affect the borrowers’ situation (e.g., income loss, illness, divorce), decrease in the relative value of the house as an asset (e.g., declining property values) or issues with the cost or terms of the loan (e.g., unexpected costs, interest rate adjustments). Although these changes cannot be directly observed in this study, particularly borrowers’ personal situations, there are a number of reasons this study focuses on high cost subprime loans. High cost subprime loans often involve expenses that were not anticipated by the borrower or entail cost increases due to interest rate adjustments. Moreover, borrowers who take subprime loans may be more vulnerable to financial setbacks and have less equity in their homes than borrowers with prime rate loans. Neighborhoods with high numbers of subprime loans may have experienced inflated housing valuations or declining sales prices. Additionally, the lenders that originate subprime loans are typically ones without local offices, a factor that may impede the quality of information available to the lender and borrower or the quality of the services involved in the transaction. Thus, there are a number of reasons to anticipate that high cost subprime loans would be at higher risk of foreclosure and, indeed, they accounted for 84 percent of all the foreclosures in the study sample.
The second row in Table 1 compares the foreclosure rates for high cost subprime loans with other loans. High cost subprime loans had foreclosure rates 9 to 10 times higher than prime loans, although the magnitude of the gap differed somewhat based on year and whether the loan was for home purchase or refinance. For loans made in 2005, 32.56 percent of the high cost subprime loans foreclosed as compared with only 3.64 percent of the prime loans. Also shown in Table 1 are other factors that influenced the chances of foreclosure. Loans made in 2005 on homes that were not owner occupied had foreclosure rates of 30.95 percent as compared to 10.75 percent of loans to owner occupants. Properties with a junior or piggy back loan foreclosed 19.60 percent of the time compared to a 12.11 foreclosure rate for homes with one loan. Loans from mortgage companies and banks without local branches had foreclosure rates of 19.08 percent compared to only 2.43 percent for loans from local banks. There were also racial disparities in risk of foreclosure among loans originated in 2005. African American borrowers had the highest foreclosure rates (28.25 percent), Non-Hispanic whites had the lowest (7.58 percent), and Hispanic borrowers had moderate foreclosure rates (12.83 percent). With respect to income, there was an inverse relationship between income category and foreclosure rates. Rates of foreclosure also differed by selected neighborhood characteristics. For example, 31.73 percent loans originated in 2005 in neighborhoods that were more than 75 percent African American foreclosed as compared to foreclosure rates of 8.90 percent in neighborhoods that were less than 25 percent African American. Neighborhoods with poverty rates above 20 percent also had relatively high foreclosure rates, as did neighborhoods in which the median home sales price was less than $60,000. Thus, there are a number of loan, lender, borrower and neighborhood characteristics that differentiate loans that foreclosed during the study period from those that did not have a foreclosure filing during the window of observation in this study. However, to ascertain how these factors fit together and relate to one another requires a more elaborate analysis that is presented in the next section.

http://povertycenter.case.edu Pathways to Foreclosure
Center on Urban Poverty and Community Development 8
Table 1: Percent of home purchase and refinance mortgage loans foreclosed by selected characteristics
2005 2006 2005 2006 2005 2006Percent Percent Percent Percent Percent Percent
All home purchase and refinance loans 13.40 10.17 17.64 13.55 9.72 6.71
High cost subprime loan Yes 32.56 24.57 42.98 33.47 22.72 15.41 No 3.64 2.11 3.84 2.34 3.47 1.88Owner-occupied Yes 10.75 7.53 13.62 9.73 8.42 5.41 No 30.95 25.47 38.15 31.75 21.07 16.26Piggyback loan Yes 19.60 14.22 23.71 17.16 10.19 7.37 No 12.11 9.24 15.52 12.30 9.67 6.63Loan to value ratio <= 110% 5.93 4.39 > 110% 17.86 13.26Loan to price ratio
<=80% 7.44 6.40> 80% 23.84 17.88
Local bank Yes 2.43 1.88 3.31 2.27 1.70 1.53 No 19.08 15.19 24.80 19.72 14.01 10.20
Race/ Ethnicity Non-Hispanic White 7.58 4.89 8.26 5.15 6.99 4.64 Non-Hispanic Black 28.25 23.50 39.08 31.29 16.90 12.76 Hispanic 12.83 9.46 16.03 11.23 9.70 7.24 Other or Race Unknown 15.60 10.94 22.73 16.52 11.27 7.22Income of borrower1
Low income (<50% AMI) 20.34 13.93 27.79 19.01 14.16 9.18 Moderate income (50-80% AMI) 18.04 13.24 23.09 17.60 12.38 7.56 Middle income (81-120% AMI) 12.65 9.98 16.46 13.97 9.41 6.09 Upper income (>120% AMI) 8.51 7.03 10.22 7.99 7.10 6.14
Racial mix2
< 25% African American 8.90 6.31 10.55 7.75 7.41 4.80 25% to 49% African American 19.72 15.87 25.42 22.48 13.93 8.71 50% to 74% African American 20.01 18.88 30.97 27.26 12.29 11.24 75%+ African American 31.73 25.56 48.82 37.68 18.58 13.96Poverty Rate2
< 10% 7.98 5.91 9.07 7.02 7.04 4.80 10% to 19% 16.77 13.68 24.04 18.21 11.05 9.12 20% to 39% 32.69 25.97 45.64 37.65 20.40 13.24 40%+ 36.54 31.93 53.69 40.97 19.29 18.78Median sales price of single-family homes3
< $60,000 34.65 26.83 50.41 38.61 20.34 13.82 $60,000 - $119,999 16.12 11.77 21.02 15.68 12.09 7.94 $120,000 - $179,999 7.29 5.16 8.54 5.69 6.18 4.60 $180,000+ 4.45 3.10 4.32 3.05 4.56 3.15
1 Income of borrower is calculated based on applicant's income and HUD's area median income (AMI) in the HMDA data.2 Racial mix and poverty rate are calculated based on the 2000 census data.3 Median sales price of single-family home is based on the Real Property File from the Cuyahoga County Auditor's Office.
Percent of home purchase and refinance mortgage loans foreclosed, Cuyahoga County
Source: Loan Origination and Foreclosure Matched Data File, Center on Urban Poverty and Community Development, Mandel School of Applied Social Sciences, Case Western Reserve University
Lender Characteristics
Borrower Characteristics
Neighborhood Characteristics
Year Loan Originated Year Loan Originated Year Loan Originated
Loan Characteristics
All Loans Home Purchase Loans Home Refinance Loans

http://povertycenter.case.edu Pathways to Foreclosure
Center on Urban Poverty and Community Development 9
Timing of foreclosure risk
The risk factors examined in Table 1 above do not operate in isolation but tend to be overlapping or correlated. Moreover a loan with multiple risk factors is likely to have a higher chance of foreclosure than one with only one risk factor. For example, high cost subprime loans are more often made by out of town lenders to African American borrowers in low income neighborhoods, so it is difficult to disentangle these effects or calibrate their combined influence. Therefore, a statistical model was estimated that allowed the joint analysis of multiple interrelated factors on the risk of foreclosure. The statistical model was a survival model, a method that is appropriate for event data such as foreclosures when cases are followed for varying lengths of time and not all cases experience the event within the observation window. The detailed results of this modeling are presented in Appendix B. The findings from the modeling are illustrated in Figures 2a-d. In these figures, the model is used to generate survival curves and smoothed hazard functions for groups defined by selected risk factors. The risk factors that are shown in the figures are the two that were found in the model to have the highest statistical impact on foreclosure rates: whether or not the loan was high cost subprime and whether or not the borrower was African American. Other risk factors, such as income, loan to value ratio, owner occupancy and neighborhood characteristics, are held constant (or statistically controlled) in the survival curves and hazard functions. It should be noted that although the statistical model was able to control for a number of risk factors, important variables were missing from the data sources. For instance, the model was not able to control for other characteristics of subprime loans besides high interest rates that may have impacted certain borrowers such as whether or not the loan had an adjustable rate, a prepayment penalty, or extra fees. Moreover, there was no way to take into account the role that speculation may have played even though such activities have been documented.22
Figures 2a and 2b show survival curves for home purchase and refinance loans respectively. These curves represent the percentage of loans that are estimated to “survive” without having a foreclosure filing as time elapses from origination of the loan. Time is calibrated in months. Comparing Figure 2a and 2b it can be seen that home purchase loans default earlier and at higher rates than refinance loans, but for both types high cost subprime loans are at much greater risk of not surviving intact. Subprime loans to African American home purchasers have the least chances of surviving for 36 months. For example, focusing on Figure 2a, the survival model estimates that only about 40 percent of high cost subprime home purchase loans to African American borrowers will be in place after three years, whereas 85 percent of prime loans to African American borrowers will still be intact. For whites approximately 60 percent of high cost subprime home purchase loans will survive for three years while approximately 99 percent of their prime loans will avoid foreclosure.
22 Known as flipping, a study released in June 2008 by the Slavic Village Vacant and Abandoned Property Task Force documents many instances of this activity and its contribution to the foreclosure crisis there.

http://povertycenter.case.edu Pathways to Foreclosure
Center on Urban Poverty and Community Development 10
Figure 2a: Survival functions for home purchase loans.
Survival Function for Home Purchase Loans
0
0.1
0.2
0.3
0.4
0.5
0.6
0.7
0.8
0.9
1
0 2 4 6 8 10 12 14 16 18 20 22 24 26 28 30 32 34 36
Months
Surv
ival
Fun
ctio
n
subprime- blacksubprime- whitenot subprime-blacknot subprime- white
Source: Loan Origination and Foreclosure Matched Data File, Center on Urban Poverty and Community Development, Mandel School of Applied Social Sciences, Case Western Reserve University
Figure 2b: Survival functions for home refinance loans.
Survival Function for Home Refinance Loans
0
0.1
0.2
0.3
0.4
0.5
0.6
0.7
0.8
0.9
1
0 2 4 6 8 10 12 14 16 18 20 22 24 26 28 30 32 34 36
Months
Surv
ival
Fun
ctio
n
subprime- blacksubprime- whitenot subprime- blacknot subprime-white
Source: Loan Origination and Foreclosure Matched Data File, Center on Urban Poverty and Community Development, Mandel School of Applied Social Sciences, Case Western Reserve University

http://povertycenter.case.edu Pathways to Foreclosure
Center on Urban Poverty and Community Development 11
Figures 2c and 2d show smoothed hazard rate functions23 for home purchase and refinance loans respectively. These curves reflect a moving average of the risk of foreclosure over time. The high points in the curve indicate the timing of greatest foreclosure risk. For example, with respect to home purchase loans (Figure 2c) it can be seen that many high cost subprime loans foreclose sometime between one and two years, but that the peak foreclosure period is earlier and higher for African American borrowers than for other borrowers. Although a second peak foreclosure point seems to begin developing as high cost subprime loans approach three years out, it should be noted that most of the loans in the study were not observed long enough to be highly confidant of this second peak or to establish how long it lasts. However, the hazard function for home purchase loans suggests that there are many borrowers who have trouble paying their mortgages from the outset and that another group of borrowers is able to manage the loan until events (possibly interest rate adjustments) occur later on.
Figure 2c: Hazard functions for home purchase loans.
Hazard Function for Home Purchase Loans
0
0.005
0.01
0.015
0.02
0.025
0.03
0.035
0 5 10 15 20 25 30 35
Months
Haz
ard
Func
tion
subprime- blacksubprime- whitenot subprime-blacknot subprime- white
Source: Loan Origination and Foreclosure Matched Data File, Center on Urban Poverty and Community Development, Mandel School of Applied Social Sciences, Case Western Reserve University
The hazard functions for refinance loans (Figure 2d) show a somewhat different pattern. Foreclosure rates peak a bit later than for home purchase loans. There is a racial disparity in the hazard initially but it disappears by the end of the study observation period. Although there could be additional peak hazard periods in subsequent years not studied here, these estimates suggest that foreclosure prevention for high cost subprime loans, especially those made to African American borrowers, should start within the first six months of loan origination and continue up through 36 months when the chances of foreclosure still remain high.
23 The hazard rate function shows the moving average of the instantaneous probability that a foreclosure will be filed at a time point following origination. In a hazard function the specific units of the function are not interpretable, but the pattern reveals points in time in which the hazard rises and falls.

http://povertycenter.case.edu Pathways to Foreclosure
Center on Urban Poverty and Community Development 12
Figure 2d: Hazard functions for home refinance loans.
Hazard Function for Home Refinance Loans
0
0.002
0.004
0.006
0.008
0.01
0.012
0.014
0 5 10 15 20 25 30 35
Months
Haz
ard
Func
tion
subprime- blacksubprime- whitenot subprime-blacknot subprime- white
Source: Loan Origination and Foreclosure Matched Data File, Center on Urban Poverty and Community Development, Mandel School of Applied Social Sciences, Case Western Reserve University
Findings: The disproportionate impact of high cost subprime foreclosures
In Cleveland and Cuyahoga County, high cost subprime loans have already foreclosed in record numbers and it is anticipated that, given their high risk profile, these foreclosures will continue to accumulate. Next the analysis turns to the exploration of where these foreclosures are occurring and who was most likely to borrow in the subprime market. If there is a clustering of these subprime loans that foreclose, their effects may be magnified for those people and places that are disproportionately impacted.
Geography of high cost subprime foreclosures
A density map in Figure 3 shows concentrations of high cost subprime foreclosures in both the City of Cleveland and in some suburbs. The largest concentration is on the southeast side of the City which includes Slavic Village (North and South Broadway), Union Miles, Mt. Pleasant and parts of Buckeye-Shaker. This area incorporates much of zip code 44105, a zip code that has been identified as one with among the highest numbers of foreclosures in the nation. Additional areas of clustering in the City are in the northeast section which includes Glenville, Forest Hills, St. Clair-Superior and parts of Collinwood and the near west side areas of Clark Fulton, Stockyards, and parts of West Boulevard. East Cleveland also has a large cluster of high cost subprime foreclosures. Several smaller clusters are emerging in parts of Maple Heights, and Garfield Heights on the southeast, Euclid on the northeast, several sections of Cleveland Heights and the western corner of Shaker Heights.24 High cost subprime foreclosure rates broken out by
24 To test the statistical significance of concentration, we counted the number of subprime foreclosed loans in each block group and divided by the total number of loans originated in the block group in 2005-2006. Using spatial analysis statistics (i.e., Moran’s I), we find that there is a high and statistically significant degree of spatial

http://povertycenter.case.edu Pathways to Foreclosure
Center on Urban Poverty and Community Development 13
City of Cleveland neighborhood and suburban municipality can be found in Appendix C. There, it can be seen that the problem of high cost subprime foreclosures is a concern in the suburbs as well as in the City.
Figure 3: Density of High Cost Subprime Foreclosures
Since foreclosures have been shown to negatively affect surrounding property values, geographic concentration can in turn lead to additional foreclosures as equity is undermined even for borrowers that might have been able to keep their homes under other circumstances. In fact, the survival model analysis discussed above suggests that foreclosures beget foreclosures in a geographic sense. For example, the number of other foreclosures within a 500 foot buffer had a statistically significant affect on the hazard that a home purchase loan would foreclose. Specifically, an additional foreclosure within 500 feet increased the hazard by 40 percent (See Appendix B, Table B1). Although this study is not designed to uncover the explanation for this spatial influence, there are several possibilities worthy of further exploration. One is that foreclosures in the area reduce equity through their effects on property values,25 making it more
concentration of the subprime foreclosures and that there are particular clusters of activity in the City of Cleveland and a few suburban municipalities. 25 Dubin finds that foreclosures in Cleveland neighborhoods negatively affect sales prices of nearby properties. See Dubin, Robin (2008). Foreclosures in Cleveland, Working Paper, Economics Department, Case Western Reserve University.

http://povertycenter.case.edu Pathways to Foreclosure
Center on Urban Poverty and Community Development 14
likely that borrowers will default in a crisis because they cannot sell their home for enough to cover their loan and have no equity to protect. Another possibility is that that lending processes and products are geographically and racially differentiated, so that predatory practices such as inflated appraisals, no documentation, high fees and so forth have a spatial pattern that also produces a clustering of foreclosures.
High cost subprime lending by race and income
This geographic pattern of foreclosure described above suggests that people of color have been disproportionately affected by high cost subprime lending that led to foreclosure. To further illustrate this connection, in Figure 4 below the high cost subprime foreclosures are overlaid on a map that shows the percent of borrowers who are African American by census tract. It can be seen that the tracts with high proportions of African American borrowers are where large numbers of these loans have foreclosed.
Figure 4: Percent Loan Originations to African Americans
This raises the question as to the role that race has played in the origination of high cost subprime loans in Cuyahoga County. Figures 5a and 5b show the proportion of high cost subprime versus prime loans received by Non-Hispanic African American and white borrowers

http://povertycenter.case.edu Pathways to Foreclosure
Center on Urban Poverty and Community Development 15
within income categories. Each bar in the chart divides the total loans to the group of borrowers into high cost subprime and other (i.e. not high cost subprime). The hatched lines on the bars represent that portion of both types of loans that foreclosed in the study period. With respect to home purchase loans (Figure 5a), it can be seen that in every income category African American borrowers were 2 to 4 times more likely to receive high cost subprime loans than their white counterparts. The magnitude of the difference is the greatest in the high income category where 60 percent of loans to African American borrowers were high cost subprime despite their high income levels. Although the disparities by race are somewhat less for refinance loans (Figure 5b), they are still sizeable and in the same direction. Even though there are other factors such as credit scores that affect the evaluation of borrowers, the consistent disparities in high cost subprime loans between African American and white borrowers across all income categories is remarkable.
Also demonstrated by Figure 5 is the excess burden placed on African American borrowers due to receiving high cost subprime loans that engender high rates of foreclosure regardless of income level. Even high income, African American borrowers have high rates of foreclosure when they receive high cost subprime loans. Conversely, when they receive prime loans, high income African Americans have low foreclosure rates that are not much different from whites. It is true that whites also suffer increased foreclosure rates when their loans are high cost subprime, but even low income whites seldom receive such loans while, for African Americans, they are modal. This pattern, along with the geographic clustering suggests a racially and spatially segmented market for high cost subprime mortgage products in 2005 and 2006 in Cuyahoga County. Figure 5a: High Cost subprime lending and foreclosure rates by race and income of borrower, home purchase loans, Cuyahoga County
Home purchase loans, high cost subprime loans and foreclosure rates: Cuyahoga County
0%
20%
40%
60%
80%
100%
Black White Black White Black White Black White
Low Moderate Middle High
Income
Perc
ent o
f Loa
ns
Not high cost,foreclosed loansNot high cost, notforeclosed loansHigh cost, foreclosedloansHigh cost, notforeclosed loans
Source: Loan Origination and Foreclosure Matched Data File, Center on Urban Poverty and Community Development, Mandel School of Applied Social Sciences, Case Western Reserve University

http://povertycenter.case.edu Pathways to Foreclosure
Center on Urban Poverty and Community Development 16
Figure 5b: High cost subprime lending and foreclosure rates by race and income of borrower, home refinance loans, Cuyahoga County
Subprime lending and foreclosure rates by race and income of borrower, home refinance loans, Cuyahoga County
0%
10%
20%
30%
40%
50%
60%
70%
80%
90%
100%
Black White Black White Black White Black White
Low Moderate Middle High
Income
Perc
ent o
f Loa
ns
Not high cost,foreclosed loans
Not high cost, notforeclosed loans
High cost, foreclosedloans
High cost, notforeclosed loans
Source: Loan Origination and Foreclosure Matched Data File, Center on Urban Poverty and Community Development, Mandel School of Applied Social Sciences, Case Western Reserve University
Findings: Who is involved in high cost subprime lending and foreclosure?
High cost subprime originators
It has been demonstrated that the pathway to foreclosure typically begins with the origination of a high cost subprime loan. Although many lenders originate some subprime loans, there are others for whom subprime lending constitutes their major business.26 Accordingly, although 128 individual lenders were identified as making at least one high cost subprime loan that went to foreclosure during the study period, it is a relatively short list of originators that account for the majority of the foreclosures. Table 2 provides a list of the top 20 originators ranked by their number of high cost subprime foreclosures. The lenders on this list accounted for 82 percent of the foreclosures on high cost subprime loans originated in 2005 and 2006. Column 1 contains the name of the lender as given in the HMDA record. It should be noted that some of these companies also have subsidiaries operating under different names and others are no longer in business. As indicated in column 2 of the table, most of these lenders were classified by HUD as subprime lenders. Column 3 of the table indicates the percentage of each lender’s total mortgage loans in this study that were high cost based on their interest rate spread . Column 4 displays the
26 In this study, high cost subprime loans were identified by information on the interest rate spread provided on the HMDA record. Prior to that, HUD issued a list of subprime lenders that many studies used as a proxy for subprime lending activity. Subprime lenders were those who reported more than half their loans as having a high interest rate spread. However, most lenders make some subprime loans and subprime lenders also make some prime loans.

http://povertycenter.case.edu Pathways to Foreclosure
Center on Urban Poverty and Community Development 17
percentage of each lender’s high cost subprime loans that had foreclosed by the end of the study period. It can be seen that foreclosure rates tended to be higher for those originators whose primary business in Cuyahoga County was high cost subprime lending as compared to lenders whose business was a mix of subprime and prime loans. Table 2: Top 20 originators of high cost subprime foreclosed loans ranked by number of subprime foreclosed loans
On HUD Subprime List
Percent High Cost Loans
Percent High Cost Loans,
with Foreclosure
1 Argent Yes 87.33 38.882 New Century Mortgage Yes 95.42 41.343 Long Beach Mortgage Yes 99.34 55.594 Aegis Yes 87.17 38.285 Wells Fargo Certain subsidaries 36.73 22.306 BNC Yes 94.09 40.487 People's Choice Financial Yes 93.52 36.868 National City Certain subsidaries 35.51 20.269 Countrywide No 24.71 20.76
10 Finance America Yes 96.72 48.6811 Novastar Mortgage Yes 97.84 27.0912 Option One Mortgage Solutions Yes 91.69 29.2713 Accredited Home Lenders Yes 95.85 26.4614 Aames Funding Yes 92.88 34.3315 Intervale Mortgage No 87.23 23.4116 Southstar Funding Yes 84.67 25.3517 Fremont Investment & Loan Yes 92.16 30.6418 Delta Funding Yes 98.58 30.2919 Ownit Mortgage Solutions Yes 97.44 31.0520 Encore Credit Yes 95.05 30.06
Originator
Source: Loan Origination and Foreclosure Matched Data File, Center on Urban Poverty and Community Development, Mandel School of Applied Social Sciences, Case Western Reserve University
Top 20 originators of high cost subprime foreclosed loans
Plaintiffs on high cost subprime foreclosure filings
Although the top 20 originators are heavily involved at the beginning of the pathway to foreclosure, it is a different set of entities with whom the borrowers must deal when they begin to have difficulty paying the loan. By the time the high cost subprime loans in this study foreclosed, they had often been sold on the secondary market and the company handling the foreclosure was seldom the originator of the loan. This shift can be seen in the companies that are listed as plaintiffs on the foreclosure documents filed with the Clerk of Courts. The top 20 plaintiffs (based on a record review for a random sample of foreclosed high cost subprime loans) are listed in Table 3. In the column next to each plaintiff’s name is the percent of all the foreclosures in the study sample for which that company was listed as the plaintiff. It can be seen that the great majority of the foreclosures have been filed by just a handful of companies as

http://povertycenter.case.edu Pathways to Foreclosure
Center on Urban Poverty and Community Development 18
plaintiff. Indeed, the top 20 plaintiff’s are responsible for 92 percent of the high cost subprime foreclosures. The top five plaintiffs (Deutsche Bank, US Bank, Wells Fargo, HSBC and Bank of New York) account for an estimated 70 percent of high cost subprime foreclosed loans during the study period.
It should be noted that the plaintiff listed on the foreclosure complaint is not necessarily the entity with which the borrower must deal in any effort to mitigate the foreclosure after it is filed. The plaintiff may be the lien holder, a trustee for investors, a servicer hired to manage the loan or some other entity. Thus, the borrower of the high cost subprime foreclosed loan faces a potentially confusing set of conditions with respect to how to react to the receipt of a foreclosure notice and to whom to address their questions and concerns.
Table 3: Top 20 plaintiffs on foreclosure filings on high cost subprime loans by number of foreclosed subprime loans.
Percent High Cost Loans, with Foreclosure
1 Deutsche Bank 30.722 US Bank 19.243 Wells Fargo2 8.864 HSBC 7.685 Bank of New York 4.056 LaSalle Bank 3.807 MERS3 2.368 Novastar Mortgage Inc 1.529 Wachovia Bank 1.52
10 JP Morgan Chase 1.4311 Citi 1.1812 Argent 1.0113 New Century Mortgage Company 1.0114 Avelo Mortgage 0.9315 Indymac Bank 0.9316 Countrywide 0.8417 Property Asset Management Inc 0.8418 Ameriquest 0.7619 EMC Mortgage Company 0.7620 Washington Mutual Bank 0.76
3 MERS is not a lender but a network of securitizers and servicers.Source: Cuyahoga County Clerk of Courts
Top 20 plaintiffs on foreclosure filings on subprime loans.1
Plaintiffs
1 Based on a review of court records for a random sample of subprime foreclosures (n=1,185).2 Includes Wells Fargo subsidiaries.
One indication of what happens when borrowers are served with a foreclosure notice is whether they file a response to the complaint with the Court. The option to file a response is indicated in the notice of foreclosure. For the random sample of high cost subprime loans that went into foreclosure in this study, our review of court documents showed that only 16 percent of borrowers (defendants) filed a response and in most of these instances these defendants who filed an answer were represented by attorneys. This study predates the implementation of a
http://povertycenter.case.edu Pathways to Foreclosure
Center on Urban Poverty and Community Development 19
foreclosure mediation process, but in the future it is anticipated that defendants will receive information on how they can request mediation along with the foreclosure notice.
Perhaps more important than filing an answer or requesting information is whether or not defendants take any steps to work out a method of avoiding foreclosure. In 2005 Cuyahoga County launched its Foreclosure Prevention Program with a number of community partners. From March 2006 through February 2008 the participating foreclosure prevention agencies saw 3,778 clients.27 This suggests that although they may not be filing answers with the court, some home owners are seeking help that may allow them to keep their homes or to resolve the foreclosure before the home goes to sheriff’s sale. In future research it would be useful to examine how counseling, mitigation and mediation influence the pathway to foreclosure.
Unless the foreclosure is resolved in some fashion, it will proceed on to sheriff’s auction. It is too soon to examine this outcome for the 2005 and 2006 loans in this study because the process of foreclosure can be lengthy.28 Nevertheless, in our related report Foreclosure and Beyond, we found that the entities listed as plaintiffs in this report (along with HUD and Fannie Mae) are among the top purchasers of the foreclosed properties at sheriff’s sale.29 At the sheriff’s auction most properties are acquired for what is owed on the lien, which is often close to the sales price given the low down payments and short time elapsed from purchase. The foreclosed properties typically remain in the lenders’ or servicers’ REO (Real Estate) portfolios for extended periods of time and, now that there is a glut of these vacant properties, they are eventually selling well below their market value. Thus, at the end of the pathway to foreclosure is the accumulation of tremendous losses to the borrower, the lender and the community.
Conclusions and implications
High cost loans provided by subprime lenders are by far the most common starting point on the pathway to foreclosure in Cuyahoga County. Home purchase loans foreclose more often than do refinance loans. High cost subprime home purchase loans begin to foreclose a relatively short time after origination, with peak periods of foreclosure filings early in the second year and as the third year begins. Some borrowers appear to go into default shortly after origination while others default later, perhaps triggered by interest rate adjustments or events that compromise their ability to pay. With little down payment and falling property values borrowers are placed in a difficult situation. High cost subprime refinance loans foreclose more gradually and at lower rates, suggesting that the triggers for these foreclosures may be different than for home purchase loans.
There are marked disparities in high cost subprime lending and related foreclosures by race. African Americans are by far the most targeted group in this regard. Even when they are compared with whites of similar income, their rates of receiving high cost subprime loans are 2
27 Weinstein, A. C., Hexter, K.W. & Schnoke, M. (2008). Responding to Foreclosures in Cuyahoga County: A Pilot Initiative Interim Report. Cleveland, Maxine Goodman Levin College of Urban Affairs, Cleveland State University. 28 The average time from foreclosure to disposition was 387 days in 2006 and declined to 299 days in 2007 (See Weinstein, A. C., et. al. above). 29 Coulton, C.J., Mikelbank, K. & Schramm, M. (2007). Foreclosure and Beyond: A report on ownership and housing values following sheriff’s sales, Cleveland and Cuyahoga County, 2000-2007. Cleveland, Case Western Reserve University, Center on Urban Poverty and Community Development.

http://povertycenter.case.edu Pathways to Foreclosure
Center on Urban Poverty and Community Development 20
to 4 times higher. Racial segregation and disparities in the loan products African Americans receive play out in a highly significant spatial concentration of foreclosures that brings down surrounding property values and further fuels the foreclosure process. If foreclosures go to completion at sheriff’s sale, the properties remain vacant generating untoward costs for the community.
There are already thousands of properties moving down the pathway from high cost subprime originations to foreclosure and sheriff’s sale. The challenge of dealing with all of these vacant properties and families who have been displaced is already tremendous. However, it is also important to take steps to prevent borrowing and lending that has a high potential to fail and to do what is possible to avoid further foreclosure filings or mitigate the damage along the way.
Toward this end, the implications of this study are as follows:
Fair lending, safe and sound mortgage products and financial literacy
The aggressive subprime lending that was found to be pervasive in this study of 2005 and 2006 loans is already waning and work is underway at a national level on regulations and policies that will control some of the conditions that led to its growth and demise. At the local level, however, it is important to consider how to support homeownership opportunities and make credit available in the future to sustain families and build assets. This study suggests that particular attention must be given to strategies that level the playing field for borrowers of color and for neighborhoods that were targeted for subprime loan products in recent years.
The first tool that is needed is better information to monitor lending patterns with a particular eye to fair lending and safe and sound loan products. HMDA came into existence in part to reduce discrimination in mortgage lending at a time when African Americans and other people of color were turned down for home loans because of their race. With minority homeownership on the rise, less attention may have been paid to issues of fair housing and fair lending, but the racial targeting of the subprime lending products identified in this study suggests that the problems of fair lending have not gone away but have taken new forms. Communities now need the capacity to monitor fair lending that focuses more attention on the costs, quality and terms of the loan products made available to borrowers in the community. Such monitoring will require that more details on the loan terms be made available to fair lending researchers and advocates than they can currently access. HMDA made a major advance in 2004 when it added information about interest rates to the publicly available records, but from recent experience we know that there are many other aspects of loans such as prepayment penalties, interest rate adjustments and fees that burden the borrower and can tip them over into default and foreclosure. Such information is available in proprietary databases maintained by the mortgage lending industries. These databases should be made available to community-based researchers as a public service so that they can set up more effective systems to monitor what is happening with respect to lending in their communities.
Secondly, there is a need to raise the overall level of borrower knowledge and skill that will enable them to make sound decisions about investing in a home and the options available for financing that purchase. The subprime lending crisis has provided an opportunity to raise awareness in communities that were victimized and mobilize them to seek explanations and

http://povertycenter.case.edu Pathways to Foreclosure
Center on Urban Poverty and Community Development 21
information that will inoculate them against such practices in the future. Programs that transmit fundamental knowledge and skill and an overall approach to financial literacy are one component of such a strategy and these should reach young people long before a home purchase is contemplated. Additionally, new technologies should be exploited for enabling and supporting sound decision making for individuals contemplating home purchase or refinance, thus allowing individuals to compare products and companies and to project out the future costs and implications of various options. Such technologies and tools should be made widely available as a public service so that information on mortgage loans is not vulnerable to distortion by aggressive sales tactics or unqualified brokers.
Third, access to and visibility of local banks needs to be improved in underserved areas. This study showed that loans from local banks seldom foreclosed, and even when the loans were high cost subprime, those from local banks had a lower foreclosure rate. This conclusion was supported in a statewide study showing a negative correlation between foreclosure rates and access to local banks.30 However, there are many neighborhoods without local bank branches nearby and in these places borrowers gravitated to brokers who placed them with national mortgage companies whose products eventually led to foreclosure.
Strategies to promote fair lending, safe and sound mortgage products and financial literacy will require partnerships between the mortgage lending industry, government, community based organizations and educational institutions. Neighborhoods and populations that have been most highly impacted by the subprime foreclosure crisis are important starting points for such work. However, this is also a long term investment in building systems that can raise the sophistication of consumers, provide the tools to monitor lending patterns, and promote fairness in access to credit and homeownership opportunities.
Foreclosure prevention and intervention
The path from subprime loan origination to vacant housing is not inevitable and there are points in this process where there is potential leverage to reduce the damage for borrowers and communities. Cuyahoga County already has a foreclosure prevention program and the partner agencies have considerable experience in helping subprime borrowers who typically call for help after the foreclosure is filed. However, the study suggests that many borrowers get into trouble relatively quickly after their loan is originated. Therefore, a method of providing information to subprime borrowers early in the process is needed so that they know they can call for counseling if they get into difficulty. Since this study identified the top originators of subprime foreclosed loans, it is possible to identify property owners who received loans from these originators whose property has not yet foreclosed. Knowing they are at high risk, the foreclosure prevention agencies could provide them with information on what to do to prevent foreclosure before they get into trouble. In partnership with the Cuyahoga County Recorder’s Office, lists of these at risk borrowers by neighborhood can be made available through NEO CANDO. A pilot foreclosure intervention project using data on mortgages originated from HUD subprime lenders is currently underway in Neighborhood Progress’ six Strategic Investment Initiative
30 O. Emere Ergungor, (2007). Foreclosures in Ohio: Does Lender Type Matter, Cleveland, Federal Reserve Bank.

http://povertycenter.case.edu Pathways to Foreclosure
Center on Urban Poverty and Community Development 22
(SII) Neighborhoods in conjunction with the Center on Urban Poverty and Community Development and Empowering and Strengthening Ohio’s People (ESOP).
The fact that very few borrowers file an answer when they are served with a foreclosure notice suggests that additional methods are needed to let borrowers know that they may still have options at that point. They need to know that by filing an answer, or in the future requesting mediation, they will be given more time to stay in their home and try to find a resolution. Unfortunately, many borrowers receive a foreclosure filing and vacate the property, believing that there is nothing that can be done but thereby prolonging the time that the house is vacant. It is important to reach borrowers before they vacate the property because at that point it is vulnerable to damage and the family has already incurred the costs of relocation. Foreclosure prevention agencies and the Court need to work to provide defendants with simplified instructions on how they can respond to the foreclosure notice, including mediation or other action.
Redeploying foreclosed properties and recovering costs
Although HMDA data for 2007 is not out yet, it is anticipated that it will reveal fewer subprime loan originations. Yet there are many subprime loans from 2004 through 2007 that will still be foreclosing in the coming year or two. A large portion of these properties will be received by the top plaintiffs reported in this study or their representatives. These companies will need to move this inventory, and many such properties are already being sold for extremely low prices to buyers who are not equipped to maintain them or restore them to viable housing. These extremely negative market conditions will devastate neighborhoods of high concentration unless there is an entity that can receive and hold these properties until conditions are more stable and productive development can take place. The Cuyahoga County Treasurer has proposed an entity called the Cuyahoga County Land Reutilization Corporation. This land reutilization corporation would supplement land banking operations already in operation in select Cuyahoga County municipalities. This study lends support to the urgency of this proposal, given the number of high cost subprime loans that are moving along the pathway to foreclosure.
This study has identified thousands of properties that have been sent into a downward spiral by high cost subprime lending, and the costs are falling heavily on borrowers of color, local governments and on neighbors who are suffering with the spillover effects on their property values and quality of life. Yet by using public records to trace these problems back to their source, the study suggests that the origins of the crisis lie in large measure with the originators of high cost subprime loans and the entities that acquired and foreclosed on them. The local governments and citizens who have lost so much as a result require substantial assistance and relief to address the consequences of this disaster that has not yet reached its pinnacle.

http://povertycenter.case.edu Pathways to Foreclosure
Center on Urban Poverty and Community Development 23
Appendix A: Procedures for matching HMDA and County Recorder Records
HMDA Background
In 1975, the U.S. Congress enacted the Home Mortgage Disclosure Act (HMDA), which requires most financial institutions (commercial banks, savings and loans, credit unions, mortgage companies, etc.) to disclose data about loan applications they receive during a calendar year. The HMDA data have several purposes; these include the following: to assist communities in determining whether financial institutions meet housing credit needs; to assist in targeting community development investment; and to assist in determining possible discriminatory lending practices.
The HMDA data provide a variety of information about the lending institution, the characteristics of the loan, and the applicant/co-applicant. Since the purpose of this research is to consider the relationships between borrower characteristics, loan characteristics and the likelihood of a property being foreclosed, HMDA data were crucial. Variables of particular interest included the lending institution, the amount of the loan, the loan type, applicant race, and applicant income. In addition, the HMDA data provide information on the interest rate spread of the loan. If the loan has an annual percentage rate (APR) that is 3 percent (5 percent for junior liens) higher than the Treasury yield then the difference between the APR and the Treasury yield is reported in the HMDA data.
The HMDA data are available at the geographic level of the census tract. However, for this study, the geographic level of interest was the individual property, or parcel. Therefore, the HMDA data at the census tract level needed to be matched to the parcel. Data from the Cuyahoga County Recorder that were provided to us by the Center for Housing Research and Policy at Cleveland State University contained the loan characteristics at the parcel level that made it possible to link the HMDA data to a particular parcel. Variables included in the recorder data were the loan amount, the lending institution, the year of origination, the parcel number, and the census tract where the parcel was located.
Using SAS LinkPro Software and probabilistic matching, the HMDA data and the Recorder data were matched. The HMDA data and Recorder data were separated by year and then matches were combined into one dataset. A match was considered successful if it matched on the census tract, the name of the lending institution, and the loan amount. Subsequent passes to match the data used simplified versions of the lender’s name and alternate names of the lending institutions, as well as the loan amount and census tract. Occasionally, additional variables, such as the purpose of the loan and whether or not the property was owner-occupied, were used to break the ties. Sometimes during matching there were records that had ties that needed to be investigated further. In some instances, the ties could be broken, or duplicates were found, which allowed for additional records to be uniquely matched and included in the analysis. Table A1 provides details on the numbers matched during each of the passes in 2005 and 2006.
In both 2005 and 2006, about 68 percent of the HMDA loans were able to be matched to a record in the Recorder data. Table A2 shows how the characteristics of the matched and unmatched loans differed.

http://povertycenter.case.edu Pathways to Foreclosure
Center on Urban Poverty and Community Development 24
Table A1: Number of records matched at each stage of the mapping process
Matched by
Additional Variables used in
Matching 2005 2006Total Number of HMDA Loans 54,239 44,988
# Matched -- Pass 1 census tract, loan amount, standardized lender's name
loan purpose, owner-occupancy status
33,006 28,068
# Matched -- Pass 2 census tract, loan amount, simplified lender's name
loan purpose, owner-occupancy status
1,702 1,543
# Matched -- Pass 3 census tract, loan amount, alternate lender's name
loan purpose, owner-occupancy status
1,820 602
# Matched -- Pass 4 Removing duplicates and fixing ties
323 223
Total Number of HMDA Loans and Recorder Data Records Matched
36,851 30,436
Percent Matched (%) 67.94 67.65Source: Loan Origination and Foreclosure Matched Data File, Center on Urban Poverty and Community Development, Mandel School of Applied Social Sciences, Case Western Reserve University
Number of records matched at each stage of the mapping process
After the loans were matched, some additional data cleaning occurred. For instance, loans associated with the same parcel and owner that were listed in the recorder data multiple times but that occurred within a 15-day period were regarded as duplicates, and the duplicate loans were removed. Additionally, loans that were greater than $10,000 that could not be tied to a particular owner at a property, that is, the loan appeared to be made between two different ownership periods, were also removed from the data set. Only HMDA loans that involved home purchase or refinancing were included in the final data set, and only 1 to 4-family properties were retained. Finally, HMDA loans with missing census tract information were deleted.
Following all of the data cleaning steps, there were 31,622 matched loans included for analysis in 2005, and in 2006, 25,563 loans were analyzed further. Roughly 63 percent of HMDA loans survived the matching and cleaning in both 2005 and 2006. Piggyback loans were also identified and combined during the data cleaning steps. Lastly, foreclosure filing information from the Cuyahoga County Clerk of Courts and the Cuyahoga County Sheriff’s auction records were joined to the parcels.

http://povertycenter.case.edu Pathways to Foreclosure
Center on Urban Poverty and Community Development 25
Table A2: Comparison of characteristics between HMDA and Loan Origination and Foreclosure Matched Data File
Number Percent Number Percent Number Percent Number Percent
Yes 16,339 32.5 14,490 35.6 11,054 35.0 9,344 36.6 No 33,915 67.5 26,174 64.4 20,568 65.0 16,219 63.5
Home purchase 25,698 51.1 22,481 55.3 15,296 48.4 13,399 52.4 Refinance 24,556 48.9 18,183 44.7 16,326 51.6 12,164 47.6
Yes 43,661 86.9 34,667 85.3 27,550 87.1 21,904 85.7 No 6,560 13.1 5,978 14.7 4,051 12.8 3,649 14.3 N/A 33 0.1 19 0.1 21 0.1 10 0.0
Non-Hispanic White 32,014 63.7 25,678 63.2 19,629 62.1 15,873 62.1 Non-Hispanic Black 11,218 22.3 9,507 23.4 7,208 22.8 6,164 24.1 Hispanic 1,215 2.4 1,073 2.6 864 2.7 746 2.9 Other 5,807 11.6 4,406 10.8 3,921 12.4 2,780 10.9
Low income (<50% AMI) 5,496 10.9 3,835 9.4 3,474 11.0 2,401 9.4 Moderate income (50-80% AMI) 13,418 26.7 10,515 25.9 8,472 26.8 6,720 26.3 Middle income (81-120% AMI) 13,312 26.5 10,674 26.3 8,422 26.6 6,875 26.9 Upper income (>120% AMI) 15,324 30.5 13,801 33.9 9,572 30.3 8,482 33.2 Missing Income Information 2,704 5.4 1,839 4.5 1,682 5.3 1,085 4.2
< 25% African American 37,892 75.4 31,071 76.4 23,671 74.9 19,470 76.2 25% to 49% African American 1,780 3.5 1,421 3.5 1,149 3.6 924 3.6 50% to 74% African American 3,633 7.2 2,966 7.3 2,381 7.5 1,833 7.2 75%+ African American 6,949 13.8 5,206 12.8 4,421 14.0 3,336 13.1
< 10% 35,131 69.9 29,305 72.1 22,088 69.9 18,427 72.1 10% to 19% 6,824 13.6 5,206 12.8 4,382 13.9 3,329 13.0 20% to 39% 7,052 14.0 5,252 12.9 4,445 14.1 3,257 12.7 40%+ 1,247 2.5 901 2.2 707 2.2 550 2.2
< $60,000 7,358 14.6 6,306 15.5 4,555 14.4 3,983 15.6 $60,000 - $119,999 14,588 29.0 11,483 28.2 9,757 30.9 7,707 30.2 $120,000 - $179,999 15,939 31.7 12,105 29.8 10,264 32.5 7,787 30.5 $180,000+ 12,369 24.6 10,770 26.5 7,046 22.3 6,086 23.8
Race
All HMDA Loans L.O.F. Matched Data File2005 2006 2005 2006
Comparison of characteristics between HMDA and Loan Origination and Foreclosure Matched Data File
Source: Loan Origination and Foreclosure Matched Data File, Center on Urban Poverty and Community Development, Mandel School of Applied Social Sciences, Case Western Reserve University
Income of borrower
Racial mix
Poverty rate
Median sales price of single-family home
High cost loan
Loan type
Owner-occupied

http://povertycenter.case.edu Pathways to Foreclosure
Center on Urban Poverty and Community Development 26
Appendix B: Statistical modeling of risk factors for foreclosure
A survival analysis (hazard model) was undertaken to determine the effects of loan, lender, borrower and neighborhood characteristics on the risk of foreclosure of loans originated in 2005 and 2006. Tables B1 and B2 display the variable names, coefficients, their statistical significance and the hazard ratios for the predictor variables on home purchase and refinance loan foreclosure. 31
Unless otherwise indicated, the variables in the model are dichotomous and the coefficients and hazard ratios are interpreted with respect to the category left out. So, the coefficient for high cost subprime loans represents the contrast with loans that are not high cost subprime and so forth.
Two models are presented in the tables, one without neighborhood variables and the second with neighborhood variables added to the model. Model 2 showed a significant improvement in fit over model 1. It also has the advantage of taking into account foreclosures on surrounding properties, thereby eliminating the spatial autocorrelation of the residuals which occurred in model 1.32 It was important to remove spatial autocorrelation in order to meet the independence assumption of the general linear model (i.e., that the errors are uncorrelated).
The hazard ratio is an estimate of the relative difference in the chances of foreclosure for the categories being compared, controlling for all other variables in the model. For example, in the section labeled home purchase loans, the hazard ratio for high cost subprime indicates that the risk of foreclosure for these loans is 8.16 times (or 816 percent) higher than it is for loans that are not high cost subprime, holding constant all other variables in the model. With respect to refinance loans, the high cost subprime loans have 6.63 times the foreclosure risk of non-high cost loans with everything held constant. When the hazard ratio is less than one, it can be interpreted more easily by subtracting it from one. Thus, for home purchase loans made by local banks as compared to out of town lenders the chances of foreclosure are lower by a factor of .44 or have a 56 percent lower chance (i.e., 1 - .44=.56).
The fact that the independent variables in the model are correlated with each other accounts for some variables becoming insignificant when other variables are introduced. Also, with respect to neighborhood measures, several have the opposite sign as would be expected when they are introduced into the multivariate model. For example, neighborhood poverty has the opposite effect on foreclosure rates once individual borrower characteristics and high cost subprime lending is controlled. This may be due to spatial concentration of these other factors.
It should also be noted that the coefficient for the number of foreclosures in the surrounding 500 feet area is significant. It suggests that one more foreclosure in the 500 foot buffer increases the chance that a loan will foreclose by 40 percent. We tried other buffers such as 1000 feet and 1500 feet but they did not add significantly to the fit of the model and showed weaker effects as the buffer increased.
31 The term survival analysis reflects the origins of this technique in medical studies where the outcome was the length of survival. In this analysis, survival refers to the length of time the loan has been in place without having a foreclosure filed. 32 Spatial autocorrelation of the residual, or errors, was examined using GeoDa. The global Moran’s I was statistically significant in model 1 but not in model 2.

http://povertycenter.case.edu Pathways to Foreclosure
Center on Urban Poverty and Community Development 27
Table B1: Hazard model of high cost subprime home purchase loans, Cuyahoga County
Independent VariableCoefficient Hazard Ratio Coefficient Hazard Ratio
High cost subprime loan 2.10*** 8.16 1.89*** 6.63Owner-occupied -0.45*** 0.64 -0.12** 0.89Loan to sales price ratio > 80% 0.24*** 1.27 0.20*** 1.23
Local bank -0.93*** 0.39*** -0.81*** 0.44
Non-Hispanic Black 0.58*** 1.78 0.37*** 1.45Borrower with low or moderate income 0.33*** 1.39 0.14*** 1.16
Poverty rate > 20% -0.03 0.97Median sales price of single-family homes < $60,000 0.23*** 1.26Number of foreclosures within 500 feet 0.33*** 1.40
Model Chi-Square *p < 0.05, **p < 0.01, ***p < 0.001
Source: Loan Origination and Foreclosure Matched Data File, Center on Urban Poverty and Community Development, Mandel School of Applied Social Sciences, Case Western Reserve University
Model Fit Statistics6716.01*** 8044.09***
Hazard model of high cost subprime home purchase loans
Lender Characteristics
Borrower Characteristics
Neighborhood Characteristics
Home PurchaseModel 1 Model 2
Loan Characteristics
Table B2: Hazard model of high cost subprime home refinance loans, Cuyahoga County
Independent VariableCoefficient Hazard Ratio Coefficient Hazard Ratio
High cost subprime loan 1.56*** 4.75 1.45*** 4.27Owner-occupied -0.70*** 0.50 -0.46*** 0.63Loan to assessed market-values ratio > 110% 0.29*** 1.34 0.21*** 1.24
Local bank -1.12*** 0.33 -1.04*** 0.35
Non-Hispanic Black 0.24*** 1.28 0.08 1.08Borrower with low or moderate income 0.22*** 1.25 0.12* 1.12
Poverty rate > 20% -0.18** 0.83Median sales price of single-family homes < $60,000 -0.22** 0.81Number of foreclosures within 500 feet 0.44*** 1.56
Model Chi-Square *p < 0.05, **p < 0.01, ***p < 0.001
Model Fit Statistics
Source: Loan Origination and Foreclosure Matched Data File, Center on Urban Poverty and Community Development, Mandel School of Applied Social Sciences, Case Western Reserve University
2716.53*** 3729.01***
Table B2: Hazard model of high cost suprime home refinance loans, Cuyahoga County
Lender Characteristics
Borrower Characteristics
Neighborhood Characteristics
RefinanceModel 1 Model 2
Loan Characteristics

http://povertycenter.case.edu Pathways to Foreclosure
Center on Urban Poverty and Community Development 28
Appendix C: High cost subprime lending and foreclosure by neighborhood and municipality
The table below provides a count of all HMDA records that were high cost subprime. The percentages are based on the Loan Origination and Foreclosure matched data file. It should be noted that the 2005 loans were observed for a longer period than the 2006 loans so they had more time to go to foreclosure. It is anticipated that additional loans will foreclose over time.
Table C: Percent of loans that are high cost subprime, high cost subprime foreclosure rates by neighborhood and municipality
Municipality/NeighborhoodHigh Cost
2005a
Percent High Cost
2005a
Percent Foreclosure
2005b
Percent, High Cost
Foreclosure 2005b
*High Cost 2006a
Percent High Cost
2006a
Percent Foreclosures
2006b
Percent High Cost
Foreclosures 2006b
Brooklyn Centre 121 49.59 19.62 31.71 98 47.57 14.29 27.87Buckeye-Shaker 213 54.62 26.42 38.46 160 56.94 30.63 42.00Central 20 25.97 30.00 42.86 16 25.00 5.88 15.38Clark-Fulton 191 53.80 24.22 36.00 165 62.98 25.44 37.25Corlett 338 67.20 34.87 44.02 289 76.46 24.28 29.41Cudell 172 53.58 28.04 42.86 132 60.55 26.49 40.00Detroit-Shoreway 202 43.16 26.32 45.99 159 48.77 14.61 25.26Downtown 1 2.33 0.00 0.00 5 5.21 0.00 0.00Edgewater 70 27.78 8.09 23.26 59 32.07 4.49 13.04Euclid-Green 115 55.29 26.40 42.03 95 53.37 15.53 27.12Fairfax 147 69.34 40.97 50.96 67 70.53 25.40 36.36Forest Hills 315 72.25 39.18 50.51 276 77.31 36.79 44.79Glenville 395 68.70 38.44 48.46 329 72.63 27.50 33.33Goodrich-Kirtland Park 28 56.00 23.33 36.84 18 46.15 8.70 16.67Hough 197 60.06 30.05 39.69 129 62.02 23.44 32.93Industrial Valley 5 100.00 80.00 80.00 6 100.00 60.00 60.00Jefferson 257 31.77 12.67 27.78 224 40.73 7.52 15.56Kamms Corners 125 15.04 2.40 11.25 135 21.92 2.92 9.52Kinsman 62 80.52 50.94 60.47 32 78.05 43.48 52.63Lee-Miles 337 52.90 18.64 28.82 299 64.86 15.86 23.12Mt. Pleasant 443 68.47 30.85 38.18 405 78.19 26.65 33.20North Broadway 195 78.31 50.68 58.77 160 78.05 53.45 61.96North Collinwood 309 45.37 20.00 33.80 247 52.00 13.78 25.53Ohio City 81 29.45 17.12 31.25 65 30.52 11.54 22.86Old Brooklyn 429 31.25 9.38 21.92 374 37.25 7.93 17.07Puritas-Longmead 228 38.78 16.99 27.46 199 43.36 9.12 16.91Riverside 43 25.29 6.31 16.67 47 31.13 9.20 8.00South Broadway 486 62.23 35.22 49.83 394 69.98 23.01 31.25South Collinwood 288 66.36 35.38 44.44 271 73.05 32.60 41.18St. Clair-Superior 200 75.76 37.11 44.72 123 75.93 35.45 45.12Stockyards 133 58.85 33.09 45.78 120 70.59 19.42 27.14Tremont 72 35.47 12.98 30.19 46 25.84 7.78 20.00Union-Miles 331 71.49 44.62 56.50 270 81.33 33.01 39.76University 30 35.71 24.24 44.44 34 54.84 30.00 47.37West Boulevard 280 46.20 17.85 34.88 210 51.09 14.86 26.50Woodland Hills 196 76.26 40.30 48.18 136 79.07 30.77 35.79aBased on all HMDA recordsbBased on matched sample
Table C: Percent of loans that are high cost subprime, high cost subprime foreclosure rates
(continued on next page)

http://povertycenter.case.edu Pathways to Foreclosure
Center on Urban Poverty and Community Development 29
Table C (cont): Percent of loans that are high cost subprime, high cost subprime foreclosure rates by neighborhood and municipality
Municipality/NeighborhoodHigh Cost
2005a
Percent High Cost
2005a
Percent Foreclosure
2005b
Percent, High Cost
Foreclosure 2005b
*High Cost 2006a
Percent High Cost
2006a
Percent Foreclosures
2006b
Percent High Cost
Foreclosures 2006b
Bay Village 107 14.02 4.59 26.15 103 15.19 3.17 14.29Beachwood 34 10.56 3.90 25.00 52 18.64 6.58 20.69Bedford 262 45.25 13.13 23.33 210 44.87 8.89 16.96Bedford Hts. 158 47.59 13.57 23.89 162 48.36 12.02 14.44Bentleyville 2 6.25 5.88 0.00 1 2.27 0.00 0.00Berea 168 21.82 6.22 17.48 176 26.23 4.57 15.00Bratenahl 18 21.95 5.88 50.00 14 18.42 6.06 28.57Brecksville 50 9.96 6.18 40.00 40 9.17 2.56 9.09Broadview Hts. 100 10.56 2.96 18.60 77 9.49 2.59 18.92Brooklyn 98 29.25 8.29 23.73 81 29.78 1.67 4.65Brooklyn Hts. 19 35.19 11.43 37.50 13 20.00 2.27 14.29Brookpark 214 27.90 7.63 20.16 199 31.89 5.85 14.63Chagrin Falls Twp. 0 0.00 0.00 0.00 1 33.33 0.00 0.00Chagrin Falls Village 22 10.73 1.79 25.00 24 14.20 3.75 16.67Cleveland Hts. 714 33.30 13.99 32.85 650 38.55 11.86 27.85Cuyahoga Hts. 8 27.59 5.00 20.00 2 15.38 0.00 0.00East Cleveland 449 70.38 38.77 47.74 358 76.82 35.02 42.13Euclid 830 39.96 15.15 29.34 815 47.66 11.26 20.04Fairview Park 129 17.18 5.13 20.48 116 20.42 1.68 8.45Garfield Hts. 634 45.68 18.56 33.25 542 48.35 13.43 25.37Gates Mills 2 2.15 1.79 0.00 8 8.33 0.00 0.00Glenwillow 18 46.15 23.53 33.33 19 50.00 19.05 44.44Highland Hills 8 61.54 0.00 0.00 9 81.82 12.50 16.67Highland Hts. 28 8.59 6.15 33.33 28 9.62 0.67 5.88Hunting Valley 0 0.00 0.00 0.00 1 5.26 0.00 0.00Independence 39 17.41 4.65 21.05 32 13.68 3.97 29.41Lakewood 449 22.64 7.74 22.68 435 26.85 6.81 18.60Linndale 2 40.00 33.33 50.00 1 100.00 0.00 0.00Lyndhurst 137 18.95 4.91 20.83 101 17.24 5.49 23.73Maple Hts. 721 51.28 16.57 27.12 700 60.19 16.43 24.23Mayfield Hts. 103 15.75 4.07 18.03 128 22.65 3.11 12.50Mayfield Village 10 10.31 6.67 60.00 8 9.20 0.00 0.00Middleburg Hts. 92 16.37 1.67 8.89 82 16.84 3.00 14.63Moreland Hills 7 5.65 2.74 20.00 23 15.13 4.60 25.00Newburgh Hts. 40 43.01 12.24 25.00 34 55.74 5.41 9.52North Olmsted 253 20.75 5.20 15.23 245 23.65 3.94 10.92North Randall 8 50.00 0.00 0.00 3 33.33 0.00 0.00North Royalton 171 16.54 4.48 17.39 184 19.76 4.11 17.72Oakwood 78 46.43 8.74 17.39 85 53.46 11.54 19.15Olmsted Falls 93 20.48 6.52 25.00 70 21.54 4.55 28.57Olmsted Twp. 102 14.45 3.51 14.58 96 18.29 3.15 11.54Orange 24 15.79 6.76 21.43 26 20.97 8.22 35.71Parma 795 25.63 7.78 23.35 716 27.52 4.27 13.53Parma Hts. 165 23.74 5.01 16.30 155 26.36 2.80 9.76Pepper Pike 28 12.02 7.46 33.33 29 14.57 5.00 22.22Richmond Hts. 116 27.68 7.41 24.19 134 37.33 7.11 13.79Rocky River 92 11.19 3.49 19.05 86 11.88 1.92 14.29Seven Hills 59 14.11 4.72 21.95 64 16.37 3.82 14.29Shaker Hts. 276 23.08 10.34 32.93 281 28.94 10.23 29.19Solon 178 17.43 7.95 33.00 150 17.40 4.87 26.09South Euclid 376 30.92 10.67 26.32 376 38.41 9.93 22.07Strongsville 235 14.09 2.36 13.18 238 16.64 1.55 6.47University Hts. 135 21.60 10.38 31.46 114 23.75 5.46 19.72Valley View 10 19.23 0.00 0.00 15 24.59 0.00 0.00Walton Hills 11 14.67 2.38 11.11 16 29.63 0.00 0.00Warrensville Hts. 231 50.88 14.98 25.56 219 57.94 7.73 11.32Westlake 174 13.59 2.95 20.00 145 13.35 2.07 16.07Woodmere 2 13.33 0.00 0.00 4 20.00 0.00 0.00City of Cleveland 7055 49.96 24.08 39.89 5794 55.37 19.04 30.97East Side of Cleveland 4651 62.84 32.90 44.47 3761 68.17 26.46 35.34West Side of Cleveland 2404 35.77 14.53 31.08 2033 41.09 10.88 22.53Cuyahoga Suburbs 9284 25.69 9.00 26.55 8696 28.80 6.85 19.92Eastern Inner Suburbs 4297 40.07 15.75 31.81 3991 46.28 13.23 25.30Western Inner Suburbs 1798 23.00 7.16 22.59 1647 25.43 4.42 14.22Inner Ring Suburbs 6095 32.87 12.17 29.16 5638 37.34 9.43 22.14Outer Ring Suburbs 3189 18.13 5.35 21.09 3058 20.25 4.00 15.37First Suburbs Municipalities 6479 34.06 12.50 28.94 5976 38.66 9.70 21.91Cuyahoga County 16339 32.51 13.40 32.56 14490 35.63 10.17 24.57a Based on all HMDA records.b Based on HMDA-Recorder matched sample.
Table C (cont.): Percent of loans that are high cost subprime, high cost subprime foreclosure rates
Source: Loan Origination and Foreclosure Matched Data File, Center on Urban Poverty and Community Development, Mandel School of Applied Social Sciences, Case Western Reserve University