
Pathways connecting neighborhood influences and mental well-being: Socioeconomic position and gender...
11
Pathways connecting neighborhood influences and mental well-being: Socioeconomic position and gender differences q Jessica Burke a, * , Patricia O’Campo b , Christina Salmon b , Renee Walker a a Behavioral and Community Health Sciences, University of Pittsburgh Graduate School of Public Health,130 DeSoto Street, 218 Parran Hall, Pittsburgh, PA 15238, USA b The Centre for Research on Inner City Health, The Li Ka Shing Knowledge Institute of St. Michael’s Hospital, 30 Bond Street, Toronto, Ontario, M5B1 W8, canada article info Article history: Available online 13 February 2009 Keywords: Mental health Neighborhood context Socioeconomic position Concept mapping Canada Gender abstract Few studies have explored how participant socioeconomic position (SEP) and gender is related to perceptions of the pathways connecting neighborhood influences and mental well-being. This research used the concept mapping method, an intensive structured conceptualization process that produces pictorial views of how concepts are connected and interrelated. Thirty-six low and non-low SEP men and women from Toronto, Canada participated in the concept mapping sessions. One hundred and twenty unique neighborhood characteristics were felt to be related to mental well-being and those items were grouped into six distinct clusters. Notable differences in cluster importance by participant SEP status were found. While no overall differences were observed for males verses females, further stratification by both participant SEP and gender suggested that gendered perceptions are not uniform. Participant- created diagrams illustrated how the cluster domains are related to each other and to good mental well-being. These findings are important for uncovering the mechanisms by which neighborhoods differentially affect the mental health of residents from different SEPs and genders. Ó 2009 Elsevier Ltd. All rights reserved. Introduction Mental health disorders are a significant global public health issue (Prince et al., 2007). Rates of common mental disorders, such as depression and anxiety, generally range from 10 to 20% in community based samples worldwide (Patel, Flisher, & Cohen, 2006). While mental illness is not directly fatal, it does cause extensive disability and morbidity (Brundtland, 2000). Certain subpopulations are at increased risk of developing mental health disorders. Lorant et al.’s (2003) meta-analytic review of 51 studies addressing the association between socioeconomic position (SEP) and depression found that individuals with low, as compared to high SEP, had significantly higher odds of being depressed (odds ratio: 1.81). A substantial gender gap is also found in the rates of depressive symptoms and mental health disorders. Females are approximately twice as likely as males to experience depression and anxiety as an adult (Weissman et al., 1996). Increasingly, studies have moved beyond the individual and family level determinants of mental health to explore the rela- tionship between neighborhood level characteristics and mental well-being (Elliott, 2000; Galea, Ahern, Rudenstine, Wallace, & Vlahov, 2005; Leventhal & Brooks-Gunn, 2003; Ostir, Eschbach, Markides, & Goodwin, 2003; Phongsavan, Chey, Bauman, Brooks, & Silove, 2006; Propper et al., 2005; Stafford & Marmot, 2003; Sundquist & Ahlen, 2006; Wen, Hawkley, & Cacioppo, 2006; Winkleby & Cubbin, 2003). While the last two decades have witnessed a growth in the number of multilevel modeling studies designed to explore the impact of neighborhood context on physical and mental health outcomes, the notion that context is related to health is not a new one (Barrett, 2000; Cummins, Curtis, Diez-Roux, & Macintyre, 2007). Since the 1990s and the advent of appropriate advanced statistical modeling techniques developed in fields such as demography, sociology of education and criminology (e.g. Mason, Wong, & Entwistle,1983; Nuttal, Goldstein, Prosser, & Rasbash,1989; Raudenbush & Bryk, 1986), public health researchers have exhibited a renewed interest in the role of neighborhood and context and explored the effects of neighborhood environment on a host of health issues including heart disease (e.g. Diez-Roux et al., 2001; Wight et al., 2008), hypertension (e.g. Morenoff et al., 2007) preterm q This study was funded by Centre for Urban Health Initiatives at the University of Toronto. We would like to thank the Wellesley Institute and the Scarborough Housing Health Centre for allowing us to hold group there. We would like to thank the Southeastern Toronto Project (SETo) for assistance with recruitment. We would also like to thank the participants who were gracious enough to allow us their time and to share their thoughts. * Corresponding author. Tel.: þ1 412 624 3610; fax: þ1 412 624 5510. E-mail address: [email protected] (J. Burke). Contents lists available at ScienceDirect Social Science & Medicine journal homepage: www.elsevier.com/locate/socscimed 0277-9536/$ – see front matter Ó 2009 Elsevier Ltd. All rights reserved. doi:10.1016/j.socscimed.2009.01.015 Social Science & Medicine 68 (2009) 1294–1304
-
Upload
jessica-burke -
Category
Documents
-
view
214 -
download
0
Transcript of Pathways connecting neighborhood influences and mental well-being: Socioeconomic position and gender...

lable at ScienceDirect
Social Science & Medicine 68 (2009) 1294–1304
Contents lists avai
Social Science & Medicine
journal homepage: www.elsevier .com/locate/socscimed
Pathways connecting neighborhood influences and mental well-being:Socioeconomic position and gender differencesq
Jessica Burke a,*, Patricia O’Campo b, Christina Salmon b, Renee Walker a
a Behavioral and Community Health Sciences, University of Pittsburgh Graduate School of Public Health, 130 DeSoto Street, 218 Parran Hall, Pittsburgh, PA 15238, USAb The Centre for Research on Inner City Health, The Li Ka Shing Knowledge Institute of St. Michael’s Hospital, 30 Bond Street, Toronto, Ontario, M5B1 W8, canada
a r t i c l e i n f o
Article history:Available online 13 February 2009
Keywords:Mental healthNeighborhood contextSocioeconomic positionConcept mappingCanadaGender
q This study was funded by Centre for Urban Healtof Toronto. We would like to thank the Wellesley InHousing Health Centre for allowing us to hold group tthe Southeastern Toronto Project (SETo) for assistancealso like to thank the participants who were graciousand to share their thoughts.
* Corresponding author. Tel.: þ1 412 624 3610; faxE-mail address: [email protected] (J. Burke).
0277-9536/$ – see front matter � 2009 Elsevier Ltd.doi:10.1016/j.socscimed.2009.01.015
a b s t r a c t
Few studies have explored how participant socioeconomic position (SEP) and gender is related toperceptions of the pathways connecting neighborhood influences and mental well-being. This researchused the concept mapping method, an intensive structured conceptualization process that producespictorial views of how concepts are connected and interrelated. Thirty-six low and non-low SEP men andwomen from Toronto, Canada participated in the concept mapping sessions. One hundred and twentyunique neighborhood characteristics were felt to be related to mental well-being and those items weregrouped into six distinct clusters. Notable differences in cluster importance by participant SEP statuswere found. While no overall differences were observed for males verses females, further stratificationby both participant SEP and gender suggested that gendered perceptions are not uniform. Participant-created diagrams illustrated how the cluster domains are related to each other and to good mentalwell-being. These findings are important for uncovering the mechanisms by which neighborhoodsdifferentially affect the mental health of residents from different SEPs and genders.
� 2009 Elsevier Ltd. All rights reserved.
Introduction
Mental health disorders are a significant global public healthissue (Prince et al., 2007). Rates of common mental disorders,such as depression and anxiety, generally range from 10 to 20% incommunity based samples worldwide (Patel, Flisher, & Cohen,2006). While mental illness is not directly fatal, it does causeextensive disability and morbidity (Brundtland, 2000).
Certain subpopulations are at increased risk of developingmental health disorders. Lorant et al.’s (2003) meta-analytic reviewof 51 studies addressing the association between socioeconomicposition (SEP) and depression found that individuals with low, ascompared to high SEP, had significantly higher odds of beingdepressed (odds ratio: 1.81). A substantial gender gap is also foundin the rates of depressive symptoms and mental health disorders.
h Initiatives at the Universitystitute and the Scarboroughhere. We would like to thankwith recruitment. We would
enough to allow us their time
: þ1 412 624 5510.
All rights reserved.
Females are approximately twice as likely as males to experiencedepression and anxiety as an adult (Weissman et al., 1996).
Increasingly, studies have moved beyond the individual andfamily level determinants of mental health to explore the rela-tionship between neighborhood level characteristics and mentalwell-being (Elliott, 2000; Galea, Ahern, Rudenstine, Wallace, &Vlahov, 2005; Leventhal & Brooks-Gunn, 2003; Ostir, Eschbach,Markides, & Goodwin, 2003; Phongsavan, Chey, Bauman, Brooks, &Silove, 2006; Propper et al., 2005; Stafford & Marmot, 2003;Sundquist & Ahlen, 2006; Wen, Hawkley, & Cacioppo, 2006;Winkleby & Cubbin, 2003). While the last two decades havewitnessed a growth in the number of multilevel modeling studiesdesigned to explore the impact of neighborhood context on physicaland mental health outcomes, the notion that context is related tohealth is not a new one (Barrett, 2000; Cummins, Curtis, Diez-Roux,& Macintyre, 2007). Since the 1990s and the advent of appropriateadvanced statistical modeling techniques developed in fields such asdemography, sociology of education and criminology (e.g. Mason,Wong, & Entwistle,1983; Nuttal, Goldstein, Prosser, & Rasbash,1989;Raudenbush & Bryk, 1986), public health researchers have exhibiteda renewed interest in the role of neighborhood and context andexplored the effects of neighborhood environment on a host ofhealth issues including heart disease (e.g. Diez-Roux et al., 2001;Wight et al., 2008), hypertension (e.g. Morenoff et al., 2007) preterm
J. Burke et al. / Social Science & Medicine 68 (2009) 1294–1304 1295
birth (e.g. Masi, Hawkley, Piotrowski, & Pickett, 2007; O’Campo,Burke, Culhane et al., 2008a).
The recent systematic review by Truong and Ma (2006) of 29studies found a consistent and positive relationship betweenneighborhood factors and mental health outcomes. For example,Sundquist and Ahlen’s (2006) multilevel research on over 4 millionSwedish men and women found that low neighborhood incomewas significantly associated with the risk of hospitalization fora mental health disorder even after adjustment for individual age,marital status, birth country, income and education. Researchby Ross (2000) using data from 2482 adults who participated inthe 1995 Community, Crime and Health survey, found that, evenafter controlling for potential individual-level confounders (e.g.individual disadvantage), residents in more disadvantaged neigh-borhoods (i.e. high rates of poverty and mother-only households)have higher levels of depression than those who live in advantagedneighborhoods. Work by Drukker and vanOs (2003) and Wen et al.(2006) also found that neighborhood socioeconomic status,measured by the proportion of unemployment, proportion ofwelfare recipients, ethnic makeup and mean income, was linked toan increase in poor overall and mental health. It is suggested thatlow socioeconomic status is a marker for residing in unsafeneighborhoods which can heighten perceptions of stress, anger,and resentment. Additionally, feelings of powerlessness and frus-tration that may result in people living in poor neighborhoods canlead to persistent negative attitudes towards the environment,which can have detrimental health outcomes (Mirowsky & Ross,2003; Wen et al., 2006; Wilson, 1996). The mechanism wherebythis occurs is unknown, however, it is believed that social processessuch as social capital (e.g. trust and norms of reciprocity) andneighborhood climate (e.g. stigmatized reputation, crime, gangs,loose dogs, broken glass abandoned cars, inadequate housingoptions, and fear) are mediators in this process (Drukker & van Os,2003; Franzini, Caughy, Spears, & Esquer, 2005; Pampalon, Hamel,De Koninck, & Distant, 2007; Sundquist & Ahlen, 2006). In a studyon deficits in social capital, Steptoe and Feldman (2001) founda positive association between neighborhood problems andpsychological distress. Similar results were found by Phongsavanet al. (2006) looking at the association between social capital andpsychological distress among Australian adults. Their findings showthat people who distrust other residents and perceive theirneighborhoods as unsafe are more likely to have higher levels ofpsychological distress. Additionally, their findings support otherresearch findings that high levels of social capital have a protectiveeffect on individual mental health (Cho, Park, & Echevarria-Cruz,2005; Phongsavan et al., 2006; Ross, 2000).
One possible explanation for the association between lowneighborhood socioeconomic status and adverse health outcomeswas found in a study by Wen et al. (2006) looking at socioeconomicposition, psychosocial factors and self-rated health in older adultsin Cook County, Illinois. Their results show that individual socio-economic status is low in these neighborhoods and that negativeperceptions about the neighborhood are more closely related tohealth (Wen et al., 2006). More specifically, perceptions of thephysical environment seem to be a stronger correlate of self-ratedhealth than perceptions of the social environment (Wen et al.,2006; Wilson et al., 2004).
Knowledge of potential gender differences regarding howneighborhood context is associated with mental health is stillrelatively limited. Research from the field of environmentalpsychology provides insight into the influence of gender onperceptions of the natural environment and suggests that femalesare more likely than males to view environmental problems asconcerns (Jones & Dunlap, 1992; Raudsepp, 2001) and havestronger attitudes about the environment (Foster & McBeth, 1994).
In a study of 1317 participants from Japan, Germany, Sweden, andthe United States, Eisler, Eisler, and Yoshida (2003) found thatfemales were more likely than males to stress the importance of theenvironment to quality of life and to show responsibility for pro-tecting the environment. Molinari, Ahern, and Hendryx (1998)study of differences in the way males and females perceive theirenvironments and the subsequent impact on their mental healthstatus found that aspects of the social environment (unemploy-ment, violence, access to healthcare, poor reputation of theneighborhood and drug use) were considered by females as beingdeterminants of mental health, whereas physical environmentcharacteristics (air quality and waste disposal) were more impor-tant for males. Mohai (1997) found that females in the Detroit areawere more likely than males to identify pollution as a seriousconcern for them. A similar finding emerged in a study of therelationships between social cohesion and the physical and socialcharacteristics of neighborhoods in the UK. Stafford et al. (2004)found that females’ mental health was more strongly associatedwith the physical environment and neighborhood characteristicscompared to males. This finding may be explained by the roles andresponsibilities of caring for the home and the family that tend tofall more on females.
Some of the neighborhoods and health research conducted todate has lacked a strong theoretical background (O’Campo, 2003;Rajaratnam, Burke, & O’Campo, 2006). Existing sociological theoriesmay be relevant for specific outcomes such as deviant behaviorsand crime, but may not be applicable or appropriate for other areasof health such as mental health and well-being. Additional workneeds to be done in order to develop a better understanding ofthe mechanisms by which neighborhood context is related tohealth issues. According to Kawachi and Subramanian (2007), theconceptualization of neighborhood contexts and the pathwaysthrough which neighborhood factors lead to poor health outcomesis an area of in need of research attention. Identifying the pathwayslinking neighborhood factors to mental well-being will lead toa more comprehensive understanding of those complex relation-ships, to improved health-specific theories and ultimately toenhanced programs and interventions.
Qualitative research methods have substantially contributed toour understanding of the complex relationship between neigh-borhood context and health outcomes (e.g. Popay et al., 2003).However, Cummins et al. (2007) accurately note that such in-depthperspectives about how context is related to individual healthremain ‘‘poorly integrated into empirical research’’ (p. 1829). Onequalitative method that has been successfully used in the past toexamine the relationship between neighborhood context and thehealth-related outcome of intimate partner violence is conceptmapping (Burke, O’Campo, & Peak, 2006; Burke et al., 2005;O’Campo, Burke, Peak, McDonnell, & Gielen, 2005). O’Campo et al.’s(2005) concept mapping study among women from urban Balti-more, MD identified several community enrichment characteristics(e.g. access to public health facilities, women’s groups and recrea-tion centers for children) were not previously reported as beingimportant for intimate partner violence and produced diagramsillustrating the perceived relationships between neighborhoodcharacteristics and the outcomes of intimate partner violencecessation, severity, prevalence and perpetration.
The primary goal of the research presented here was to examine,using the methods of concept mapping, whether and how partici-pant gender and socioeconomic position differentially affectperceptions of the relationship between neighborhood context andgood mental well-being. The research also sought a better under-standing of the pathways connecting neighborhood influences togood mental well-being. Additional discussion of the generalconcept mapping results can be found elsewhere (O’Campo,
Table 1Definitions of terms provided to concept mapping participants
Term Definition
Mental well-being
Mental well-being refers to the psychological state of a person. Thismay include positive mental states such as being satisfied with life,happiness, or being stress-free. Mental health also includes poorpsychological states such as being highly stressed, feeling anxious,being fearful, bored or unhappy. Finally, mental health can includemental illness like major depression or even substance abuse likealcoholism.
Neighborhood Neighborhood is a physically bounded area characterized by somedegree of homogeneity (or similarity) and sometimes socialcohesion.
J. Burke et al. / Social Science & Medicine 68 (2009) 1294–13041296
Salmon, Burke, & Dunn, 2008b). This research was funded by Centrefor Urban Health Initiatives at the University of Toronto and beganin May 2005. The concept mapping activities were completedby June 2006.
Methods
Concept Mapping, the methodology used in this study, wasdeveloped by Trochim (1989) and is a participatory researchmethod that produces a conceptual framework for how a groupviews a topic (Trochim, 1989). Trochim (1989) describes conceptmapping as ‘‘a structured process, focused on a topic or construct ofinterest, entailing input from one or more participants, that producesan interpretable pictorial view (concept map) of their ideas andconcepts and how these are interrelated.’’ While concept mappinghas been adopted by the health promotion planning and evaluationfield, it has been underused by public health researchers interestedin hypothesis generation and theory development. This method hasrecently emerged as a new public health research tool to aid in thegathering of information from the perspective of consumers orcommunities within public health (Burke et al., 2006, 2005;O’Campo et al., 2005). A detailed discussion of how conceptmapping can be used as a participatory public health researchmethod can be found in Burke et al.’s (2005) article which providesan overview of concept mapping, demonstrates the intricacies ofthe method and addresses how it can be used by researchersinterested in generating hypotheses and developing theory. As partof the concept mapping process, specific data gathering activitiesare completed by each individual participant (brainstorming,sorting, rating, diagramming) in order to fully represent eachindividual’s viewpoint while also incorporating group consensus.Qualitative and quantitative methods are used in concept mappingto create a visual display of how the individual participants and thegroup as a whole conceptualize a particular topic.
Despite sharing common methodological limitations oftenassociated with other qualitative methods (e.g. nonrandomsampling, small sample size), concept mapping is a uniqueapproach particularly well suited to address the study aims of thisresearch. It is an approach that permits the exploration of complexideas and phenomenon during a relatively short time period. One ofthe major strengths of concept mapping is the inclusion of studyparticipants in the interpretation and analyses of the data. Unlikeother qualitative methods, such as focus group discussions, conceptmapping participants drive much of the data analysis discussionand interpretation of findings.
Recruitment
Participants were recruited from Toronto, Canada. Toronto isa large urban area comprised of a dense downtown core of thecentral business district surrounded by inner suburban areas that,while still urban, are less crowded. Accessible social and healthservices are concentrated in the downtown area (i.e. availabilityand ease of access via public transit) while with the inner suburbs,such services are fewer, far between and less accessible. Twostratification factors were used in participant recruitment:geographic area (downtown and inner suburbs) and socioeconomicposition (as measured by a proxy for income, low and non-low).Each participant’s residential address was used to determinewhether they resided in the downtown or inner suburbs areas.During the screening process, socioeconomic position was assessedusing an approximation of income levels by asking about partici-pant employment status, home ownership and if they routinelyvisited certain community organizations (e.g. Fred Victor Centre,Seaton House, etc.) which serve low income individuals.
Recruitment flyers were posted in doctors’ offices, communitycenters, listservs, and day labor centers. The flyers contained verygeneral information about the study and a number to contact ifpotential participants were interested. At some locations, flyerswere also given to potential participants by staff. Those interestedwere asked to phone in and were screened by one of the authors(CS). Participant eligibility was based on meeting the followingcriteria: participants had to have lived in their neighborhoods for 6months or more, be older then 18, have good written and oralEnglish skills (this was required as the concept mapping activitiesrequire manipulation of concepts written on cards and shortsurveys), and had to have time to attend the three concept mappingactivities (additional detail on the activities is provided below).This purposive, qualitative research sampling strategy was inten-ded to identify participants able to address the research goals andwas not intended to ensure generalizability.
Concept mapping activities
The data collection process and analysis process included threeprimary activities; brainstorming sessions; sorting and ratinggroups; pathway identification groups. The data collection andanalysis activities were stratified by geographic location andparticipant socioeconomic position status; individual activitieswere conducted with participants grouped into low socioeconomicposition downtown, non-low socioeconomic position downtown,low socioeconomic position inner suburban and non-low socio-economic position inner suburban. Groups were heterogeneouswith regard to participant gender. All data collection activities wereapproved by St. Michael’s Hospital Research Ethics Board. Whiledetailed descriptions of the concept mapping method and thespecific data collection procedures are described in detail else-where (Burke et al., 2005), each step is briefly described here. Thegroups were held at two different locations that were easilyaccessible by public transportation.
Brainstorming groups
Brainstorming activities were comprised of group sessionsinvolving free-listing of ideas as well as interview and writtenresponses to questions. Most of the brainstorming data werecollected through groups of about 1.5 h in length, two in downtownand two in inner suburban neighborhoods. Three groups were held,two low socioeconomic position groups from the downtown andinner suburban areas, and a non-low socioeconomic position groupfrom the downtown area. Due to time constraints, input from thenon-low socioeconomic position inner suburban participants wasobtained via e-mail solicitation. Because this information wascombined with the brainstorming data from the urban non-lowsocioeconomic position participants, this deviation in data
J. Burke et al. / Social Science & Medicine 68 (2009) 1294–1304 1297
collection method is not likely to have had an affect on the socio-economic position comparisons.
Participants were provided definitions of the terms ‘‘neighbor-hood’’ and ‘‘mental well-being’’ (see Table 1) to ensure that theyhad similar notions of these terms within and across groups. Duringthe group, participants were asked to generate a list of items thatdescribed the ‘‘characteristics of your neighborhood that can affectmental well-being in a good or bad way.’’ This approach is similar tothat of prior fruitful concept mapping research which resulted inimportant data regarding perceptions of the relationships betweenneighborhood characteristics and intimate partner violence(Burke et al., 2006, 2005; O’Campo et al., 2005).
The 381 non-unique items generated across the brainstormingactivities were combined into one master list of 120 items.Consistent with established concept mapping guidelines (Kane &Trochim, 2006), duplicate items were combined to reduce the listto the 120 items on the final master list (see Table 2). This masterlist was necessary for the subsequent sorting and rating groups.
Sorting and rating
Sorting and rating groups of about 4 h in duration were held,two in downtown and two in the inner suburban areas. For thesorting task, participants were asked to place the 120 items fromthe master list into piles that ‘‘made sense to them’’ and label thepiles accordingly. Specifically, participants grouped similar itemstogether according to their own perspectives. For example, oneparticipant may have grouped ‘‘walkable areas’’ with ‘‘pedestrians’’while another participant might have placed ‘‘walkable areas’’ with‘‘bike paths and lanes’’. Labels reflecting the theme of the items inthe pile were given by the participants to each of their piles.Participants were instructed to not have too few piles (e.g. 2) or toomany piles (e.g. 100). After completing the sorting, each participantwas asked to rate the importance of each item with regard to goodmental well-being. The 120 items were included on a single sheet ofpaper where the participants were asked to rate the relationship ofeach item on a scale of 1 (no relationship) to 5 (extremely strongrelationship) to ‘‘a person’s good or positive mental well-being’’.
During the sorting and rating session, the data were immedi-ately entered into the concept systems software (Concept SystemsIncorporated, 2005). Once the data were entered, three core dataanalysis steps contributed to the development of concept maps(Kane & Trochim, 2006). First, each individual’s sorting data wasused to create a similarity matrix illustrating the number ofparticipants who sorted each pair of item statements together.Next, multidimensional scaling (Davison, 1983; Kruskal & Wish,1978) was used to position each statement as a point on a two-dimensional map. Hierarchical cluster analysis was the third stepused to partition the multidimensional scaling coordinates intogroups using Ward’s algorithm (Everitt, 1980). The cluster analysisprocess places similar items into non-overlapping clusters andthe results are displayed as a cluster map.
The concept systems software performs these core data analysistasks quickly which enabled the sharing of results with theparticipants during the latter half of the sorting and rating groupsession. This made it possible for the participants to immediatelyview, understand and participate in the analyses of the conceptmaps that yielded a final group map which represented what theybelieve as a group was the correct representation of their view-points. To analyze the data with participants within the groups, anemphasis was placed on viewing, confirming and correcting theconcept maps. Participants gave input into the number of totalclusters that best represented their ideas. The Concept Systemssoftware allowed for easy display of maps with different numbers
of clusters. The groups ended up with maps that ranged from 5 to6 clusters in size.
Following completion of the sorting and rating groups, theresearcher group conducted additional analysis and synthesis ofthe data to arrive upon the final six cluster concept map. The stressvalue, a key multidimensional scaling diagnostic statistic, for thefinal six cluster map generated with all the participants’ data was0.33 and well within the range of most concept maps generated(Kane & Trochim, 2006). The six cluster concept map was thentaken back to each group and confirmed.
Pathway identification groups
The pathway diagramming groups were about 1.5 h in length.In them, the participants examined the final six cluster conceptmapping and discussed how the neighborhood characteristicsreflected in the six clusters affect mental well-being. Small groupsof three and four participants worked together to create thediagrams that indicated pathways from clusters to mental well-being. Markers and larger sheets of paper were provided and usedfor creating visual representations of the relationship betweenclusters and mental well-being.
Participant socioeconomic position and gender comparisons
Following the completion of the concept mapping activitiesdescribed above, the research team conducted subsequent analysesusing appropriate concept mapping tools to facilitate comparisonsbetween the different socioeconomic position and gender strata ofparticipants (Kane & Trochim, 2006). Using the distribution of itemratings, the rating levels were divided into categories of ‘high’(items rated 3.6 or higher), ‘moderate’ (items rated between 3.5 and2.8) and ‘low’ (items rated 2.7 or lower) (See Table 2). This ratingsystem was then used to explore item ratings across the four strataof interest. In addition, three major concept mapping graphicswere used to examine the data. First cluster rating maps, whichsummarize item specific ratings and produce informationregarding the average rating per cluster, were used to explorepotential differences in rating importance by participant socio-economic position and gender. Next, pattern match displays, whichgenerate a ‘‘ladder graph’’ representation of the data, were used toconduct pairwise comparisons of the cluster ratings by participantsocioeconomic position and gender. Correlation coefficients for thepairwise comparisons were also generated. Finally, ‘go-zone’displays, bivariate plots of the average ratings for each item withina cluster, were created and examined by participant socioeconomicposition and gender. These tools were used for comparison analysesbecause they provide different ways of exploring and visuallyrepresenting the concept mapping data and permit a detailedexploration of similarities and differences by participant socio-economic position and gender.
Results
Sample composition
A total of 36 persons participated in the study; 17 in thedowntown groups and 19 in the inner suburb groups. Among the 21persons in the low socioeconomic position group, 90% had incomesunder $20,000 per year. Of the 15 non-low socioeconomic positionparticipants, 90% earned over $35,000 with some earning over$100,000 per year. A total of 11 men and 25 women participated.
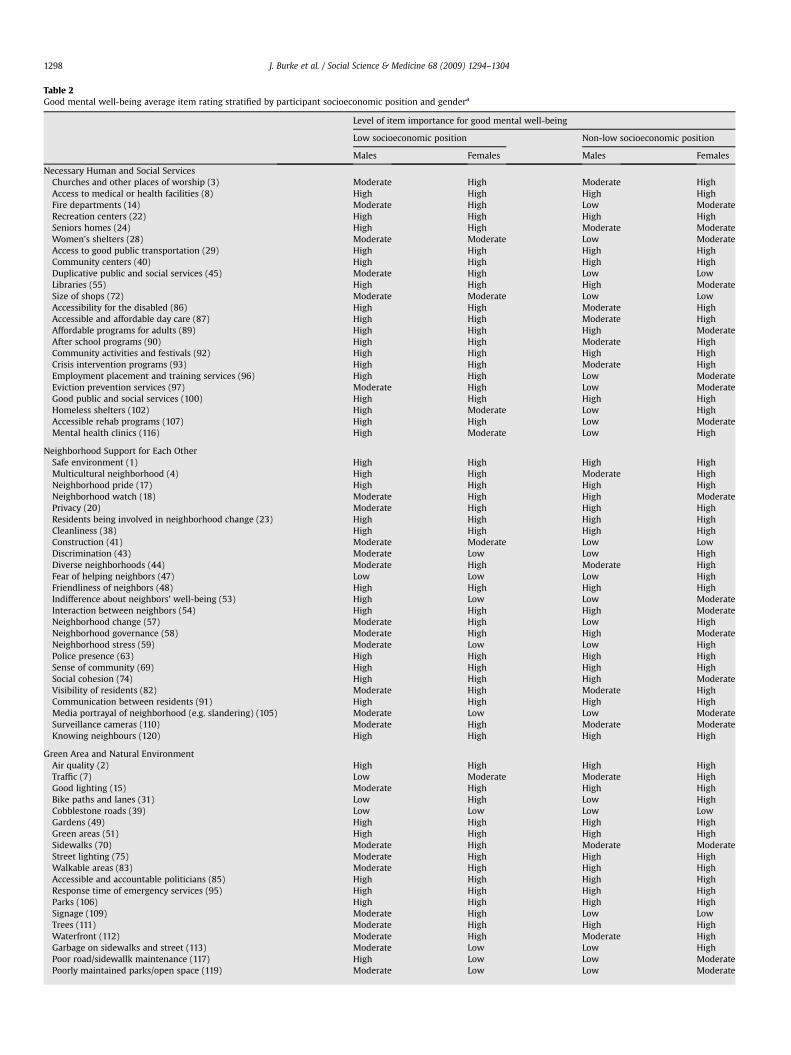
Table 2Good mental well-being average item rating stratified by participant socioeconomic position and gendera
Level of item importance for good mental well-being
Low socioeconomic position Non-low socioeconomic position
Males Females Males Females
Necessary Human and Social ServicesChurches and other places of worship (3) Moderate High Moderate HighAccess to medical or health facilities (8) High High High HighFire departments (14) Moderate High Low ModerateRecreation centers (22) High High High HighSeniors homes (24) High High Moderate ModerateWomen’s shelters (28) Moderate Moderate Low ModerateAccess to good public transportation (29) High High High HighCommunity centers (40) High High High HighDuplicative public and social services (45) Moderate High Low LowLibraries (55) High High High ModerateSize of shops (72) Moderate Moderate Low LowAccessibility for the disabled (86) High High Moderate HighAccessible and affordable day care (87) High High Moderate HighAffordable programs for adults (89) High High High ModerateAfter school programs (90) High High Moderate HighCommunity activities and festivals (92) High High High HighCrisis intervention programs (93) High High Moderate HighEmployment placement and training services (96) High High Low ModerateEviction prevention services (97) Moderate High Low ModerateGood public and social services (100) High High High HighHomeless shelters (102) High Moderate Low HighAccessible rehab programs (107) High High Low ModerateMental health clinics (116) High Moderate Low High
Neighborhood Support for Each OtherSafe environment (1) High High High HighMulticultural neighborhood (4) High High Moderate HighNeighborhood pride (17) High High High HighNeighborhood watch (18) Moderate High High ModeratePrivacy (20) Moderate High High HighResidents being involved in neighborhood change (23) High High High HighCleanliness (38) High High High HighConstruction (41) Moderate Moderate Low LowDiscrimination (43) Moderate Low Low HighDiverse neighborhoods (44) Moderate High Moderate HighFear of helping neighbors (47) Low Low Low HighFriendliness of neighbors (48) High High High HighIndifference about neighbors’ well-being (53) High Low Low ModerateInteraction between neighbors (54) High High High ModerateNeighborhood change (57) Moderate High Low HighNeighborhood governance (58) Moderate High High ModerateNeighborhood stress (59) Moderate Low Low HighPolice presence (63) High High High HighSense of community (69) High High High HighSocial cohesion (74) High High High ModerateVisibility of residents (82) Moderate High Moderate HighCommunication between residents (91) High High High HighMedia portrayal of neighborhood (e.g. slandering) (105) Moderate Low Low ModerateSurveillance cameras (110) Moderate High Moderate ModerateKnowing neighbours (120) High High High High
Green Area and Natural EnvironmentAir quality (2) High High High HighTraffic (7) Low Moderate Moderate HighGood lighting (15) Moderate High High HighBike paths and lanes (31) Low High Low HighCobblestone roads (39) Low Low Low LowGardens (49) High High High HighGreen areas (51) High High High HighSidewalks (70) Moderate High Moderate ModerateStreet lighting (75) Moderate High High HighWalkable areas (83) Moderate High High HighAccessible and accountable politicians (85) High High High HighResponse time of emergency services (95) High High High HighParks (106) High High High HighSignage (109) Moderate High Low LowTrees (111) Moderate High High HighWaterfront (112) Moderate High Moderate HighGarbage on sidewalks and street (113) Moderate Low Low HighPoor road/sidewallk maintenance (117) High Low Low ModeratePoorly maintained parks/open space (119) Moderate Low Low Moderate
J. Burke et al. / Social Science & Medicine 68 (2009) 1294–13041298
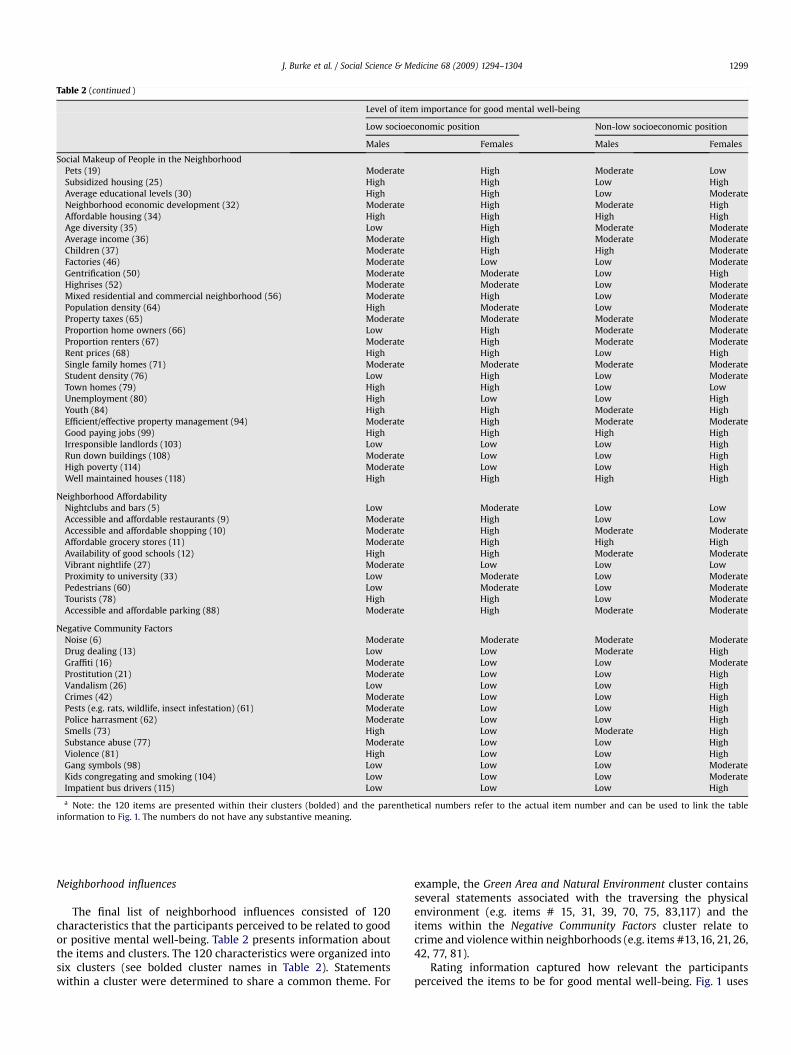
Table 2 (continued )
Level of item importance for good mental well-being
Low socioeconomic position Non-low socioeconomic position
Males Females Males Females
Social Makeup of People in the NeighborhoodPets (19) Moderate High Moderate LowSubsidized housing (25) High High Low HighAverage educational levels (30) High High Low ModerateNeighborhood economic development (32) Moderate High Moderate HighAffordable housing (34) High High High HighAge diversity (35) Low High Moderate ModerateAverage income (36) Moderate High Moderate ModerateChildren (37) Moderate High High ModerateFactories (46) Moderate Low Low ModerateGentrification (50) Moderate Moderate Low HighHighrises (52) Moderate Moderate Low ModerateMixed residential and commercial neighborhood (56) Moderate High Low ModeratePopulation density (64) High Moderate Low ModerateProperty taxes (65) Moderate Moderate Moderate ModerateProportion home owners (66) Low High Moderate ModerateProportion renters (67) Moderate High Moderate ModerateRent prices (68) High High Low HighSingle family homes (71) Moderate Moderate Moderate ModerateStudent density (76) Low High Low ModerateTown homes (79) High High Low LowUnemployment (80) High Low Low HighYouth (84) High High Moderate HighEfficient/effective property management (94) Moderate High Moderate ModerateGood paying jobs (99) High High High HighIrresponsible landlords (103) Low Low Low HighRun down buildings (108) Moderate Low Low HighHigh poverty (114) Moderate Low Low HighWell maintained houses (118) High High High High
Neighborhood AffordabilityNightclubs and bars (5) Low Moderate Low LowAccessible and affordable restaurants (9) Moderate High Low LowAccessible and affordable shopping (10) Moderate High Moderate ModerateAffordable grocery stores (11) Moderate High High HighAvailability of good schools (12) High High Moderate ModerateVibrant nightlife (27) Moderate Low Low LowProximity to university (33) Low Moderate Low ModeratePedestrians (60) Low Moderate Low ModerateTourists (78) High High Low ModerateAccessible and affordable parking (88) Moderate High Moderate Moderate
Negative Community FactorsNoise (6) Moderate Moderate Moderate ModerateDrug dealing (13) Low Low Moderate HighGraffiti (16) Moderate Low Low ModerateProstitution (21) Moderate Low Low HighVandalism (26) Low Low Low HighCrimes (42) Moderate Low Low HighPests (e.g. rats, wildlife, insect infestation) (61) Moderate Low Low HighPolice harrasment (62) Moderate Low Low HighSmells (73) High Low Moderate HighSubstance abuse (77) Moderate Low Low HighViolence (81) High Low Low HighGang symbols (98) Low Low Low ModerateKids congregating and smoking (104) Low Low Low ModerateImpatient bus drivers (115) Low Low Low High
a Note: the 120 items are presented within their clusters (bolded) and the parenthetical numbers refer to the actual item number and can be used to link the tableinformation to Fig. 1. The numbers do not have any substantive meaning.
J. Burke et al. / Social Science & Medicine 68 (2009) 1294–1304 1299
Neighborhood influences
The final list of neighborhood influences consisted of 120characteristics that the participants perceived to be related to goodor positive mental well-being. Table 2 presents information aboutthe items and clusters. The 120 characteristics were organized intosix clusters (see bolded cluster names in Table 2). Statementswithin a cluster were determined to share a common theme. For
example, the Green Area and Natural Environment cluster containsseveral statements associated with the traversing the physicalenvironment (e.g. items # 15, 31, 39, 70, 75, 83,117) and theitems within the Negative Community Factors cluster relate tocrime and violence within neighborhoods (e.g. items #13, 16, 21, 26,42, 77, 81).
Rating information captured how relevant the participantsperceived the items to be for good mental well-being. Fig. 1 uses
Cluster Legend
Layer Value
1 2.41 to 2.74
2 2.74 to 3.07
3 3.07 to 3.40
4 3.40 to 3.73
5 3.73 to 4.05
1
2
3
4
5
6
7
8
9101112
13
14
15
16
1718
1920
21
22
23
24
25
26
27
28
29
30
31
32
33
34
35
36
3738
39
40
41
42 43
44
45
46
47
48
49
50
51
5271
53
54
55
56
5758
59
60
61
62
63
64
65
6667
68
69
7072
7374
75
76
77
78
79
80
81
82
83
84
85
8687
88
8990
91
92
93
94
95
96
97
98
99
100
101
102
103
104105
106
107
108
109
110
111112
113
114115
116
117
118
119
120
Neighborhood
Affordability
Negative Community Factors
Neighborhood Support
for each other
Green Area &
Natural Environment
Necessary Human & Social Services
Social Makeup of People
in the Neighborhood
Fig. 1. Good mental well-being average cluster ratings map for low socioeconomic position participants.
J. Burke et al. / Social Science & Medicine 68 (2009) 1294–13041300
data from the low socioeconomic position participants to presenta cluster rating map. The map visually presents results from boththe sorting and rating data. The item statements in Table 2 can belinked using the item # (noted in parentheses) to the item pointsin the rating cluster map presented in Fig. 1. The relative distancebetween items displayed as points in Fig. 1 illustrates the partic-ipants’ perceptions of the degree of similarity between the items.For example, trees (#111) were considered to be quite differentfrom good paying jobs (item #99). In addition to the item points,the six clusters are illustrated in Fig. 1 and the average ratingvalues for each cluster are presented in three dimensions. A highernumber of layers within a cluster indicate a higher average clusterrating. For example, among the low socioeconomic positionparticipants, the Green Area and Natural Environment clusterwith four layers was rated as more important for good mentalwell-being than the Negative Community Factors cluster whichonly has one layer.
Table 2 presents the item ratings by participant socioeconomicposition and gender status. Those items that received a higheraverage rating are considered to be more strongly related to goodmental well-being. For example, access to medical or health facil-ities (item #8 within the Necessary Human and Social Servicescluster) was felt by all the participants to be highly related to goodmental well-being. On the other hand, all of the participantsfelt that cobblestone roads (item #39 within the Green Area andNatural Environment cluster) were not very relevant to good mentalwell-being.
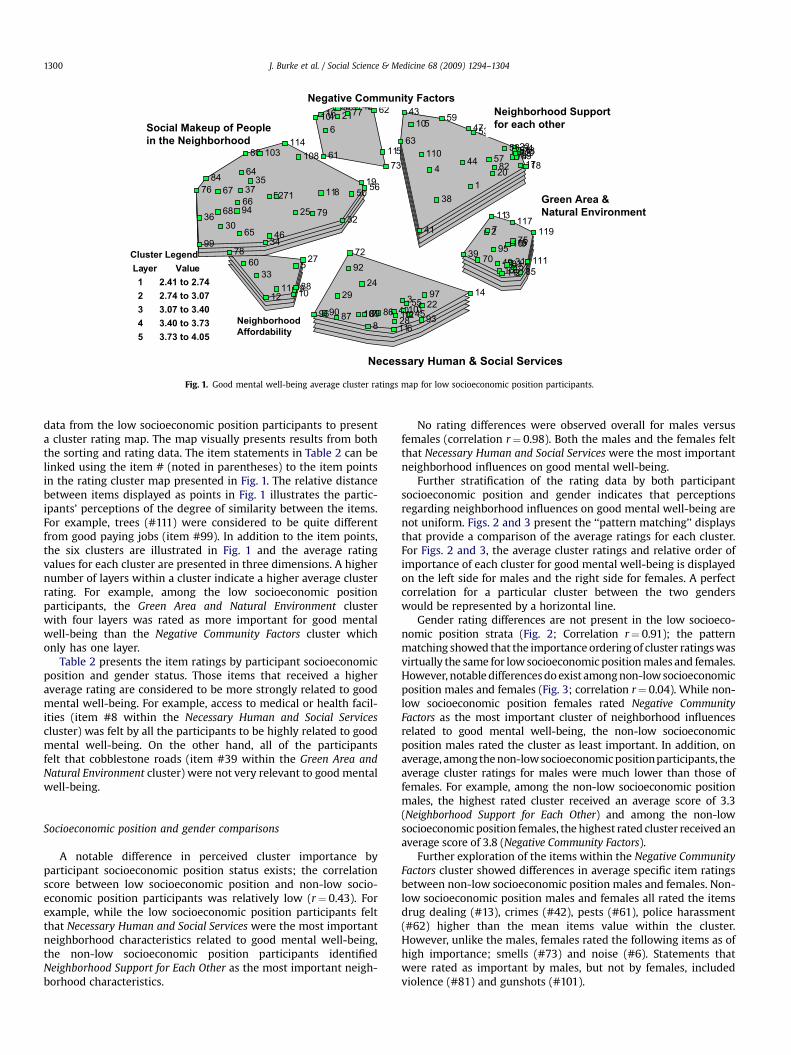
Socioeconomic position and gender comparisons
A notable difference in perceived cluster importance byparticipant socioeconomic position status exists; the correlationscore between low socioeconomic position and non-low socio-economic position participants was relatively low (r¼ 0.43). Forexample, while the low socioeconomic position participants feltthat Necessary Human and Social Services were the most importantneighborhood characteristics related to good mental well-being,the non-low socioeconomic position participants identifiedNeighborhood Support for Each Other as the most important neigh-borhood characteristics.
No rating differences were observed overall for males versusfemales (correlation r¼ 0.98). Both the males and the females feltthat Necessary Human and Social Services were the most importantneighborhood influences on good mental well-being.
Further stratification of the rating data by both participantsocioeconomic position and gender indicates that perceptionsregarding neighborhood influences on good mental well-being arenot uniform. Figs. 2 and 3 present the ‘‘pattern matching’’ displaysthat provide a comparison of the average ratings for each cluster.For Figs. 2 and 3, the average cluster ratings and relative order ofimportance of each cluster for good mental well-being is displayedon the left side for males and the right side for females. A perfectcorrelation for a particular cluster between the two genderswould be represented by a horizontal line.
Gender rating differences are not present in the low socioeco-nomic position strata (Fig. 2; Correlation r¼ 0.91); the patternmatching showed that the importance ordering of cluster ratings wasvirtually the same for low socioeconomic position males and females.However, notable differences do exist among non-low socioeconomicposition males and females (Fig. 3; correlation r¼ 0.04). While non-low socioeconomic position females rated Negative CommunityFactors as the most important cluster of neighborhood influencesrelated to good mental well-being, the non-low socioeconomicposition males rated the cluster as least important. In addition, onaverage, among the non-low socioeconomic positionparticipants, theaverage cluster ratings for males were much lower than those offemales. For example, among the non-low socioeconomic positionmales, the highest rated cluster received an average score of 3.3(Neighborhood Support for Each Other) and among the non-lowsocioeconomic position females, the highest rated cluster received anaverage score of 3.8 (Negative Community Factors).
Further exploration of the items within the Negative CommunityFactors cluster showed differences in average specific item ratingsbetween non-low socioeconomic position males and females. Non-low socioeconomic position males and females all rated the itemsdrug dealing (#13), crimes (#42), pests (#61), police harassment(#62) higher than the mean items value within the cluster.However, unlike the males, females rated the following items as ofhigh importance; smells (#73) and noise (#6). Statements thatwere rated as important by males, but not by females, includedviolence (#81) and gunshots (#101).

Social makeup of people in the neighborhood
Neighborhood support for each other
Negative community factors
Neighborhood affordability
Green area and natural environment
Necessary human and social services
Social makeup of people in the neighborhood
Neighborhood support for each other Green area and natural environmentNecessary human and social services
Neighborhood affordability
Negative community factors
4.5 4.5
1.5 1.5r=0.91
MALES FEMALES
*The two bold vertical lines are visual representations of the average cluster ratings with resultsfor the males presented on the left and for the females on the right.
Fig. 2. Pattern match results for good mental well-being average cluster rating: Low socioeconomic position males versus females*.
J. Burke et al. / Social Science & Medicine 68 (2009) 1294–1304 1301
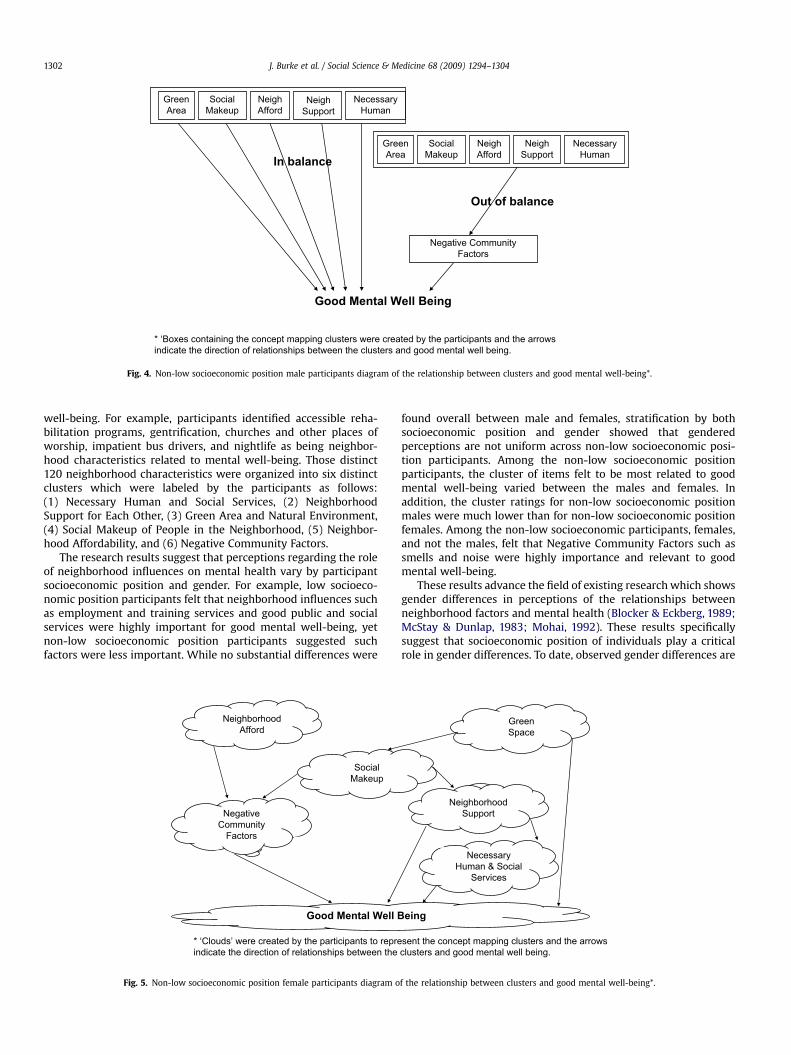
Pathways diagrams
Participants discussed and diagramed how the clusterdomains are related to each other and to good mental well-being.These diagrams offer the participants’ perspective and insightinto the socioeconomic position and gender strata rating differ-ences identified in the ratings data. Fig. 4 presents the diagramfrom a non-low socioeconomic position group of males. Fig. 5presents a diagram from a non-low socioeconomic position groupof females.
The male non-low socioeconomic position participants whodeveloped Fig. 4 created boxes for each cluster and talked abouthow under normal circumstances the goal is for the five clusterson the left side of the diagram to be in balance. If such factors arein balance, then the result is good mental well-being. However, ifthose factors get out of balance (see the right side of thediagram), then you begin to see the Negative Community Factors,and those factors will have a negative impact on good mentalwell-being.
Social makeup of people in the neighborhood
Neighborhood support for each other
Negative community factors
Neighborhood affordability
Green area and natural environmentNecessary human and social services
4.5
1.5 r=0.04
MALES
*The two bold vertical lines are visual representfor the males presented on the left and for the fe
Fig. 3. Pattern match results for good mental well-being average cluste
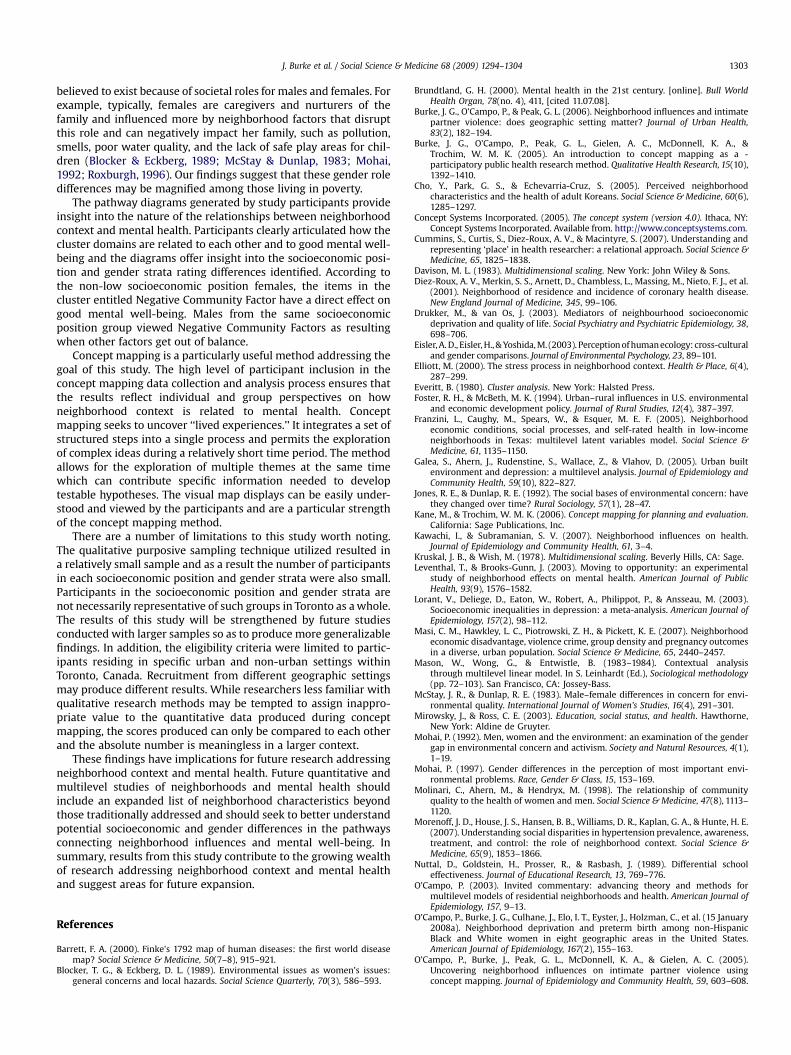
The female non-low socioeconomic position participants whodeveloped Fig. 5 illustrated the relationship between the variousclusters using a set linked ‘clouds’. Their diagram shows that fourclusters (Negative Community Factors, Neighborhood Support, GreenSpace and Necessary Human and Social Services) all have a directeffect on good mental well-being. The other two clusters (Neigh-borhood Affordability and Social Makeup) were felt by the group tohave indirect effects on mental health. The females’ pathwaydiagram is markedly different from that of the males. Specifically,the role of Negative Community Factors differs.
Discussion
Results from this concept mapping research provide newinsights and a lay perspective on how participant socioeconomicposition and gender differentially affect perceptions of the rela-tionship between neighborhood context and good mental well-being. The participants in this study generated 120 distinctneighborhood characteristics perceived to be related to mental
Social makeup of people in the neighborhood
Neighborhood support for each other Green area and natural environmentNecessary human and social services
Neighborhood affordability
Negative community factors
4.5
1.5
FEMALES
ations of the average cluster ratings with resultsmales on the right.
r rating: Non-low socioeconomic position males versus females*.
* ‘Boxes containing the concept mapping clusters were created by the participants and the arrowsindicate the direction of relationships between the clusters and good mental well being.
GreenArea
SocialMakeup
NeighAfford
NeighSupport
NecessaryHuman
GreenArea
SocialMakeup
NeighAfford
NeighSupport
NecessaryHuman
Out of balance
Negative CommunityFactors
Good Mental Well Being
In balance
Fig. 4. Non-low socioeconomic position male participants diagram of the relationship between clusters and good mental well-being*.
J. Burke et al. / Social Science & Medicine 68 (2009) 1294–13041302
well-being. For example, participants identified accessible reha-bilitation programs, gentrification, churches and other places ofworship, impatient bus drivers, and nightlife as being neighbor-hood characteristics related to mental well-being. Those distinct120 neighborhood characteristics were organized into six distinctclusters which were labeled by the participants as follows:(1) Necessary Human and Social Services, (2) NeighborhoodSupport for Each Other, (3) Green Area and Natural Environment,(4) Social Makeup of People in the Neighborhood, (5) Neighbor-hood Affordability, and (6) Negative Community Factors.
The research results suggest that perceptions regarding the roleof neighborhood influences on mental health vary by participantsocioeconomic position and gender. For example, low socioeco-nomic position participants felt that neighborhood influences suchas employment and training services and good public and socialservices were highly important for good mental well-being, yetnon-low socioeconomic position participants suggested suchfactors were less important. While no substantial differences were
* ‘Clouds’ were created by the participants to repreindicate the direction of relationships between the
SocialMakeup
NeighborhoodAfford
Good Mental Well B
NegativeCommunity
Factors
Fig. 5. Non-low socioeconomic position female participants diagram o
found overall between male and females, stratification by bothsocioeconomic position and gender showed that genderedperceptions are not uniform across non-low socioeconomic posi-tion participants. Among the non-low socioeconomic positionparticipants, the cluster of items felt to be most related to goodmental well-being varied between the males and females. Inaddition, the cluster ratings for non-low socioeconomic positionmales were much lower than for non-low socioeconomic positionfemales. Among the non-low socioeconomic participants, females,and not the males, felt that Negative Community Factors such assmells and noise were highly importance and relevant to goodmental well-being.
These results advance the field of existing research which showsgender differences in perceptions of the relationships betweenneighborhood factors and mental health (Blocker & Eckberg, 1989;McStay & Dunlap, 1983; Mohai, 1992). These results specificallysuggest that socioeconomic position of individuals play a criticalrole in gender differences. To date, observed gender differences are
sent the concept mapping clusters and the arrowsclusters and good mental well being.
GreenSpace
NeighborhoodSupport
NecessaryHuman & Social
Services
eing
f the relationship between clusters and good mental well-being*.
J. Burke et al. / Social Science & Medicine 68 (2009) 1294–1304 1303
believed to exist because of societal roles for males and females. Forexample, typically, females are caregivers and nurturers of thefamily and influenced more by neighborhood factors that disruptthis role and can negatively impact her family, such as pollution,smells, poor water quality, and the lack of safe play areas for chil-dren (Blocker & Eckberg, 1989; McStay & Dunlap, 1983; Mohai,1992; Roxburgh, 1996). Our findings suggest that these gender roledifferences may be magnified among those living in poverty.
The pathway diagrams generated by study participants provideinsight into the nature of the relationships between neighborhoodcontext and mental health. Participants clearly articulated how thecluster domains are related to each other and to good mental well-being and the diagrams offer insight into the socioeconomic posi-tion and gender strata rating differences identified. According tothe non-low socioeconomic position females, the items in thecluster entitled Negative Community Factor have a direct effect ongood mental well-being. Males from the same socioeconomicposition group viewed Negative Community Factors as resultingwhen other factors get out of balance.
Concept mapping is a particularly useful method addressing thegoal of this study. The high level of participant inclusion in theconcept mapping data collection and analysis process ensures thatthe results reflect individual and group perspectives on howneighborhood context is related to mental health. Conceptmapping seeks to uncover ‘‘lived experiences.’’ It integrates a set ofstructured steps into a single process and permits the explorationof complex ideas during a relatively short time period. The methodallows for the exploration of multiple themes at the same timewhich can contribute specific information needed to developtestable hypotheses. The visual map displays can be easily under-stood and viewed by the participants and are a particular strengthof the concept mapping method.
There are a number of limitations to this study worth noting.The qualitative purposive sampling technique utilized resulted ina relatively small sample and as a result the number of participantsin each socioeconomic position and gender strata were also small.Participants in the socioeconomic position and gender strata arenot necessarily representative of such groups in Toronto as a whole.The results of this study will be strengthened by future studiesconducted with larger samples so as to produce more generalizablefindings. In addition, the eligibility criteria were limited to partic-ipants residing in specific urban and non-urban settings withinToronto, Canada. Recruitment from different geographic settingsmay produce different results. While researchers less familiar withqualitative research methods may be tempted to assign inappro-priate value to the quantitative data produced during conceptmapping, the scores produced can only be compared to each otherand the absolute number is meaningless in a larger context.
These findings have implications for future research addressingneighborhood context and mental health. Future quantitative andmultilevel studies of neighborhoods and mental health shouldinclude an expanded list of neighborhood characteristics beyondthose traditionally addressed and should seek to better understandpotential socioeconomic and gender differences in the pathwaysconnecting neighborhood influences and mental well-being. Insummary, results from this study contribute to the growing wealthof research addressing neighborhood context and mental healthand suggest areas for future expansion.
References
Barrett, F. A. (2000). Finke’s 1792 map of human diseases: the first world diseasemap? Social Science & Medicine, 50(7–8), 915–921.
Blocker, T. G., & Eckberg, D. L. (1989). Environmental issues as women’s issues:general concerns and local hazards. Social Science Quarterly, 70(3), 586–593.
Brundtland, G. H. (2000). Mental health in the 21st century. [online]. Bull WorldHealth Organ, 78(no. 4), 411, [cited 11.07.08].
Burke, J. G., O’Campo, P., & Peak, G. L. (2006). Neighborhood influences and intimatepartner violence: does geographic setting matter? Journal of Urban Health,83(2), 182–194.
Burke, J. G., O’Campo, P., Peak, G. L., Gielen, A. C., McDonnell, K. A., &Trochim, W. M. K. (2005). An introduction to concept mapping as a -participatory public health research method. Qualitative Health Research, 15(10),1392–1410.
Cho, Y., Park, G. S., & Echevarria-Cruz, S. (2005). Perceived neighborhoodcharacteristics and the health of adult Koreans. Social Science & Medicine, 60(6),1285–1297.
Concept Systems Incorporated. (2005). The concept system (version 4.0). Ithaca, NY:Concept Systems Incorporated. Available from. http://www.conceptsystems.com.
Cummins, S., Curtis, S., Diez-Roux, A. V., & Macintyre, S. (2007). Understanding andrepresenting ‘place’ in health researcher: a relational approach. Social Science &Medicine, 65, 1825–1838.
Davison, M. L. (1983). Multidimensional scaling. New York: John Wiley & Sons.Diez-Roux, A. V., Merkin, S. S., Arnett, D., Chambless, L., Massing, M., Nieto, F. J., et al.
(2001). Neighborhood of residence and incidence of coronary health disease.New England Journal of Medicine, 345, 99–106.
Drukker, M., & van Os, J. (2003). Mediators of neighbourhood socioeconomicdeprivation and quality of life. Social Psychiatry and Psychiatric Epidemiology, 38,698–706.
Eisler, A. D., Eisler, H., & Yoshida, M. (2003). Perception of human ecology: cross-culturaland gender comparisons. Journal of Environmental Psychology, 23, 89–101.
Elliott, M. (2000). The stress process in neighborhood context. Health & Place, 6(4),287–299.
Everitt, B. (1980). Cluster analysis. New York: Halsted Press.Foster, R. H., & McBeth, M. K. (1994). Urban–rural influences in U.S. environmental
and economic development policy. Journal of Rural Studies, 12(4), 387–397.Franzini, L., Caughy, M., Spears, W., & Esquer, M. E. F. (2005). Neighborhood
economic conditions, social processes, and self-rated health in low-incomeneighborhoods in Texas: multilevel latent variables model. Social Science &Medicine, 61, 1135–1150.
Galea, S., Ahern, J., Rudenstine, S., Wallace, Z., & Vlahov, D. (2005). Urban builtenvironment and depression: a multilevel analysis. Journal of Epidemiology andCommunity Health, 59(10), 822–827.
Jones, R. E., & Dunlap, R. E. (1992). The social bases of environmental concern: havethey changed over time? Rural Sociology, 57(1), 28–47.
Kane, M., & Trochim, W. M. K. (2006). Concept mapping for planning and evaluation.California: Sage Publications, Inc.
Kawachi, I., & Subramanian, S. V. (2007). Neighborhood influences on health.Journal of Epidemiology and Community Health, 61, 3–4.
Kruskal, J. B., & Wish, M. (1978). Multidimensional scaling. Beverly Hills, CA: Sage.Leventhal, T., & Brooks-Gunn, J. (2003). Moving to opportunity: an experimental
study of neighborhood effects on mental health. American Journal of PublicHealth, 93(9), 1576–1582.
Lorant, V., Deliege, D., Eaton, W., Robert, A., Philippot, P., & Ansseau, M. (2003).Socioeconomic inequalities in depression: a meta-analysis. American Journal ofEpidemiology, 157(2), 98–112.
Masi, C. M., Hawkley, L. C., Piotrowski, Z. H., & Pickett, K. E. (2007). Neighborhoodeconomic disadvantage, violence crime, group density and pregnancy outcomesin a diverse, urban population. Social Science & Medicine, 65, 2440–2457.
Mason, W., Wong, G., & Entwistle, B. (1983–1984). Contextual analysisthrough multilevel linear model. In S. Leinhardt (Ed.), Sociological methodology(pp. 72–103). San Francisco, CA: Jossey-Bass.
McStay, J. R., & Dunlap, R. E. (1983). Male–female differences in concern for envi-ronmental quality. International Journal of Women’s Studies, 16(4), 291–301.
Mirowsky, J., & Ross, C. E. (2003). Education, social status, and health. Hawthorne,New York: Aldine de Gruyter.
Mohai, P. (1992). Men, women and the environment: an examination of the gendergap in environmental concern and activism. Society and Natural Resources, 4(1),1–19.
Mohai, P. (1997). Gender differences in the perception of most important envi-ronmental problems. Race, Gender & Class, 15, 153–169.
Molinari, C., Ahern, M., & Hendryx, M. (1998). The relationship of communityquality to the health of women and men. Social Science & Medicine, 47(8), 1113–1120.
Morenoff, J. D., House, J. S., Hansen, B. B., Williams, D. R., Kaplan, G. A., & Hunte, H. E.(2007). Understanding social disparities in hypertension prevalence, awareness,treatment, and control: the role of neighborhood context. Social Science &Medicine, 65(9), 1853–1866.
Nuttal, D., Goldstein, H., Prosser, R., & Rasbash, J. (1989). Differential schooleffectiveness. Journal of Educational Research, 13, 769–776.
O’Campo, P. (2003). Invited commentary: advancing theory and methods formultilevel models of residential neighborhoods and health. American Journal ofEpidemiology, 157, 9–13.
O’Campo, P., Burke, J. G., Culhane, J., Elo, I. T., Eyster, J., Holzman, C., et al. (15 January2008a). Neighborhood deprivation and preterm birth among non-HispanicBlack and White women in eight geographic areas in the United States.American Journal of Epidemiology, 167(2), 155–163.
O’Campo, P., Burke, J., Peak, G. L., McDonnell, K. A., & Gielen, A. C. (2005).Uncovering neighborhood influences on intimate partner violence usingconcept mapping. Journal of Epidemiology and Community Health, 59, 603–608.

J. Burke et al. / Social Science & Medicine 68 (2009) 1294–13041304
O’Campo, P., Salmon, C., Burke, J., & Dunn, J. (Febraury 23, 2008b). Neighborhoodsand mental well-being: what are the pathways? Health & Place. (epub aheadof print).
Ostir, G. V., Eschbach, K., Markides, K. S., & Goodwin, J. S. (2003). Neighbourhoodcomposition and depressive symptoms among older Mexican Americans.Journal of Epidemiology and Community Health, 57, 987–992.
Pampalon, R., Hamel, D., De Koninck, M., & Distant, M. (2007). Perception of placeand health: differences between neighbourhoods in the Quebec City region.Social Science & Medicine, 65(1), 95–111.
Patel, V., Flisher, A. J., & Cohen, A. (2006). Mental health. In M. H. Merson, R. E.Black, A. J. Mills (Eds). International public health: Diseases, programs,systems and policies (pp. 355–392). Sudbury, Massachusetts: Jones andBartlett Publishers.
Phongsavan, P., Chey, T., Bauman, A., Brooks, R., & Silove, D. (2006). Social capital,socio-economic status and psychological distress among Australian adults.Social Science & Medicine, 63, 2546–2561.
Popay, J., Thoman, C., Williams, G., Bennett, S., Gattrell, A., & Bostock, L. (2003). Aproper place to live: health inequalities, agency and the normative dimensionsof space. Social Science & Medicine, 57, 55–69.
Prince, M., Patel, V., Sexana, S., Maj, M., Maselko, J., Phillips, M. R., et al. (2007).No health without mental health. Lancet, 370, 859–877.
Propper, C., Jones, K., Bolster, A., Burgess, S., Johnston, R., & Sarker, R. (2005).Local neighbourhood and mental health: evidence from the UK. Social Science &Medicine, 61, 2065–2083.
Rajaratnam, J. K., Burke, J. G., & O’Campo, P. (2006). Maternal and child health andneighborhood context: the selection and construction of area-level variables.Health & Place, 12, 547–556.
Raudenbush, S., & Bryk, A. (1986). A hierarchical model for studying school effects.Educational Studies, 59, 1–17.
Raudsepp, M. (2001). Some socio-demographic and socio-psychological predictorsof environmentalism. Trames, 5(55/50), 355–367, 3.
Ross, C. E. (2000). Neighborhood disadvantage and adult depression. Journal ofHealth and Social Behavior, 41(2), 177–187.
Roxburgh, S. (1996). Gender differences in work and well-being: effects of exposureand vulnerability. Journal of Health and Social Behavior, 37, 265–277.
Stafford, M., Bartley, M., Boreham, R., Thomas, R., Wilkinson, R., & Marmot, M.(2004). Neighbourhood social cohesion and health: investigating associations
and possible mechanisms. In A. Morgan, & C. Swann (Eds.), Social capital forhealth: Issues of definition, measurement and links to health. London: HealthDevelopment Agency.
Stafford, M., & Marmot, M. (2003). Neighbourhood deprivation and health: does itaffect us equally? International Journal of Epidemiology, 32, 357–366.
Steptoe, A., & Feldman, P. J. (2001). Neighborhood problems as sources of chronicstress: development of a measure of neighborhood problems, and associationswith socioeconomic status and health. Annals of Behavioral Medicine, 23(3),177–185.
Sundquist, K., & Ahlen, H. (2006). Neighbourhood income and mental health:a multilevel follow-up study of psychiatric hospital admissions among 4.5million women and men. Health & Place, 12, 594–602.
Trochim. (1989). An introduction to concept mapping for program planning andevaluation. Evaluation and Program Planning, 12, 1–16.
Truong, K. D., & Ma, S. (2006). A systematic review of relations betweenneighborhoods and mental health. Journal of Mental Health Policy andEconomics, 9(3), 137–154.
Weissman, M. M., Bland, R. C., Canino, G. J., Faravelli, C., Greenwald, S., Hwu, H. G., etal. (1996). Cross-national epidemiology of major depression and bipolardisorder. JAMA, 276(4), 293–299.
Wen, M., Hawkley, L. C., & Cacioppo, J. T. (2006). Objective and perceivedneighborhood environment, individual SES and psychosocial factors, and self-rated health: an analysis of older adults in Cook County, Illinois. Social Science &Medicine, 63, 2575–2590.
Wight, R. G., Cummings, J. R., Miller-Martinez, D., Karlamangla, A. S., Seeman, T. E., &Aneshensel, C. S. (2008). A multilevel analysis of urban neighborhoodsocioeconomic disadvantage and health in later life. Social Science & Medicine,66, 862–872.
Wilson, K., Elliott, S., Law, M., Eyles, J., Jerrett, M., & Keller-Olaman, S. (2004). Linkingperceptions of neighbourhood to health in Hamilton, Canada. Journal ofEpidemiology and Community Health, 58, 192–198.
Wilson, W. J. (1996). When work disappears. Political Science Quarterly, 111(4),567–595.
Winkleby, M. A., & Cubbin, C. (2003). Influence of individual and neighbourhoodsocioeconomic status on mortality among black, Mexican-American, and whitewomen and men in the United States. Journal of Epidemiology and CommunityHealth, 57(6), 444–452.