Ionic Compounds Ionic Compounds Ionic Compounds Ionic Compounds Ch.6 & 7.
1
Paper # 82
PATHWAY FOR HIGH-QUALITY RECLAIM BY THERMAL TREATMENT OF SULFUR-VULCANIZED SBR
By S. Saiwari*, W.K. Dierkes and J.W.M. Noordermeer. Department of Elastomer Technology and Engineering,
University of Twente, 7500AE Enschede, the Netherlands
Presented at the Fall 180th Technical Meeting of the Rubber Division of the American Chemical Society, Inc.
Cleveland, OH October 11-13, 2011
ISSN: 1547-1977
*Speaker

2
PATHWAY FOR HIGH-QUALITY RECLAIM
BY THERMAL TREATMENT OF SULFUR-VULCANIZED SBR
By
S. SAIWARI, W.K. DIERKES AND J.W.M. NOORDERMEER*.
DEPARTMENT OF ELASTOMER TECHNOLOGY AND ENGINEERING, UNIVERSITY OF TWENTE, 7522AE ENSCHEDE, THE NETHERLANDS
*Corresponding author. Ph: +31 (0)53 489 2529; Fax: + 31 (0)53 489 2151;
email: [email protected]
ABSTRACT
De-vulcanization of SBR (Styrene Butadiene Rubber) is a challenge, as the
broken polymer chains tend to re-arrange. This influences the properties of the
reclaimed and re-vulcanized rubber, and reduces the quality of the recycled material.
Within this study, the breakdown of sulfur-cured SBR in a thermal de-
vulcanization process is investigated under various conditions: The temperature range
for the de-vulcanization is varied from 180 ºC to 300 ºC, and the treatments are done
in air and under oxygen exclusion with nitrogen. Depending on the parameters used,
the sol fraction increased as expected, crosslink density first decreased, but increased
again above a temperature threshold of 220 ºC. The reasons for this increase in
crosslink density are complicated intra-molecular rearrangements of chain fragments
due to uncontrolled degradation and oxidation effects. This is confirmed by FT-IR and
TGA measurements. Preventing oxidation during thermal treatment reduces the degree
of rearrangements and results in significantly improved SBR reclaim properties.

3
INTRODUCTION
Synthetic Styrene-Butadiene Rubber (SBR) is widely used in the rubber
industry, especially in passenger car tire treads in which it provides a good balance of
abrasion resistance, aging stability and dynamic properties. Solution-SBR (S-SBR) is
used especially for silica-reinforced treads, as this combination reduces rolling
resistance for about 30% compared to carbon black filled treads.
There have been many attempts to recycle SBR rubber. However, de-
vulcanization of SBR is difficult due to the specific structure of the elastomer. In SBR
de-vulcanization, network breakdown occurs, but at the same time network
recombination takes place. The reaction mechanisms of SBR de-vulcanization are not
very well documented. Although the molecular structures of SBR as well as of Natural
Rubber (NR) have C=C double bonds in the main chain, they do not react in the same
way under identical de-vulcanization conditions. A first comparative study of SBR and
NR recycling or de-vulcanization was reported by Hader and le Beau1 in 1951. They
stated that molecular breakdown of SBR is complicated and difficult to explain, unlike
the breakdown of natural rubber. In the NR de-vulcanization process, the predominant
reaction is scission of the hydrocarbon molecule; recombination of chain fragments
occurs only to a small extent. The complicated structure of SBR is related to the
various possible molecular configurations inherent to the polymerization mechanism
of the monomers, as well as to the specific behavior of the copolymer. In the SBR de-
vulcanization process a considerable amount of main chain scission takes place, which
is outbalanced by an extensive recombination of molecular fragments as the de-
vulcanization process proceeds, resulting in progressive hardening of the elastomer.
Consequently, plasticity decreases again after an initial increase. These unique
characteristics of SBR were confirmed by studying ultrasonic de-vulcanization of
4
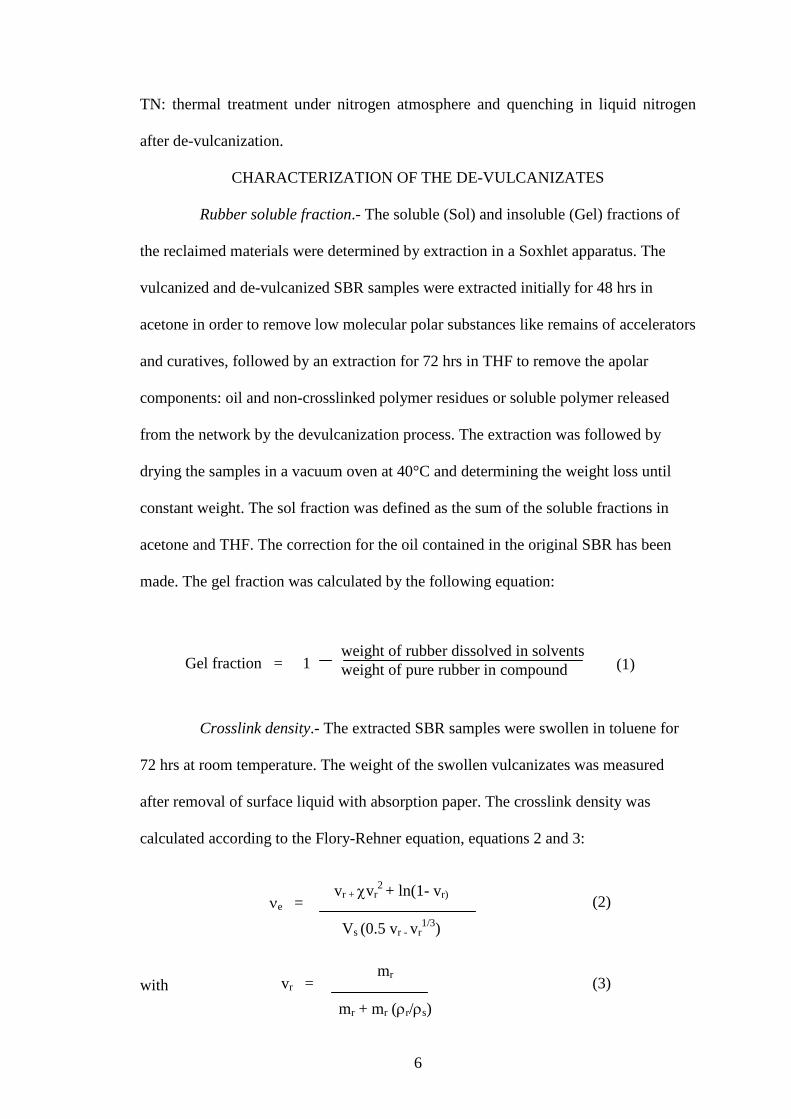
SBR2-8. During ultrasonic treatment of SBR, network formation and chain branching
occur simultaneously due to the formation of macroradicals. The generation of these
macroradicals is induced by high energy density areas caused by the ultrasonic
treatment.
In the present paper, special attention will be devoted to the network
breakdown and re-formation of sulfur-cured SBR in a thermal de-vulcanization
process. To get a better understanding of the mechanisms that govern the changes of
the molecular structure of SBR, the investigations were done under various conditions:
The temperature range for the experiments was from 180ºC to 300ºC, and the
treatments were done in air and under nitrogen. The mechanical properties of various
de-vulcanized SBR vulcanizates are compared. Finally, an application study for re-
utilization of the de-vulcanizate in a blend with a virgin compound is performed.
EXPERIMENTAL MATERIALS
The SBR type used in this investigation was SBR 1723, an oil extended SBR
containing 37.5 phr of treated distillate aromatic extracts (
PREPARATION OF DEVULCANIZED SBR
TDAE) oil, obtained from
Dow Chemical, Germany. The polymer contained 23.5 wt% styrene, and its Mooney
viscosity ML(1+4) measured at 100ºC was 40 MU. Zinc oxide, ZnO, and stearic acid
were obtained from Flexsys, The Netherlands. The curatives: sulfur and N-tert-butyl-
2-benzothiazolesulfenamide, TBBS, were both obtained from Merck. The solvents,
acetone and tetrahydrofuran (THF), which were used for extractions, and toluene,
which was used for equilibrium swelling measurements, were obtained from Biosolve.

5
Mixing and vulcanization.- The SBR was first compounded using a
Brabender Plasticorder 350S mixer with a mixing chamber volume of 350 cm3. The
compounding formulation was according to ASTM D3185-99 as shown in Table 1,
but excluding the carbon black for the material that is to be de-vulcanized. The mixer
was operated at a rotor speed of 60 rpm; a fill factor of 0.75 and an initial temperature
of 50 ºC were used. The final compound temperature before dumping was in the range
of 70-90 ºC. The compounds was tested for its cure characteristics using a RPA 2000
dynamic mechanical curemeter from Alpha Technologies at 160 and 170 ºC, 0.833 Hz
and 0.2 degree strain, according to ISO 6502. The SBR compounds were then
vulcanized for tc,
Grinding.- The vulcanized SBR sheets were subsequently ground in a Fritsch
Universal Cutting Mill Pulverisette 19 (Fritsch, Germany) with a 2 mm screen. The
particle size of the ground rubber was in the range of 0.85-2.00 mm.
90 + 5 minutes in a Wickert WLP1600 laboratory compression
molding press at 170 ºC and 100 bar, into 2 mm thick sheets.
De-vulcanization.- The thermal de-vulcanization was performed in a batch
process in an internal mixer Brabender Plasticorder PL-2000, having a mixing
chamber volume of 50 ml and a cam-type rotor. A fill factor of 0.7 and a constant
rotor speed of 50 rpm were used. The de-vulcanization temperature was varied from
180 to 300 ºC and the de-vulcanization time was 5 minutes. After de-vulcanization, the
material was taken out of the internal mixer under 2 different conditions, into
atmospheric air and into liquid nitrogen.
The following variations of the experimental conditions are compared in this study:
TT: thermal treatment without exclusion of oxygen;
TL: thermal treatment and quenching in liquid nitrogen after de-vulcanization;
6
TN: thermal treatment under nitrogen atmosphere and quenching in liquid nitrogen
after de-vulcanization.
CHARACTERIZATION OF THE DE-VULCANIZATES
Rubber soluble fraction.- The soluble (Sol) and insoluble (Gel) fractions of
the reclaimed materials were determined by extraction in a Soxhlet apparatus. The
vulcanized and de-vulcanized SBR samples were extracted initially for 48 hrs in
acetone in order to remove low molecular polar substances like remains of accelerators
and curatives, followed by an extraction for 72 hrs in THF to remove the apolar
components: oil and non-crosslinked polymer residues or soluble polymer released
from the network by the devulcanization process. The extraction was followed by
drying the samples in a vacuum oven at 40°C and determining the weight loss until
constant weight. The sol fraction was defined as the sum of the soluble fractions in
acetone and THF. The correction for the oil contained in the original SBR has been
made. The gel fraction was calculated by the following equation:
Crosslink density.- The extracted SBR samples were swollen in toluene for
72 hrs at room temperature. The weight of the swollen vulcanizates was measured
after removal of surface liquid with absorption paper. The crosslink density was
calculated according to the Flory-Rehner equation, equations 2 and 3:
with
(2)
(3)
(1) weight of rubber dissolved in solvents weight of pure rubber in compound Gel fraction = 1
νe = vr + χvr
2 + ln(1- vr)
Vs (0.5 vr - vr1/3)
vr = mr
mr + mr (ρr/ρs)

7
where:
νe = crosslink density per unit volume;
vr = polymer volume fraction of the swollen sample;
Vs = solvent molar volume;
mr = mass of the rubber network;
ms = weight of solvent in the sample at equilibrium swelling;
ρr = density of the rubber;
ρs = density of the solvent;
χ = Flory-Huggins polymer-solvent interaction parameter.
Viscosity.- Complex viscosity values were analyzed via dynamic viscoelastic
measurements performed with the RPA 2000. The oscillation frequency was set in the
range of 0.01-33 Hz at a constant strain of 0.56%. This strain was chosen in order to
assure linear viscoelastic behavior during the test. The frequency-sweeps of cured
specimens were performed after vulcanization for t90
at the appropriate temperature,
followed by a cooling step to reach 100°C in the RPA. The storage (G') and loss shear
(G'') modulus were measured. The complex viscosities, η*, were then calculated by
the following equations:
(η*)2 = (η')2 + (η'')2
where η' = G''/ ω
η'' = G'/ ω
Thermogravimetric analysis (TGA).- The thermal decomposition behavior of
vulcanized and de-vulcanized SBR was analyzed by thermogravimetric analysis
(TGA) using a TGA7 from Perkin Elmer. Approximately 5-10 mg of the sample were
heated with a heating rate of 10°C/min. in a nitrogen atmosphere.
(4)
(5)
(6)

8
FT-IR spectroscopy.- Fourier transform infrared (FT-IR) spectra were
recorded on a Perkin Elmer 100 Series system using an Attenuated Total Reflectance
(ATR) attachment, which enables samples to be examined in the solid or liquid state
without further preparation. The spectra were recorded with a resolution of 4.0 cm-1
;
the number of scans was 16 and the scan range 4000-650 cm-1
.
RE-VULCANIZATION AND MECHANICAL PROPERTIES
After the de-vulcanization, selected de-vulcanized material (de-vulcanized
rubber at de-vulcanization temperature of 220 °C) was blended with the original virgin
SBR at a blending ratio of 50/50 and compounded with the formulation according to
ASTM D3185-99 shown in Table 1. In this case carbon black was included. The
following notations were used:
SBR/D-TT: blend of virgin SBR with de-vulcanizate from thermal treatment without
exclusion of oxygen;
SBR/D-TL: blend of virgin SBR with de-vulcanizate from thermal treatment with
quenching in liquid nitrogen after de-vulcanization;
SBR/D-TN: blend of virgin SBR with de-vulcanizate from thermal treatment under
nitrogen atmosphere and quenching in liquid nitrogen after de-vulcanization.
The de-vulcanized rubber, virgin SBR and the blends as well as the curing
additives were mixed on a laboratory scale Schwabenthan two-roll mill (15 x 33 cm
Polymix 80). The amounts of curatives were based on the total SBR polymer content,
including the polymer content of the de-vulcanized rubber. The compounds were
sheeted off at a thickness of approximately 2 mm and vulcanized again as described
above. The cured sheets had a thickness of 2 mm for tensile test samples.
Tensile tests were carried out on dumb-bell shaped specimens (type 2)
according to ISO 37, using a Zwick Z1.0 tensile testing machine. The tests were

9
performed at a constant crosshead speed of 500 mm/min, using a load cell of 500N.
The hardness of the samples was measured with a Zwick hardness tester, Shore A
type, according to ASTM D2240-02.
RESULTS AND DISCUSSION
RUBBER SOL FRACTIONS AFTER DE-VULCANIZATION The sol fractions of the TT, TL and TN de-vulcanizates are depicted in
Figure 1 as a function of the devulcanization temperature. Thermal treatment of sulfur-
cured SBR at 180 °C exhibits a sol fraction similar to the sol fraction of untreated
SBR. This is an indication that at this temperature the rubber network is still fully
intact. The soluble fraction then increases with increasing de-vulcanization
temperature up to 220 °C: The increase of the rubber sol fraction indicates the extent
to which the rubber network is broken. Above this temperature, the sol fractions
decrease again. This may be attributed to a more extensive generation of reactive
radicals and to the complex chemical transformations taking place at higher de-
vulcanization temperatures. These chemical transformations are main chain scission,
breakup of poly-, di- and monosulfidic crosslinks, transformation of sulfidic crosslinks
into cyclic sulfidic structures on the elastomer backbone, and transformation of
polysulfidic crosslinks into di- and monosulfidic crosslinks6. Prominence of these
phenomena with increasing de-vulcanization temperature lead to formation of new
inter- and intramolecular bonds9 resulting in a decrease of the rubber sol fraction
above a certain temperature threshold. Additionally, it can be seen that the sol fraction
increases with exclusion of oxygen in de-vulcanization process. The TN sample,
treatment under nitrogen atmosphere, shows the highest rubber sol fractions for all
temperatures. Exclusion of oxygen, or in other words, an inert de-vulcanization
10
condition leads to suppression of the generation of reactive radicals followed by
reduction of the complex chemical transformations. With increasing temperature, the
difference in sol fraction between the samples is reduced: breakdown of the polymer
chains and reformation of bonds is mainly governed by temperature and less by the
presence of oxygen. At temperatures from 250°C onwards, the sol fractions of the two
samples without nitrogen atmosphere, TL and TT, are almost equal and significantly
lower than the sol fraction of the TN sample. This emphasizes the importance of an
oxygen-free atmosphere during devulcanization.
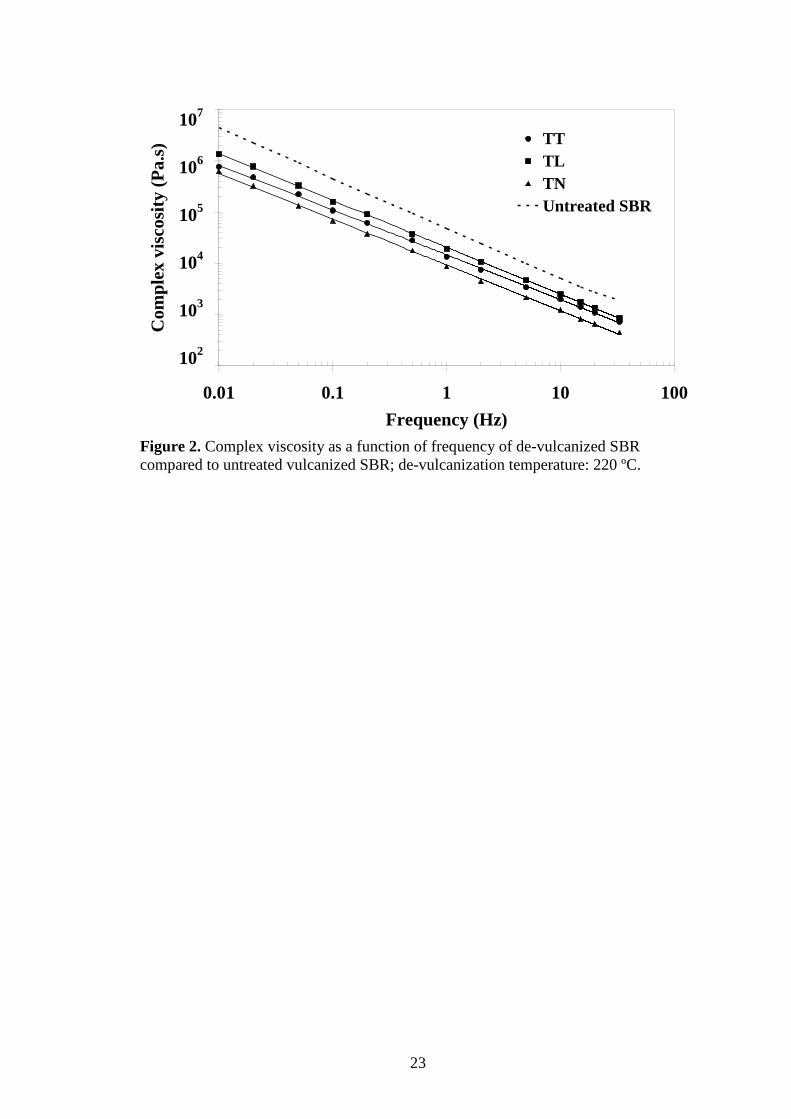
VISCOSITY
Plots of complex viscosity versus oscillating frequency of the 220°C
de-vulcanized SBR materials are shown in Figure 2. The viscosity levels of the
de-vulcanized SBR samples are significantly lower than that of untreated SBR, due to
the cleavage of the three dimensional rubber networks during de-vulcanization by both
main-chain and crosslink scission. The viscosity curve of the de-vulcanized materials
treated under nitrogen atmosphere and quenched in liquid nitrogen is the lowest. The
trend of the viscosity curves corresponds well with the trend of the extracted rubber
sol fraction (Fig. 1). This indicates that the generation of small molecular chains
during de-vulcanization which are extracted in the rubber sol fraction measurement, is
also explicitly demonstrated in the low viscosity of the material.
CROSSLINK DENSITY
The crosslink densities of the three de-vulcanized SBR samples, TT, TL and
TN, are shown in Figure 3 as a function of de-vulcanization temperature. Increase of
the de-vulcanization temperature up to 220°C results in a decrease of the crosslink
density. There is a slight difference between the 3 samples to the benefit of TN. At
temperatures above 220 °C, a significant influence of the de-vulcanization condition
11
on the crosslink density is observed. Within this temperature range, the crosslink
density first decreases, but increases again at higher temperature. This effect occurs
under all de-vulcanization conditions and is most pronounced for the thermal
treatment without exclusion of oxygen: TT. This is in accordance with the trend found
for the sol fraction. Therefore, the nitrogen blanket prevents to a large extent the
increase in crosslink density due to air or oxygen.
MECHANISTIC CONSIDERATIONS
A useful tool to further understand the de-vulcanization mechanism is the
method developed by Horikx10: the rubber sol fraction of the de-vulcanizates and the
crosslink density of the rubber gel fractions are correlated. Horikx derived a
theoretical relationship between the soluble fraction generated after degradation of a
polymer network and the relative decrease in crosslink density, as a result of either
main-chain scission or crosslink breakage. This treatment of polymer degradation can
equally well be applied to rubber reclaiming, where also a mix of main-chain scission
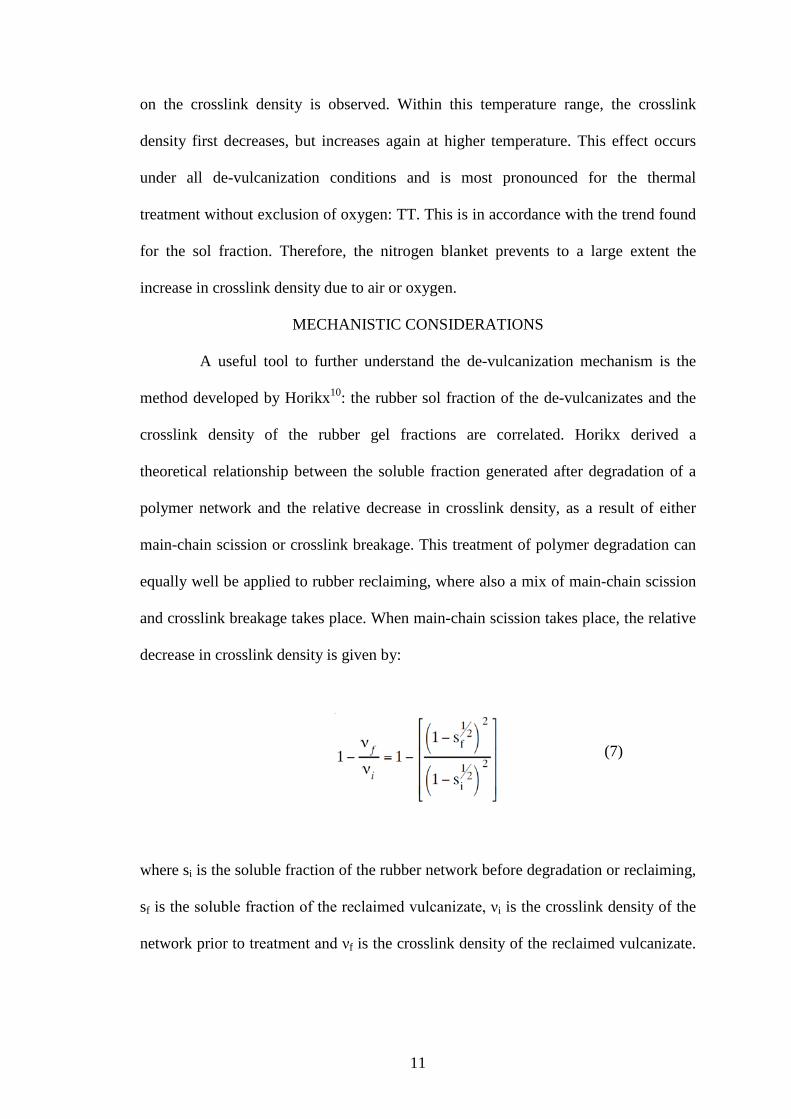
and crosslink breakage takes place. When main-chain scission takes place, the relative
decrease in crosslink density is given by:
where si is the soluble fraction of the rubber network before degradation or reclaiming,
sf is the soluble fraction of the reclaimed vulcanizate, νi is the crosslink density of the
network prior to treatment and νf is the crosslink density of the reclaimed vulcanizate.
(7)
12
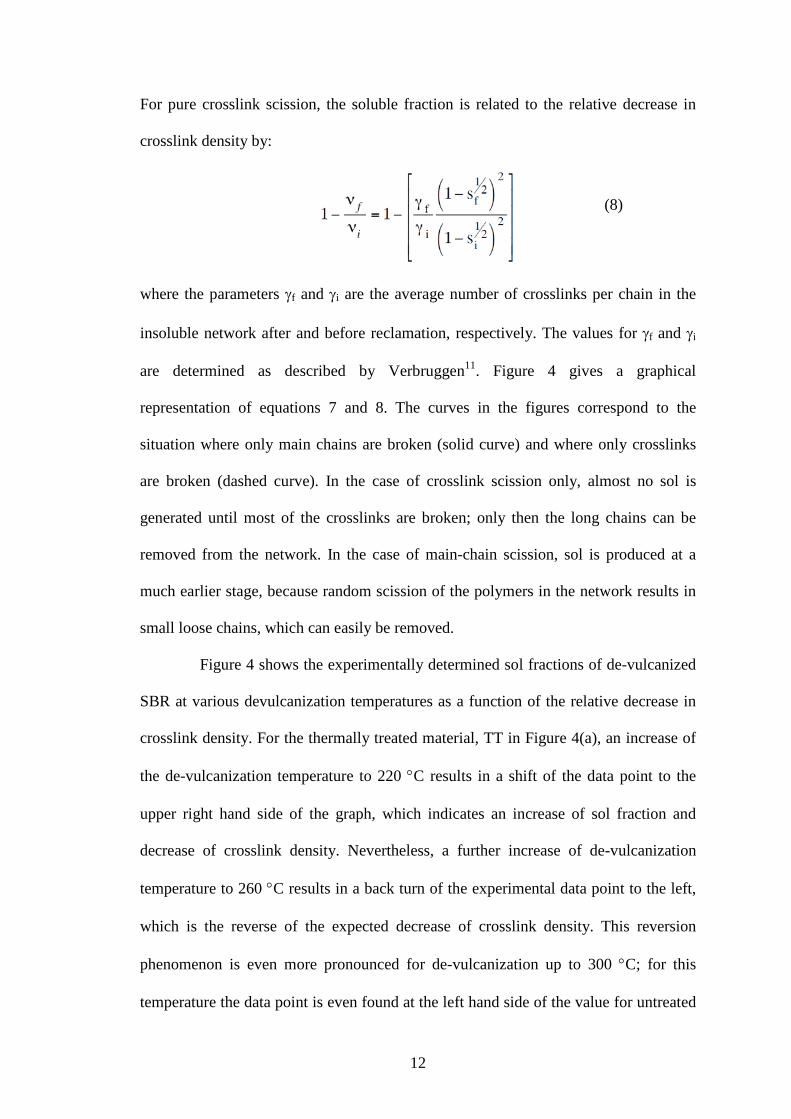
For pure crosslink scission, the soluble fraction is related to the relative decrease in
crosslink density by:
where the parameters γf and γi are the average number of crosslinks per chain in the
insoluble network after and before reclamation, respectively. The values for γf and γi
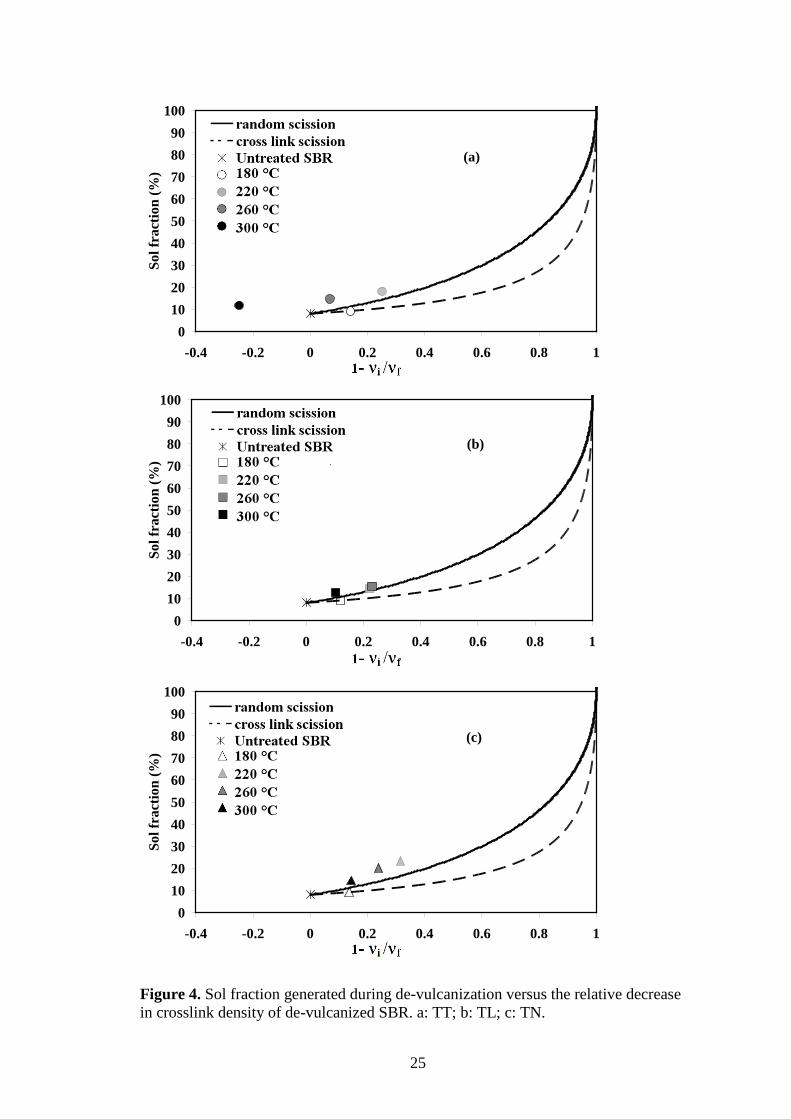
are determined as described by Verbruggen11. Figure 4 gives a graphical
representation of equations 7 and 8. The curves in the figures correspond to the
situation where only main chains are broken (solid curve) and where only crosslinks
are broken (dashed curve). In the case of crosslink scission only, almost no sol is
generated until most of the crosslinks are broken; only then the long chains can be
removed from the network. In the case of main-chain scission, sol is produced at a
much earlier stage, because random scission of the polymers in the network results in
small loose chains, which can easily be removed.
Figure 4 shows the experimentally determined sol fractions of de-vulcanized
SBR at various devulcanization temperatures as a function of the relative decrease in
crosslink density. For the thermally treated material, TT in Figure 4(a), an increase of
the de-vulcanization temperature to 220 °C results in a shift of the data point to the
upper right hand side of the graph, which indicates an increase of sol fraction and
decrease of crosslink density. Nevertheless, a further increase of de-vulcanization
temperature to 260 °C results in a back turn of the experimental data point to the left,
which is the reverse of the expected decrease of crosslink density. This reversion
phenomenon is even more pronounced for de-vulcanization up to 300 °C; for this
temperature the data point is even found at the left hand side of the value for untreated
(8)

13
SBR. The detrimental effect of the presence of oxygen in the de-vulcanization process
causes inefficient de-vulcanization, in which the crosslink density of the de-vulcanized
rubber is even higher than that of the untreated vulcanized one.
A suppression of the inefficient de-vulcanization is observed when oxygen is
excluded; the results of the TL and TN sample are shown in Figure 4 (b) and (c),
respectively. These figures illustrate that the experimental data for treatment at 180 °C
are situated at more or less the same position as the data for TT. An increase of the de-
vulcanization temperature to 220 °C exhibits the same trend as found for TT: the
percentage of soluble polymer is increased and the crosslink density is decreased. For
TL, the values after treatment at 260°C are more or less at the same position as the
values for the materials de-vulcanized at 220°C; however, the reversion phenomenon
still occurs when the de-vulcanization temperature is further raised above 260°C. For
TN, the data points first move to the right hand side for a treatment temperature of
220°C, but then turn back to the left hand side for de-vulcanization temperatures of
260°C and 300°C. However, the detrimental effect of the presence of oxygen in the
de-vulcanization is smallest with nitrogen present during de-vulcanization and
quenching in liquid nitrogen. The reversion phenomenon is less progressive in this
case as the crosslink densities observed are still lower than the crosslink densities of
de-vulcanized rubber treated at 180°C and untreated rubber. Thus, it must be
concluded that working under exclusion of oxygen during and after de-vulcanization is
a requirement for an efficient de-vulcanization process of SBR, and the temperature of
220°C is the optimum for de-vulcanization. Above 220°C reversion phenomena
appear, whatever conditions are used. Based on the results, it is to be concluded that
the de-vulcanization as obtained under the present conditions is primarily via the
mechanism of main-chain scission. Theoretically, the scission of C-S bonds and S-S
14
bonds which have lower bond strength than C-C bonds should be the priority
mechanism in network scission. However, practically, the data showed that main-
chain scission mainly occurs. This is due to uncontrolled scission of the rubber
network in a thermal process. As there is a majority of C-C bonds compared to C-S
and S-S bonds, the probability of cleavage of the polymer backbone is higher.
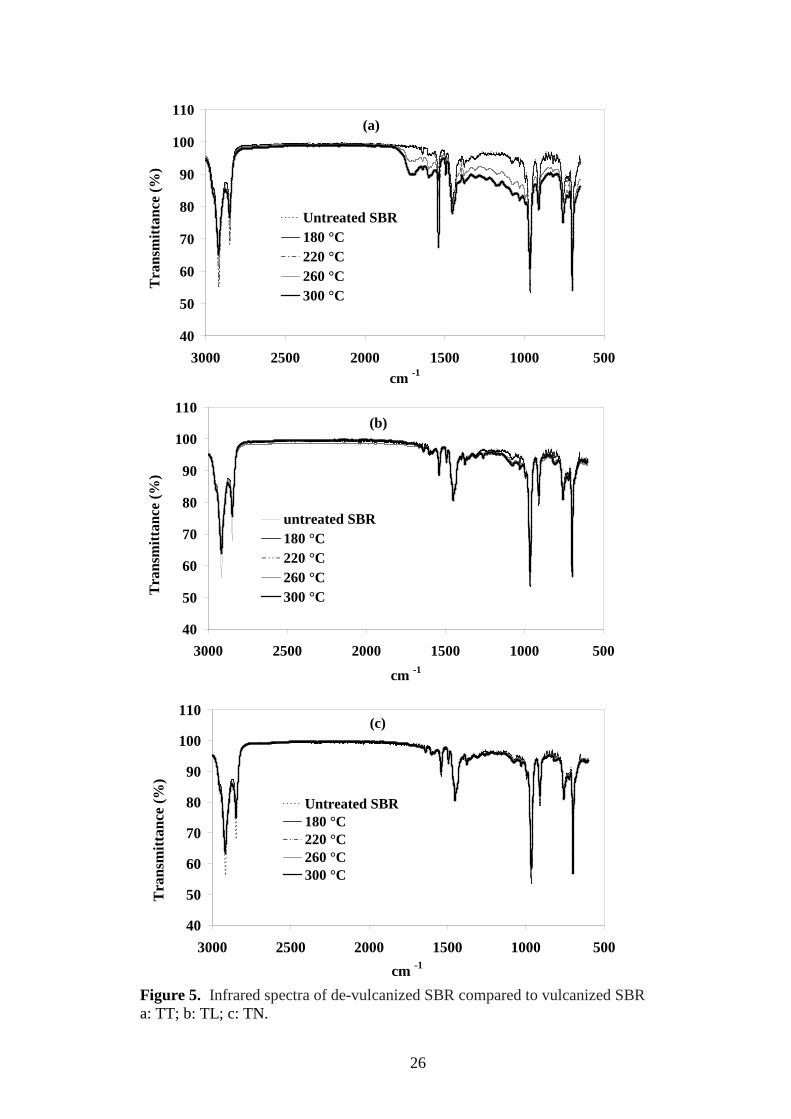
FTIR CHARACTERIZATION
Infrared absorption spectra of the de-vulcanized SBR: TT, TL and TN, are
shown in Figures 5(a), (b) and (c), respectively. The intensity of the infrared
absorption peaks at 966 and 699 cm-1, which are assigned to aromatic C-C stretching
modes of SBR12,13, are independent of the de-vulcanization conditions. Other SBR
peaks at 912 and 757 cm-1 are attributed to the trans 1,4 structure and the γCH of the
single substituted benzene ring and the CH out of plane deformation12,13, are also
observed. The intensity of the infrared absorption peak at 1640 cm-1, which is assigned
to the stretching vibration of carbonyl groups12,13, increased with increasing de-
vulcanization temperature in Figure 5(a) and 5(b), however it shows no changes in
Figure 5(c) for TN . This indicates oxidative degradation of SBR molecules during de-
vulcanization without full exclusion of oxygen. In addition, the carbon disulfide
peaks14 of the absorption band at 1540 cm-1 is not changing with the de-vulcanization
temperature for the TL and TN materials. However, for the TT material, the peak
increases with increasing de-vulcanization temperature. The results are in agreement
with the previous ones indicating that TN de-vulcanized rubber has the lowest
chemical structural damage due to oxygen.
THERMAL STABILITY BY TGA
The thermogravimetric plots of vulcanized and de-vulcanized SBR for
various de-vulcanization conditions and a de-vulcanization temperature of 220°C are
15
given in Figure 6. Two regions of degradation are observed: The first degradation step
starts at 231°C and is completed at 430°C. The second stage of degradation occurs in
the region between 430°C and 510°C. The first stage is due to evaporation of the oil
present in material; the second stage is caused by degradation of the SBR. The
decomposition temperatures of all samples are found to be in the range between 470
and 480°C, which corresponds to the degradation of saturated and unsaturated carbon
chains in SBR15. The TGA curves of the untreated vulcanized SBR and the various de-
vulcanized SBR samples are very similar. A small shift of the TGA traces to a lower
decomposition temperature is observed for the de-vulcanized SBR samples. The
thermal stability can be ranked according to the presence of oxygen during the de-
vulcanization process: TN>TL>TT. This may be attributed to an increasing trend
towards rearrangement of intermolecular chain connections in the presence of oxygen
during de-vulcanization.
MECHANICAL PROPERTIES
Stress-strain curves of vulcanized compounds of the original SBR and of
50/50 blends of SBR de-vulcanizates with the original SBR according to the ASTM
formulation in Table I are shown in Figure 7. The tensile strength and elongation at
break values of the different materials are depicted in Figure 8. It is clearly seen that
the tensile strength of the blends is lower than the strength of the original vulcanized
SBR. Such a decrease in tensile strength with addition of de-vulcanized SBR is
reported by many researchers16-20, and explanations given for the decrease in strength
are:
• Flaws in the structure of the blend interface between original and
reclaimed material, as co-vulcanization between the two phases in
general is poor;
16
• An abrupt modulus change from the original compound, the continuous
phase, to the reclaim particles, the discontinuous phase, resulting in
inhomogeneities in stress distribution.
Figure 9 illustrates this effect: the modulus is approximately doubled and the
hardness significantly increased for the 50/50 blend of de-vulcanized material with
virgin SBR, compared to the original SBR rubber. This mismatch in properties can
significantly reduce the strength of the material. The stress accumulates on the
interface between the de-vulcanized particles and the matrix and fracture starts from
this point20. Elongation at break values of the blends are also lower than the values of
the original rubber, and they follow the same trend as the tensile strength values.
Typically, the mechanical properties of a blend of virgin and de-vulcanized
rubber are affected by many factors20 such as:
• presence of gel in the reclaim;
• bonding between reclaim and matrix;
• particle size of the reclaim;
• sulfur distribution between the matrix and reclaim;
• crosslink density and distribution.
As can be seen from Figure 8, the re-vulcanized SBR/D-TT blend suffers 28%
decrease in tensile strength and 51% decrease in elongation at break in comparison
with the virgin vulcanized SBR. However, the influence on tensile strength and
elongation at break is less when the de-vulcanization process is performed in a
nitrogen atmosphere. The best tensile properties are obtained for the SBR/D-TN blend,
which exhibits a 20% decrease in tensile strength and 40% decrease in elongation at
break in comparison with the virgin vulcanized SBR for 50% of de-vulcanized rubber
added. This improvement of tensile strength and elongation at break is clearly due to

17
the suppressed damage of the polymer during de-vulcanization under exclusion of
oxygen.
Under normal industrial compounding operations, the increase in hardness
and modulus at 100% strain values of the materials as shown in Figure 9, would have
been corrected by adjustment of the compound recipe. The most probable cause is a
higher crosslink density in the blends, as the de-vulcanized rubber is only partially de-
vulcanized and still contains reactive curatives. The use of less vulcanization
ingredients would most probably have compensated for the hardness increase and
brought the tensile properties more close to those for the virgin SBR vulcanizates.
CONCLUSIONS
In thermal de-vulcanization of sulfur-cured SBR, intra-molecular
rearrangements of chain fragments due to uncontrolled degradation and oxidation
affect the properties of the material. Interestingly, an increase of the de-vulcanization
temperature results in a decrease of the crosslink density in first instance, but it
increases again above a temperature threshold of 220°C. This effect occurs
independently of the presence of oxygen during the de-vulcanization process, but it is
most pronounced for a thermal treatment without exclusion of oxygen. Optimal
properties of de-vulcanized SBR are achieved by working at an optimized temperature
of 220 °C and in a nitrogen oxygen-free atmosphere. FT-IR spectra showed that the
presence of oxygen during de-vulcanization causes molecular rearrangements during
breakdown of the polymer network.
The 50/50 w% blend compounds of virgin SBR with material de-vulcanized
at low temperature and under nitrogen, showed better mechanical properties than the
blend with mere thermally treated material in present of oxygen. It exhibited a 20%

18
decrease in tensile strength in comparison with virgin vulcanized SBR, while the
addition of de-vulcanizate in presence of oxygen resulted in a reduction of almost
30%.
ACKNOWLEDGEMENTS
The authors gratefully acknowledge the financial support from RecyBEM
B.V., the Netherlands. The technical support and supply of rubber and chemicals for
this research by ApolloVredestein is also highly appreciated.
REFERENCES
1R. N. Hader and D. S. le Beau, Industrial and Engineering Chemistry, 43(2), 250
(1951).
2V. Yu Levin and S. H. Kim, A. I. Isayev, RUBBER CHEM. TECHNOL. 70, 120
(1997).
3S. T. Johnston, J. Massey, E. von Meerwall, S. H. Kim, V. Yu Levin and A. I.
Isayev, RUBBER CHEM. TECHNOL. 70, 120 (1997).
4J. Choi and A. I. Isayev, RUBBER CHEM. TECHNOL. 84, 55 (2011).
5A. I. Isayev, S. H. Kim and W. Feng, RUBBER CHEM. TECHNOL. 78, 606 (2005).
6V. Yu Levin, S. H. Kim and A. I. Isayev, RUBBER CHEM. TECHNOL. 70, 641
(1997).
7V. Yu Levin, S. H. Kim, A. I. Isayev, J. Massey and E. von Meerwall, RUBBER
CHEM. TECHNOL. 69, 104 (1996).
8J. S. Oh, A. I. Isayev, and E. von Meerwall, RUBBER CHEM. TECHNOL. 77, 745
(2004).
9 “Thermal Degradation of Organic Polymers,” S.L. Madorsky, Ed.,Washington DC,
1964
19
10M. M. Horikx, J. Polym. Sci. 19, 445 (1956).
11M. A. L. Verbruggen, L. van der Does, J. W. M. Noordermeer, M. van Duin , H. J.
Manuel, RUBBER CHEM. TECHNOL. 72, 731 (1999).
12D. A. Baeta, J. A. Zattera, M. G. Oliveira and P. J. Oliveira, Brazilian J. Chem. Eng.,
26, 1, 23 (2009).
13 J-F. Masson, L. Pelletier and P. Collins, J. Appl. Polym. Sci., 79, 1034 (2001)
14 “Infrared Characteristic Group Frequencies,” G. Socrates, Ed., John Wiley&Sons,
Bath, 1980.
15C. K. Radhakrishnan, A. Sujith and G. Unnikrishnan, J. Therm. Anal. Cal., 90, 191
(2007).
16K. Fujumoto, T. Nishi and T. Okamoto, Int. Polym. Sci. Technol. 8 (8), T/30 (1981).
17M. Burgoyne, G. Leaker and Z. Krekic, RUBBER CHEM. TECHNOL. 49, 375
(1976).
18E. M. Fesus and R. W. Eggleton, Rubber World, 203 (6), 23 (1991).
19K. Knorr, Kautsch. Gummi Kunstst. 47, 54 (1994).
20V. V. Rajan, W. K. Dierkes, R. Joseph, J. W. M. Noordermeer, J. Appl. Polym. Sci.,
102, 4194 (2006).
20
CAPTIONS TO FIGURES
FIG. 1.− Sol fraction as a function of the de-vulcanization temperature for
de-vulcanized SBR compared to untreated vulcanized SBR (dotted line).
FIG. 2.− Complex viscosity as a function of frequency of de-vulcanized SBR
compared to untreated vulcanized SBR; de-vulcanization temperature: 220 ºC.
FIG. 3.− Crosslink density as a function of de-vulcanization temperature for
de-vulcanized SBR, compared to untreated vulcanized SBR (dotted line)
FIG. 4.− Sol fraction generated during de-vulcanization versus the relative decrease in
crosslink density of de-vulcanized SBR. a: TT; b: TL; c: TN.
FIG. 5.− Infrared spectra of de-vulcanized SBR compared to vulcanized SBR. a: TT;
b: TL; c: TN.
FIG. 6.− Thermogravimetric analysis of de-vulcanized SBR compared to untreated
SBR.
FIG. 7.− Stress-strain curves of vulcanized SBR and SBR/de-vulcanized rubber blends
(50/50 wt%).
FIG. 8.− Tensile strength and elongation at break of vulcanized SBR and
SBR/de-vulcanized rubber blends (50/50 wt%).
FIG. 9.− Modulus at 100% strain and hardness of vulcanized SBR and
SBR/de-vulcanized rubber blends (50/50 wt%).
21
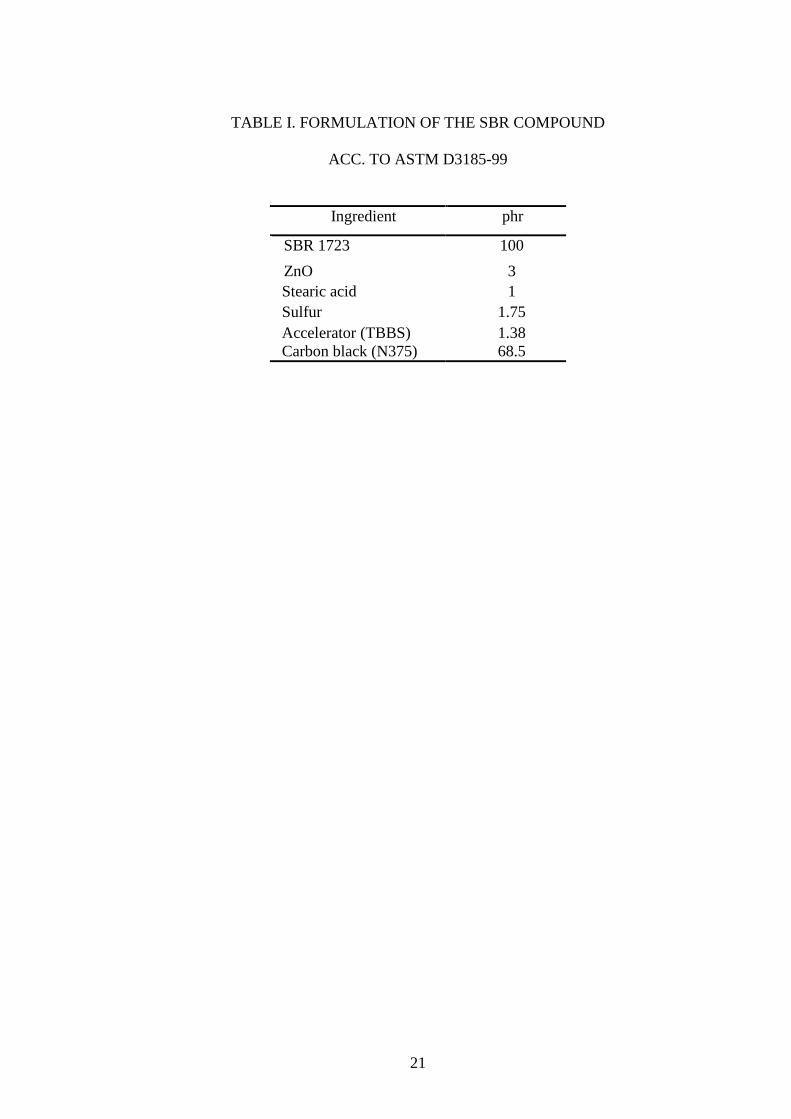
TABLE I. FORMULATION OF THE SBR COMPOUND
ACC. TO ASTM D3185-99
Ingredient phr
SBR 1723 100 ZnO 3 Stearic acid 1 Sulfur 1.75 Accelerator (TBBS) Carbon black (N375)
1.38 68.5

22
0
5
10
15
20
25
30
0 50 100 150 200 250 300 350De-vulcanization temperature (°C)
Sol f
ract
ion
(%)
TTTLTNUntreated SBR
Figure 1. Sol fraction as a function of the de-vulcanization temperature for de-vulcanized SBR compared to untreated vulcanized SBR (dotted line).
23
100
1000
10000
100000
1000000
10000000
0.01 0.1 1 10 100Frequency (Hz)
Com
plex
vis
cosi
ty (P
a.s)
TTTLTNUntreated SBR
107
106
105
104
103
102
Figure 2. Complex viscosity as a function of frequency of de-vulcanized SBR compared to untreated vulcanized SBR; de-vulcanization temperature: 220 ºC.

24
0.0
0.1
0.2
0.3
0.4
0.5
0.6
0 50 100 150 200 250 300 350
De-vulcanization temperature (°C)
Cro
sslin
k de
nsity
( x10
-4 m
ol/c
m3 )
TTTLTNUntreated SBR
Figure 3. Crosslink density as a function of de-vulcanization temperature for de-vulcanized SBR, compared to untreated vulcanized SBR (dotted line)
25
0102030405060708090
100
-0.4 -0.2 0 0.2 0.4 0.6 0.8 1
Sol f
ract
ion
(%)
(a)
0102030405060708090
100
-0.4 -0.2 0 0.2 0.4 0.6 0.8 1
Sol f
ract
ion
(%)
(b)
0102030405060708090
100
-0.4 -0.2 0 0.2 0.4 0.6 0.8 1
Sol f
ract
ion
(%)
(c)
Figure 4. Sol fraction generated during de-vulcanization versus the relative decrease in crosslink density of de-vulcanized SBR. a: TT; b: TL; c: TN.
26
40
50
60
70
80
90
100
110
50010001500200025003000cm -1
Tra
nsm
ittan
ce (%
)
Untreated SBR180 °C220 °C260 °C300 °C
(a)
40
50
60
70
80
90
100
110
50010001500200025003000
cm -1
Tra
nsm
ittan
ce (%
)
untreated SBR180 °C220 °C260 °C300 °C
(b)
40
50
60
70
80
90
100
110
50010001500200025003000cm -1
Tra
nsm
ittan
ce (%
)
Untreated SBR180 °C220 °C260 °C300 °C
(c)
Figure 5. Infrared spectra of de-vulcanized SBR compared to vulcanized SBR a: TT; b: TL; c: TN.

27
0
20
40
60
80
100
150 250 350 450 550Temperature (°C)
Wei
ght (
%)
TTTLTNUntreated SBR
Figure 6. Thermogravimetric analysis of de-vulcanized SBR compared to untreated SBR.

28
0
5
10
15
20
25
0 100 200 300 400 500 600Strain (%)
Stre
ss (M
Pa)
SBR/D-TTSBR/D-TLSBR/D-TNSBR
Figure 7. Stress-strain curves of vulcanized SBR and SBR/de-vulcanized rubber blends (50/50 wt%).

29
0
5
10
15
20
SBR SBR/D-TT SBR/D-TL SBR/D-TN
Ten
sile
stre
angt
h (M
Pa)
0
100
200
300
400
500
Elo
ngat
ion
at b
reak
(%)
Tensile strength Elongation at break
Figure 8. Tensile strength and elongation at break of vulcanized SBR and SBR/de-vulcanized rubber blends (50/50 wt%).

30
0
1
2
3
4
5
SBR SBR/D-TT SBR/D-TL SBR/D-TN
Mod
ulus
at 1
00%
stra
in (M
Pa)
0
10
20
30
40
50
60
70
80
Har
dnes
s (Sh
ore
A)
Modulus Hardness
Figure 9. Modulus at 100% strain and hardness of vulcanized SBR and SBR/de-vulcanized rubber blends (50/50 wt%).