Pathway analysis Biostat & Bioinfo short course series Jianying Li.
72
Pathway analysis Biostat & Bioinfo short course series Jianying Li
-
Upload
morgan-cannon -
Category
Documents
-
view
218 -
download
2
Transcript of Pathway analysis Biostat & Bioinfo short course series Jianying Li.

Pathway analysis
Biostat & Bioinfo short course seriesJianying Li

The Road to Pathway Analysis
Adapted from Werner (2008), Current Opinion in Biotech., 19:50-64
Next Gen RNA-Seq

Acknowledgment
• QB for kindly organization• Dr. Pierre Bushel, kindly providing slides,
advice/guide, and proof-read• Dr. David Fargo for advice and guide• Support from the team• All attendees and your attention!

Objectives
• Knowledge based pathway analysis• Two major statistical approaches
– Parametric: Hypergeometric/Fisher Exact Test (FET)
– Non-parametric: Kolmogorov-Smirnov/ranking statistics
• Commonly-used applications, pros and cons• The proceedings in pathway analysis research

What do we mean by pathway?
• Biological process or molecular function
• Metabolic processes• Signaling cascades• Genes are categorized
based on some criteria
Central Dogma Involvement of Gene Products

Gene sets (biological categories)
• Genes (sets) have something in common– On the same cytogenetic band– Coding for proteins that are part of the same
cellular component– Can be part of the same biochemical pathway– Co-expressed under certain conditions– Putative targets of same regulatory factor– ….

Gene Ontology• Gene Ontology (GO) Consortium was established in 1998 to developed
shared, structured vocabulary (an ontology) for the annotation of molecular characteristics across different organisms.
– a collaborative effort to address the need for consistent descriptions of gene and gene products in different databases
– Original members of the consortium: SGD, FlyBase and MGD• Two primary purposes for an ontology:
1. to facilitate communication between people and organizations2. to improve upon the interoperability between systems

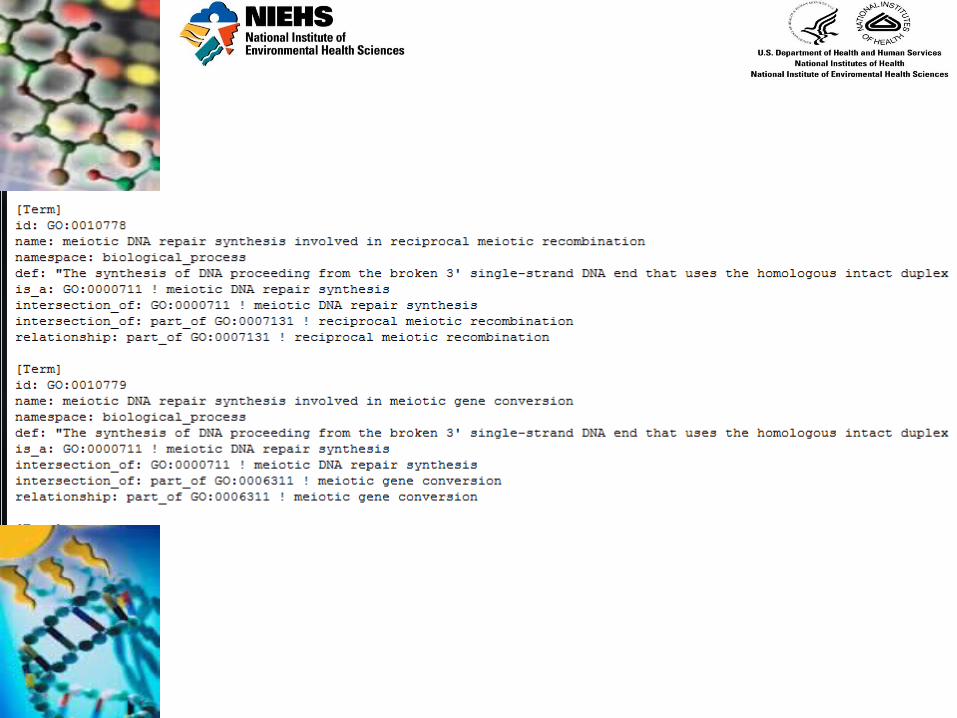
GO structure• The ontologies are structured vocabularies in the form of directed acyclic
graphs (DAGs)
• The DAG represents a network (not a tree) in which each term may be a child of one or more than one parent
• The relationships of child to parent can be of the “is a” type or the “part of” type
telomere
chromosome
mitotic chromosomeis a
part of

Ontologies within GO
• molecular function describing activities, such as catalytic or binding activities, at the molecular level
• biological process referring to a biological objective to which the gene product contributes
• cellular component referring to the place in the cell (i.e. the location) where a gene product is found


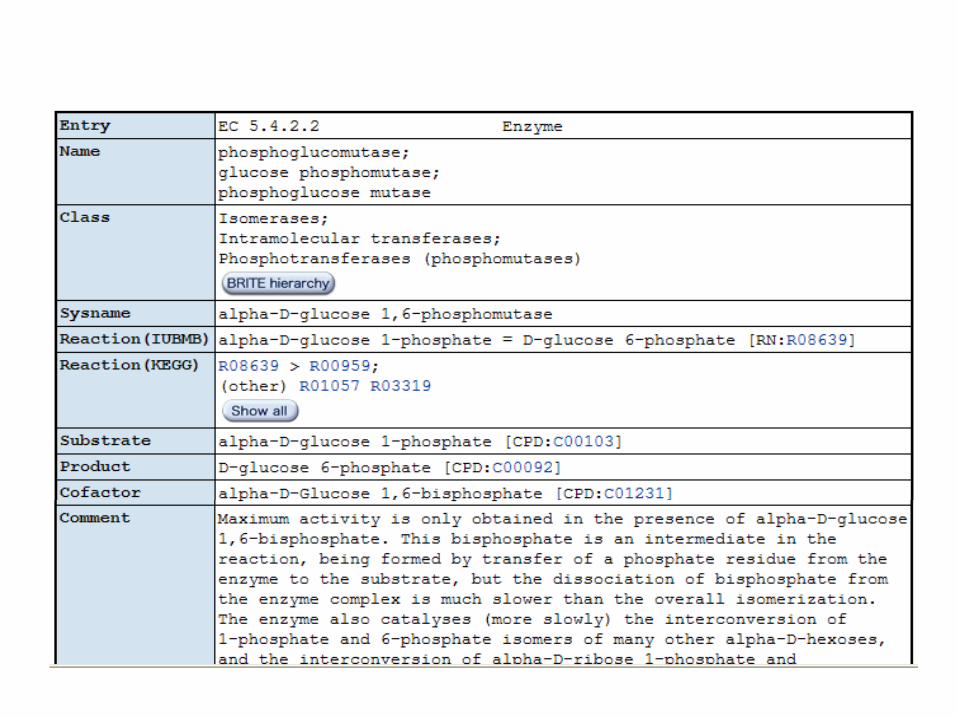
KEGG: Kyoto Encyclopedia of Genes and Genomes
About KEGG • Kyoto Encyclopedia of Genes and
Genomes (KEGG) knowledgebase was developed in 1996 consisting of genetic building blocks of genes and proteins.
• A collection of manually drawn pathway maps representing current knowledge on the molecular interaction and reaction networks
• Manually curated based on published literature
• Constructed as wiring diagrams with enzymes and proteins, processes and reactions and substrates, co-factors, intermediates, metabolites and end products
Category in KEGG• Metabolism: carbohydrates, energy,
lipid, nucleotides, amino acid, xenobiotics
• Genetic information processing
• Environmental information processing
• Cellular processes
• Human diseases
• Drug development: the structure relationships


Signaling Pathways• Transfac - data on transcription factors,
their experimentally-proven binding sites, and regulated genes. The compilation of binding sites allows the derivation of positional weight matrices.
• Transpath – data about molecules participating in signal transduction pathways and reactions for a network of signaling components. Focuses on the signaling cascades of transcription factors that alter the expression of genes.
Breslin et al., BMC Bioinformatics, 2005, 6:163
Experimentally validated

Biological Resources Recap
Of the biological resources discussed, what does each contain?
• Gene Ontology: _________, ________ & _________
• KEGG: ______________ & ________________
• Transfac\Transpath: ____________, ____________,
• ______________, & _______________

Biological Resources Recap
Of the biological resources discussed, what does each contain primarily?
• Gene Ontology: Biological Process, Molecular Function & Cellular Component
• KEGG: Molecular Interactions & Reaction Networks
• Transfac\Transpath: TFs, Binding Sites, Regulated Genes, & Signaling Cascades_

More on gene set collections
• Gene Ontology (GO)– Cellular components (CC)– Biological processes (BP)– Molecular functions (MF)
• Well curated pathway database– KEGG pathway– Biocarta– GenMAPP– IPA pathway database
• Gene set collections– MSigDB– GAzer

Hypergeometric Distribution
A discrete probability distribution that describes the number of successes (k) in a sequence of n draws from a finite population without replacement
An urn with two types of marbles: N total # of marbles Of which, m # of red marbles Drawing a red marble is a success! Drawing a white marble is a failure!
n is the # of marbles randomly drawn k is the # of successes (red marbles) in
the sample Hypergeometric distribution gives the
probability
for k = 0,1,2,…,nk<=m, n-k <=N-m
P(k=2, n, m, N) = 0.339
Cumulative dist.:P(k<=2) = 0.933

Hypergeometric distribution• Number of red ball: 50• Number of white ball: 120• Number of ball drawn (without replacement): 36• Possible number of success ??
– (0,1, 2, ….36),
• Probability to get 20 red balls is: 0.0001494571
http://www.aiaccess.net/English/Glossaries/GlosMod/e_gm_hypergeometric.htm
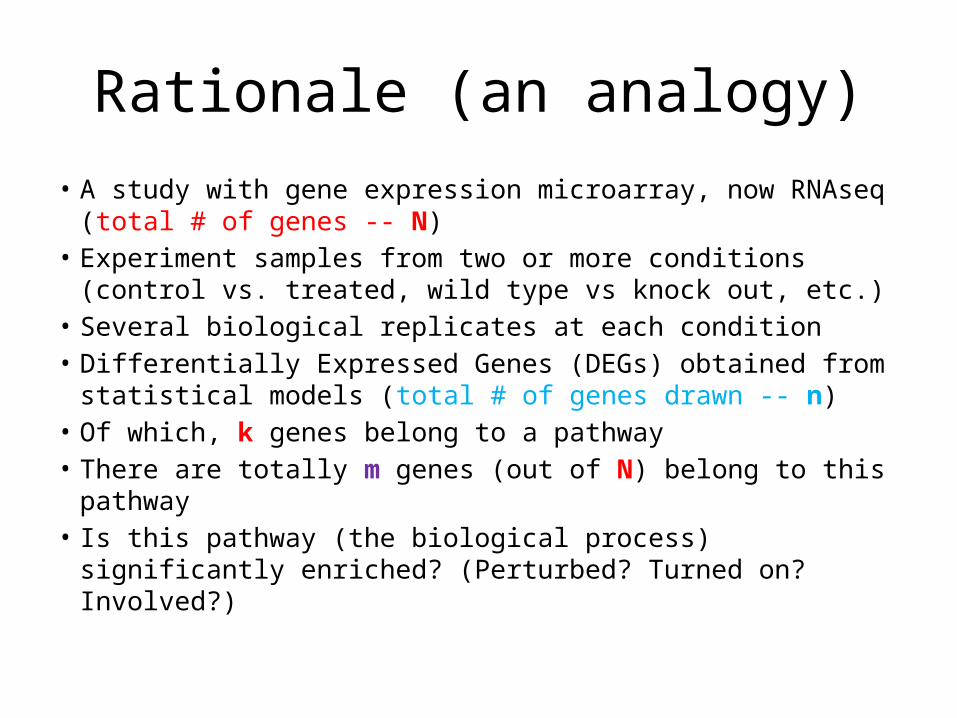
Rationale (an analogy)
• A study with gene expression microarray, now RNAseq (total # of genes -- N)
• Experiment samples from two or more conditions (control vs. treated, wild type vs knock out, etc.)
• Several biological replicates at each condition• Differentially Expressed Genes (DEGs) obtained from
statistical models (total # of genes drawn -- n)• Of which, k genes belong to a pathway• There are totally m genes (out of N) belong to this pathway• Is this pathway (the biological process) significantly enriched?
(Perturbed? Turned on? Involved?)
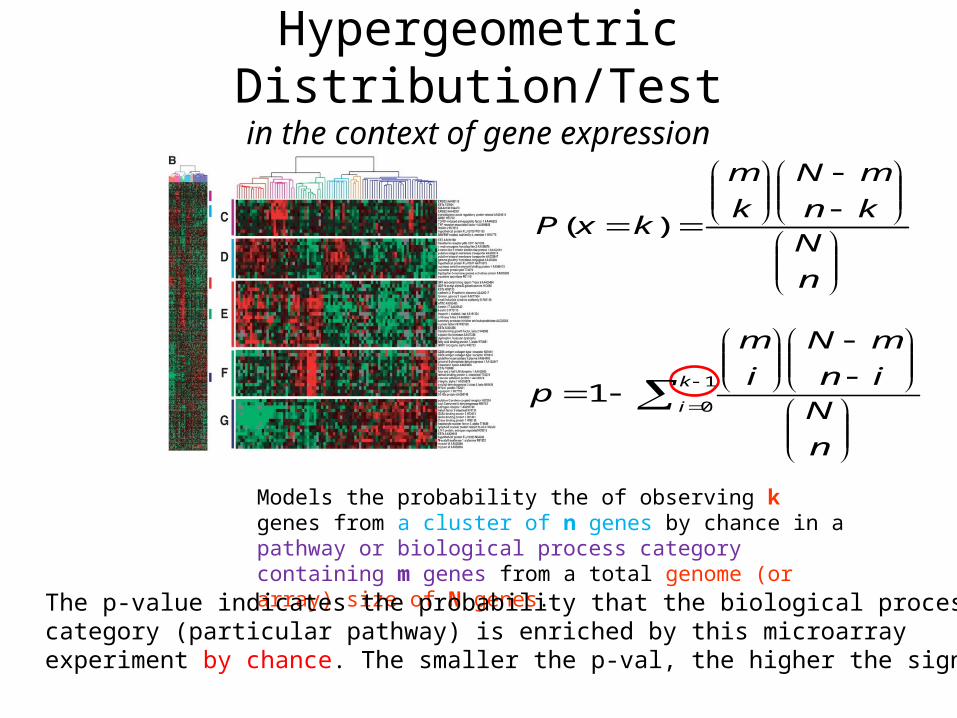
Hypergeometric Distribution/Testin the context of gene expression
Models the probability the of observing k genes from a cluster of n genes by chance in a pathway or biological process category containing m genes from a total genome (or array) size of N genes.
1
01
k
i
n
N
in
mN
i
m
p
n
N
kn
mN
k
m
kxP )(
The p-value indicates the probability that the biological process category (particular pathway) is enriched by this microarray experiment by chance. The smaller the p-val, the higher the significance

Pathway analysis
• Gene expression analysis results– Total number of gene on a chip: 520– Of which 20 genes are in a GO– Total number of DEG: 40– Of which 5 genes are in GO
• Do you think it is significant? In other words “is this GO category enriched by/significant this microarray experiment”?
• The answer is simple, which is to perform a hypergeometric test: phyper(4, 20, 500, 40, lower.tail=FALSE) = 0.01371
• Sometime people report: phyper(5, 20, 500, 40, lower.tail=FALSE) = 0.002459

Fisher’s Exact Test (FET)--right-tailed test
DEG Not DEGs totals
In a GO category x m-x m
Not in GO category k-x n-k+x n
totals k m+n -k m + n (genes on array)
Contingency table
So, now you are probably given something like the following:x <- 5 #num_of_DEG in GOm <- 20 #num_of_gene on chip in GOn <- 500 #num_of_gene on chip NOT in GOk <- 40 #num_of_DEG
Comparing hypergeometric test vs. FET, watch out!!phyper((x-1), m, n, k, lower.tail=FALSE)(fisher.test(matrix(c(x,(k-x), (m-x), (n-k+x)),2,2), alternative='greater'))$p.value
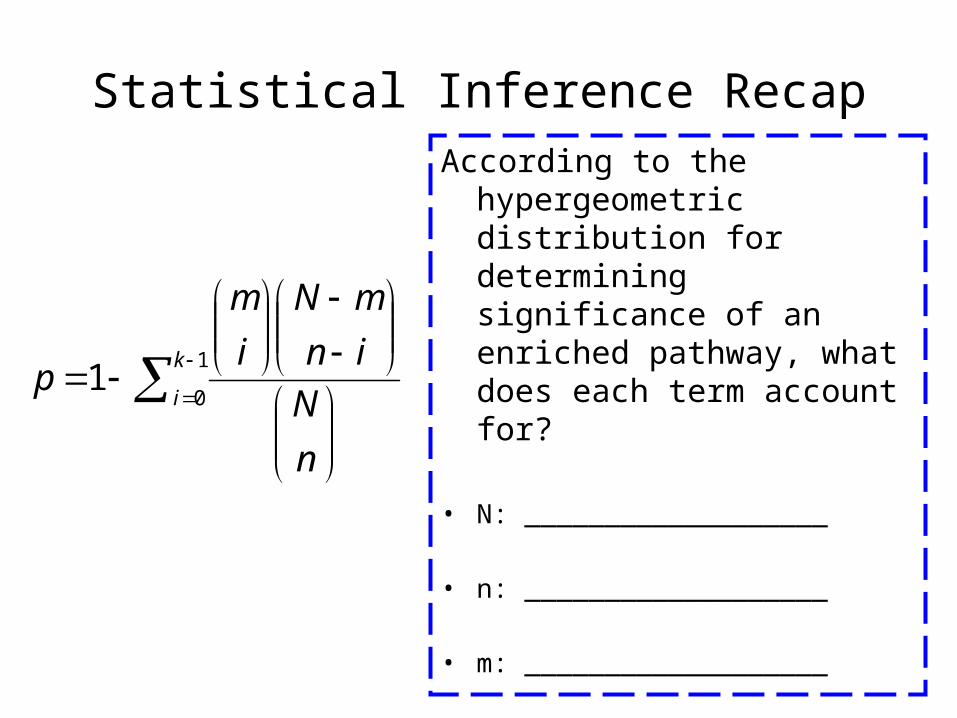
Statistical Inference RecapAccording to the hypergeometric
distribution for determining significance of an enriched pathway, what does each term account for?
• N: ___________________
• n: ___________________
• m: ___________________
• k:____________________
1
01
k
i
n
N
in
mN
i
m
p

Statistical Inference RecapAccording to the hypergeometric
distribution for determining significance of an enriched pathway in a cluster, what does each term account for?
• N: genome (or array) size
• n: cluster size
• m: # of genes with the annotation of the pathway
• k: # of genes in the cluster with the annotation of the pathway
1
01
k
i
n
N
in
mN
i
m
p

ANOVA model
3730 DE probe sets (q-value < 0.01)[1634 up-regulated, 2096 down-regulated]
Peroxisome proliferator-activated receptor gamma
Rosiglitazone
• Mouse marrow mesenchymal stem cell (MSC) • Stably transfected with PPAR-g2• Affymetrix Mouse 430vs2• Data RMA normalized
Shockley et al., J. Cell. Biochem, 2009, 106:232-246
Study Design for Sample Data

Available database in DAVID
Functional categories Ontologies KEGG pathway Protein domains Protein interactions Disease Tissue specific expression …etc.
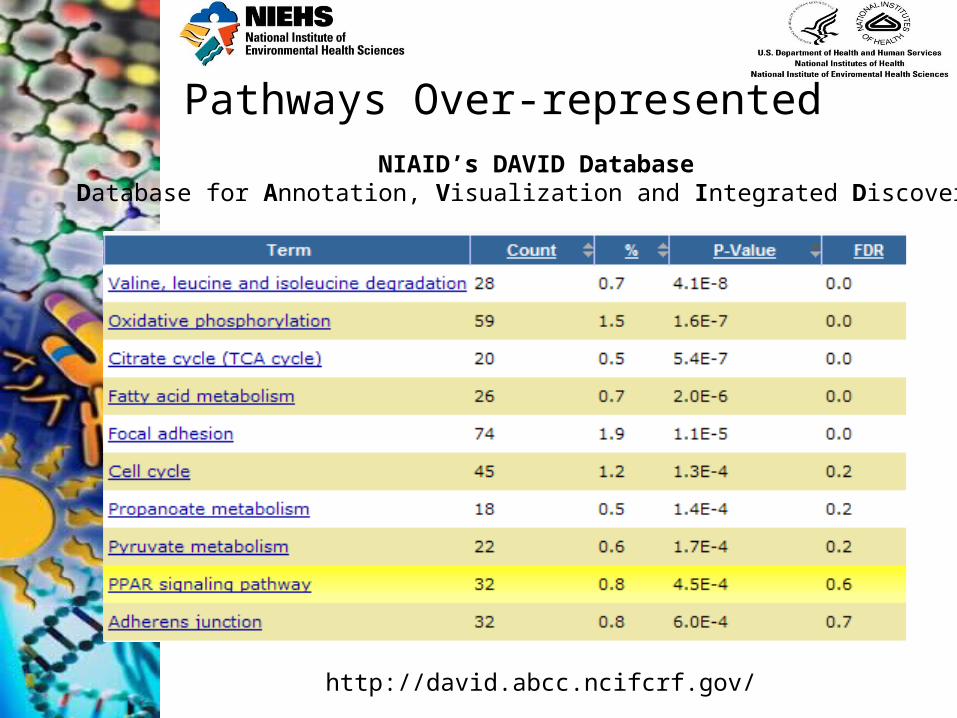
Pathways Over-representedNIAID’s DAVID Database
Database for Annotation, Visualization and Integrated Discovery
http://david.abcc.ncifcrf.gov/
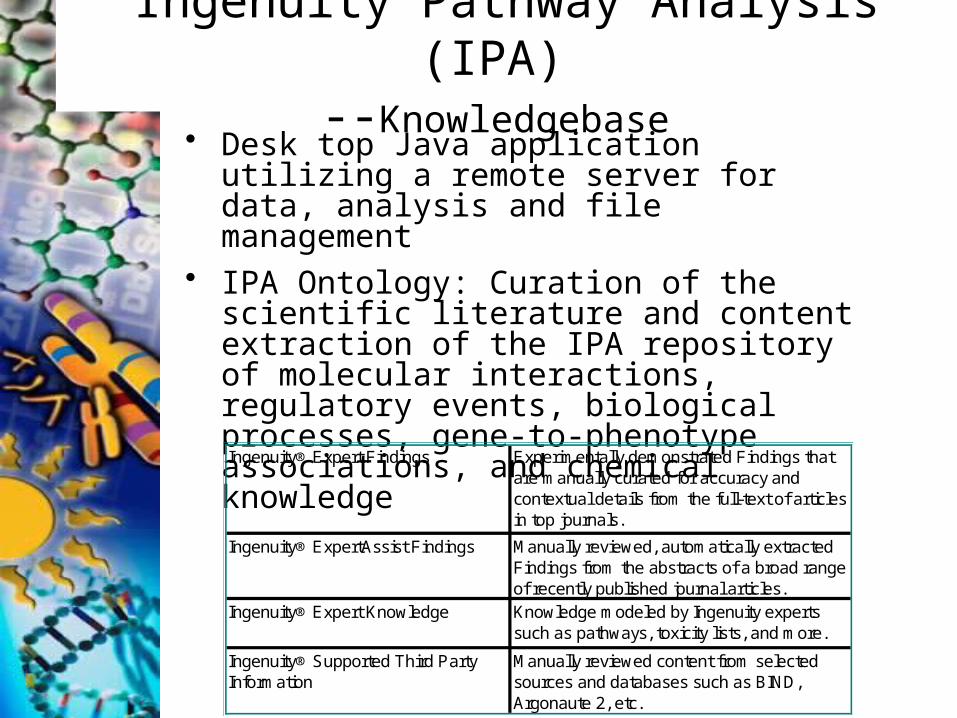
Ingenuity Pathway Analysis (IPA) --Knowledgebase
• Desk top Java application utilizing a remote server for data, analysis and file management
• IPA Ontology: Curation of the scientific literature and content extraction of the IPA repository of molecular interactions, regulatory events, biological processes, gene-to-phenotype associations, and chemical knowledgeIngenuity® Expert Findings Experimentally demonstrated Findings that
are manually curated for accuracy and contextual details from the full-text of articles in top journals.
Ingenuity® ExpertAssist Findings Manually reviewed, automatically extracted Findings from the abstracts of a broad range of recently published journal articles.
Ingenuity® Expert Knowledge Knowledge modeled by Ingenuity experts such as pathways, toxicity lists, and more.
Ingenuity® Supported Third Party Information
Manually reviewed content from selected sources and databases such as BIND, Argonaute 2, etc.
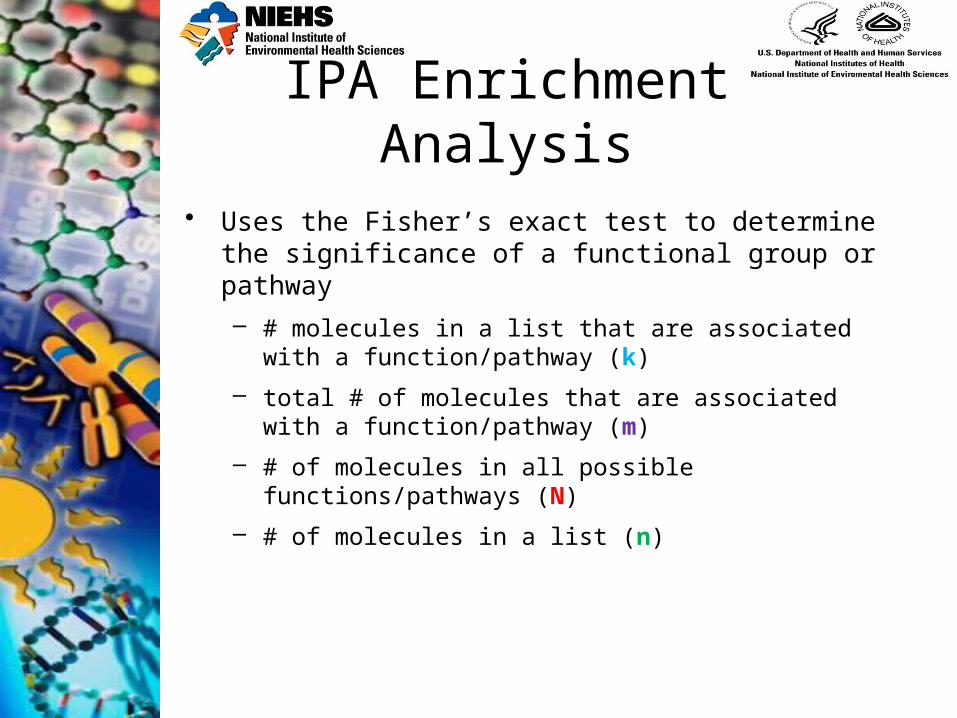
IPA Enrichment Analysis
• Uses the Fisher’s exact test to determine the significance of a functional group or pathway
– # molecules in a list that are associated with a function/pathway (k)
– total # of molecules that are associated with a function/pathway (m)
– # of molecules in all possible functions/pathways (N)
– # of molecules in a list (n)

IPA Canonical Pathway Over-representation
Ratio = # of genes in a pathway that meet cutoff criteria / total # of genes in the pathway
Canonical pathway: Highly curated metabolic and cell signaling pathways from KEGG, scientific literature

Parametric approach summary
• Statistics tests are solid (hyper geometric/FET)
• But, watch out for hypothesis formulation• And, there are a few violations (will be
addressed shortly)• Knowledgebase used matters!!

A non-parametric approach
• Based on Kolmogorov-Smirnov (K-S) test• Compare a sample empirical distribution
function to the reference distribution• Or, compare two sample empirical distribution
functions• The test is performed in relevant to different
null hypothesis setting
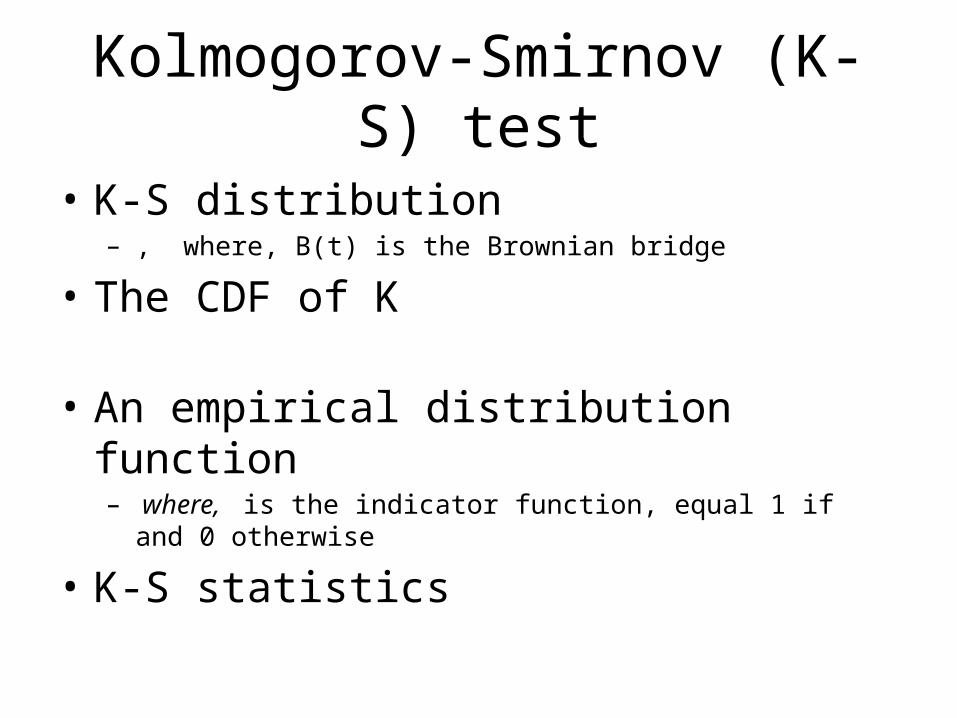
Kolmogorov-Smirnov (K-S) test
• K-S distribution– , where, B(t) is the Brownian bridge
• The CDF of K
• An empirical distribution function– where, is the indicator function, equal 1 if and 0 otherwise
• K-S statistics


Gene set enrichment analysis (GSEA)
• Given an a priori defined set of genes (i.e. genes encoding products in a metabolic pathway, or sharing the same GO category)
• The goal is to determine whether the members in a set S are randomly distributed throughout all sorted genes (L)
• Mootha et al. [2003] suggest to use the Kolmogorov-Smirnov statistic:– First, sort all genes by some criteria– Go through the list, increasing a running sum for each gene in the gene set by (N-n)
• , if Ri is not a member of S
– And decreasing it for each gene not in the gene set by n. [N: number of genes, n: size of gene set]
• , if Ri is a member of S
• The maximum value of the running sum is the enrichment score (ES)
• Statistical significance determined by permutation GSEA-P

Mootha et al., Nature Genetics, 2003, 34(3):267-273

Improved KS statistics tests
• Subramanian et al., PNAS 102 (2005) proposed an improvement strategy
• The ES is the maximum deviation from zero of phit-pmiss
• If p =0, ES reduces to Kolmogorov-Smirnov statistics, in the paper, author used p =1

A GSEA overview illustrating the method.
Subramanian A et al. PNAS 2005;102:15545-15550
©2005 by National Academy of Sciences

GSEA web-portal http://www.broadinstitute.org/gsea/msigdb/index.jsp

• Bradley Efron and Rob Tibshirani. Tech report. August 2006
• Main reference: Subramanian, A, et al. 2005 PNAS 102 15545-15550
• Major improvement– Maxmean statistics for initial gene ranking– Restandardization (a combination of
randomization and permutation)
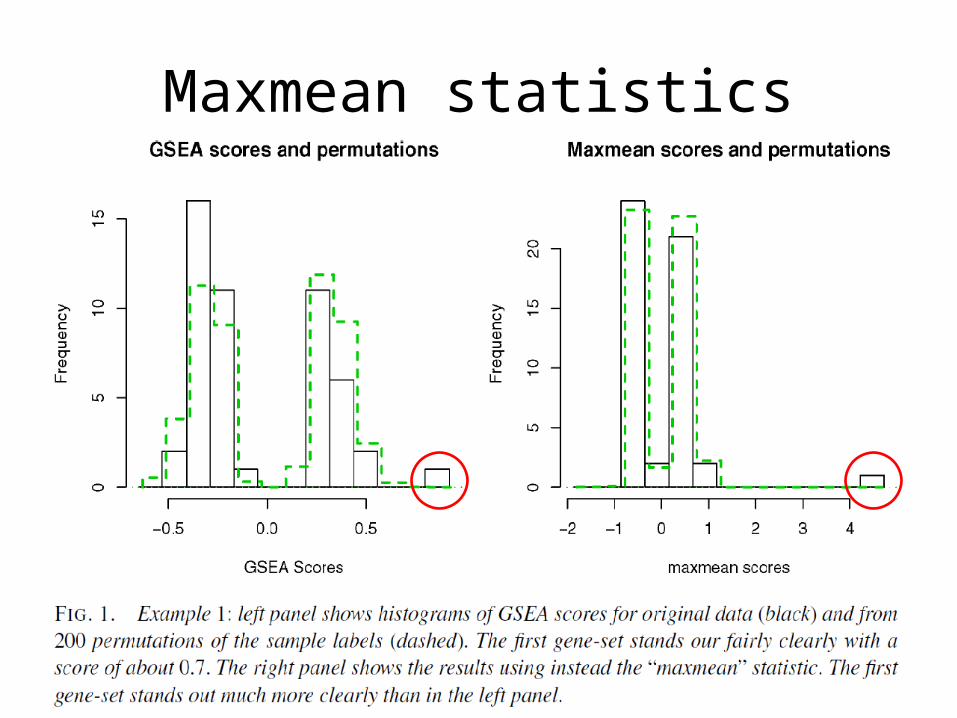
Maxmean statistics

Randomization vs. permutation

GSA – available gene set collection
GSA R package is available: http://cran.r-project.org/web/packages/GSA/index.html Gene set collection can be downloaded from Broad or Stanford

Non-parametric approach
• Relax on “strong assumption”• Customized gene set is allowed• Some concerns on the statistical power• Computationally intensive

Major concerns with GO related pathway analysis
• Ignore GO hierarchy – treat each term independently• Ignore gene (expression) level/rank• Ignore correlation – assuming genes (in a category) are
uncorrelated• Sampling over genes (observation)• All these make p values quite unclear

The universe matters• It is important to choose the universe correctly
DEGs Non-DEGs Total
In GO 10 30 40
Not in GO 390 3570 3960
Total 400 3600 4000
Case 1: universe is all genes in the genome
DEGs Non-DEGs Total
In GO 10 30 40
Not in GO 390 570 960
Total 400 600 1000
Case 2: universe is only expressed genes
p=0.049
p=0.0048

Sets are overlapped
A B
Set B is enriched only because of it overlap with set A

The subgraph induced by the 10 most significant GO terms identified by a current state-of-the-art method for scoring GO terms for enrichment.
Alexa A et al. Bioinformatics 2006;22:1600-1607
© The Author 2006. Published by Oxford University Press. All rights reserved. For Permissions, please email: [email protected]
TopGO’s elimination algorithm Test the leaf sets first. If significant, remove its “genes” before testing its ancestor sets
TopGO’s weight algorithm The genes are weighted by their relevance in the significant nodes. The enrichment score of a parent (gene node u) is compared with the scores of its children. Children with a better score than u represent the interesting genes better. Therefore, their significance is increased Children with a lower score than u have their significance reduced.

Open web browser and navigate to : http://omicslab.genetics.ac.cn/GOEAST/
At the header tool bar, click on Tutorial


• http://www-stat.stanford.edu/~tibs/GSA/• http://
www.netsci.org/Resources/Software/Bioinform/pathwayanalysis.html• http://www.broadinstitute.org/gsea/index.jsp• http://david.abcc.ncifcrf.gov/• http://www.biocarta.com/• http://web.expasy.org/pathways/• http://www.genmapp.org/• http://www.genome.jp/kegg/• http://www.ingenuity.com/• http://www.genego.com/metacore.php• http://www.geneontology.org/• http://omicslab.genetics.ac.cn/GOEAST/tutorial.php• http://expressome.kobic.re.kr/GAzer/document.jsp• http://www.biobase-international.com/products • http://jaspar.genereg.net/

Pathway analysis Recap
Two major statistics approaches:• _________ with tests are ________ & _________
• __________ with two major implementations ___________ & _____________
• Same number of DEGs and those in a category, what could possibly be matter whether to get a significant p-value _________
• What are a few known concerns with conventional GO based pathway analysis: ____________, ____________,
______________, & _______________
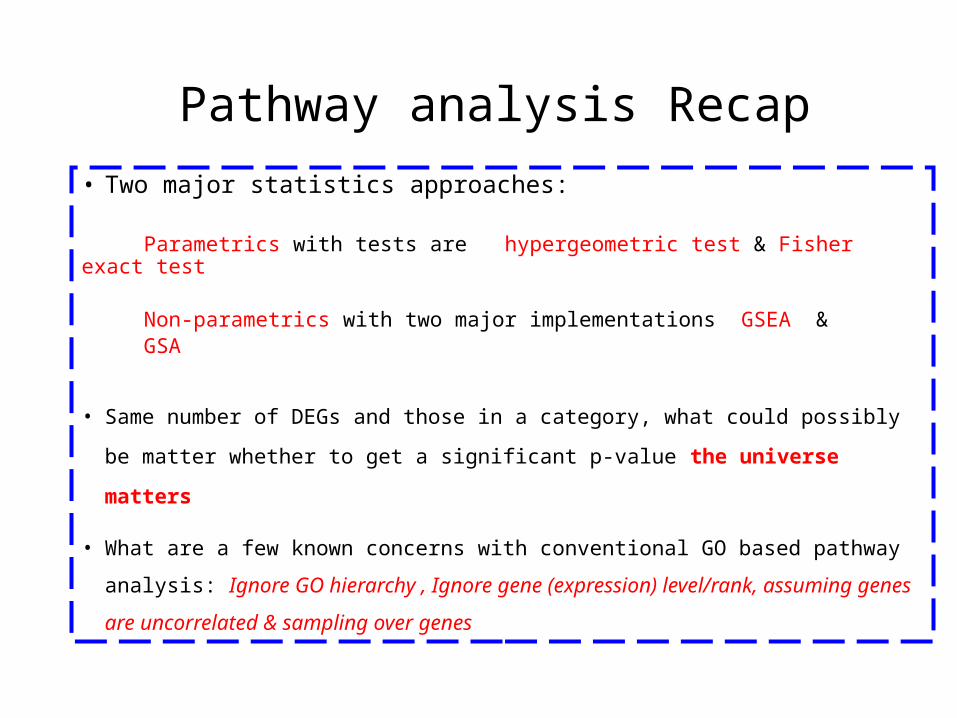
Pathway analysis Recap
• Two major statistics approaches:
Parametrics with tests are hypergeometric test & Fisher exact test
Non-parametrics with two major implementations GSEA & GSA
• Same number of DEGs and those in a category, what could possibly be matter
whether to get a significant p-value the universe matters
• What are a few known concerns with conventional GO based pathway analysis:
Ignore GO hierarchy , Ignore gene (expression) level/rank, assuming genes are
uncorrelated & sampling over genes

Pathway analysis summary
• Two major statistics approaches– Parametric vs. non-parametrics
• Many available databases– Gene Ontology– KEGG– Transfac & transpath
• A few popular applications – DAVID (free online)– GSEA (online and desktop java application)– GSA (R –package)– Ingenuity Pathway Analysis (licensed based)– Biobase/JASPER (license based)– GeneGO (license based)

Question??

Click on tools on the side menu bar to display platforms
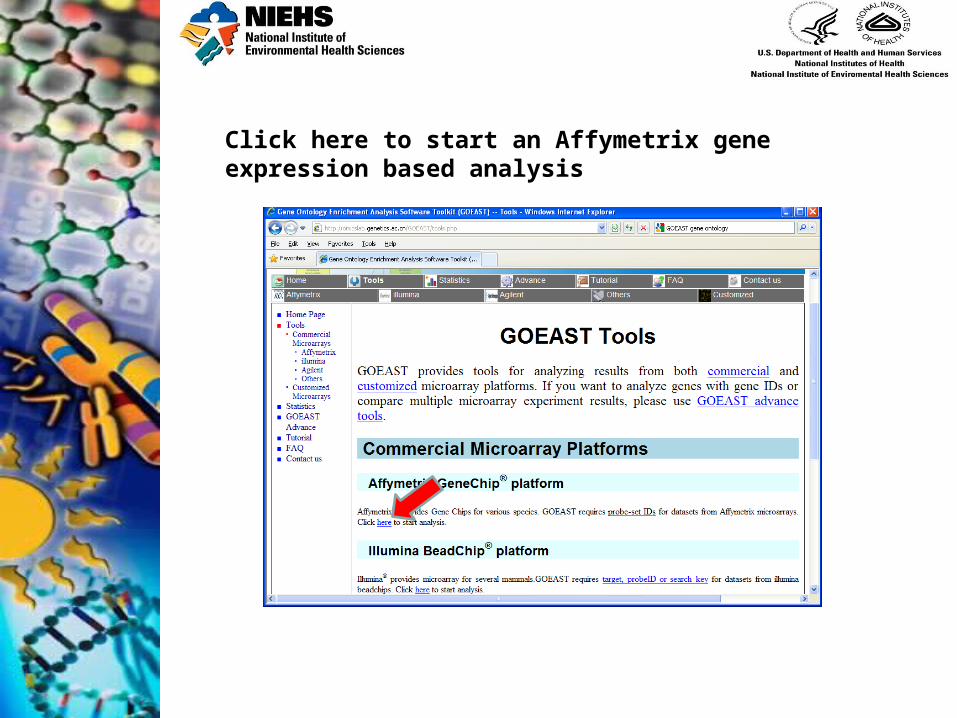
Click here to start an Affymetrix gene expression based analysis
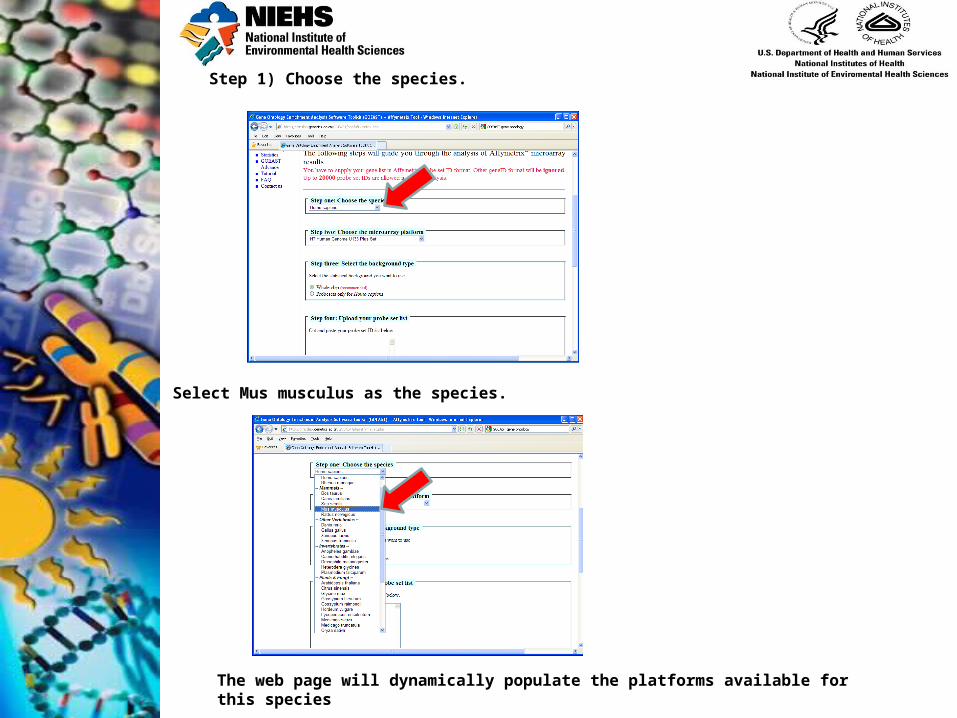
Step 1) Choose the species.
The web page will dynamically populate the platforms available for this species
Select Mus musculus as the species.

Step 2) Choose the microarray platform
Select mouse genome 430 2.0 Array as the microarray platform.

Step 3) Select the background (population) type. Leave whole chip selected

Step 4) Upload probe set.
Cut and paste list of Affymetrix probe set IDs from the differentially expressed genes to the entry box . Use probe set IDs in 72_hr_DEGs_Q_top_500.txt

Step 5) Enter a valid email address that you have access to.
Give the analysis a distinct name to identify it from the results that will be emailed to you.
Click Start analysis
Use the default option for parameter settings.

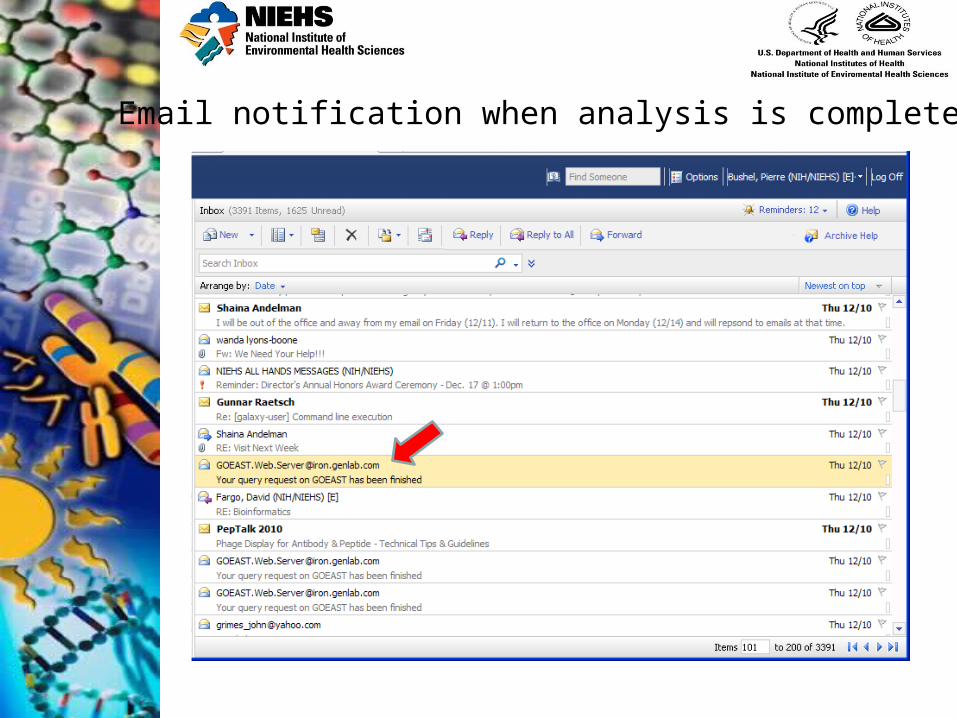
Email notification when analysis is complete

Click on hyperlink to display results in your web browser


Use Advanced settings to run GO enrichment using Adrian Alexa’s weighting approach.
3730 classic 18 minutesTop 500 classic 11 minutesTop500 WT 15mins