Pathophysiology of Exercise Intolerance in Breast Cancer ...
137
Pathophysiology of Exercise Intolerance in Breast Cancer Survivors Treated with Anthracycline Chemotherapy Rhys I. Beaudry DISSERTATION Submitted in partial fulfillment of the requirements for the degree of Doctor of Philosophy at The University of Texas at Arlington December, 2019 Arlington, Texas Committee: Dr. Mark J. Haykowsky, Supervising Professor Dr. Michael D. Nelson Dr. R. Matthew Brothers Dr. Satyam Sarma
Transcript of Pathophysiology of Exercise Intolerance in Breast Cancer ...

Pathophysiology of Exercise Intolerance in Breast Cancer Survivors Treated with
Anthracycline Chemotherapy
Rhys I. Beaudry
DISSERTATION
Submitted in partial fulfillment of the requirements for the degree of Doctor of Philosophy at The
University of Texas at Arlington
December, 2019
Arlington, Texas
Committee:
Dr. Mark J. Haykowsky, Supervising Professor
Dr. Michael D. Nelson
Dr. R. Matthew Brothers
Dr. Satyam Sarma

ii
Abstract
Pathophysiology of Exercise Intolerance in Breast Cancer Survivors Treated with
Anthracycline Chemotherapy
Rhys I. Beaudry, Ph. D
The University of Texas at Arlington
2019
Supervising Professor: Mark J. Haykowsky
Anthracyclines emerged as frontline breast cancer adjuvant therapy in the late 1960’s. Within half a
decade of their clinical adoption, dose-limiting cardiotoxicity was recognized and cumulative dose limits
were established to acceptably balance anti-tumor and cardiotoxic properties. Despite these longstanding
dose limits, anthracycline treated breast cancer (BC) survivors have advanced biological aging, as
evidenced by a marked impairment in peak oxygen uptake (VO2 peak). Given that the pathophysiology of
reduced VO2 peak in BC is poorly understood, the aim of this dissertation was to: 1) develop a non-invasive
imaging technique to investigate cardiac function under exercise stress; 2) investigate the cardiac limits to
exercise in BC; and 3) investigate muscle blood flow, oxygen use, and bioenergetics as components of
exercise intolerance in BC.
In study 1 (Chapter 2) an exercise cardiac magnetic resonance imaging (cMRI) technique was developed
using commercially available hardware and in-product image sequences. Rest and exercising cardiac
volumes were measured in eight young healthy subjects (mean age: 25 years) and a meta-analysis was
performed to demonstrate consistency of results, thus demonstrating feasibility and establishing the
normative cardiac response to supine exercise cMRI. From rest to exercise, cardiac output increased by an
increase in heart rate and stroke volume, through preserved end-diastolic volume and reduced end-systolic

iii
volume. In study 2 (Chapter 3), using exercise cMRI and cardiopulmonary exercise testing, cardiac
function and VO2 peak were measured in 29 BC patients (mean age: 48 years) prior to receiving
anthracycline based chemotherapy and in 10 age- and sex-matched healthy controls. On average, BC
patients had 20% lower VO2 peak (l/min or ml/kg/min) than healthy controls, which was related to lower
peak exercise cardiac output. Importantly, decrements in peak cardiac output were apparent prior to
anthracycline administration. In study 3 (Chapter 4), using femoral artery Doppler ultrasound, leg blood
flow was measured during single-leg knee extension (SLKE) in 14 BC survivors (mean age: 61 years,
mean time post anthracycline therapy: 12 years) and 9 age- and sex-matched controls. Peak SLKE power
output, heart rate and blood pressure were comparable between groups. Leg (femoral artery) blood flow
was measured during 25, 50 and 75% of peak SLKE, and was not significantly different between groups
at rest or during submaximal exercise. However, estimated quadriceps muscle mass was reduced in BC
survivors, despite normal leg blood flow and conductance. In study 4 (Chapter 5), using MRI, lower leg
(superficial femoral vein) blood flow, VO2 and bioenergetics were measured during plantar flexion
exercise in 16 BC survivors (mean age: 56 years, mean time post anthracycline therapy: 13 months) and
16 age-, sex- and body mass index matched controls. Muscle oxidative capacity was not impaired, nor
was muscle blood flow or oxygen extraction. However, BC survivors tended to have abnormal leg
composition (increased fat and reduced muscle) that contributed to reduced VO2 peak. Taken together, the
data herein demonstrate a strong non-cardiac component to exercise intolerance in anthracycline treated
BC survivors, similar to that found in sex- and age-matched controls. Future research building upon non-
cardiac interventions for prevention of anthracycline related reductions in VO2 peak are needed to reduce
cardiovascular risk in BC survivors.

iv
Copyright by
Rhys I. Beaudry, 2019

v
Acknowledgements
This work was made possible by the mentorship and academic and financial support of my supervising
professor, Dr. Mark Haykowsky, as well as committee members Drs. Satyam Sarma, Michael D. Nelson
and R. Matthew Brothers.

vi
Dedication
To all the individuals that have provided invaluable support along the way- friends, family, mentors,
committee members, Texas Moms, thank you. Your guidance within and outside of academia has been
instrumental in my development, and I hope will lead to lifelong relationships.
vii
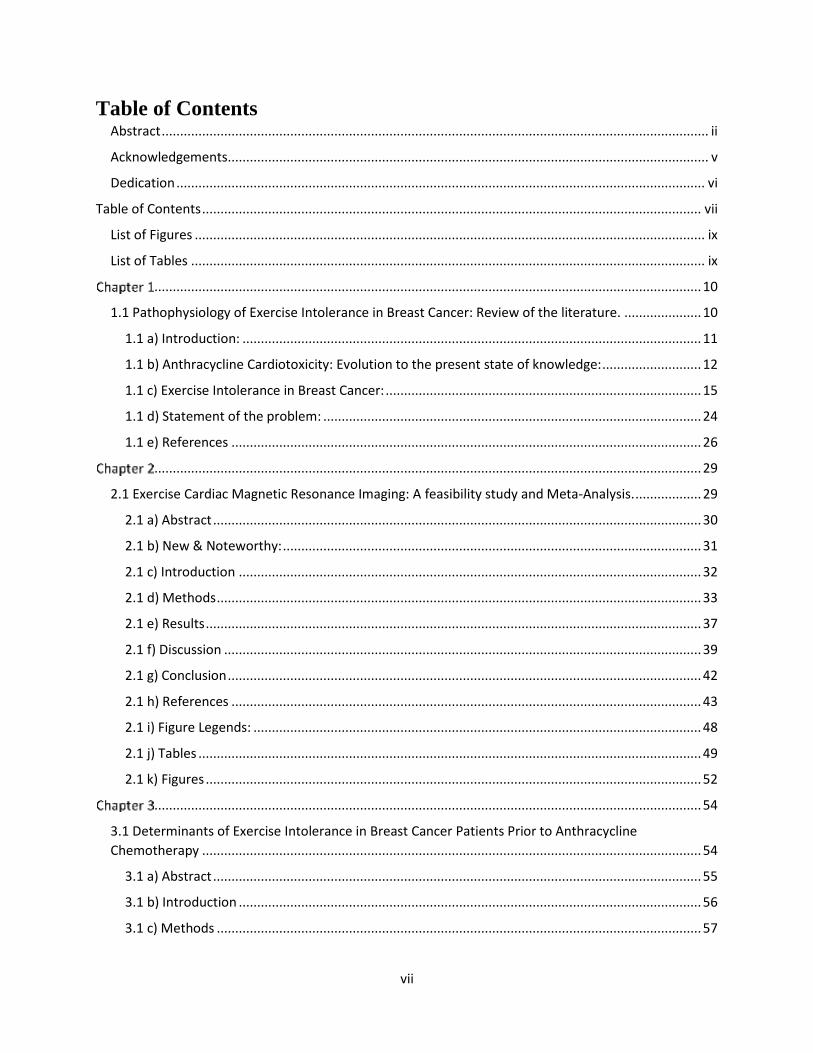
Table of Contents Abstract ..................................................................................................................................................... ii
Acknowledgements ................................................................................................................................... v
Dedication ................................................................................................................................................ vi
Table of Contents ........................................................................................................................................ vii
List of Figures ........................................................................................................................................... ix
List of Tables ............................................................................................................................................ ix
..................................................................................................................................................... 10
1.1 Pathophysiology of Exercise Intolerance in Breast Cancer: Review of the literature. ..................... 10
1.1 a) Introduction: ............................................................................................................................. 11
1.1 b) Anthracycline Cardiotoxicity: Evolution to the present state of knowledge: ........................... 12
1.1 c) Exercise Intolerance in Breast Cancer: ...................................................................................... 15
1.1 d) Statement of the problem: ....................................................................................................... 24
1.1 e) References ................................................................................................................................ 26
..................................................................................................................................................... 29
2.1 Exercise Cardiac Magnetic Resonance Imaging: A feasibility study and Meta-Analysis. .................. 29
2.1 a) Abstract ..................................................................................................................................... 30
2.1 b) New & Noteworthy: .................................................................................................................. 31
2.1 c) Introduction .............................................................................................................................. 32
2.1 d) Methods .................................................................................................................................... 33
2.1 e) Results ....................................................................................................................................... 37
2.1 f) Discussion .................................................................................................................................. 39
2.1 g) Conclusion ................................................................................................................................. 42
2.1 h) References ................................................................................................................................ 43
2.1 i) Figure Legends: .......................................................................................................................... 48
2.1 j) Tables ......................................................................................................................................... 49
2.1 k) Figures ....................................................................................................................................... 52
..................................................................................................................................................... 54
3.1 Determinants of Exercise Intolerance in Breast Cancer Patients Prior to Anthracycline
Chemotherapy ........................................................................................................................................ 54
3.1 a) Abstract ..................................................................................................................................... 55
3.1 b) Introduction .............................................................................................................................. 56
3.1 c) Methods .................................................................................................................................... 57

viii
3.1 d) Results ....................................................................................................................................... 60
3.1 e) Discussion.................................................................................................................................. 62
3.1 f) Conclusion.................................................................................................................................. 65
3.1 g) References................................................................................................................................. 66
3.1 h) Figure Legends .......................................................................................................................... 72
3.1 i) Tables ......................................................................................................................................... 73
3.1 j) Figures ........................................................................................................................................ 75
..................................................................................................................................................... 79
4.1 Leg blood flow is preserved during small muscle mass exercise in long-term survivors of
anthracycline treated breast cancer. ...................................................................................................... 79
4.1 a) Abstract: .................................................................................................................................... 80
4.1 b) Introduction .............................................................................................................................. 81
4.1 c) Methods: ................................................................................................................................... 82
4.1 d) Results: ...................................................................................................................................... 85
4.1 e) Discussion.................................................................................................................................. 86
4.1 f) References ................................................................................................................................. 90
4.1 g) Figure Legends: ......................................................................................................................... 92
4.1 h) Tables: ....................................................................................................................................... 93
4.1 i) Figures: ....................................................................................................................................... 96
..................................................................................................................................................... 99
5.1 Exercise intolerance in anthracycline-treated breast cancer survivors: the role of skeletal muscle
bioenergetics, oxygenation and composition. ........................................................................................ 99
5.1 a) Abstract ................................................................................................................................... 100
5.1 b) Implications for Practice: ........................................................................................................ 101
5.1 c) Introduction ............................................................................................................................ 102
5.1 d) Methods .................................................................................................................................. 103
5.1 e) MR Imaging and 31P Magnetic Resonance Spectroscopy ....................................................... 104
5.1 f) Results ...................................................................................................................................... 108
5.1 g) Conclusion ............................................................................................................................... 115
5.1 h) References .............................................................................................................................. 116
5.1 a) Figure Legends: ....................................................................................................................... 119
5.1 b) Figures: .................................................................................................................................... 120
5.1 c) Tables: ..................................................................................................................................... 123
................................................................................................................................................... 128

ix
6.1 Conclusion ....................................................................................................................................... 128
6.1 a) References .............................................................................................................................. 133
................................................................................................................................................... 134
7.1 Appendix ......................................................................................................................................... 134
7.1 a) Chapter 3 Data Supplement .................................................................................................... 135
List of Figures Figure 1: cMRI Images and Results ............................................................................................................. 52
Figure 2: Meta-Analysis Results .................................................................................................................. 53
Figure 3: Left Ventricular Volumes; rest to peak exercise .......................................................................... 75
Figure 4: Right Ventricular Volumes; rest to peak exercise ........................................................................ 76
Figure 5: Heart Rate and Cardiac Index; rest to peak exercise ................................................................... 77
Figure 6: Peak Cardiac Output and Peak Oxygen Uptake ........................................................................... 78
Figure 7: Power output, leg blood flow, mean arterial pressure and leg conductance at rest and during
single leg knee extension ............................................................................................................................ 96
Figure 8: Femoral artery pressure-strain .................................................................................................... 97
Figure 9: Experimental set-up for plantarflexion exercise and image acquisition for determination of
lower-leg oxygen uptake ........................................................................................................................... 120
Figure 10: MRI body composition acquisition and analysis ...................................................................... 121
Figure 11: Relationship between IMF:SM ratio and whole body peak oxygen uptake ............................ 122
List of Tables Table 1: Metabolic and hemodynamic comparison between supine and upright exercise ....................... 49
Table 2: Characteristics of exercise cMRI studies reporting LV Volumes ................................................... 50
Table 3: Meta-Analysis effect size, significance and heterogeneity ........................................................... 51
Table 4: Participant Characteristics ............................................................................................................ 73
Table 5: Cardiopulmonary exercise performance during upright cycle exercise ....................................... 74
Table 6 Participant Characteristics ............................................................................................................. 93
Table 7 Maximal single leg knee extension parameters ............................................................................. 94
Table 8 Pearson's correlations between femoral artery blood flow and pressure-strain .......................... 95
Table 9 Participant characteristics ............................................................................................................ 123
Table 10 Cardiopulmonary exercise performance and lower leg muscle bioenergetics .......................... 124
Table 11 Body composition of the thigh, lower leg and abdomen ........................................................... 126
Table 12 Pearson's correlations between lower leg IMF:SM ratio and skeletal muscle bioenergetics ... 127

1.1 Pathophysiology of Exercise Intolerance in Breast Cancer: Review of the
literature.

11
1.1 a) Introduction:
Breast cancer (BC) is the most frequently diagnosed malignancy in women, and the
second leading cause of cancer mortality.1 Approximately 1 out of every 8 women will be
diagnosed with BC in their lifetime, amounting to nearly a quarter million new cases annually in
the United States.2 Over the past 4 decades, improvements in prevention, detection and treatment
have resulted in a nearly 40% BC mortality reduction.1 A direct implication of improved survival
is the rapidly expanding population of survivors, for which competing causes of morbidity and
mortality are growing concerns. Specifically, cardiovascular disease (CVD) is a leading cause of
death in BC survivorship.3 Most strikingly is the reported 35% increase (adjusted incidence rate
ratio) in risk of cardiomyopathy/heart failure (HF).4 This excess risk has traditionally been
attributed to cardiotoxic BC therapies including mediastinal chest irradiation and chemotherapy;
however, in 2007 this understanding evolved to the “Multiple Hit Hypothesis”, explaining excess
risk as a culmination of underlying CVD risk factors at diagnosis, direct cardiotoxic anti-cancer
therapy, and indirect effects of anti-cancer therapy (poor nutrition, decline in physical activity).5
Limited data were available to support the Multiple Hit Hypothesis when it was proposed;
however, over the last decade a wealth of new data has emerged from the physiologic to
epidemiologic level confirming and advancing the understanding of elevated CV mortality in BC
survivorship. The present paradigm explaining excess CV risk posits a combination of pre-
existing CVD risk factors, shared biologic pathways between CVD and BC, and treatment and
lifestyle toxicity result in elevated CV mortality.6
Herein, the focus will be anthracycline related cardiotoxicity and HF in BC.
Anthracycline class drugs were first introduced to oncology practice in the late 1960’s.7, 8 Their
12
robust antitumor efficacy resulted in widespread use and anthracycline based chemotherapy
regimens quickly became frontline therapy. Within 5 years of their clinical induction, dose
limiting cardiotoxicity was reported.9 Today, anthracyclines remain a treatment mainstay; anti-
tumor effects must carefully be balanced with risk of cardiotoxicity.
1.1 b) Anthracycline Cardiotoxicity: Evolution to the present state of knowledge:
In 1979 the first largescale study of anthracycline related HF was released.10 This study
consisted of retrospective analysis of 4018 anthracycline treated patients with histopathological
examination of HF cases, as well as post-mortem non-HF cases when available.10 Von Hoff et al.
found overall incidence of doxorubicin (the clinical standard anthracycline at the time) induced
HF was 2.2%; a conservative cumulative incidence given that many patients received low doses,
and only clinically diagnosed HF cases were counted. Heart failure occurred on average 33 days
after the last doxorubicin dose, and was lethal in 60% of patients. Remarkably, only 37% of HF
cases demonstrated histopathological evidence of doxorubicin cardiotoxicity, and an additional
8% of a cohort subset (n=347) showed post-mortem evidence of subclinical damage. These
investigators identified three factors associated with cardiotoxicity; first, they confirmed earlier
reports of cumulative dose as the primary risk factor. Second, dosing schedule appeared to
influence development of cardiotoxicity, with a trend for greater peak plasma concentration
eliciting cardiotoxicity. Third, increasing age was associated with cardiotoxicity however it was
unclear if the latter finding was related to age, or age associated declines in CV health (i.e.
functional status, cardiovascular comorbidities).
This study identified two critical research areas10. First, research was needed to advance
cardiotoxicity risk stratification, and improve early detection/monitoring and therapy for
13
cardiotoxicity. In the cohort, the leading cause of death was progressive malignant disease,
establishing the need for higher cumulative doses of doxorubicin in patients at low risk of
cardiotoxicity and HF. The authors recognized that their sample was drawn from clinical trials
prone to selection bias through exclusion of “sick” patients, thus limiting application of their
results. Underlying CV risk factors and low functional status were previously demonstrated as
relevant risk factors for cardiotoxicity, but were not statistically significant in the selected
retrospective analysis. As suggested by the authors, the use of developing methodologies
(cardiac biomarkers, ECG, echocardiography) for monitoring cardiac function and detecting
subclinical cardiotoxicity could aid in earlier and more effective intervention. More research was
needed to identify effective therapies for reversal of cardiotoxicity.
Second, Von Hoff et al.10 reported that 1) subclinical cardiotoxicity (post-mortem
evidence of cardiac damage without HF) was present in 8% of non-HF cases, and 2) the vast
majority of HF cases were not consistent with doxorubicin induced cardiac damage. This
curious phenomenon marks a discord between anthracycline mediated cardiotoxicity and
development HF, and raises the possibility of an indirect relationship between anthracyclines and
HF.
The present state of knowledge of anthracycline cardiotoxicity is based on the seminal
study by Cardinale et al. who demonstrated the feasibility of early detection and pharmaceutical
intervention to reverse cardiotoxicity.11 This prospective study was designed to elucidate the
prevalence and pathophysiology of anthracycline cardiotoxicity through serial monitoring using
state of the art echocardiography.11
At the time, the accepted model of anthracycline cardiotoxicity included 3 subtypes: 1)
acute, occurring after a single dose/course with clinical manifestation in less than 2 weeks, 2)
14
early-onset chronic, developing within 1 year of therapy and characterized by cardiac
hypokinesis, and 3) late-onset chronic, developing years to decades after therapy. Sparse data
were available to support the model, as the vast majority of studies were retrospective, and only
included patients who had developed clinically overt HF. As a result, it was unclear when
cardiotoxicity occurred in relation to the onset of clinical HF. To address this, Cardinale et al.11
prospectively enrolled 2625 consecutive patients scheduled for anthracycline based
chemotherapy and monitored patient’s quarterly using echocardiography. Cardiotoxicity was
defined as a decline in left ventricular ejection fraction (LVEF) by 10% or to a value below 50%
(biplane) and evidence based anti-HF medications were administered given evidence of
cardiotoxicity. Notably, this definition of cardiotoxicity is not synonymous with clinical
presentation of HF, but identifies subclinical cardiac dysfunction which may progress to clinical
cardiac dysfunction and overt HF.
Cardinale et al.11 reported the presence of cardiotoxicity in 9.7% of BC patients, similar
to findings by Von Hoff et al. more than 3 decades earlier.10 Ninety eight percent of cases
occurred within the first year (median 3.5 months) of therapy cessation, and when treated with
contemporary HF medication, 11% of patients had full recovery, 71% made partial recovery
(defined as an increase in LVEF to >50% or an increase in LVEF by 5 percentage points), while
18% showed no improvement.11 The authors argued for a singular pathophysiology of early
onset cardiotoxicity, which could insidiously decline until symptomatic detection of HF years
after incipient damage if left undetected and untreated. In spite of their compelling evidence that
98% of cases occurred within the first year, the median follow-up was only 5 years, with few
cases available beyond 10 years. Importantly, as in the general population, age is the greatest
risk factor for the development of CVD and HF with women diagnosed with BC who are >7

15
years having nearly 23-fold greater risk of developing HF relative to women diagnosed between
50 and 54 years of age.12
Detection of cardiotoxicity resulting in cardiac dysfunction was contingent upon changes
in resting cardiac function, as measured by echocardiography.11 Cardinale et al. provide
promising results with this clinically relevant and cost effective strategy, however, there remains
discord between resting cardiac measures and exercise intolerance- the hallmark feature of HF.
Cardiac stress imaging and more robust non-invasive imaging strategies could provide earlier
insight into functional declines and changes in cardiac tissue (i.e. fibrosis), opening the window
for potentially earlier and more effective intervention.
1.1 c) Exercise Intolerance in Breast Cancer:
The hallmark feature of HF is exercise intolerance, measured objectively as decreased
peak oxygen uptake (VO2 peak) during maximal exercise. VO2 peak is the strongest independent
predictor of CV, and all-cause mortality in healthy and clinical populations, and is related to
survival in BC.13-15 Across the survivorship continuum, VO2 peak is approximately 20% lower
relative to age and sex matched controls.13, 16-18 This decrement in cardiorespiratory fitness likely
contributes to elevated CVD risk as a 40 year-old BC survivor has been shown to have a VO2 peak
similar to that found in healthy sedentary women 20-30 years older.13 Currently, the mechanisms
underpinning impairments in VO2 peak are poorly understood.
In accordance with the Fick principal (VO2 = the product of cardiac output [Q] and
arterial-venous oxygen difference [CaO2 – CvO2]), the reduced in VO2 peak may be due to central
and/or peripheral, factors with the caveat that there is interdependency between flow and oxygen
extraction equilibration.

16
1.1 c) i: Cardiac Determinants of impaired VO2peak:
Cardiac output is the product of heart rate (HR) and stroke volume (SV), the difference
between end-diastolic (EDV) and end-systolic volume (ESV). Given the known cardiotoxic
nature of anthracycline chemotherapy, impaired peak Q may be an important contributor to
exercise intolerance in anthracycline treated BC survivors. To date, 3 previous investigations
have examined cardiac function in anthracycline treated BC survivors.
Jones et al. using impedance cardiography and expired gas analysis, studied 42 anthracycline
treated BC survivors (34 months post therapy cessation) and 11 age- and sex-matched controls.17
Breast cancer survivors had 21% lower VO2peak that was due to a lower peak Q secondary to a
lower peak SV with no significant difference found between groups for peak, mean arterial
pressure, systemic vascular resistance or estimated CaO2 – CvO2. Of note, resting SV was lower
while HR was higher resulting in a blunted HR reserve (peak minus rest value). A limitation of
impedance cardiography is that it is unable to evaluate the contribution of changes in left
ventricular (LV) systolic and diastolic volumes and function in limiting exercise SV.
A later study by Khouri et al., using echocardiography at rest and during post-exercise
recovery, equal to 83% of maximal HR, measured LV volumes and Q in 57 middle-aged
anthracycline treated BC survivors (51 years) and 20 age and sex-matched controls (57 years).16
Compared to controls, VO2peak was 20% lower in BC survivors with no significant difference
between groups for maximal exercise HR or SBP. Post-exercise Q was lower in BC survivors
secondary to a lower SV and EDV.16 A limitation of this study was that assessment of cardiac
function occurring in the recovery period.
17
Finally, Koelwyn et al.19, using 2D echocardiography during sub-maximal cycle exercise,
measured cardiac function in 30 anthracycline treated BC survivors and 30 age-, BMI- and
activity- matched women. In contrast to the above mentioned studies16, 17, VO2peak was not
significantly different between groups, and control subjects achieved greater peak systolic blood
pressure.19 Similar to prior studies16, 17, the BC group a had higher resting HR and both groups
achieved the same peak HR- suggesting reduced HR reserve in BC survivors. No differences
were found for LV EDV, ESV, SV or LVEF at rest, however, at 25, 50 and 75% of maximal
work rate, ESV was increased in BC survivors while LVEF reserve was blunted. These findings
were explained by impaired ventricular-arterial coupling in BC mediated by an increase in non-
invasively derived single-point end-systolic elastance (a surrogate for LV contractility).
Importantly, the estimated increase in end-systolic elastance may have been due to increased
myocardial stiffness due to fibrosis/extracellular matrix expansion, cardiomyocyte loss, or
impaired cardiomyocyte contractile function independent of LV contractility.
In an effort to better understand perturbations in end-systolic elastance, myocardial tissue
characteristics were characterized in a cross-sectional study of anthracycline treated cancer
survivors (n=37), non-anthracycline treated cancer survivors (n=17), pre-therapy cancer patients
(n=37), and cancer-free controls (n=236).20 Specifically, magnetic resonance imaging (MRI) was
used to non-invasively assess LV native T1 (an indicator of myocardial fibrosis) and T2
relaxation (a measure of myocardial edema). Previously, extracellular volume fraction (the ratio
of extracellular matrix to cardiomyocytes) was linked to cardiac tissue movement and diastolic
compliance.21 Consistent with findings of impaired end-systolic elastance from Koelwyn et al.19,
anthracycline treated cancer survivors had increased myocardial fibrosis (measured as T1 and
extracellular volume fraction with gadolinium) relative to cancer-free controls.20 However, pre-

18
treatment cancer patients also had elevated native T1, suggesting that even prior to therapy,
cancer patients may have increased LV chamber fibrosis and stiffness. T2 was within normal
ranges for both pre-treatment cancer patients and cancer survivors.
In summary, the role anthracycline induced cardiac impairment in reduced VO2peak is unclear.
Studies performed to date consistently demonstrate that BC survivors do not have a reduced peak
HR, however; resting HR is elevated and as a result, HR reserve is reduced.16, 17, 19 Some studies
have shown that peak Q is secondary to reduced SV16, 17, however studies in which LV volumes
were measured during exercise stress remain equivocal. Khouri et al.16 reported normal LVEF,
but were underpowered to detect subtle differences in LV volumes, while Koelwyn et al.19
reported a blunted LVEF reserve secondary to impaired ventricular-arterial coupling during sub-
maximal exercise. Further, the impaired ventricular-arterial coupling is consistent with studies
reporting increased myocardial extracellular volume fraction and fibrosis following
anthracycline therapy. However, there is evidence to suggest underlying differences in
myocardial tissue characteristics prior to therapy.20 There remains the possibility of reduced peak
Q prior to anthracycline therapy, suggesting underlying structural and/or functional cardiac
differences even in the absence of a cardiotoxic stimuli.
1.1 c) ii: Non-Cardiac Determinants of impaired VO2peak:
Non-cardiac peripheral abnormalities, may result in decreased oxygen delivery to and or
extraction by the active muscles during exercise. The volume of oxygen in a given volume of
arterial blood is described by the equation:
CaO2 = (SaO2%) x [Hb g/dl] x 1.34 ml O2/g Hb x blood volume
19
Where SaO2 is arterial oxygen saturation, Hb is hemoglobin, and 1.34 is a constant for the
oxygen carrying capacity of hemoglobin.
During peak exercise, there is no evidence to indicate reduced SaO2 in the absence of
overt pulmonary disease in BC. Although reduced pulmonary function is reported in BC and
linked to exercise capacity, reductions in pulmonary function do not contribute to reduced
arterial oxygen content.18
Anemia is a well-known consequence of anthracycline therapy22, 23, and can directly
lower the oxygen carrying capacity of blood. Reductions in hemoglobin are related to the change
in VO2 peak over the course of chemotherapy.24 In a 3-arm study comparing usual care (UC,
n=82), aerobic exercise training (AET, n= 78) and resistance exercise training (RET, n=82),
exercise did not attenuate declines in hemoglobin, but did preserve VO2 peak.24 In another study,
anemic cancer patients, including a subset of BC patients, were administered darbepoetin, a
synthetic stimulator of red blood cell production, with (n=26) or without (n=29) concomitant
AET. Peak oxygen uptake significantly improved in the AET group, and at study end,
hemoglobin trended to increase greater in the darbepoetin alone group (123.4±12.8 vs
120.6±16.3 g/l, p=0.067).25 Taken together, these data indicate a relationship between reduced
oxygen carrying capacity of blood and VO2peak, but do not support reduced oxygen carry capacity
of blood as a limiting determinant of exercise capacity. Further complicating the role of
anthracycline induced anemia are the findings by Kirshner et al. who reported that 31.3% of BC
patients had anemia prior to receiving chemotherapy22, a finding that suggests the possibility of
impaired VO2 peak in the absence of a cardiotoxic and anemic stimulus.

20
Given that CaO2 and SaO2 remain constant during exercise, a reduction in venous oxygen
saturation (SvO2%) drives increased oxygen extraction. SvO2% is a composite term dictated by
the Fick principle of diffusion:
Rate of Diffusion = k x A(P2 – P1)/D
Where k is a diffusion constant dependent upon solubility of the gas and temperature, A is the
surface area of gas exchange, (P2 – P1) is the diffusion gradient (partial pressure in mmHg) and D
is the diffusion distance.
Currently, no information is available directly linking perturbations involving factors
governing oxygen diffusion and VO2peak in anthracycline treated BC survivors. However, during
exercise, the predominant source of increased oxygen demand is in the active skeletal muscle.26
Accordingly, VO2 is determined by the mass of skeletal muscle that is active, the ability to
deliver oxygen to the muscle, and the ability of the muscle to utilize oxygen. In health, large
muscle mass exercise (>5-6 kg) is limited by oxygen delivery26, however, whether this is the
case in BC remains unknown.
In a seminal study by Demark-Wahnefried et al., BC patients receiving chemotherapy
(n=36, age: 41 years) were shown to gain weight, with a concomitant drop in skeletal muscle
mass from pre-to-post-therapy.27 This finding was linked to a ~25-75 kcal/day reduction in
physical activity energy expenditure, without a compensatory adjustment in caloric intake. Over
the course of one year (study end), BC patients treated with chemotherapy increased their fat
mass by 2.3 kg, and decreased their lean body mass by 0.5 kg, with lean body mass loss
predominantly localized to the thigh. While this study did not measure VO2peak, findings may be
inferred; absolute VO2 may decline as a result of decreased muscle mass, and relative VO2 would
21
decline due to a two-fold hit- increased fat mass and decreased active skeletal muscle mass.27
Indeed, therapy associated weight gain is a near ubiquitous finding, with a recent meta-analysis
demonstrating a pooled mean gain of 2.7 kg (95% CI: 2.0-3.3 kg) across 34 studies and 2620 BC
patients; increased adiposity is likely to be a contributing factor to reduced oxygen uptake in
BC.28
Reding et al. provided the first evidence of a link between anthracycline related changes
in body composition and declines in VOpeak.29 In a cross sectional study, 14 cancer survivors
(age: 54 years, 8 BC, >1 year post anthracycline therapy) and 14 sex- age- and BMI-matched
controls underwent magnetic resonance imaging (MRI) to characterize intermuscular fat (IMF)
and skeletal muscle (SM) in the paraspinal skeletal muscles at the level of the second lumbar
vertebra while cardiopulmonary exercise testing was performed to determine VO2 peak. Survivors
had 22% lower VO2peak, and trended to have greater paraspinal IMF (BC 13.9 ± 5.6 vs HC 11.7 ±
4.3 cm2, p=0.11) and IMF to SM ratio (BC 0.26 ± 0.10 vs HC 0.22 ± 0.10, p=0.13). In both
groups combined, VO2 peak was strongly and inversely related to the IMF:SM ratio (r -0.67,
p<0.01). Correlations persisted after adjustment for subcutaneous and visceral fat depots,
implicating a key role of IMF in reduced exercise capacity.29 The authors speculate that IMF
competes for blood flow and oxygen delivery to active muscle29, as has been proposed as a
mechanism of exercise intolerance in HF with preserved ejection fraction.30 Despite the strong
relationships reported by Reding et al., caution must be warranted as the paraspinal muscles play
a minimal role in VO2 compared to major locomotor muscles during peak whole body exercise.29
Mijwel et al. extend findings of skeletal muscle loss from pre-to post-BC chemotherapy
by measuring muscle fiber size and type, capillary to fiber ratio, and fiber oxidative capacity.31 In
a sample of 10 BC patients, muscle fiber cross-sectional area decreased, as well as the capillary
22
to fiber ratio and citrate synthase activity- the rate limiting enzyme in oxidative metabolism.
Markers of muscle atrophy were not increased, while markers of mitophagy were reduced, a
possible indicator of dysregulated quality control of mitochondria production. These changes
may contribute to a decrease in surface area available for oxygen exchange, reduced oxygen use
and therefore diffusion gradient, and potentially mixed effects on diffusion distance. Reduced
fiber cross sectional area would reduce diffusion distance from the cell membrane to
mitochondria, however, given fewer capillaries per muscle fiber, the diffusion distance from
capillary to mitochondria may be increased. In the same study, 13 BC patients underwent
exercise training which prevented a decrease in muscle fiber cross sectional area, capillary to
fiber ratio, and citrate synthase activity.31 How these findings translate to whole body VO2 is
unclear beyond skeletal muscle mass loss contributing to reduced VO2 peak as previously
discussed, however, reductions in muscle fiber oxidative capacity (citrate synthase activity)
could contribute to reduced whole body VO2 peak under the condition of adequate muscle oxygen
supply at peak exercise.
Muscle oxygen supply is determined by ability to deliver Q to active skeletal muscle.
Previously, vascular dysfunction has been hypothesized as a mechanism contributing to impaired
VO2 peak and elevated CV risk in BC, as vascular dysfunction is considered an incipient step in
the pathogenesis of CVD.32 An early study reported that over the course of anthracycline based
chemotherapy, vascular function measured as brachial artery flow mediated dilation (FMD) in
response to cuff ischemia did not decline (n=20, mean age=49).33 Results were later confirmed in
a larger sample (n=35), and in line with this finding, two, independent studies report no
difference in FMD between BC survivors (n=47, 30) and healthy controls (n=11, 30).17, 19, 34
Further, brachial artery function was not related to peak VO2.17 Taken together, evidence to date

23
suggests a minimal role of vascular (dys)function in limiting VO2 peak in anthracycline treated BC
survivors.
Vascular stiffening has also been proposed as a mechanism contributing to reduced
oxygen delivery (through impaired peak Q) and impaired exercise tolerance. In a case-control
study of cancer patients (BC n=19, lymphoma n=11, leukemia n=10) scheduled to receive
anthracycline based chemotherapy and control participants (n=13), aortic distensibility (relative
change in cross-sectional area of the artery normalized to pulse pressure) and pulse wave
velocity (PWV, pressure propagation speed) were measured as indicators of aortic stiffness.35
From pre to post therapy (4 months), PWV increased by 95%, with no corresponding change
over the same duration in the control group. Aortic distensibility consistently mirrored PWV
findings as distensibility dropped by more than 50% in cancer patients, and remained constant in
controls.35 In a follow-up study, Drafts et al. replicated PWV findings and provided time-course
information in 53 cancer patients (BC n=22, lymphoma n=17, leukemia n=13, myelodysplastic
syndrome n=1) undergoing anthracycline based chemotherapy.36 Pulse wave velocity was
measured prior to the start of therapy, and at 1, 3 and 6 months; PWV increased steadily from
baseline (6.7±0.5) to 6 months (10.1±1 m/s). In contrast, a recent study of 35 BC patients found
that over the course of anthracycline based therapy carotid-femoral, carotid-femoral PWV
decreased (16.7±11.8 to 14.9±8.4 m/s, n.s.), while aortic compliance (assessed by ultrasound) did
not change (0.061±0.04 to 0.046±0.03 mm/mmHg, n.s.).34 Taken together, these findings
indicate potential structural vascular involvement in the determination of VO2 peak. Despite mixed
longitudinal findings, it should be noted that prior to anthracycline based chemotherapy, studies
consistently report aberrant vascular stiffness, suggesting underlying structural vascular changes

24
independent of potentially vascular-toxic anthracycline therapy.34-36 Whether increased vascular
stiffness limits blood flow to working muscle and potentially impairs VO2 peak was not addressed.
To date, only one study has investigated the ability to deliver blood to working muscle.37
Small muscle mass exercise can be used as a paradigm to isolate ability to deliver blood to active
muscle, as metabolic demands of small muscle mass exercise do not approach the limits of peak
Q.38 In a mixed cohort of cancer survivors (n=11, BC n=10) treated with adjuvant therapy
(anthracycline based n=4), ultrasound was used to assess forearm blood flow in response
rhythmic handgrip exercise at 20% of maximal voluntary contraction.37 Cancer survivors
achieved significantly lower forearm blood flow and mean arterial pressure during exercise, with
no difference in forearm vascular conductance between groups. Despite using a paradigm
designed to remove the heart as a limiting component of exercising blood flow, the authors
attribute the finding of reduced forearm blood flow to an impaired blood pressure response,
secondary to reduced LV ejection time (derived from the arterial pressure waveform, a measure
of ventricular systolic performance).37 The blunted forearm blood flow response could not be
attributed to different relative or absolute workloads, raising the possibility that given the same
absolute workload and oxygen demand for the given workload, lower forearm blood flow must
be compensated for by increased oxygen extraction. In the context of whole body VO2, the same
effect would imply preserved VO2peak despite any cardiac or vascular perturbations associated
with BC.
1.1 d) Statement of the problem:
The pathophysiology of exercise intolerance in anthracycline treated BC is not well
understood. Anthracyclines have clearly defined cardiotoxicity, however, only a small portion of
anthracycline treated BC survivors have evidence of subclinical cardiac dysfunction at rest, and

25
the sparse literature available leaves the possibility of underlying cardiac impairment open.11, 16,
17 Further, the paucity of studies that have examined isolated (cardiac, vascular and skeletal
muscle function) components of the oxygen cascade have not examined components during
maximal exercise.
The following studies aim to 1) develop a clinically viable MRI exercise stress imaging
technique to assess cardiac function during exercise (Chapter 2); 2) examine exercising cardiac
function in BC patients prior to anthracycline therapy as a determinant of VO2 peak (Chapter 3); 3)
examine peripheral hemodynamic responses during submaximal single leg knee extension
(SLKE) exercise in BC survivors and controls (Chapter 4); and 4) examine muscle composition,
lower leg blood flow, oxygen utilization and bioenergetics as potential factors contributing to
exercise intolerance in BC survivors (Chapters 5). Taken together, these studies aim to elucidate
pathophysiological mechanisms underpinning reduced cardiorespiratory fitness in anthracycline
treated BC.
26
1.1 e) References
1. Siegel RL, Miller KD and Jemal A. Cancer statistics, 2018. CA: A Cancer Journal for Clinicians.
2018;68:7-30.
2. American C, Society. Cancer treatment & survivorship: facts & figures 2015-2016. Online.
2017;February 5, 2017:https://www.cancer.org/cancer/breast-cancer.html.
3. Gernaat SAM, Ho PJ, Rijnberg N, Emaus MJ, Baak LM, Hartman M, Grobbee DE and
Verkooijen HM. Risk of death from cardiovascular disease following breast cancer: a systematic review.
Breast Cancer Res Treat. 2017;164:537-555.
4. Armenian SH, Xu L, Ky B, Sun C, Farol LT, Pal SK, Douglas PS, Bhatia S and Chao C.
Cardiovascular Disease Among Survivors of Adult-Onset Cancer: A Community-Based Retrospective
Cohort Study. Journal of clinical oncology. 2016;34:1122.
5. Jones LW, Haykowsky MJ, Swartz JJ, Douglas PS and Mackey JR. Early Breast Cancer Therapy
and Cardiovascular Injury. Journal of the American College of Cardiology. 2007;50:1435-1441.
6. Kirkham AA, Beaudry RI, Paterson DI, Mackey JR and Haykowsky MJ. Curing breast cancer
and killing the heart: A novel model to explain elevated cardiovascular disease and mortality risk among
women with early stage breast cancer. Prog Cardiovasc Dis. 2019.
7. McGowan JV, Chung R, Maulik A, Piotrowska I, Walker JM and Yellon DM. Anthracycline
Chemotherapy and Cardiotoxicity. Cardiovascular Drugs and Therapy. 2017;31:63-75.
8. Barry E, Alvarez JA, Scully RE, Miller TL and Lipshultz SE. Anthracycline-induced
cardiotoxicity: course, pathophysiology, prevention and management. EXPERT OPINION ON
PHARMACOTHERAPY. 2007;8:1039-1058.
9. Lefrak EA, Pitha J, Rosenheim S and Gottlieb JA. CLINICOPATHOLOGIC ANALYSIS OF
ADRIAMYCIN CARDIOTOXICITY. CANCER. 1973;32:302-314.
10. Vonhoff DD, Layard MW, Basa P, Davis HL, Vonhoff AL, Rozencweig M and Muggia FM.
RISK-FACTORS FOR DOXORUBICIN-INDUCED CONGESTIVE HEART-FAILURE. ANNALS OF
INTERNAL MEDICINE. 1979;91:710-717.
11. Cardinale D, Colombo A, Bacchiani G, Tedeschi I, Meroni CA, Veglia F, Civelli M, Lamantia G,
Colombo N, Curigliano G, Fiorentini C and Cipolla CM. Early Detection of Anthracycline Cardiotoxicity
and Improvement With Heart Failure Therapy. Circulation. 2015;131:1981-1988.
12. Weberpals J, Jansen L, Müller OJ and Brenner H. Long-term heart-specific mortality among
347 476 breast cancer patients treated with radiotherapy or chemotherapy: a registry-based cohort study.
European heart journal. 2018.
13. Jones LW, Courneya KS, Mackey JR, Muss HB, Pituskin EN, Scott JM, Hornsby WE, Coan AD,
Herndon JE, Douglas PS and Haykowsky M. Cardiopulmonary Function and Age-Related Decline
Across the Breast Cancer Survivorship Continuum. JOURNAL OF CLINICAL ONCOLOGY.
2012;30:2530-2537.
14. Imboden MT, Harber MP, Whaley MH, Finch WH, Bishop DL and Kaminsky LA.
Cardiorespiratory Fitness and Mortality in Healthy Men and Women. J Am Coll Cardiol. 2018;72:2283-
2292.
15. Gulati M, Pandey DK, Arnsdorf MF, Lauderdale DS, Thisted RA, Wicklund RH, Al-Hani AJ and
Black HR. Exercise capacity and the risk of death in women - The St James Women Take Heart Project.
CIRCULATION. 2003;108:1554-1559.
16. Khouri MG, Hornsby WE, Risum N, Velazquez EJ, Thomas S, Lane A, Scott JM, Koelwyn GJ,
Herndon JE, Mackey JR, Douglas PS and Jones LW. Utility of 3-dimensional echocardiography, global
longitudinal strain, and exercise stress echocardiography to detect cardiac dysfunction in breast cancer
patients treated with doxorubicin-containing adjuvant therapy. Breast cancer research and treatment.
2014;143:531-539.
27
17. Jones LW, Haykowsky M, Pituskin EN, Jendzjowsky NG, Tomczak CR, Haennel RG and
Mackey JR. Cardiovascular reserve and risk profile of postmenopausal women after chemoendocrine
therapy for hormone receptor - Positive operable breast cancer. ONCOLOGIST. 2007;12:1156-1164.
18. O'Donnell DE, Webb KA, Langer D, Elbehairy AF, Neder JA and Dudgeon DJ. Respiratory
Factors Contributing to Exercise Intolerance in Breast Cancer Survivors: A Case-Control Study. Journal
of pain and symptom management. 2016;52:54-63.
19. Koelwyn GJ, Lewis NC, Ellard SL, Jones LW, Gelinas JC, Rolf JD, Melzer B, Thomas SM,
Douglas PS, Khouri MG and Eves ND. Ventricular-Arterial Coupling in Breast Cancer Patients After
Treatment With Anthracycline-Containing Adjuvant Chemotherapy. ONCOLOGIST. 2016;21:141-149.
20. Jordan JH, Vasu S, Morgan TM, D'Agostino RB, Jr., Melendez GC, Hamilton CA, Arai AE, Liu
S, Liu CY, Lima JA, Bluemke DA, Burke GL and Hundley WG. Anthracycline-Associated T1 Mapping
Characteristics Are Elevated Independent of the Presence of Cardiovascular Comorbidities in Cancer
Survivors. Circ Cardiovasc Imaging. 2016;9.
21. Neilan TG, Coelho-Filho OR, Shah RV, Feng JH, Pena-Herrera D, Mandry D, Pierre-Mongeon F,
Heydari B, Francis SA, Moslehi J, Kwong RY and Jerosch-Herold M. Myocardial extracellular volume
by cardiac magnetic resonance imaging in patients treated with anthracycline-based chemotherapy. Am J
Cardiol. 2013;111:717-22.
22. Kirshner J, Hatch M, Hennessy DD, Fridman M and Tannous RE. Anemia in stage II and III
breast cancer patients treated with adjuvant doxorubicin and cyclophosphamide chemotherapy.
Oncologist. 2004;9:25-32.
23. Groopman JE and Itri LM. Chemotherapy-Induced Anemia in Adults: Incidence and Treatment.
JNCI: Journal of the National Cancer Institute. 1999;91:1616-1634.
24. Dolan LB, Gelmon K, Courneya KS, Mackey JR, Segal RJ, Lane K, Reid RD and McKenzie DC.
Hemoglobin and Aerobic Fitness Changes with Supervised Exercise Training in Breast Cancer Patients
Receiving Chemotherapy. CANCER EPIDEMIOLOGY BIOMARKERS & PREVENTION. 2010;19:2826-
2832.
25. Courneya KS, Jones LW, Peddle CJ, Sellar CM, Reiman T, Joy AA, Chua N, Tkachuk L and
Mackey JR. Effects of aerobic exercise training in anemic cancer patients receiving darbepoetin alfa: a
randomized controlled trial. Oncologist. 2008;13:1012-20.
26. Poole DC and Richardson RS. Determinants of oxygen uptake. Implications for exercise testing.
Sports medicine (Auckland, NZ). 1997;24:308-20.
27. Demark-Wahnefried W, Peterson BL, Winer EP, Marks L, Aziz N, Marcom PK, Blackwell K and
Rimer BK. Changes in weight, body composition, and factors influencing energy balance among
premenopausal breast cancer patients receiving adjuvant chemotherapy. Journal of clinical oncology :
official journal of the American Society of Clinical Oncology. 2001;19:2381-9.
28. van den Berg MM, Winkels RM, de Kruif JT, van Laarhoven HW, Visser M, de Vries JH, de
Vries YC and Kampman E. Weight change during chemotherapy in breast cancer patients: a meta-
analysis. BMC Cancer. 2017;17:259.
29. Reding KW, Brubaker P, D’Agostino R, Kitzman DW, Nicklas B, Langford D, Grodesky M and
Hundley WG. Increased skeletal intermuscular fat is associated with reduced exercise capacity in cancer
survivors: a cross-sectional study. Cardio-Oncology. 2019;5:3.
30. Haykowsky MJ, Kouba EJ, Brubaker PH, Nicklas BJ, Eggebeen J and Kitzman DW. Skeletal
muscle composition and its relation to exercise intolerance in older patients with heart failure and
preserved ejection fraction. Am J Cardiol. 2014;113:1211-6.
31. Mijwel S, Cardinale DA, Norrbom J, Chapman M, Ivarsson N, Wengstrom Y, Sundberg CJ and
Rundqvist H. Exercise training during chemotherapy preserves skeletal muscle fiber area, capillarization,
and mitochondrial content in patients with breast cancer. FASEB journal : official publication of the
Federation of American Societies for Experimental Biology. 2018;32:5495-5505.
32. Widmer RJ and Lerman A. Endothelial dysfunction and cardiovascular disease. Global
cardiology science & practice. 2014;2014:291.
28
33. Jones LW, Fels DR, West M, Allen JD, Broadwater G, Barry WT, Wilke LG, Masko E, Douglas
PS, Dash RC, Povsic TJ, Peppercorn J, Marcom PK, Blackwell KL, Kimmick G, Turkington TG and
Dewhirst MW. Modulation of Circulating Angiogenic Factors and Tumor Biology by Aerobic Training in
Breast Cancer Patients Receiving Neoadjuvant Chemotherapy. CANCER PREVENTION RESEARCH.
2013;6:925-937.
34. Mizia-Stec K, Goscinska A, Mizia M, Haberka M, Chmiel A, Poborski W and Gasior Z.
Anthracycline chemotherapy impairs the structure and diastolic function of the left ventricle and induces
negative arterial remodelling. Kardiol Pol. 2013;71:681-90.
35. Chaosuwannakit N, D'Agostino R, Hamilton CA, Lane KS, Ntim WO, Lawrence J, Melin SA,
Ellis LR, Torti FM, Little WC and Hundley WG. Aortic Stiffness Increases Upon Receipt of
Anthracycline Chemotherapy. JOURNAL OF CLINICAL ONCOLOGY. 2010;28:166-172.
36. Drafts BC, Twomley KM, D'Agostino R, Jr., Lawrence J, Avis N, Ellis LR, Thohan V, Jordan J,
Melin SA, Torti FM, Little WC, Hamilton CA and Hundley WG. Low to moderate dose anthracycline-
based chemotherapy is associated with early noninvasive imaging evidence of subclinical cardiovascular
disease. JACC Cardiovasc Imaging. 2013;6:877-85.
37. Didier KD. Altered Blood Flow Response to Small Muscle Mass Exercise in Cancer Survivors
Treated With Adjuvant Therapy. 2017;6.
38. Joyner MJ and Casey DP. Regulation of increased blood flow (hyperemia) to muscles during
exercise: a hierarchy of competing physiological needs. Physiol Rev. 2015;95:549-601.
2.1 Exercise Cardiac Magnetic Resonance Imaging: A feasibility study and Meta-
Analysis.
Rhys I. Beaudry1, T. Jake Samuel1, Jing Wang2, Wesley J. Tucker1, Mark J. Haykowsky2,
Michael D. Nelson1, Exercise Cardiac Magnetic Resonance Imaging: A feasibility study and
Meta-Analysis. Am J Physiol Regul Integr Comp Physiol. 2018 315:4, R638-R645;
https://doi.org/10.1152/ajpregu.00158.2018
1Department of Kinesiology, University of Texas at Arlington, 500 W. Nedderman Drive,
Arlington, TX 76013, USA
2College of Nursing and Health Innovation, University of Texas at Arlington, 411 S. Nedderman
Drive, Arlington, TX 76010, USA
Used with permission of the publisher, 2019.

30
2.1 a) Abstract
Cardiac stress testing improves detection and risk assessment of heart disease. Magnetic
resonance imaging (MRI) is the clinical gold-standard for assessing cardiac morphology and
function at rest; however, exercise MRI has not been widely adapted for cardiac assessment due
to imaging and device limitations. Commercially available MR ergometers, together with
improved imaging sequences, have overcome many previous limitations, making cardiac stress
MRI more feasible. Here, we aimed to demonstrate clinical feasibility, and establish the
normative, healthy response to supine exercise MRI. Eight young, healthy subjects, underwent
rest and exercise cinematic imaging to measure left ventricular volumes and ejection fraction. To
establish the normative, healthy response to exercise MRI we performed a comprehensive
literature review and meta-analysis of existing exercise cardiac MRI studies. Results were pooled
using a random effects model to define the left ventricular ejection fraction, end-diastolic, end-
systolic, and stroke volume responses. Our proof-of-concept data showed a marked increase in
cardiac index with exercise, secondary to an increase in both heart rate and stroke volume. The
change in stroke volume was driven by a reduction in end-systolic volume, with no change in
end-diastolic volume. These findings were entirely consistent with 17 previous exercise MRI
studies (226 individual records), despite differences in imaging approach, ergometer, or exercise
type. Taken together, the data herein demonstrate that exercise cardiac MRI is clinically feasible,
using commercially available exercise equipment and vendor-provided product sequences, and
establish the normative, healthy response to exercise MRI.

31
2.1 b) New & Noteworthy:
Cardiac stress testing improves detection and risk assessment of heart disease; however,
exercise MRI has not been widely adapted for cardiac assessment due to imaging and device
limitations. Here, we demonstrate clinical feasibility of cardiac stress MRI using a commercially
available MRI compatible ergometer and vendor provided product sequences. Moreover, by
performing a comprehensive literature review and meta-analysis of existing exercise cardiac
MRI studies, we establish the normative, healthy response to supine exercise MRI.
32
2.1 c) Introduction
Exercise stress testing provides important prognostic information for assessing
cardiovascular risk and detection of heart disease 39-45. Combining exercise stress testing with
cardiac imaging, such as echocardiography, nuclear imaging or positron emission tomography,
significantly improves diagnostic sensitivity and specificity 46-50. Accordingly, exercise stress
imaging is commonly performed world-wide 51-55.
Cardiac magnetic resonance imaging (cMRI) is the clinical gold-standard for assessing
cardiac morphology and global systolic function 56-58. Despite its excellent spatial resolution, and
unique potential for additional structural and functional quantification (e.g. fibrosis assessment
and/or myocardial energetics), cMRI is not currently utilized for cardiac exercise stress imaging.
While many factors may contribute to the underutilization of stress cMRI, the general lack of
MR compatible exercise equipment and inadequate imaging sequences likely play a major role
59.
To overcome these limitations, several investigators have advocated exercising outside of
the MRI followed by a brief transition to the scan table and subsequent imaging 60-68. Under this
paradigm, with much familiarization and the use of innovative body molds (to ensure anatomical
image registration), image acquisition can be performed within 60 seconds of peak exercise 63.
Marked hemodynamic recovery during the transition from exercise to imaging 60-63, 67, 68, and the
technical training and familiarization required of both the patient and imaging staff to achieve
rapid and accurate body placement, has prevented wide spread adoption of this approach.
Accordingly, several investigators have focused on MRI compatible cycle ergometers, which
allow patients to exercise inside the bore of the magnet 69-78. While several studies have

33
evaluated cardiac output dynamics using velocity encoding approaches 70, 79-85, only a few studies
have attempted to evaluate ventricular morphology and function 69, 73, 75, 77, 78, 86-94; the vast
majority of which have utilized a real-time, ungated free-breathing pulse sequence 73, 87-90, 94.
While this latter approach increases overall feasibility by eliminating ECG-gating artifacts,
patient breath-holds, and minimizes the impact of chest movement, post-processing is incredibly
complex and time consuming, negating the possibility of “real-time” image reconstruction during
the cardiac stress test (and thus real-time physician feedback). Such limitations have also
prevented the wide-spread adoption of this approach.
With this background, and the goal of making exercise cMRI clinically translatable, the
primary aim of this study was to test the feasibility of using a commercially available MR
compatible ergometer, combined with vendor provided MR imaging sequences, to assess cardiac
morphology and function. To assess the impact of movement on image quality, we compared
images acquired during exercise, with images acquired immediately (0-4 seconds) post-exercise.
To assess the impact of a prolonged pause between exercise and imaging—similar to that
encountered when exercise is performed outside of the bore of the MRI— we compared subject
hemodynamics, cardiac morphology and cardiac function between exercise and following a 60-
second pause. A secondary aim of this study was to perform a comprehensive literature review
and meta-analysis of published studies reporting cardiac volumes during exercise cMRI to
establish the normative response.
2.1 d) Methods
34
2.1 d) i: Participants
Eight recreationally active, young, healthy subjects were recruited from the Dallas-Fort
Worth community. Participants were eligible for inclusion if they were 18–35 years old,
physically active, and had no history of cardiovascular, metabolic or neurological disease.
Exclusion criteria included: contraindications to MRI and physical limitations precluding
exercise.
All procedures were performed in accordance with the principles of the Helsinki
declaration; all participants provided written informed consent and the study was approved by
the University of Texas at Arlington and University of Texas Southwestern Medical Center
Institutional Review Boards.
2.1 d) ii: Protocol To address our primary aim, each subject completed three visits. The first visit was used
for screening, familiarization with the MRI compatible ergometer (Ergospect Cardio-Stepper,
Ergospect, Austria), and determination of target workload and heart rate for exercise cMRI. The
second visit was used to characterize the metabolic cost and hemodynamic differences between
supine exercise with our MR compatible ergometer and upright exercise with a traditional cycle
ergometer (Lode Corival, Lode, Netherlands). The third visit consisted of a resting and exercise
stress cMRI.
Supine Cardiopulmonary Exercise Test: Subjects underwent a supine, incremental
maximal exercise test, starting at 15 watts at a cadence of 50 revolutions per minute (RPM) and
progressing by 15 watts every 2 minutes until volitional exhaustion or significant and continued
loss of cadence (>10 RPM despite verbal encouragement to continue). Heart rate (Polar H1,
35
Polar, USA), expired gas analysis (TrueOne 2400, Parvomedics, USA) and work-rate (Ergospect,
Cardio-Stepper, Ergospect Austria) were recorded continuously.
Upright Cardiopulmonary Exercise Test: Subjects underwent an incremental ramped
maximal exercise test, starting at 50 watts at a self-selected cadence (50-90 RPM) and
progressing by 20 watts every 2 minutes until volitional exhaustion. Heart rate (Polar H1, Polar,
USA), expired gas analysis (TrueOne 2400, Parvomedics, USA) and work-rate (Lode Corival,
Lode, Netherlands) were recorded continuously.
Cardiac MRI: Imaging was conducted on a Phillips Achieva 3T scanner. Following
resting imaging, subjects exercised at the workload, determined from study visit 1, required to
achieve 4 metabolic equivalents (METs, 4 METs ≈ 14 ml/kg/min); the minimal threshold for
independent living 95. High resolution long-axis (4-chamber and 2 chamber) and short axis (mid-
ventricular, papillary muscle level) cine images were acquired using balanced fast field echo at
rest, during exercise, immediately (0-4 seconds) post-exercise, and 60-seconds post-exercise (to
mimic patient transfer from an external exercise device). Typical image parameters include: TR
= 3.4 msec; TE = 1.7 msec; flip angle = 45º; acquisition matrix = 195 x 195; field of view = 295
x 295 mm; 8-mm slice thickness; 20-30 phases/cardiac cycle; with one slice acquired per breath
hold. Breath-hold time ranged between 7-9 seconds at rest and 3-5 seconds during exercise.
Cardiac MRI data were analyzed using commercially available software (CVI42, Circle
Cardiovascular Imaging Inc., Canada). LV volumes were calculated by Simpson’s Biplane
method using standard 4 and 2-chamber slices, and cross-sectional area was measured in the
short axis plane. All volumes were indexed to body surface area; calculated by the Dubois-
Dubois formula, to account for body size variation 96.

36
2.1 d) iii: Comprehensive Literature Review
To accomplish our secondary aim, we performed a comprehensive literature review,
searching articles on PubMed from 1985 to March 2018, using the search terms “exercise AND
cardiac MRI”, hand searched references, and contacted experts in the field. A priori, we included
studies reporting left-ventricular cardiac volumes for healthy controls aged 16-35, to best match
our participant inclusion criteria. We extracted mean resting and exercise end-diastolic, end-
systolic and stroke volumes, heart rates, and ejection fractions from study text, tables and figures
(WebPlotDigitizer, V 4.1, Rohatgi, USA). If data were not readily extractable, authors were
contacted directly and asked to provide the missing or unattainable data.
2.1 d) iv: Statistical Analysis
Aim 1 – Feasibility Study: Dependent variables were confirmed for normality and
homoscedasticity using the Shapiro-Wilk test. Changes in cardiac volumes and global left
ventricular function from rest to exercise/post-exercise were assessed using a one-way repeated
measures ANOVA with Sidak post hoc testing. Hemodynamic and cardiopulmonary data were
compared between the supine and upright incremental exercise tests using a paired sample t-test.
Statistical analyses were performed using SPSS (version 24 IBM SPSS Statistics, Armonk,
USA). All data are expressed as mean (standard deviation) unless otherwise stated, and statistical
significance was considered when P ≤ 0.05.
Aim 2 – Comprehensive Literature Review: Previously published results from the
literature review were pooled and analyzed by a random-effect analysis to create a single, more
precise estimate of the effect size. The rest/exercise correlation was assumed to be moderate
(50%) 97. Analysis and graphical presentation were performed in R 3.4.2 using the “metaphor”
37
package (R Core Team (2016), R Foundation for Statistical Computing, Vienna, Austria). Effect
sizes were calculated using both Standardized Mean Differences (SMD) and Weighted Mean
Differences (WMD) between rest and exercise conditions. A SMD of 0.25 was considered as a
small effect size, 0.5 as a medium effect size, and 0.8 and higher as a large effect size.
Heterogeneity of studies was explored using the Cochrane’s Q test of heterogeneity (P < 0.05
was considered statistically significant). Inconsistency in the results of the studies was assessed
by I2 which described the percentage of total variation across studies that was due to
heterogeneity. When I2 was > 50%, there was more than moderate inconsistency 98, 99.
2.1 e) Results
2.1 e) i: Aim 1 – Feasibility Study
Eight healthy men and women completed the feasibility study (M/F, 3/5; age, 25 + 3
years; BMI, 22.3 + 2.7 kg/m2; BSA, 1.62 + 0.14 m2).
Supine vs. Upright Exercise: The metabolic and hemodynamic data for both the supine
and upright cardiopulmonary stress tests are displayed in Table 1. Peak oxygen consumption
was markedly lower during supine exercise compared to upright cycling, reflective of the smaller
muscle mass being utilized with the MR compatible ergometer. Similarly, peak heart rate, peak
respiratory exchange ratio, and peak ventilation were also markedly lower. None of the subjects
met the criteria for true VO2max during supine exercise, defined as achieving: 1) age predicted
maximal heart rate; 2) respiratory exchange ratio > 1.10; or 3) a plateau in oxygen consumption.
In contrast, all of the subjects during the upright cycling ramp test met at least two of these
criteria. The primary reason for stopping the supine exercise test was an inability to overcome
38
the change in resistance; none of the subjects reported maximal perceived exertion or
breathlessness as a reason for stopping.
cMRI Feasibility: Cardiac imaging was possible during exercise in all of the subjects.
None of the subjects reported any discomfort or experienced any adverse events. As expected,
image quality was improved post-exercise (0-4 second, 60 seconds), when upper body and chest
coil movement were eliminated (Figure 1).
Both heart rate and stroke volume increased with exercise, resulting in a 2-fold increase
in cardiac index (CI) (Figure 1). The increase in stroke volume was mediated entirely by a
reduction in end-systolic volume (ESV), as end-diastolic volume (EDV) was unchanged with
exercise. Accordingly, ejection fraction was also significantly increased with exercise.
As compared to imaging during exercise, imaging immediately post-exercise had no
significant impact on chamber volumes, ejection fraction or cardiac index. In contrast, imaging
60-seconds post-exercise resulted in a significant increase in end-systolic volume, and a
significant decrease in heart rate, ejection fraction, and cardiac index (Figure 1).
2.1 e) ii: Aim 2 - Literature Review and Data Synthesis
Our search produced 1787 articles; 17 studies reported rest and exercise cardiac volumes.
Of the 17 studies, data were extracted from 14 studies (Table 2). One study 72 reported median
and interquartile range which could not be used in our synthesis. Two studies 77, 100 were
confirmed to have used previously reported data sets and were therefore excluded. . When
multiple exercise intensities were reported, the exercise intensity closest to that chosen in our
feasibility study was reported.

39
Characteristics of the studies included in our comprehensive data synthesis are displayed
in Table 2. The SMD model was used to account for variance in study participants (sex, age,
BSA, exercise capacity) and volumetric reporting (standard versus normalized volumes). By
combining these datasets, we were able to evaluate the normal physiological response to supine
exercise in 226 healthy subjects. The pooled analysis support our proof-of-concept data (reported
above), showing a marked and significant increase in ejection fraction during exercise compared
to rest (Figure 2 and Table 3). Moreover, we observed no change in left ventricular end-
diastolic volume, with changes in stroke volume being entirely driven by reductions in end-
systolic volume (Figure 2 and Table 3). Similarly, the magnitude of change in cardiac index
was therefore predominantly driven by changes in heart rate (Table 2). The Q test revealed
significant variation in the exercise response to ejection fraction (P = 0.004), end-systolic
volume (P = 0.007), and stroke volume (P = 0.005), although less than moderate (I2 = 41%, 49%
and 27%). There was no heterogeneity in end-diastolic volume response (Table 3A).
Visual inspection of Figure 2 prompted post-hoc analysis to determine if the Lafountain
study (2016, treadmill exercise) was a statistical outlier. Based on our model, approximately 5%
of the externally standardized residuals would be expected to exceed the bounds ±1.96.
Externally standardized residuals were calculated for end-systolic volume, stroke volume and
ejection fraction as -3.85, 1.92 and 12.24 respectively, indicating the study as a potential outlier.
In a sensitivity analysis, removal of Lafountain 2016 from the meta-analysis increased Q test p-
values (0.08, 0.05 and 0.26) and reduced I2 values (38%, 42%, and 26%) for ESV, SV and EF,
demonstrating a significant reduction in heterogeneity.
2.1 f) Discussion
40
The major novel findings of this study are three-fold: First, we demonstrate feasibility of
exercise stress cMR using a commercially available leg ergometer, and vendor-provided product
sequences at 3T. Second, we demonstrate hemodynamic similarities between imaging during and
immediately post-exercise, but marked hemodynamic decline when imaging is delayed for at
least 60-seconds post exercise. Finally, by combining our results with previously published data,
we were able to define the normal cardiac response to exercise cMRI.
That cardiac imaging was feasible using a commercially available leg ergometer, and
vendor-provided product sequences, provides great promise for easy and simple adoption of
exercise cMRI in clinical settings. While we observed a marked improvement in image quality
by imaging immediately post-exercise, we observed no major differences in cardiac volumes or
global left ventricular function between these two conditions. Because inclusion of brief pauses
will prolong the exercise stress imaging protocol, we believe imaging during exercise will prove
to be the protocol of choice for most clinical sites. Of course, if exercise intensity is increased
beyond the submaximal level performed herein, imaging during brief periods of exercise
cessation may need to be adopted to overcome the anticipated upper body and chest coil
movement. Indeed, as movement artifact increases with higher exercise intensities, spatial
resolution may degrade despite consistent imaging parameters. Caution is indeed warranted
when interpreting data acquired past 4-seconds post-exercise however, as our results suggest,
prolonged periods of rest following exercise are associated with sharp hemodynamic recovery.
While it may be argued that the rapid hemodynamic recovery observed in this study is reflective
of the younger, healthy population studied herein, clinical patients exercised outside of scanner
bore and transferred for imaging share a comparable decline in heart rate 63, 67.

41
Our feasibility data, together with our meta-analysis, demonstrate that the increase in
cardiac output during submaximal supine exercise is driven predominantly by an increase in
heart rate, with minimal contribution from stroke volume. The data overwhelmingly suggest that
healthy subjects have no end-diastolic volume reserve during supine exercise, despite the
expected increase in respiratory and muscle pumps. That this observation is consistent across
studies which did not perform breath holds 68, 73, 87-90 argues against intrathoracic pressure (i.e.
Valsalva maneuver) mediated reductions in preload. These data must therefore reflect the fact
that supine positioning, combined with leg elevation (feet in the ergometer stirrups), produces
near maximal end-diastolic volumes.
That we only observed a small reduction in end-systolic volume with exercise was
surprising, though consistent with other cMRI studies in healthy populations 68, 69, 73, 75, 78, 86-94.
Admittedly, this investigation was focused on submaximal exercise, and thus we cannot extend
these end-systolic volume findings to higher exercise intensities. Indeed, studies which included
higher workloads have reported exercise intensity dependent reductions in end-systolic volume
72, 73, 87-90. This inter-study difference likely contributed to the heterogeneity of findings in our
meta-analysis for end-systolic volume, ejection fraction, and stroke volume. Regardless of
exercise intensity however, the absolute change in end-systolic volume remains fairly low. This
may reflect the fact that supine exercise with MR compatible ergometers may not recruit
sufficient muscle mass to challenge cardiac output enough to demand greater end-systolic
volume changes. Compared to conventional upright cycling, our data clearly show blunted
metabolic demand; also observed in a prior investigation using a different MR compatible
ergometer 72.

42
This proof-of-concept feasibility study is not without limitation. First, we limited our data
collection to young healthy participants. Future studies are needed to extend these data to clinical
populations. Second, spatial resolution was purposely sacrificed to shorten breath-hold time. As
a result, the cine images were not sufficient for tissue deformation (i.e. strain) analysis. Inclusion
of quantifiable regional wall motion measurements will be an important future addition,
especially in clinical populations.
2.1 g) Conclusion
Taken together, the data herein establish the proof-of-concept that exercise cMRI can be
easily adapted to a clinical setting, providing gold-standard non-invasive stress images during
exercise. Using commercially available MRI compatible exercise equipment and vendor-
provided product sequences, we were able to successfully characterize the cardiac response to
submaximal exercise. By combining our feasibility data with previously published results, we
also establish the normative cardiac stress response in over 200 healthy subjects. With this
background in place, future studies are needed to adapt this approach in clinical populations.
43
2.1 h) References
38. Picano EMDP, Pibarot PMDP, Lancellotti PMDP, Monin JLMDP and Bonow ROMD. The
Emerging Role of Exercise Testing and Stress Echocardiography in Valvular Heart Disease. JACC
(Journal of the American College of Cardiology). 2009;54:2251-2260.
39. Sicari R, Nihoyannopoulos P, Evangelista A, Kasprzak J, Lancellotti P, Poldermans D, Voigt J-U,
Zamorano JL, European Association of E and on behalf of the European Association of E. Stress
Echocardiography Expert Consensus Statement--Executive Summary: European Association of
Echocardiography (EAE) (a registered branch of the ESC). 2009;30:278-289.
40. Pellikka PAMD, Nagueh SFMD, Elhendy AAMDP, Kuehl CAR, Sawada SGMD and American
Society of E. American Society of Echocardiography Recommendations for Performance, Interpretation,
and Application of Stress Echocardiography. Journal of the American Society of Echocardiography.
2007;20:1021-1041.
41. Gibbons RJ, Balady GJ, Bricker JT, Chaitman BR, Fletcher GF, Froelicher VF, Mark DB,
McCallister BD, Mooss AN, O'Reilly MG, Winters WL, Antman EM, Alpert JS, Faxon DP, Fuster V,
Gregoratos G, Hiratzka LF, Jacobs AK, Russell RO, Smith SC and American College of
Cardiology/American Heart Association Task Force on Practice G. ACC/AHA 2002 guideline update for
exercise testing: Summary article - A report of the American College of Cardiology/American Heart
Association Task Force on Practice Guidelines (Committee to Update the 1997 Exercise Testing
Guidelines). CIRCULATION. 2002;106:1883-1892.
42. Fowler-Brown A, Pignone M, Pletcher M, Tice JA, Sutton SF, Lohr KN and Force USPST.
Exercise tolerance testing to screen for coronary heart disease: a systematic review for the technical
support for the U.S. Preventive Services Task Force. Annals of internal medicine. 2004;140:W9.
43. Balady GJ, Arena R, Sietsema K, Myers J, Coke L, Fletcher GF, Forman D, Franklin B, Guazzi
M, Gulati M, Keteyian SJ, Lavie CJ, Macko R, Mancini D, Milani RV, Amer Heart Assoc Exercise C,
Interdisciplinary Council Q, Council Peripheral Vasc D, Council Epidemiology P, American Heart
Association Exercise CR, Prevention Committee of the Council on Clinical C, Council on Peripheral
Vascular D, Interdisciplinary Council on Quality of C, Outcomes R, Council on E, Prevention, on behalf
of the American Heart Association Exercise CR and Prevention Committee of the Council on Clinical C.
Clinician's Guide to Cardiopulmonary Exercise Testing in Adults A Scientific Statement From the
American Heart Association. CIRCULATION. 2010;122:191-225.
44. Fletcher GF, Ades PA, Kligfield P, Arena R, Balady GJ, Bittner VA, Coke LA, Fleg JL, Forman
DE, Gerber TC, Gulati M, Madan K, Rhodes J, Thompson PD, Williams MA, Council Cardiovasc Stroke
N, Amer Heart A, Council Nutr Phys Activity M, Council Epidemiology P, Council Clinical C, American
Heart Association Exercise CR, Prevention Committee of the Council on Clinical Cardiology CoNPA,
Metabolism CoC, Stroke N, Council on E and Prevention. Exercise Standards for Testing and Training: A
Scientific Statement From the American Heart Association. Circulation. 2013;128:873-934.
45. Banerjee A, Newman DR, Van den Bruel A and Heneghan C. Diagnostic accuracy of exercise
stress testing for coronary artery disease: a systematic review and meta‐analysis of prospective studies.
International Journal of Clinical Practice. 2012;66:477-492.
46. Metz LD, Beattie M, Hom R, Redberg RF, Grady D and Fleischmann KE. The Prognostic Value
of Normal Exercise Myocardial Perfusion Imaging and Exercise Echocardiography: A Meta-Analysis.
Journal of the American College of Cardiology. 2007;49:227.
47. Voilliot D and Lancellotti P. Exercise Testing and Stress Imaging in Mitral Valve Disease.
Current Treatment Options in Cardiovascular Medicine. 2017;19:1-11.
48. Henri CMD, Piérard LAMDP, Lancellotti PMDP, Mongeon F-PMD, Pibarot PDVMP and
Basmadjian AJMDM. Exercise Testing and Stress Imaging in Valvular Heart Disease. Canadian Journal
of Cardiology. 2014;30:1012-1026.
49. Jaarsma C, Leiner T, Bekkers SC, Crijns HJ, Wildberger JE, Nagel E, Nelemans PJ and Schalla
S. Diagnostic Performance of Noninvasive Myocardial Perfusion Imaging Using Single-Photon Emission
44
Computed Tomography, Cardiac Magnetic Resonance, and Positron Emission Tomography Imaging for
the Detection of Obstructive Coronary Artery Disease A Meta-Analysis. Journal of the American College
of Cardiology. 2012;59:1719-1728.
50. Fihn SDMDMPH, Gardin JMMD, Abrams JMD, Berra KMSNANP, Blankenship JCMD, Dallas
APMD, Douglas PSMD, Foody JMMD, Gerber TCMDP, Hinderliter ALMD, King SBMD, Kligfield
PDMD, Krumholz HMMD, Kwong RYKMD, Lim MJMD, Linderbaum JAMSCNPBC, Mack MJMD,
Munger MAP, Prager RLMD, Sabik JFMD, Shaw LJP, Sikkema JDMSNANPBC, Smith CRMD, Smith
SCMD, Spertus JAMDMPH and Williams SVMD. 2012 ACCF/AHA/ACP/AATS/PCNA/SCAI/STS
Guideline for the Diagnosis and Management of Patients With Stable Ischemic Heart Disease. JACC
(Journal of the American College of Cardiology). 2012;60:e44-e164.
51. Ferket BSMD, Genders TSSM, Colkesen EBMD, Visser JJMDP, Spronk SP, Steyerberg EWP
and Hunink MGMMDP. Systematic Review of Guidelines on Imaging of Asymptomatic Coronary Artery
Disease. JACC (Journal of the American College of Cardiology). 2011;57:1591-1600.
52. Demir OMM, Bashir AM, Marshall KB, Douglas MB, Wasan BM, Plein SP and Alfakih KMD.
Comparison of Clinical Efficacy and Cost of a Cardiac Imaging Strategy Versus a Traditional Exercise
Test Strategy for the Investigation of Patients With Suspected Stable Coronary Artery Disease. American
Journal of Cardiology, The. 2015;115:1631-1635.
53. Zellweger MJ, Fahrni G, Ritter M, Jeger RV, Wild D, Buser P, Kaiser C, Osswald S, Pfisterer
ME and Investigators B. Prognostic Value of "Routine" Cardiac Stress Imaging 5 Years After
Percutaneous Coronary Intervention The Prospective Long-Term Observational BASKET (Basel Stent
Kosteneffektivitats Trial) LATE IMAGING Study. JACC-CARDIOVASCULAR INTERVENTIONS.
2014;7:615-621.
54. Shah R, Heydari B, Coelho-Filho O, Murthy VL, Abbasi S, Feng JH, Pencina M, Neilan TG,
Meadows JL, Francis S, Blankstein R, Steigner M, di Carli M, Jerosch-Herold M and Kwong RY. Stress
Cardiac Magnetic Resonance Imaging Provides Effective Cardiac Risk Reclassification in Patients With
Known or Suspected Stable Coronary Artery Disease. Circulation. 2013;128:605-614.
55. Vick GW. The gold standard for noninvasive imaging in coronary heart disease: magnetic
resonance imaging. CURRENT OPINION IN CARDIOLOGY. 2009;24:567-579.
56. Rayoo R, Kearney L, Grewal J, Ord M, Lu K, Smith G and Srivastava P. Cardiac MRI:
Indications and Clinical Utility—A Single Centre Experience. Heart, Lung and Circulation.
2012;21:S191-S191.
57. Pesenti-Rossi D, Peyrou J, Baron N, Allouch P, Aubert S, Boueri Z and Livarek B. Cardiac MRI:
Technology, clinical applications, and future directions. ANNALES DE CARDIOLOGIE ET D
ANGEIOLOGIE. 2013;62:326-341.
58. Nabi F, Malaty A and Shah DJ. Stress cardiac magnetic resonance. CURRENT OPINION IN
CARDIOLOGY. 2011;26:385-391.
59. Thavendiranathan P, Dickerson JA, Scandling D, Balasubramanian V, Pennell ML, Hinton A,
Raman SV and Simonetti OP. Comparison of treadmill exercise stress cardiac MRI to stress
echocardiography in healthy volunteers for adequacy of left ventricular endocardial wall visualization: A
pilot study. Journal of Magnetic Resonance Imaging. 2014;39:1146-1152.
60. Jekic M, Foster EL, Ballinger MR, Raman SV and Simonetti OP. Cardiac function and
myocardial perfusion immediately following maximal treadmill exercise inside the MRI room. JOURNAL
OF CARDIOVASCULAR MAGNETIC RESONANCE. 2008;10:3-3.
61. Foster EL, Arnold JW, Jekic M, Bender JA, Balasubramanian V, Thavendiranathan P, Dickerson
JA, Raman SV and Simonetti OP. MR‐compatible treadmill for exercise stress cardiac magnetic
resonance imaging. Magnetic Resonance in Medicine. 2012;67:880-889.
62. Raman SV, Dickerson JA, Mazur W, Wong TC, Schelbert EB, Min JK, Scandling D, Bartone C,
Craft JT, Thavendiranathan P, Mazzaferri EL, Arnold JW, Gilkeson R and Simonetti OP. Diagnostic
Performance of Treadmill Exercise Cardiac Magnetic Resonance: The Prospective, Multicenter Exercise
CMR's Accuracy for Cardiovascular Stress Testing (EXACT) Trial. Journal of the American Heart
Association. 2016;5:e003811-n/a.

45
63. Abd-Elmoniem KZ, Sampath S, Osman NF and Prince JL. Real-Time Monitoring of Cardiac
Regional Function Using FastHARP MRI and Region-of-Interest Reconstruction. IEEE Transactions on
Biomedical Engineering. 2007;54:1650-1656.
64. Almeida-Morais L, Pereira-Da-Silva T, Branco L, Timoteo AT, Agapito A, de Sousa L, Oliveira
JA, Thomas B, Jalles-Tavares N, Soares R, Galrinho A and Cruz-Ferreira R. The value of right
ventricular longitudinal strain in the evaluation of adult patients with repaired tetralogy of Fallot: a new
tool for a contemporary challenge. CARDIOLOGY IN THE YOUNG. 2017;27:498-506.
65. Sukpraphrute B, Drafts BC, Rerkpattanapipat P, Morgan TM, Kirkman PM, Ntim WO, Hamilton
CA, Cockrum RL and Hundley WG. Prognostic utility of cardiovascular magnetic resonance upright
maximal treadmill exercise testing. JOURNAL OF CARDIOVASCULAR MAGNETIC RESONANCE.
2015;17:103.
66. Raman SV, Dickerson JA, Jekic M, Foster EL, Pennell ML, McCarthy B and Simonetti OP. Real-
time cine and myocardial perfusion with treadmill exercise stress cardiovascular magnetic resonance in
patients referred for stress SPECT. JOURNAL OF CARDIOVASCULAR MAGNETIC RESONANCE.
2010;12:41-41.
67. Lafountain RA, da Silveira JS, Varghese J, Mihai G, Scandling D, Craft J, Swain CB, Franco V,
Raman SV, Devor ST and Simonetti OP. Cardiopulmonary exercise testing in the MRI environment.
Physiological Measurement. 2016;37:N11-N25.
68. Gusso S, Salvador C, Hofman P, Cutfield W, Baldi JC, Taberner A and Nielsen P. Design and
testing of an MRI-compatible cycle ergometer for non-invasive cardiac assessments during exercise.
BIOMEDICAL ENGINEERING ONLINE. 2012;11:13-13.
69. Weber TF, von Tengg-Kobligk H, Kopp-Schneider A, Ley-Zaporozhan J, Kauczor H-U and Ley
S. High-resolution phase-contrast MRI of aortic and pulmonary blood flow during rest and physical
exercise using a MRI compatible bicycle ergometer. European Journal of Radiology. 2010;80:103-108.
70. Pflugi S, Roujol S, Akçakaya M, Kawaji K, Foppa M, Heydari B, Goddu B, Kissinger K, Berg S,
Manning WJ, Kozerke S and Nezafat R. Accelerated cardiac MR stress perfusion with radial sampling
after physical exercise with an MR‐compatible supine bicycle ergometer. Magnetic Resonance in
Medicine. 2015;74:384-395.
71. Le TT, Bryant JA, Ting AE, Ho PY, Su B, Teo RCC, Gan JSJ, Chung YC, O'Regan DP, Cook
SA and Chin CWL. Assessing exercise cardiac reserve using real-time cardiovascular magnetic
resonance. JOURNAL OF CARDIOVASCULAR MAGNETIC RESONANCE. 2017;19.
72. La Gerche A, Claessen G, Van de Bruaene A, Pattyn N, Van Cleemput J, Gewillig M, Bogaert J,
Dymarkowski S, Claus P and Heidbuchel H. Cardiac MRI A New Gold Standard for Ventricular Volume
Quantification During High-Intensity Exercise. CIRCULATION-CARDIOVASCULAR IMAGING.
2013;6:329-338.
73. Heiberg J, Asschenfeldt B, Maagaard M and Ringgaard S. Dynamic bicycle exercise to assess
cardiac output at multiple exercise levels during magnetic resonance imaging. CLINICAL IMAGING.
2017;46:102-107.
74. Steding-Ehrenborg K, Jablonowski R, Arvidsson PM, Carlsson M, Saltin B, Arheden H, Klinisk
fysiologi L, Department of Clinical P, Lund U and Lunds u. Moderate intensity supine exercise causes
decreased cardiac volumes and increased outer volume variations: a cardiovascular magnetic resonance
study. JOURNAL OF CARDIOVASCULAR MAGNETIC RESONANCE. 2013;15:96-96.
75. Asschenfeldt B, Heiberg J, Ringgaard S, Maagaard M, Redington A and Hjortdal VE. Impaired
cardiac output during exercise in adults operated for ventricular septal defect in childhood: a hitherto
unrecognised pathophysiological response. CARDIOLOGY IN THE YOUNG. 2017;27:1591-1598.
76. Roest AAW, Helbing WA, Kunz P, van den Aardweg JG, Lamb HJ, Vliegen HW, van der Wall
EE and de Roos A. Exercise MR imaging in the assessment of pulmonary regurgitation and biventricular
function in patients after tetralogy of Fallot repair. RADIOLOGY. 2002;223:204-211.
77. Oosterhof T, Tulevski II, Roest AAW, Steendijk P, Vliegen HW, van der Wall EE, de Roos A,
Tijssen JGP and Mulder BJM. Disparity between dobutamine stress and physical exercise magnetic

46
resonance imaging in patients with an intra-atrial correction for transposition of the great arteries. Journal
of cardiovascular magnetic resonance. 2005;7:383-389.
78. Bal-Theoleyre L, Lalande A, Kober F, Giorgi R, Collart F, Piquet P, Habib G, Avierinos JF,
Bernard M, Guye M and Jacquier A. Aortic Function's Adaptation in Response to Exercise-Induced
Stress Assessing by 1.5T MRI: A Pilot Study in Healthy Volunteers. PLOS ONE. 2016;11:e0157704.
79. Heiberg E, Pahlm-Webb U, Agarwal S, Bergvall E, Fransson H, Steding-Ehrenborg K, Carlsson
M, Arheden H, Klinisk fysiologi L, Department of Clinical P, Lund U and Lunds u. Longitudinal strain
from velocity encoded cardiovascular magnetic resonance: a validation study. JOURNAL OF
CARDIOVASCULAR MAGNETIC RESONANCE. 2013;15:15-15.
80. Globits S, Sakuma H, Shimakawa A, Foo TKF and Higgins CB. Measurement of Coronary Blood
Flow Velocity During Handgrip Exercise Using Breath-Hold Velocity Encoded Cine Magnetic
Resonance Imaging. The American Journal of Cardiology. 1997;79:234-237.
81. Sampath S, Derbyshire JA, Ledesma‐Carbayo MJ and McVeigh ER. Imaging left ventricular
tissue mechanics and hemodynamics during supine bicycle exercise using a combined tagging and phase‐contrast MRI pulse sequence. Magnetic Resonance in Medicine. 2011;65:51-59.
82. Nagaraj HM, Pednekar A, Corros C, Gupta H and Lloyd SG. Determining exercise‐induced blood
flow reserve in lower extremities using phase contrast MRI. Journal of Magnetic Resonance Imaging.
2008;27:1096-1102.
83. Tenforde AS, Cheng CP, Suh GY, Herfkens RJ, Dalman RL and Taylor CA. Quantifying In Vivo
Hemodynamic Response to Exercise in Patients With Intermittent Claudication and Abdominal Aortic
Aneurysms Using Cine Phase-Contrast MRI. JOURNAL OF MAGNETIC RESONANCE IMAGING.
2010;31:425-429.
84. Cheng CP, Herfkens RJ, Taylor CA and Feinstein JA. Proximal pulmonary artery blood flow
characteristics in healthy subjects measured in an upright posture using MRI: The effects of exercise and
age. Journal of Magnetic Resonance Imaging. 2005;21:752-758.
85. Roest AAW, Kunz P, Lamb HJ, Helbing WA, van der Wall EE and Roos Ad. Biventricular
response to supine physical exercise in young adults assessed with ultrafast magnetic resonance imaging.
The American Journal of Cardiology. 2001;87:601-605.
86. Schnell F, Claessen G, La Gerche A, Claus P, Bogaert J, Delcroix M, Carre F and Heidbuchel H.
Atrial volume and function during exercise in health and disease. JOURNAL OF CARDIOVASCULAR
MAGNETIC RESONANCE. 2017;19.
87. Claessen G, Claus P, Delcroix M, Bogaert J, La Gerche A and Heidbuchel H. Interaction between
respiration and right versus left ventricular volumes at rest and during exercise: a real-time cardiac
magnetic resonance study. AMERICAN JOURNAL OF PHYSIOLOGY-HEART AND CIRCULATORY
PHYSIOLOGY. 2014;306:H816-H824.
88. Claessen G, Claus P, Ghysels S, Vermeersch P, Dymarkowski S, La Gerche A and Heidbuchel H.
Right Ventricular Fatigue Developing during Endurance Exercise: An Exercise Cardiac Magnetic
Resonance Study. Medicine & Science in Sports & Exercise. 2014;46:1717-1726.
89. Claessen G, La Gerche A, Dymarkowski S, Claus P, Delcroix M and Heidbuchel H. Pulmonary
Vascular and Right Ventricular Reserve in Patients With Normalized Resting Hemodynamics After
Pulmonary Endarterectomy. JOURNAL OF THE AMERICAN HEART ASSOCIATION. 2015;4:e001602.
90. Gusso S, Pinto TE, Baldi JC, Robinson E, Cutfield WS and Hofman PL. Diastolic Function Is
Reduced in Adolescents With Type 1 Diabetes in Response to Exercise. DIABETES CARE.
2012;35:2089-2094.
91. Pinto TE, Gusso S, Hofman PL, Derraik JGB, Hornung TS, Cutfield WS and Baldi JC. Systolic
and Diastolic Abnormalities Reduce the Cardiac Response to Exercise in Adolescents With Type 2
Diabetes. DIABETES CARE. 2014;37:1439-1446.
92. Roest AAW, Lamb HJ, van der Wall EE, Vliegen HW, van den Aardweg JG, Kunz P, de Roos A
and Helbing WA. Cardiovascular response to physical exercise in adult patients after atrial correction for
transposition of the great arteries assessed with magnetic resonance imaging. HEART. 2004;90:678-684.
47
93. Lurz P, Muthurangu V, Schievano S, Nordmeyer J, Bonhoeffer P, Taylor AM and Hansen MS.
Feasibility and reproducibility of biventricular volumetric assessment of cardiac function during exercise
using real-time radial k-t SENSE magnetic resonance imaging. Journal of magnetic resonance imaging :
JMRI. 2009;29:1062.
94. Shephard RJ. Maximal oxygen intake and independence in old age. BRITISH JOURNAL OF
SPORTS MEDICINE. 2009;43:342-346.
95. Dubois D and Dubois EF. NUTRITION METABOLISM CLASSIC - A FORMULA TO
ESTIMATE THE APPROXIMATE SURFACE-AREA IF HEIGHT AND WEIGHT BE KNOWN
(REPRINTED FROM ARCHIVES INTERNAL MEDICINE, VOL 17, PG 863, 1916). NUTRITION.
1989;5:303-311.
96. Follmann D, Elliott P, Suh I and Cutler J. Variance imputation for overviews of clinical trials
with continuous response. Journal of Clinical Epidemiology. 1992;45:769-773.
97. Cohen J. A Power Primer. Psychological Bulletin. 1992;112:155-159.
98. Higgins JPT, Thompson SG, Deeks JJ and Altman DG. Measuring inconsistency in meta-
analyses. BMJ. 2003;327:557-560.
99. Gusso S, Pinto T, Baldi JC, Derraik JGB, Cutfield WS, Hornung T and Hofman PL. Exercise
Training Improves but Does Not Normalize Left Ventricular Systolic and Diastolic Function in Adole
scents With Type 1 Diabetes. DIABETES CARE. 2017;40:1264-1272.
48
2.1 i) Figure Legends:
2.1 i) i: Figure 1: A) Representative high resolution cMR images at rest (black circle), during exercise (yellow
square), immediately post-exercise (0-4 seconds, green triangle) and 60 seconds post-exercise
(red diamond). Left ventricular volumes were indexed to body surface area for determining LV
end-diastolic (B), end-systolic (C) and stroke volume (D) and multiplied by heart rate (E) to
generate cardiac index (I). LV cavity areas were measured from a mid-short-axis image
(papillary muscle level), and indexed to body surface area, for determination of end-diastolic (F)
and end-systolic (G) cavity areas. Ejection fraction (H) was calculated from the biplane volumes.
Data presented as mean and standard error: † indicates a statistically significant (p<0.05)
difference from rest, and ‡ from exercise.
2.1 i) ii: Figure 2: Pooled standardized mean difference (exercise-rest, [95% confidence interval] for left ventricular
end-diastolic (A), end-systolic (B), and stroke volume (C), and ejection fraction (D) from the
available exercise cMR studies. 1Values taken from graphical representations at moderate, and
2peak intensity exercise. 3Adolescent populations, with 4values taken from graphical
representations.
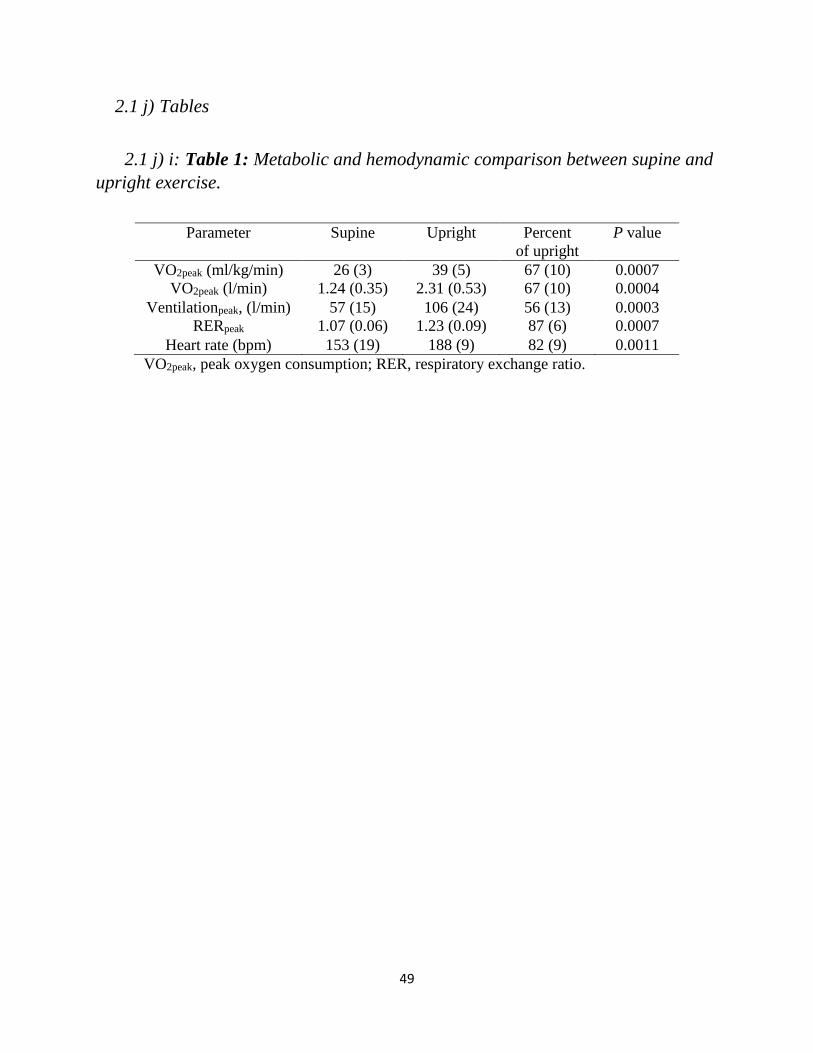
49
2.1 j) Tables
2.1 j) i: Table 1: Metabolic and hemodynamic comparison between supine and
upright exercise. Table 1: Metabolic and hemodynamic comparison between supine and upright exercise
Parameter Supine Upright Percent
of upright
P value
VO2peak (ml/kg/min) 26 (3) 39 (5) 67 (10) 0.0007
VO2peak (l/min) 1.24 (0.35) 2.31 (0.53) 67 (10) 0.0004
Ventilationpeak, (l/min) 57 (15) 106 (24) 56 (13) 0.0003
RERpeak 1.07 (0.06) 1.23 (0.09) 87 (6) 0.0007
Heart rate (bpm) 153 (19) 188 (9) 82 (9) 0.0011
VO2peak, peak oxygen consumption; RER, respiratory exchange ratio.

50
2.1 j) ii: Table 2: Characteristics of exercise cMRI studies reporting LV
volumes.
Table 2: Characteristics of exercise cMRI studies reporting LV Volumes
HR, heart rate; NR, not reported; SAX, short axis; LAX, long axis. *Sub-maximal data used
in meta-analysis, see Figure 2 legend.
Study n
(m/f)
Age Resting
HR
Image
HR
Exercise
Intensity
Field
Strength
Exercise Type Image Type
Present Study 3/5 25 (3) 67 (8) 115 (9) Sub-Max 3.0T Supine, Ergospect
CardioStepper
Gated, breath-hold,
SAX, Bi-plane
LAX
Claessen
2014(a)89
14/0 36 (6) 66 (7) 143 (7) Max* 1.5T
Supine, Lode MRI
cycle
Real-time free-
breathe SAX/LAX
stacks Claessen
2014(b)88
8/1 35
(12)
NR NR Max*
Claessen
201590
14/0 36
(15)
66 (7) 149 (11) Max
Gusso 201269 4/4 25 (4) 67 (15) 110 (3) Sub-Max 1.5T
Supine, Custom
MRI cycle
Gated breath-hold
SAX stack, 3 LAX Gusso 201291
(2017)100
10/12 17 (1) 71 (9) 109 (5) Sub-Max
La Gerche
201273
10/0 35 (9) 59 (14) 164 (10) Max* 1.5T Supine, Lode MRI
cycle
Real-time free-
breathe SAX/LAX
stacks
LaFountain
201668
5/5 26 (5) 62 (8) 166 (20) Max* 1.5T Upright, Custom
MRI treadmill
Ungated, free-
breathe SAX stack
and biplane LAX
slices
Lurz 200994 5/7 33
(29-
42)
74 (3) 154 (13) Max* 1.5T Supine, Lode MRI
cycle, flutter
kicking motion
Real-time free-
breathe SAX
stacks
Oosterhof
200578
8/6 27 (4) 66 (8) 121 (8) Sub-Max 1.5T Supine, Custom
MRI cycle
Turbo field echo
planar imaging
SAX stack
Pinto 201492 10/9 17 (2) 70 (10) 109 (4) Sub-Max 1.5T Supine, Custom
MRI cycle
Gated breath-hold
SAX stack, 3 LAX
Roest 200186
(2002)77
8/8 18 (2) 71 (10) 121 (14) Sub-Max 1.5T Supine, Custom
MRI ergometer
Gated breath-hold
SAX stack
Roest 200493 7/7 25 (5) 67 (8) 122 (8) Sub-Max
Schnell
2017(a)87
15/0 35 (8) 59 (12) 155 (18) Max 1.5T Supine, Lode MRI
cycle
Real-time free-
breathe SAX/LAX
stacks Schnell
2017(b)87
12/3 35
(14)
66 (7) 150 (12) Max
Steding-
Ehrenborg
201375
20/6 30 (8) 60 (11) 94 (13) Sub-Max 1.5T Supine, Custom
MRI ergometer
Gated breath-hold
SAX stack and
LAX slice

51
2.1 j) iii: Table 3. Effect size, significance, and heterogeneity for pooled
analyses. Table 3: Meta-Analysis effect size, significance and heterogeneity
A. Measure n
(comparisons)
SMD
[95% CI]
Significance
(H0:SMD = 0)
Q
p-value
I2
(%)
EDV 16 -0.14 [-0.31, 0.04] 0.13 1.00 0
ESV 16 -1.18 [-1.42, -0.95] <0.0001 0.005 41
SV 16 0.87 [0.64, 1.09] <0.0001 0.006 50
EF 15 1.75 [1.48, 2.03] <0.0001 0.006 26
B. WMD (H0:WMD = 0)
EDV (ml) 11 -0.33 [-0.61, -0.06] 0.027 0.18 28
ESV (ml) 11 -3.51 [-4.11, -2.91] <0.0001 <0.0001 75
SV (ml) 11 3.86 [3.07, 4.65] <0.0001 <0.0001 91
EF (%) 15 6.12 [5.26, 6.98] <0.0001 0.005 95
SMD, standardized mean difference; WMD, weighted mean difference; 95% CI, 95% confidence
intervals; EDV, end-diastolic volume; ESV, end-systolic volume; SV, stroke volume; EF,
ejection fraction. Note: SMD calculated by pooling EDV (ESV, SV) for studies reporting
measures in ml, ml/m2 (BSA normalized) and ml/kg (normalized to fat free mass). WMD
calculated by pooling studies reporting EDV (ESV, SV) in ml.
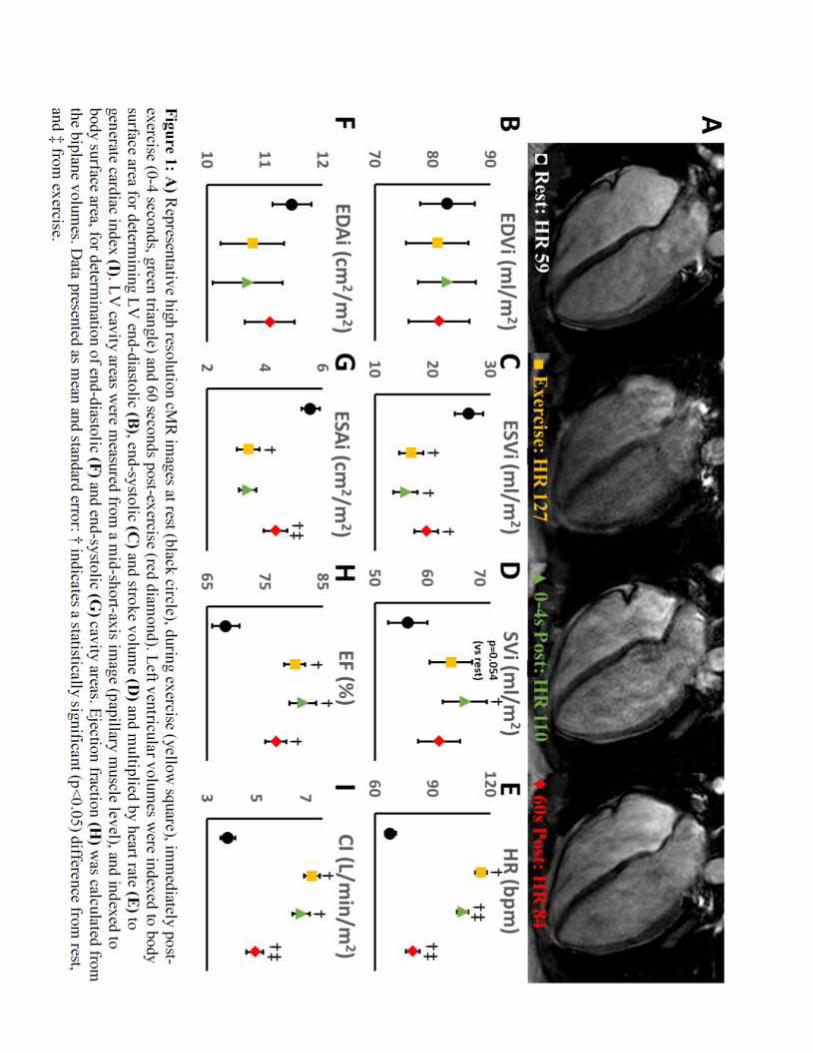
52
2.1 k) Figures
Figure 1: cMRI Images and Results

53
Figure 2: Meta-Analysis Results

54
3.1 Determinants of Exercise Intolerance in Breast Cancer Patients Prior to
Anthracycline Chemotherapy
Rhys I. Beaudrya, Erin J. Howdenb, Steve Foulkesb,c, Ashley Bigaranb,d, Mark J. Haykowskya,b*,
Andre La Gercheb,e* Determinants of exercise intolerance in breast cancer patients prior to
anthracycline chemotherapy. Physiol Rep. 2019 7(1):e13971. doi: 10.14814/phy2.13971
*contributed equally as senior authors.
aIntegrated Cardiovascular Exercise Physiology and Rehabilitation Laboratory, College of
Nursing and Health Innovation, University of Texas at Arlington, Arlington, Texas, USA
bSports Cardiology Lab, Baker Heart and Diabetes Institute, Melbourne, Vic, Australia;
cSchool of Exercise & Nutrition Sciences, Deakin University Faculty of Health, Burwood, Vic,
Australia;
dExercise and Nutrition Research Program, Mary McKillop Institute for Health Research,
Australian Catholic University, Melbourne VIC, Australia.
eDepartment of Cardiology, St Vincent’s Hospital Melbourne, Fitzroy, Vic, Australia
Used with permission of the publisher, 2019.

55
3.1 a) Abstract
Background: Women with early stage breast cancer have reduced peak exercise oxygen uptake
(peak VO2). The purpose of this study was to evaluate peak VO2 and right (RV) and left (LV)
ventricular function prior to adjuvant chemotherapy.
Methods: Twenty-nine early stage breast cancer patients (mean age: 48 years) and 10 age-
matched healthy women were studied. Participants performed an upright cycle exercise test with
expired gas analysis to measure peak VO2. RV and LV volumes and function were measured at
rest, sub-maximal and peak supine cycle exercise using cardiac magnetic resonance imaging.
Results: Peak VO2 was significantly lower in breast cancer patients versus controls (1.70.4 vs.
2.30.5 l/min, p=0.0013; 256 vs. 356 ml/kg/min, p=0.00009). No significant difference was
found between groups for peak upright exercise heart rate (17413 vs. 16916 bpm, p=0.39).
Rest, sub-maximal and peak exercise RV and LV end-diastolic and end-systolic volume index,
stroke index, and cardiac index were significantly lower in breast cancer patients versus controls
(p<0.05 for all). No significant difference was found between groups for rest and exercise RV
and LV ejection fraction.
Conclusion: Despite preserved RV and LV ejection fraction, the decreased peak VO2 in early
stage breast cancer patients prior to adjuvant chemotherapy is due in part to decreased peak
cardiac index secondary to reductions in RV and LV end-diastolic volumes.
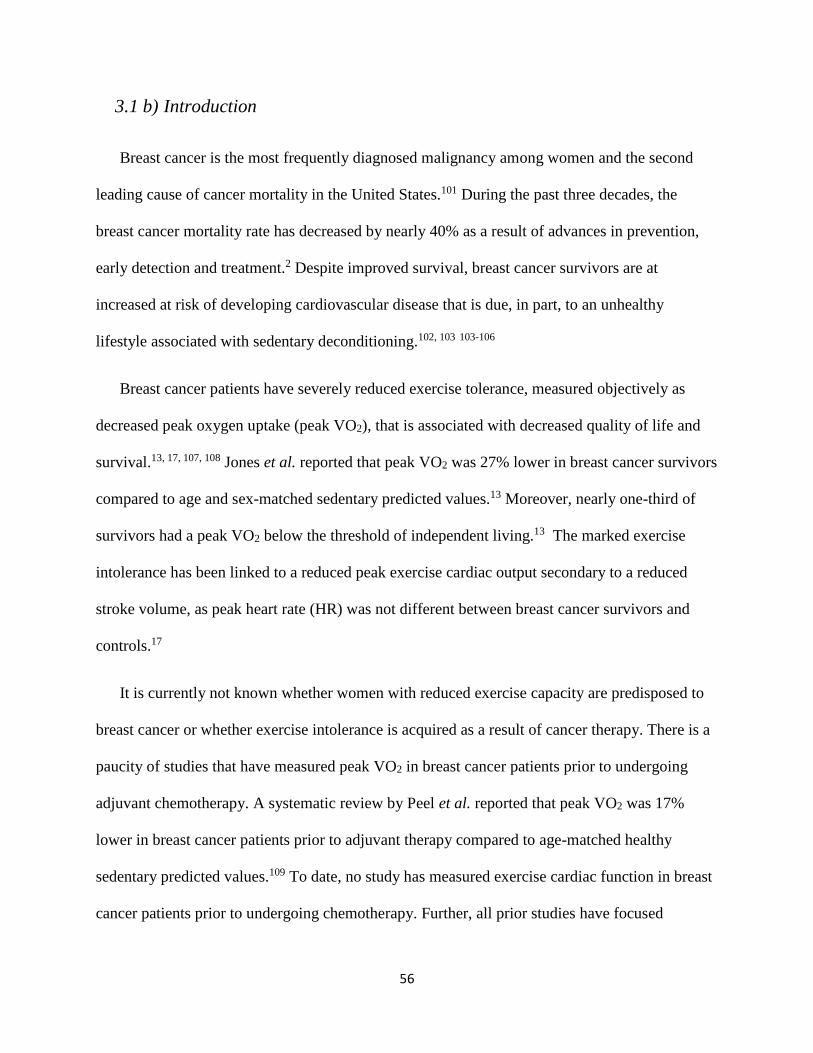
56
3.1 b) Introduction
Breast cancer is the most frequently diagnosed malignancy among women and the second
leading cause of cancer mortality in the United States.101 During the past three decades, the
breast cancer mortality rate has decreased by nearly 40% as a result of advances in prevention,
early detection and treatment.2 Despite improved survival, breast cancer survivors are at
increased at risk of developing cardiovascular disease that is due, in part, to an unhealthy
lifestyle associated with sedentary deconditioning.102, 103 103-106
Breast cancer patients have severely reduced exercise tolerance, measured objectively as
decreased peak oxygen uptake (peak VO2), that is associated with decreased quality of life and
survival.13, 17, 107, 108 Jones et al. reported that peak VO2 was 27% lower in breast cancer survivors
compared to age and sex-matched sedentary predicted values.13 Moreover, nearly one-third of
survivors had a peak VO2 below the threshold of independent living.13 The marked exercise
intolerance has been linked to a reduced peak exercise cardiac output secondary to a reduced
stroke volume, as peak heart rate (HR) was not different between breast cancer survivors and
controls.17
It is currently not known whether women with reduced exercise capacity are predisposed to
breast cancer or whether exercise intolerance is acquired as a result of cancer therapy. There is a
paucity of studies that have measured peak VO2 in breast cancer patients prior to undergoing
adjuvant chemotherapy. A systematic review by Peel et al. reported that peak VO2 was 17%
lower in breast cancer patients prior to adjuvant therapy compared to age-matched healthy
sedentary predicted values.109 To date, no study has measured exercise cardiac function in breast
cancer patients prior to undergoing chemotherapy. Further, all prior studies have focused

57
primarily on left ventricular (LV) function, therefore uncertainty remains regarding right
ventricular (RV) performance during exercise. Given this uncertainty, the aim of this study was
to test the hypothesis that the impaired peak VO2 in breast cancer patients prior to adjuvant
chemotherapy is attributable to decreased exercise cardiac output despite preserved RV and LV
ejection fraction.
3.1 c) Methods
3.1 c) i: Subjects
Women aged 18 to 70 years with newly diagnosed, histologically confirmed early stage
breast cancer scheduled for anthracycline-based chemotherapy were recruited via collaborating
breast surgeons and oncologists from local hospitals in the Melbourne metropolitan area. Patients
with structural heart disease, sustained cardiac arrhythmias, or a contraindication to cardiac
magnetic resonance imaging were excluded. Age and sex matched control subjects were
recruited from an advertisement to staff of the Baker Heart and Diabetes Institute and the wider
community. Volunteers involved in competitive sport or enrolled in a structured exercise training
program were excluded.
3.1 c) ii: Protocol overview
The study protocol was approved by the Alfred Health Institutional Review Board and
written informed consent was obtained from all subjects. Breast cancer patients performed all
tests prior to anthracycline treatment.

58
3.1 c) iii: Cardiopulmonary Exercise Testing
Incremental exercise testing was performed on an electronically braked upright cycle
ergometer (Lode, Gronigen, Netherlands) with an initial power output of 10-25 watts (W) and
was progressed by 10-30W per minute until volitional exhaustion. Expired gas analysis was
performed using a commercially available metabolic measurement system (True One 2400,
Parvomedics, UT, USA), with the highest value obtained over 30 seconds used as the peak VO2
value. HR was continuously measured (1200W RF Wireless System, Norav, FL, USA) while
blood pressure (Suntech, Tango, NC, USA) was measured every 2 minutes during exercise.
3.1 c) iv: Biochemistry
Peripheral venous blood samples were taken 10 minutes after completion of exercise cardiac
magnetic resonance (cMRI) testing to measure B-type natriuretic peptide (BNP) and troponin I.
Hemoglobin values were obtained from patient medical records.
3.1 c) v: Rest and exercise cardiac magnetic resonance imaging cMRI.
Cardiac images were acquired with a Siemens MAGNETOM Prisma 3T scanner with a 5-
element phased-array coil (Siemens, MAGNETOM Prisma). Ungated, real-time, steady-state
free-precession cine imaging was performed without cardiac/respiratory gating. Forty to 75
consecutive frames were acquired every 36-38 milliseconds at each of 13-18 contiguous 8-mm
slices in the short-axis (SAX) plane, and 50 consecutive frames were acquired at approximately
the same temporal resolution for 11-15 contiguous 8-mm slices in the horizontal long axis (HLA)
plane. Scan duration was approximated to include one full respiratory cycle per slice (~120 and

59
~90 seconds at rest for SAX and HLA planes respectively, ~4-7 heart beats/slice) for gating of
cardiac translation.73
RV and LV volumes were generated by manually tracing the endocardium in the SAX plane
and using the disk summation method.73 To minimize cardiac translation error, contours were
traced in end diastole and end systole for each slice manually gated to respiration. SAX contour
transection points with the HLA plane were displayed for referencing of the atrioventricular
valve plane. Trabeculations and papillary muscles were considered part of the ventricular blood
pools. HR was determined by generating an anatomical M-mode image from the SAX plane
stack. Cardiac index was calculated as the average of RV and LV stroke volume (index to body
surface area) multiplied by HR. Physiologic data was synchronized with images for offline data
analysis. Images were analyzed with RightVol (Right Volume Leuven, Leuven, Belgium), a
MatLab software adjunct.
After resting images were obtained, subjects cycled on a MRI compatible ergometer (MR
Ergometer Pedal, Lode, Groningen, Netherlands) at an intensity equal to 20%, 40% and 60% of
peak power output obtained during the upright incremental cycle exercise test. These workloads
will subsequently be referred to as rest and low, moderate, and peak intensity. Each stage of
exercise was maintained for ≈1 to 3 minutes; 30 seconds to 1 minute to achieve a physiological
steady-state and 1 to 2 minutes for image acquisition. We previously determined that 66% of the
peak power during upright cycling corresponded to peak exercise in a supine position.86
3.1 c) vi: Statistical Analysis

60
Comparison between groups for continuous variables was assessed using student t tests.
Pearson correlation was used to determine linear correlations between variables. Two-Way
ANOVA with post hoc Bonferroni testing was used to compare cardiac volumes and ejection
fraction at different exercise intensities. Unless otherwise stated, data are presented as mean
(standard deviation). A two-sided p value <0.05 was determined as significant. All statistical
analysis were performed with SPSS (version 24 IMB SPSS Statistics, Armonk, NY, USA)
statistics software.
3.1 d) Results
3.1 d) i: Participant characteristics
Twenty-nine women with early breast cancer and 10 age and sex-matched healthy
controls agreed to participate in this study. No significant difference was found between breast
cancer patients and healthy controls for age, height, weight, body mass index, body surface area,
hemoglobin, brain natriuretic peptide, or troponin I. However, body mass index tended to be
higher in the breast cancer group, as fewer healthy control subjects were overweight, and none
were obese (Table 1). Fourteen and fifteen breast cancer patients were scheduled to receive
anthracyclines in a neoadjuvant and adjuvant setting respectively.
Cardiopulmonary exercise performance during upright cycle exercise
Peak exercise power output and VO2 were significantly lower in breast cancer patients
compared to healthy controls (38 21% and 29 17% lower respectively, Table 2). Peak
exercise systolic and diastolic blood pressure and HR were not significantly different between
groups. A sensitivity analysis was conducted to address the potential confounder of surgery prior

61
peak VO2 testing. Fifteen breast cancer patients who had undergone breast surgery (local
resection or mastectomy, scheduled for adjuvant chemotherapy) were compared with the 14
patients planned for surgery after chemotherapy (neo-adjuvant treatment strategy). No significant
difference was found between these groups for age, BMI, BSA, peak power output, VO2 (L/min
or ml/kg/min) or cardiac output (Data supplement).
3.1 d) ii: Cardiac volumes and index at rest, sub-maximal and peak supine
cycle exercise
Complete cMRI data was obtained in 26 of 29 breast cancer patients (one subject withdrew
from the study prior to cMRI testing, HR could not be measured accurately during peak exercise
in one subject- volumes, but not peak cardiac output, are included- one image set was excluded
due to artifact) and 10 healthy controls.
No significant difference was found between groups for rest, sub-maximal and maximal RV
and LV ejection fraction. A significant main group effect was found for RV and LV end-diastolic
volume index, end-systolic volume index, stroke index and cardiac index with values being
lower in breast cancer patients compared to controls (Figures 1 to 3). A significant main
(exercise) intensity effect was found for RV and LV stroke index and ejection fraction being
higher while RV and LV end-systolic volume index were lower during exercise compared to rest
in both breast cancer and controls (Figures 1-3). A significant group by intensity interaction was
found for cardiac index with breast cancer patients having lower values during sub-maximal and
peak exercise compared to controls. Finally, a significant positive relationship was found
between peak VO2 and cardiac output (Figure 4).

62
3.1 e) Discussion
Consistent with limited prior data, we confirmed that, relative to healthy age-matched
controls, women with breast cancer had reduced exercise capacity prior to cancer therapy. We
extend prior research by examining the cardiac mechanisms underpinning this exercise
impairment by comparing changes in RV and LV volumes measured during peak supine cycle
exercise. The principal new finding was that the reduced peak VO2 in breast cancer patients
versus healthy controls was due, in part, to a reduced maximal cardiac index. In turn, the reduced
peak exercise cardiac index was due to a reduced RV and LV stroke index and end-diastolic
volume index as no significant difference was found between groups for RV and LV ejection
fraction.
The mechanisms responsible for reduced biventricular end-diastolic volumes prior to
adjuvant chemotherapy were not studied, however, sedentary aging may play a role. Bhella et al.
(2014) have shown that life-long sedentary (exercise <2 times per week) and casual exercisers
(exercise 2-3 times per week) have lower peak oxygen uptake, LV mass and LV distensibility
than those who exercise >3 times per week.110 Despite increased LV stiffness, less active
individuals did not have impaired systolic impairment or abnormalities, closely mirrored by our
findings.110 One plausible explanation for our finding of lower functional capacity in breast
cancer patients is sedentary deconditioning due to reduced mobility and physical activity
following surgery. However, when we compared patients who had undergone surgery versus
those who had not received any treatment (surgery, chemotherapy or radiation), no difference in
peak VO2 was observed. This null finding is not inconsistent with patient surveys; patients were
referred to the study after surgical recovery and had returned to baseline based on subjective self-
report of symptoms. Accordingly, such a substantial decrement in peak VO2 and ventricular end-
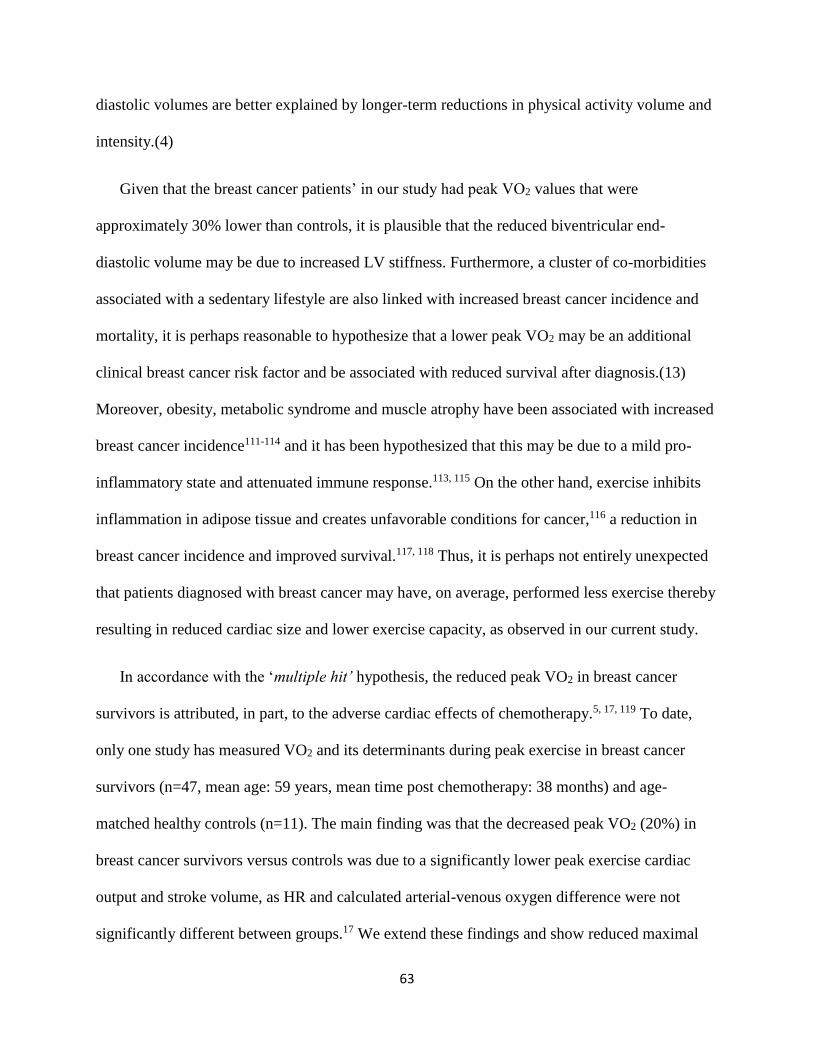
63
diastolic volumes are better explained by longer-term reductions in physical activity volume and
intensity.(4)
Given that the breast cancer patients’ in our study had peak VO2 values that were
approximately 30% lower than controls, it is plausible that the reduced biventricular end-
diastolic volume may be due to increased LV stiffness. Furthermore, a cluster of co-morbidities
associated with a sedentary lifestyle are also linked with increased breast cancer incidence and
mortality, it is perhaps reasonable to hypothesize that a lower peak VO2 may be an additional
clinical breast cancer risk factor and be associated with reduced survival after diagnosis.(13)
Moreover, obesity, metabolic syndrome and muscle atrophy have been associated with increased
breast cancer incidence111-114 and it has been hypothesized that this may be due to a mild pro-
inflammatory state and attenuated immune response.113, 115 On the other hand, exercise inhibits
inflammation in adipose tissue and creates unfavorable conditions for cancer,116 a reduction in
breast cancer incidence and improved survival.117, 118 Thus, it is perhaps not entirely unexpected
that patients diagnosed with breast cancer may have, on average, performed less exercise thereby
resulting in reduced cardiac size and lower exercise capacity, as observed in our current study.
In accordance with the ‘multiple hit’ hypothesis, the reduced peak VO2 in breast cancer
survivors is attributed, in part, to the adverse cardiac effects of chemotherapy.5, 17, 119 To date,
only one study has measured VO2 and its determinants during peak exercise in breast cancer
survivors (n=47, mean age: 59 years, mean time post chemotherapy: 38 months) and age-
matched healthy controls (n=11). The main finding was that the decreased peak VO2 (20%) in
breast cancer survivors versus controls was due to a significantly lower peak exercise cardiac
output and stroke volume, as HR and calculated arterial-venous oxygen difference were not
significantly different between groups.17 We extend these findings and show reduced maximal
64
exercise cardiac output and peak VO2 prior to undergoing chemotherapy. Importantly, our
finding that 45% of the variance in peak VO2 was explained by cardiac output (Figure 4)
suggests that non-cardiac, peripheral factors (eg, muscle blood flow and/or O2 extraction) also
play an important role in limiting peak VO2 prior to adjuvant chemotherapy.
3.1 e) i: Clinical Implications
Given that peak VO2 declines by 10% after 12 weeks of chemotherapy (equal to what is
observed after a decade of sedentary aging),120 our finding that breast cancer patients have
marked exercise intolerance and impaired exercise cardiac output (and likely impaired peripheral
determinants) reserve prior to adjuvant chemotherapy, suggests that interventions that attenuate
the decline in peak VO2 may be an important target of therapy. Indeed, exercise training is an
effective therapy to improve peak VO2 during adjuvant chemotherapy;107 however, the optimal
exercise training program and mechanisms responsible for this favorable adaptation remain
uncertain.121
3.1 e) ii: Limitations
A limitation of this study was that peak VO2 testing was performed during upright exercise
while cardiac volumes were measured in the supine position, therefore the mechanisms
underpinning the reduced maximal cardiac output may differ between groups in the upright
position. However, this is unlikely as peak HR was not different between groups during peak
upright exercise. Also, breast cancer patients and healthy controls relied on a decrease in RV and
LV end-systolic volume to increase stroke index and ejection fraction from rest to peak exercise.
Given that breast cancer patients displayed evidence of sedentary aging, we contend that
65
biventricular end-diastolic volume would remain lower during upright exercise given this
remodeling pattern is associated with decreased cardiac distensibility.
3.1 f) Conclusion
Despite preserved rest, sub-maximal and peak exercise RV and LV ejection fraction, breast
cancer patients prior to adjuvant chemotherapy have marked exercise intolerance, related to
decreased maximal cardiac index, secondary to reduced RV and LV end-diastolic volume.
Peripheral, non-cardiac factors may also play a prominent role in limiting exercise tolerance
prior to adjuvant chemotherapy. Accordingly, interventions that improve cardiovascular and
skeletal muscle function, such as exercise training, initiated at the time of diagnosis may
attenuate the decline in peak VO2 that occurs during adjuvant chemotherapy.

66
3.1 g) References
2. American Cancer Society. Cancer treatment & survivorship: facts & figures 2015-2016. Online.
2017;February 5, 2017:https://www.cancer.org/cancer/breast-cancer.html.
5. Jones LW, Haykowsky MJ, Swartz JJ, Douglas PS and Mackey JR. Early Breast Cancer Therapy
and Cardiovascular Injury. Journal of the American College of Cardiology. 2007;50:1435-1441.
13. Jones LW, Courneya KS, Mackey JR, Muss HB, Pituskin EN, Scott JM, Hornsby WE, Coan AD,
Herndon JE, Douglas PS and Haykowsky M. Cardiopulmonary Function and Age-Related Decline
Across the Breast Cancer Survivorship Continuum. JOURNAL OF CLINICAL ONCOLOGY.
2012;30:2530-2537.
17. Jones LW, Haykowsky M, Pituskin EN, Jendzjowsky NG, Tomczak CR, Haennel RG and
Mackey JR. Cardiovascular reserve and risk profile of postmenopausal women after chemoendocrine
therapy for hormone receptor - Positive operable breast cancer. ONCOLOGIST. 2007;12:1156-1164.
39. Picano EMDP, Pibarot PMDP, Lancellotti PMDP, Monin JLMDP and Bonow ROMD. The
Emerging Role of Exercise Testing and Stress Echocardiography in Valvular Heart Disease. JACC
(Journal of the American College of Cardiology). 2009;54:2251-2260.
40. Sicari R, Nihoyannopoulos P, Evangelista A, Kasprzak J, Lancellotti P, Poldermans D, Voigt J-U,
Zamorano JL, European Association of E and on behalf of the European Association of E. Stress
Echocardiography Expert Consensus Statement--Executive Summary: European Association of
Echocardiography (EAE) (a registered branch of the ESC). 2009;30:278-289.
41. Pellikka PAMD, Nagueh SFMD, Elhendy AAMDP, Kuehl CAR, Sawada SGMD and American
Society of E. American Society of Echocardiography Recommendations for Performance, Interpretation,
and Application of Stress Echocardiography. Journal of the American Society of Echocardiography.
2007;20:1021-1041.
42. Gibbons RJ, Balady GJ, Bricker JT, Chaitman BR, Fletcher GF, Froelicher VF, Mark DB,
McCallister BD, Mooss AN, O'Reilly MG, Winters WL, Antman EM, Alpert JS, Faxon DP, Fuster V,
Gregoratos G, Hiratzka LF, Jacobs AK, Russell RO, Smith SC and American College of
Cardiology/American Heart Association Task Force on Practice G. ACC/AHA 2002 guideline update for
exercise testing: Summary article - A report of the American College of Cardiology/American Heart
Association Task Force on Practice Guidelines (Committee to Update the 1997 Exercise Testing
Guidelines). CIRCULATION. 2002;106:1883-1892.
43. Fowler-Brown A, Pignone M, Pletcher M, Tice JA, Sutton SF, Lohr KN and Force USPST.
Exercise tolerance testing to screen for coronary heart disease: a systematic review for the technical
support for the U.S. Preventive Services Task Force. Annals of internal medicine. 2004;140:W9.
44. Balady GJ, Arena R, Sietsema K, Myers J, Coke L, Fletcher GF, Forman D, Franklin B, Guazzi
M, Gulati M, Keteyian SJ, Lavie CJ, Macko R, Mancini D, Milani RV, Amer Heart Assoc Exercise C,
Interdisciplinary Council Q, Council Peripheral Vasc D, Council Epidemiology P, American Heart
Association Exercise CR, Prevention Committee of the Council on Clinical C, Council on Peripheral
Vascular D, Interdisciplinary Council on Quality of C, Outcomes R, Council on E, Prevention, on behalf
of the American Heart Association Exercise CR and Prevention Committee of the Council on Clinical C.
Clinician's Guide to Cardiopulmonary Exercise Testing in Adults A Scientific Statement From the
American Heart Association. CIRCULATION. 2010;122:191-225.
45. Fletcher GF, Ades PA, Kligfield P, Arena R, Balady GJ, Bittner VA, Coke LA, Fleg JL, Forman
DE, Gerber TC, Gulati M, Madan K, Rhodes J, Thompson PD, Williams MA, Council Cardiovasc Stroke
N, Amer Heart A, Council Nutr Phys Activity M, Council Epidemiology P, Council Clinical C, American
Heart Association Exercise CR, Prevention Committee of the Council on Clinical Cardiology CoNPA,
Metabolism CoC, Stroke N, Council on E and Prevention. Exercise Standards for Testing and Training: A
Scientific Statement From the American Heart Association. Circulation. 2013;128:873-934.

67
46. Banerjee A, Newman DR, Van den Bruel A and Heneghan C. Diagnostic accuracy of exercise
stress testing for coronary artery disease: a systematic review and meta‐analysis of prospective studies.
International Journal of Clinical Practice. 2012;66:477-492.
47. Metz LD, Beattie M, Hom R, Redberg RF, Grady D and Fleischmann KE. The Prognostic Value
of Normal Exercise Myocardial Perfusion Imaging and Exercise Echocardiography: A Meta-Analysis.
Journal of the American College of Cardiology. 2007;49:227.
48. Voilliot D and Lancellotti P. Exercise Testing and Stress Imaging in Mitral Valve Disease.
Current Treatment Options in Cardiovascular Medicine. 2017;19:1-11.
49. Henri CMD, Piérard LAMDP, Lancellotti PMDP, Mongeon F-PMD, Pibarot PDVMP and
Basmadjian AJMDM. Exercise Testing and Stress Imaging in Valvular Heart Disease. Canadian Journal
of Cardiology. 2014;30:1012-1026.
50. Jaarsma C, Leiner T, Bekkers SC, Crijns HJ, Wildberger JE, Nagel E, Nelemans PJ and Schalla
S. Diagnostic Performance of Noninvasive Myocardial Perfusion Imaging Using Single-Photon Emission
Computed Tomography, Cardiac Magnetic Resonance, and Positron Emission Tomography Imaging for
the Detection of Obstructive Coronary Artery Disease A Meta-Analysis. Journal of the American College
of Cardiology. 2012;59:1719-1728.
51. Fihn SDMDMPH, Gardin JMMD, Abrams JMD, Berra KMSNANP, Blankenship JCMD, Dallas
APMD, Douglas PSMD, Foody JMMD, Gerber TCMDP, Hinderliter ALMD, King SBMD, Kligfield
PDMD, Krumholz HMMD, Kwong RYKMD, Lim MJMD, Linderbaum JAMSCNPBC, Mack MJMD,
Munger MAP, Prager RLMD, Sabik JFMD, Shaw LJP, Sikkema JDMSNANPBC, Smith CRMD, Smith
SCMD, Spertus JAMDMPH and Williams SVMD. 2012 ACCF/AHA/ACP/AATS/PCNA/SCAI/STS
Guideline for the Diagnosis and Management of Patients With Stable Ischemic Heart Disease. JACC
(Journal of the American College of Cardiology). 2012;60:e44-e164.
52. Ferket BSMD, Genders TSSM, Colkesen EBMD, Visser JJMDP, Spronk SP, Steyerberg EWP
and Hunink MGMMDP. Systematic Review of Guidelines on Imaging of Asymptomatic Coronary Artery
Disease. JACC (Journal of the American College of Cardiology). 2011;57:1591-1600.
53. Demir OMM, Bashir AM, Marshall KB, Douglas MB, Wasan BM, Plein SP and Alfakih KMD.
Comparison of Clinical Efficacy and Cost of a Cardiac Imaging Strategy Versus a Traditional Exercise
Test Strategy for the Investigation of Patients With Suspected Stable Coronary Artery Disease. American
Journal of Cardiology, The. 2015;115:1631-1635.
54. Zellweger MJ, Fahrni G, Ritter M, Jeger RV, Wild D, Buser P, Kaiser C, Osswald S, Pfisterer
ME and Investigators B. Prognostic Value of "Routine" Cardiac Stress Imaging 5 Years After
Percutaneous Coronary Intervention The Prospective Long-Term Observational BASKET (Basel Stent
Kosteneffektivitats Trial) LATE IMAGING Study. JACC-CARDIOVASCULAR INTERVENTIONS.
2014;7:615-621.
55. Shah R, Heydari B, Coelho-Filho O, Murthy VL, Abbasi S, Feng JH, Pencina M, Neilan TG,
Meadows JL, Francis S, Blankstein R, Steigner M, di Carli M, Jerosch-Herold M and Kwong RY. Stress
Cardiac Magnetic Resonance Imaging Provides Effective Cardiac Risk Reclassification in Patients With
Known or Suspected Stable Coronary Artery Disease. Circulation. 2013;128:605-614.
56. Vick GW. The gold standard for noninvasive imaging in coronary heart disease: magnetic
resonance imaging. CURRENT OPINION IN CARDIOLOGY. 2009;24:567-579.
57. Rayoo R, Kearney L, Grewal J, Ord M, Lu K, Smith G and Srivastava P. Cardiac MRI:
Indications and Clinical Utility—A Single Centre Experience. Heart, Lung and Circulation.
2012;21:S191-S191.
58. Pesenti-Rossi D, Peyrou J, Baron N, Allouch P, Aubert S, Boueri Z and Livarek B. Cardiac MRI:
Technology, clinical applications, and future directions. ANNALES DE CARDIOLOGIE ET D
ANGEIOLOGIE. 2013;62:326-341.
59. Nabi F, Malaty A and Shah DJ. Stress cardiac magnetic resonance. CURRENT OPINION IN
CARDIOLOGY. 2011;26:385-391.
60. Thavendiranathan P, Dickerson JA, Scandling D, Balasubramanian V, Pennell ML, Hinton A,
Raman SV and Simonetti OP. Comparison of treadmill exercise stress cardiac MRI to stress
68
echocardiography in healthy volunteers for adequacy of left ventricular endocardial wall visualization: A
pilot study. Journal of Magnetic Resonance Imaging. 2014;39:1146-1152.
61. Jekic M, Foster EL, Ballinger MR, Raman SV and Simonetti OP. Cardiac function and
myocardial perfusion immediately following maximal treadmill exercise inside the MRI room. JOURNAL
OF CARDIOVASCULAR MAGNETIC RESONANCE. 2008;10:3-3.
62. Foster EL, Arnold JW, Jekic M, Bender JA, Balasubramanian V, Thavendiranathan P, Dickerson
JA, Raman SV and Simonetti OP. MR‐compatible treadmill for exercise stress cardiac magnetic
resonance imaging. Magnetic Resonance in Medicine. 2012;67:880-889.
63. Raman SV, Dickerson JA, Mazur W, Wong TC, Schelbert EB, Min JK, Scandling D, Bartone C,
Craft JT, Thavendiranathan P, Mazzaferri EL, Arnold JW, Gilkeson R and Simonetti OP. Diagnostic
Performance of Treadmill Exercise Cardiac Magnetic Resonance: The Prospective, Multicenter Exercise
CMR's Accuracy for Cardiovascular Stress Testing (EXACT) Trial. Journal of the American Heart
Association. 2016;5:e003811-n/a.
64. Abd-Elmoniem KZ, Sampath S, Osman NF and Prince JL. Real-Time Monitoring of Cardiac
Regional Function Using FastHARP MRI and Region-of-Interest Reconstruction. IEEE Transactions on
Biomedical Engineering. 2007;54:1650-1656.
65. Almeida-Morais L, Pereira-Da-Silva T, Branco L, Timoteo AT, Agapito A, de Sousa L, Oliveira
JA, Thomas B, Jalles-Tavares N, Soares R, Galrinho A and Cruz-Ferreira R. The value of right
ventricular longitudinal strain in the evaluation of adult patients with repaired tetralogy of Fallot: a new
tool for a contemporary challenge. CARDIOLOGY IN THE YOUNG. 2017;27:498-506.
66. Sukpraphrute B, Drafts BC, Rerkpattanapipat P, Morgan TM, Kirkman PM, Ntim WO, Hamilton
CA, Cockrum RL and Hundley WG. Prognostic utility of cardiovascular magnetic resonance upright
maximal treadmill exercise testing. JOURNAL OF CARDIOVASCULAR MAGNETIC RESONANCE.
2015;17:103.
67. Raman SV, Dickerson JA, Jekic M, Foster EL, Pennell ML, McCarthy B and Simonetti OP. Real-
time cine and myocardial perfusion with treadmill exercise stress cardiovascular magnetic resonance in
patients referred for stress SPECT. JOURNAL OF CARDIOVASCULAR MAGNETIC RESONANCE.
2010;12:41-41.
68. Lafountain RA, da Silveira JS, Varghese J, Mihai G, Scandling D, Craft J, Swain CB, Franco V,
Raman SV, Devor ST and Simonetti OP. Cardiopulmonary exercise testing in the MRI environment.
Physiological Measurement. 2016;37:N11-N25.
69. Gusso S, Salvador C, Hofman P, Cutfield W, Baldi JC, Taberner A and Nielsen P. Design and
testing of an MRI-compatible cycle ergometer for non-invasive cardiac assessments during exercise.
BIOMEDICAL ENGINEERING ONLINE. 2012;11:13-13.
70. Weber TF, von Tengg-Kobligk H, Kopp-Schneider A, Ley-Zaporozhan J, Kauczor H-U and Ley
S. High-resolution phase-contrast MRI of aortic and pulmonary blood flow during rest and physical
exercise using a MRI compatible bicycle ergometer. European Journal of Radiology. 2010;80:103-108.
71. Pflugi S, Roujol S, Akçakaya M, Kawaji K, Foppa M, Heydari B, Goddu B, Kissinger K, Berg S,
Manning WJ, Kozerke S and Nezafat R. Accelerated cardiac MR stress perfusion with radial sampling
after physical exercise with an MR‐compatible supine bicycle ergometer. Magnetic Resonance in
Medicine. 2015;74:384-395.
72. Le TT, Bryant JA, Ting AE, Ho PY, Su B, Teo RCC, Gan JSJ, Chung YC, O'Regan DP, Cook
SA and Chin CWL. Assessing exercise cardiac reserve using real-time cardiovascular magnetic
resonance. JOURNAL OF CARDIOVASCULAR MAGNETIC RESONANCE. 2017;19.
73. La Gerche A, Claessen G, Van de Bruaene A, Pattyn N, Van Cleemput J, Gewillig M, Bogaert J,
Dymarkowski S, Claus P and Heidbuchel H. Cardiac MRI A New Gold Standard for Ventricular Volume
Quantification During High-Intensity Exercise. CIRCULATION-CARDIOVASCULAR IMAGING.
2013;6:329-338.
74. Heiberg J, Asschenfeldt B, Maagaard M and Ringgaard S. Dynamic bicycle exercise to assess
cardiac output at multiple exercise levels during magnetic resonance imaging. CLINICAL IMAGING.
2017;46:102-107.

69
75. Steding-Ehrenborg K, Jablonowski R, Arvidsson PM, Carlsson M, Saltin B, Arheden H, Klinisk
fysiologi L, Department of Clinical P, Lund U and Lunds u. Moderate intensity supine exercise causes
decreased cardiac volumes and increased outer volume variations: a cardiovascular magnetic resonance
study. JOURNAL OF CARDIOVASCULAR MAGNETIC RESONANCE. 2013;15:96-96.
76. Asschenfeldt B, Heiberg J, Ringgaard S, Maagaard M, Redington A and Hjortdal VE. Impaired
cardiac output during exercise in adults operated for ventricular septal defect in childhood: a hitherto
unrecognised pathophysiological response. CARDIOLOGY IN THE YOUNG. 2017;27:1591-1598.
77. Roest AAW, Helbing WA, Kunz P, van den Aardweg JG, Lamb HJ, Vliegen HW, van der Wall
EE and de Roos A. Exercise MR imaging in the assessment of pulmonary regurgitation and biventricular
function in patients after tetralogy of Fallot repair. RADIOLOGY. 2002;223:204-211.
78. Oosterhof T, Tulevski II, Roest AAW, Steendijk P, Vliegen HW, van der Wall EE, de Roos A,
Tijssen JGP and Mulder BJM. Disparity between dobutamine stress and physical exercise magnetic
resonance imaging in patients with an intra-atrial correction for transposition of the great arteries. Journal
of cardiovascular magnetic resonance. 2005;7:383-389.
79. Bal-Theoleyre L, Lalande A, Kober F, Giorgi R, Collart F, Piquet P, Habib G, Avierinos JF,
Bernard M, Guye M and Jacquier A. Aortic Function's Adaptation in Response to Exercise-Induced
Stress Assessing by 1.5T MRI: A Pilot Study in Healthy Volunteers. PLOS ONE. 2016;11:e0157704.
80. Heiberg E, Pahlm-Webb U, Agarwal S, Bergvall E, Fransson H, Steding-Ehrenborg K, Carlsson
M, Arheden H, Klinisk fysiologi L, Department of Clinical P, Lund U and Lunds u. Longitudinal strain
from velocity encoded cardiovascular magnetic resonance: a validation study. JOURNAL OF
CARDIOVASCULAR MAGNETIC RESONANCE. 2013;15:15-15.
81. Globits S, Sakuma H, Shimakawa A, Foo TKF and Higgins CB. Measurement of Coronary Blood
Flow Velocity During Handgrip Exercise Using Breath-Hold Velocity Encoded Cine Magnetic
Resonance Imaging. The American Journal of Cardiology. 1997;79:234-237.
82. Sampath S, Derbyshire JA, Ledesma‐Carbayo MJ and McVeigh ER. Imaging left ventricular
tissue mechanics and hemodynamics during supine bicycle exercise using a combined tagging and phase‐contrast MRI pulse sequence. Magnetic Resonance in Medicine. 2011;65:51-59.
83. Nagaraj HM, Pednekar A, Corros C, Gupta H and Lloyd SG. Determining exercise‐induced blood
flow reserve in lower extremities using phase contrast MRI. Journal of Magnetic Resonance Imaging.
2008;27:1096-1102.
84. Tenforde AS, Cheng CP, Suh GY, Herfkens RJ, Dalman RL and Taylor CA. Quantifying In Vivo
Hemodynamic Response to Exercise in Patients With Intermittent Claudication and Abdominal Aortic
Aneurysms Using Cine Phase-Contrast MRI. JOURNAL OF MAGNETIC RESONANCE IMAGING.
2010;31:425-429.
85. Cheng CP, Herfkens RJ, Taylor CA and Feinstein JA. Proximal pulmonary artery blood flow
characteristics in healthy subjects measured in an upright posture using MRI: The effects of exercise and
age. Journal of Magnetic Resonance Imaging. 2005;21:752-758.
86. Roest AAW, Kunz P, Lamb HJ, Helbing WA, van der Wall EE and Roos Ad. Biventricular
response to supine physical exercise in young adults assessed with ultrafast magnetic resonance imaging.
The American Journal of Cardiology. 2001;87:601-605.
87. Schnell F, Claessen G, La Gerche A, Claus P, Bogaert J, Delcroix M, Carre F and Heidbuchel H.
Atrial volume and function during exercise in health and disease. JOURNAL OF CARDIOVASCULAR
MAGNETIC RESONANCE. 2017;19.
88. Claessen G, Claus P, Delcroix M, Bogaert J, La Gerche A and Heidbuchel H. Interaction between
respiration and right versus left ventricular volumes at rest and during exercise: a real-time cardiac
magnetic resonance study. AMERICAN JOURNAL OF PHYSIOLOGY-HEART AND CIRCULATORY
PHYSIOLOGY. 2014;306:H816-H824.
89. Claessen G, Claus P, Ghysels S, Vermeersch P, Dymarkowski S, La Gerche A and Heidbuchel H.
Right Ventricular Fatigue Developing during Endurance Exercise: An Exercise Cardiac Magnetic
Resonance Study. Medicine & Science in Sports & Exercise. 2014;46:1717-1726.

70
90. Claessen G, La Gerche A, Dymarkowski S, Claus P, Delcroix M and Heidbuchel H. Pulmonary
Vascular and Right Ventricular Reserve in Patients With Normalized Resting Hemodynamics After
Pulmonary Endarterectomy. JOURNAL OF THE AMERICAN HEART ASSOCIATION. 2015;4:e001602.
91. Gusso S, Pinto TE, Baldi JC, Robinson E, Cutfield WS and Hofman PL. Diastolic Function Is
Reduced in Adolescents With Type 1 Diabetes in Response to Exercise. DIABETES CARE.
2012;35:2089-2094.
92. Pinto TE, Gusso S, Hofman PL, Derraik JGB, Hornung TS, Cutfield WS and Baldi JC. Systolic
and Diastolic Abnormalities Reduce the Cardiac Response to Exercise in Adolescents With Type 2
Diabetes. DIABETES CARE. 2014;37:1439-1446.
93. Roest AAW, Lamb HJ, van der Wall EE, Vliegen HW, van den Aardweg JG, Kunz P, de Roos A
and Helbing WA. Cardiovascular response to physical exercise in adult patients after atrial correction for
transposition of the great arteries assessed with magnetic resonance imaging. HEART. 2004;90:678-684.
94. Lurz P, Muthurangu V, Schievano S, Nordmeyer J, Bonhoeffer P, Taylor AM and Hansen MS.
Feasibility and reproducibility of biventricular volumetric assessment of cardiac function during exercise
using real-time radial k-t SENSE magnetic resonance imaging. Journal of magnetic resonance imaging :
JMRI. 2009;29:1062.
95. Shephard RJ. Maximal oxygen intake and independence in old age. BRITISH JOURNAL OF
SPORTS MEDICINE. 2009;43:342-346.
96. Dubois D and Dubois EF. NUTRITION METABOLISM CLASSIC - A FORMULA TO
ESTIMATE THE APPROXIMATE SURFACE-AREA IF HEIGHT AND WEIGHT BE KNOWN
(REPRINTED FROM ARCHIVES INTERNAL MEDICINE, VOL 17, PG 863, 1916). NUTRITION.
1989;5:303-311.
97. Follmann D, Elliott P, Suh I and Cutler J. Variance imputation for overviews of clinical trials
with continuous response. Journal of Clinical Epidemiology. 1992;45:769-773.
98. Cohen J. A Power Primer. Psychological Bulletin. 1992;112:155-159.
99. Higgins JPT, Thompson SG, Deeks JJ and Altman DG. Measuring inconsistency in meta-
analyses. BMJ. 2003;327:557-560.
100. Gusso S, Pinto T, Baldi JC, Derraik JGB, Cutfield WS, Hornung T and Hofman PL. Exercise
Training Improves but Does Not Normalize Left Ventricular Systolic and Diastolic Function in
Adolescents With Type 1 Diabetes. DIABETES CARE. 2017;40:1264-1272.
101. Siegel RL, Miller KD and Jemal A. Cancer Statistics, 2017. CA: A Cancer Journal for Clinicians.
2017;67:7-30.
102. Armenian SH, Xu L, Ky B, Sun C, Farol LT, Pal SK, Douglas PS, Bhatia S and Chao C.
Cardiovascular Disease Among Survivors of Adult-Onset Cancer: A Community-Based Retrospective
Cohort Study. Journal of clinical oncology : official journal of the American Society of Clinical
Oncology. 2016;34:1122-30.
103. Park NJ, Chang YF, Bender C, Conley Y, Chlebowski RT, van Londen GJ, Foraker R,
Wassertheil-Smoller S, Stefanick ML and Kuller LH. Cardiovascular disease and mortality after breast
cancer in postmenopausal women: Results from the Women's Health Initiative. PLOS ONE.
2017;12:e0184174.
104. Bradshaw PT, Stevens J, Khankari N, Teitelbaum SL, Neugut AI and Gammon MD.
Cardiovascular Disease Mortality Among Breast Cancer Survivors. EPIDEMIOLOGY. 2016;27:6-13.
105. Patnaik JL, Byers T, DiGuiseppi C, Dabelea D and Denberg TD. Cardiovascular disease
competes with breast cancer as the leading cause of death for older females diagnosed with breast cancer:
a retrospective cohort study. BREAST CANCER RESEARCH. 2011;13:R64.
106. Chapman J-AW, Meng D, Shepherd L, Parulekar W, Ingle JN, Muss HB, Palmer M, Yu C and
Goss PE. Competing Causes of Death From a Randomized Trial of Extended Adjuvant Endocrine
Therapy for Breast Cancer. Journal of the National Cancer Institute. 2008;100:252-260.
107. Jones LW, Liang YY, Pituskin EN, Battaglini CL, Scott JM, Hornsby WE and Haykowsky M.
Effect of Exercise Training on Peak Oxygen Consumption in Patients with Cancer: A Meta-Analysis.
ONCOLOGIST. 2011;16:112-120.
71
108. McNeely ML, Campbell KL, Rowe BH, Klassen TP, Mackey JR and Courneya KS. Effects of
exercise on breast cancer patients and survivors: a systematic review and meta-analysis. Canadian
Medical Association Journal. 2006;175:34-41.
109. Peel AB, Thomas SM, Dittus K, Jones LW and Lakoski SG. Cardiorespiratory Fitness in Breast
Cancer Patients: A Call for Normative Values. JOURNAL OF THE AMERICAN HEART ASSOCIATION.
2014;3:e000432.
110. Bhella PS, Hastings JL, Fujimoto N, Shibata S, Carrick-Ranson G, Palmer MD, Boyd KN,
Adams-Huet B and Levine BD. Impact of Lifelong Exercise "Dose" on Left Ventricular Compliance and
Distensibility. JOURNAL OF THE AMERICAN COLLEGE OF CARDIOLOGY. 2014;64:1257-1266.
111. Guo W, Key TJ and Reeves GK. Adiposity and breast cancer risk in postmenopausal women:
Results from the UK Biobank prospective cohort. International journal of cancer. 2018.
112. Caan BJ, Cespedes Feliciano EM, Prado CM and et al. Association of muscle and adiposity
measured by computed tomography with survival in patients with nonmetastatic breast cancer. JAMA
Oncology. 2018.
113. Gathirua-Mwangi WG, Song Y, Monahan PO, Champion VL and Zollinger TW. Associations of
metabolic syndrome and C-reactive protein with mortality from total cancer, obesity-linked cancers and
breast cancer among women in NHANES III. International journal of cancer. 2018.
114. Bellocco R, Marrone G, Ye W, Nyren O, Adami HO, Mariosa D and Lagerros YT. A prospective
cohort study of the combined effects of physical activity and anthropometric measures on the risk of post-
menopausal breast cancer. European journal of epidemiology. 2016;31:395-404.
115. Khan S, Shukla S, Sinha S and Meeran SM. Role of adipokines and cytokines in obesity-
associated breast cancer: Therapeutic targets. Cytokine and Growth Factor Reviews. 2013;24:503-513.
116. Dieli-Conwright CM, Parmentier J-H, Sami N, Lee K, Spicer D, Mack WJ, Sattler F and
Mittelman SD. Adipose tissue inflammation in breast cancer survivors: effects of a 16-week combined
aerobic and resistance exercise training intervention. Breast Cancer Research and Treatment.
2018;168:147-157.
117. McTiernan A, Kooperberg C, White E, Wilcox S, Coates R, Adams-Campbell LL, Woods N,
Ockene J and Women's Health Initiative Cohort S. Recreational Physical Activity and the Risk of Breast
Cancer in Postmenopausal Women: The Women's Health Initiative Cohort Study. JAMA. 2003;290:1331-
1336.
118. Moore SC, Lee IM, Weiderpass E, Campbell PT, Sampson JN, Kitahara CM, Keadle SK, Arem
H, Berrington de Gonzalez A, Hartge P, Adami H-O, Blair CK, Borch KB, Boyd E, Check DP, Fournier
A, Freedman ND, Gunter M, Johannson M, Khaw K-T, Linet MS, Orsini N, Park Y, Riboli E, Robien K,
Schairer C, Sesso H, Spriggs M, Van Dusen R, Wolk A, Matthews CE, Patel AV, Medicinska f, Umeå u
and Enheten för b. Association of Leisure-Time Physical Activity With Risk of 26 Types of Cancer in
1.44 Million Adults. JAMA Internal Medicine. 2016;176:816-825.
119. Haykowsky M.J. BRI, Brothers R.M., Nelson M.D., Sarma S. Pathophysiology of exercise
intolerance in breast cancer survivors with preserved left ventricular ejection fraction. . Clinical Science.
2016;130:2239-2244.
120. Hornsby WE, Douglas PS, West MJ, Kenjale AA, Lane AR, Schwitzer ER, Ray KA, Herndon
JE, Coan A, Gutierrez A, Hornsby KP, Hamilton E, Wilke LG, Kimmick GG, Peppercorn JM and Jones
LW. Safety and efficacy of aerobic training in operable breast cancer patients receiving neoadjuvant
chemotherapy: A phase II randomized trial. Acta Oncologica. 2014;53:65-74.
121. Scott JM, Nilsen TS, Gupta D and Jones LW. Exercise Therapy and Cardiovascular Toxicity in
Cancer. 2018;137:1176-1191.

72
3.1 h) Figure Legends
3.1 h) i: Figure 1: Left ventricular end-diastolic volume index (A), end-systolic volume index (B), stroke index (C)
and ejection fraction (D) at rest, sub-maximal and maximal supine cycle exercise. *, Significant
main group (breast cancer vs. control) effect; †, Significant main intensity (low, moderate, and
peak exercise vs. rest).
3.1 h) ii: Figure 2: Right ventricular end-diastolic volume index (A), end-systolic volume index (B), stroke index
(C) and ejection fraction (D) at rest, sub-maximal and peak supine cycle exercise. *, Significant
main group (breast cancer vs. control) effect; †, Significant main intensity (low, moderate, and
peak exercise vs. rest).
3.1 h) iii: Figure 3: Heart rate and cardiac index at rest, sub-maximal and peak supine cycle exercise. *, Significant
main group (breast cancer vs. control) effect; †, Significant main intensity (low, moderate, and
peak exercise vs. rest); ‡, Significant group by intensity interaction.
3.1 h) iv: Figure 4: Relationship between peak VO2 (upright cycle exercise) and peak cardiac output (Q, supine
cycle exercise).
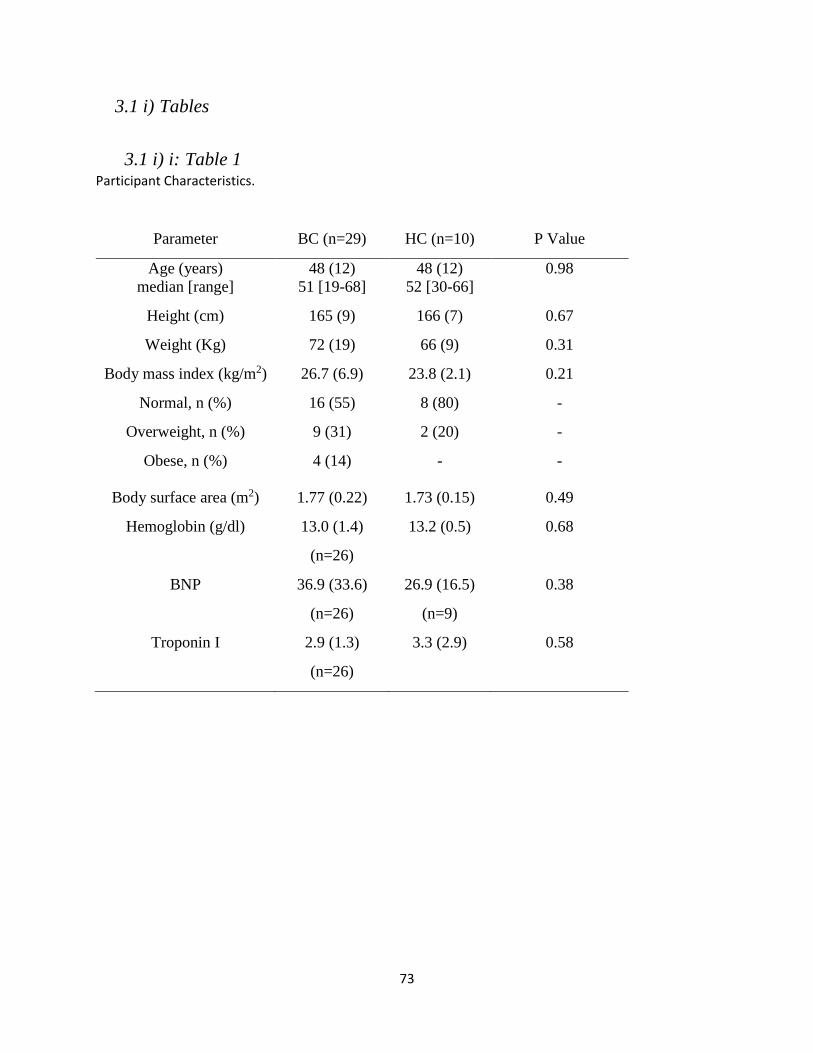
73
3.1 i) Tables
3.1 i) i: Table 1 Participant Characteristics.
Table 4: Participant Characteristics
Parameter BC (n=29) HC (n=10) P Value
Age (years)
median [range]
48 (12)
51 [19-68]
48 (12)
52 [30-66]
0.98
Height (cm) 165 (9) 166 (7) 0.67
Weight (Kg) 72 (19) 66 (9) 0.31
Body mass index (kg/m2) 26.7 (6.9) 23.8 (2.1) 0.21
Normal, n (%) 16 (55) 8 (80) -
Overweight, n (%) 9 (31) 2 (20) -
Obese, n (%) 4 (14) - -
Body surface area (m2) 1.77 (0.22) 1.73 (0.15) 0.49
Hemoglobin (g/dl) 13.0 (1.4)
(n=26)
13.2 (0.5) 0.68
BNP 36.9 (33.6)
(n=26)
26.9 (16.5)
(n=9)
0.38
Troponin I 2.9 (1.3)
(n=26)
3.3 (2.9) 0.58

74
3.1 i) ii: Table 2 Cardiopulmonary Exercise Performance during peak Upright Cycle Exercise
Table 5: Cardiopulmonary exercise performance during upright cycle exercise
Parameter Breast Cancer
(n=29)
Healthy Control
(n=10)
p Value
Power output (W) 142 (47) 228 (51) 0.00003
VO2 (l/min)
VO2 (ml/kg/min)
1.7 (0.4)
25 (6)
2.3 (0.5)
35 (6)
0.0013
0.00009
HR (bpm) 174 (13) 169 (16) 0.39
Systolic blood pressure (mmHg)
Diastolic blood pressure (mmHg)
185 (27)
93 (16)
180 (28)
84 (19)
0.83
0.18

75
3.1 j) Figures
3.1 j) i: Figure 1.
Figure 3: Left Ventricular Volumes; rest to peak exercise
Figure 1: Left ventricular end-diastolic volume index (A), end-systolic volume index (B), stroke
index (C) and ejection fraction (D) at rest, sub-maximal and maximal supine cycle exercise. *,
Significant main group (breast cancer vs. control) effect; †, Significant main intensity (low,
moderate, and peak exercise vs. rest).
Peak Peak
Peak Peak
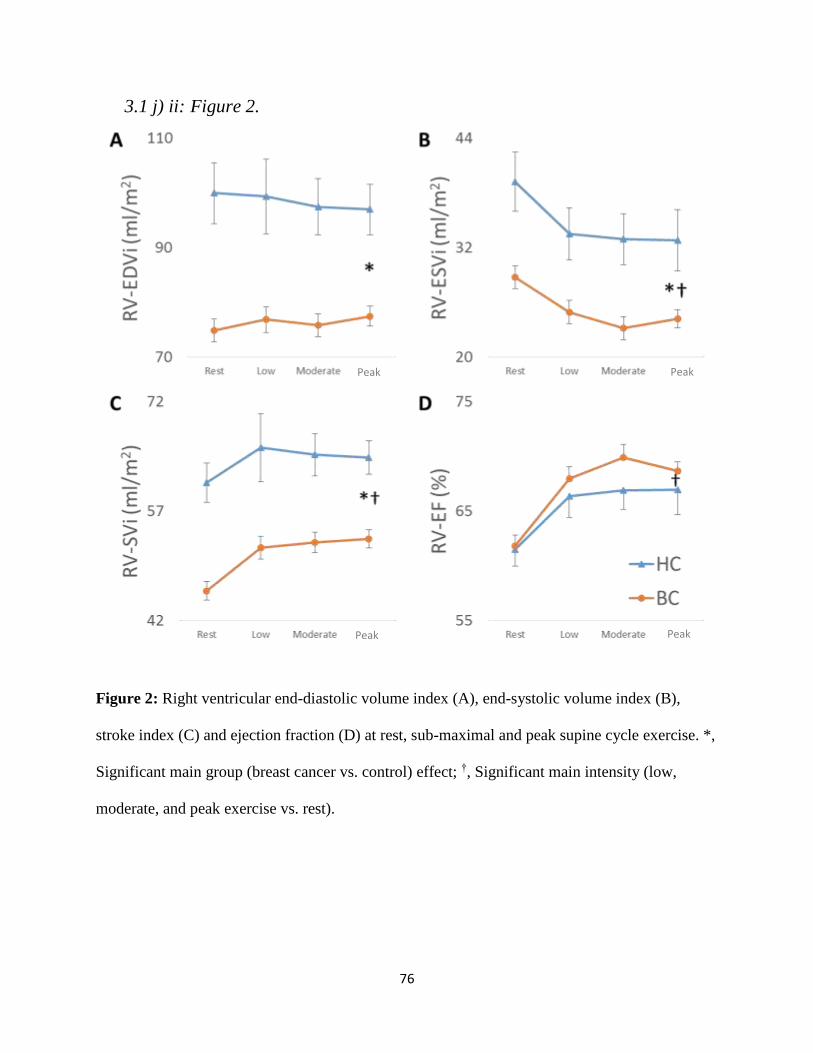
76
3.1 j) ii: Figure 2.
Figure 4: Right Ventricular Volumes; rest to peak exercise
Figure 2: Right ventricular end-diastolic volume index (A), end-systolic volume index (B),
stroke index (C) and ejection fraction (D) at rest, sub-maximal and peak supine cycle exercise. *,
Significant main group (breast cancer vs. control) effect; †, Significant main intensity (low,
moderate, and peak exercise vs. rest).
Peak
Peak Peak
Peak
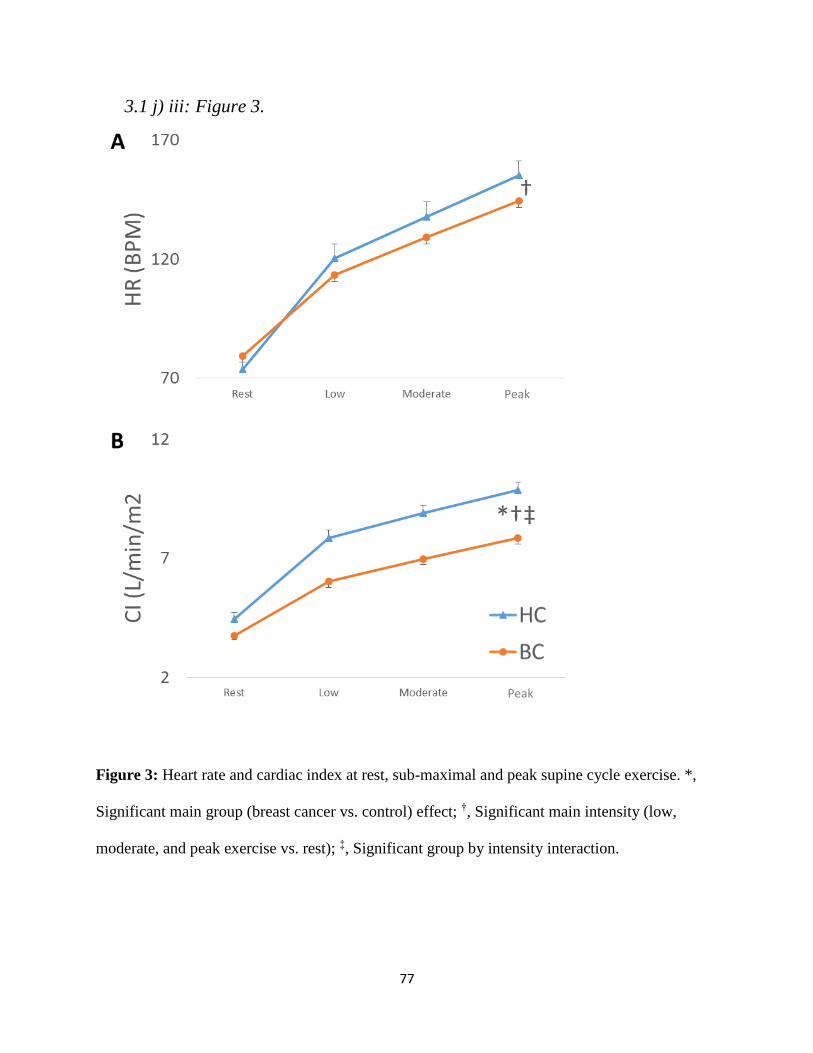
77
3.1 j) iii: Figure 3.
Figure 5: Heart Rate and Cardiac Index; rest to peak exercise
Figure 3: Heart rate and cardiac index at rest, sub-maximal and peak supine cycle exercise. *,
Significant main group (breast cancer vs. control) effect; †, Significant main intensity (low,
moderate, and peak exercise vs. rest); ‡, Significant group by intensity interaction.
Peak
Peak
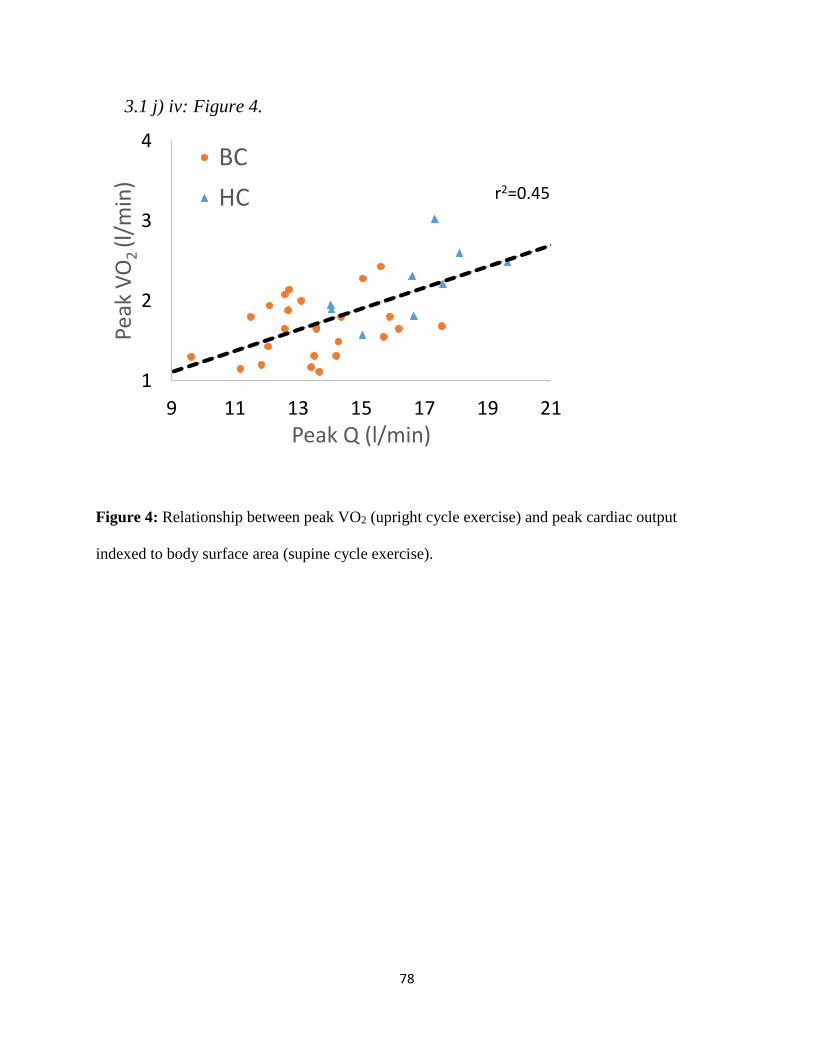
78
3.1 j) iv: Figure 4.
Figure 6: Peak Cardiac Output and Peak Oxygen Uptake
Figure 4: Relationship between peak VO2 (upright cycle exercise) and peak cardiac output
indexed to body surface area (supine cycle exercise).
1
2
3
4
9 11 13 15 17 19 21
Peak
VO
2 (l
/min
)
Peak Q (l/min)
BC
HC r2=0.45

4.1 Leg blood flow is preserved during small muscle mass exercise in long-term
survivors of anthracycline treated breast cancer.
80
4.1 a) Abstract: Background: Persistent anthracycline mediated cardiovascular damage to the periphery may
contribute to reduced exercise tolerance in women with a history of breast cancer (BC).
Methods: We evaluated the hemodynamic responses during submaximal single leg knee
extension (SLKE) exercise in 14 BC survivors (mean age: 61 ± 7 years; mean time post-
anthracycline therapy: 12 ± 6 years) and 9 age and sex-matched control (CON) subjects. Heart
rate (lead II), blood pressure (finger cuff pressure), leg (femoral artery) blood flow (Doppler
ultrasound), vascular conductance and pressure-strain were measured at rest, 25%, 50% and 75%
of maximal power output. Quadriceps mass was estimated from thigh volume and skinfold
measures.
Results: Estimated quadriceps mass was significantly lower in BC survivors compared to CON
(1803 ± 607 vs. 2601 ± 1101 g, p=0.04). No significant difference was found between groups for
maximal SLKE power output (28 ± 11 vs. 34 ± 17 Watts, p=0.33), heart rate (109 ± 14 vs. 103 ±
13 bpm, p=0.36) or mean arterial pressure (122 ± 18 vs. 119 ± 26 mmHg, p=0.33). Rest and sub-
maximal exercise mean arterial pressure, leg blood flow, leg conductance, pressure-strain were
not significantly different between groups.
Conclusion: Resting and sub-maximal exercise leg blood flow, conductance, and femoral artery
stiffness (pressure-strain) are not impaired in long-term survivors of anthracycline treated BC.
Increasing leg muscle mass may be an important target of interventions aimed at improving
cardiovascular health in BC survivors.
81
4.1 b) Introduction Advances in prevention, early detection and therapy have contributed to reduced breast
cancer (BC) mortality.122 As a result of improved survivorship, comorbid conditions compete
with BC as the leading cause of mortality.105 Specifically, BC survivors are at increased risk of
cardiovascular disease and heart failure that is attributed, in part, to the detrimental
cardiovascular effects of anthracycline therapy, including dose-limiting cardiotoxicity.6, 7
Cardiorespiratory fitness, measured as peak oxygen uptake (peak VO2) is the strongest
predictor of cardiovascular and all-cause mortality in healthy and clinical populations, and is
reduced in BC survivors by 20%.13, 15, 123, 124 While reduced peak VO2 is associated with reduced
peak cardiac output in BC, emerging evidence suggests that non-cardiac ‘peripheral’
mechanisms may also contribute to reduced exercise tolerance.16, 17, 19, 123, 124 Indeed, Howden et
al. recently reported that the reduced peak VO2 (15%) from pre to post-anthracycline therapy was
due to a decline in arterial-venous oxygen difference, as peak cardiac output did not change
during this time. Moreover, Chaosuwannakit et al. demonstrated that compared to baseline,
resting aortic distensibility decreased (54%) and aortic pulse wave velocity increased (95%) after
of 4-months of anthracycline chemotherapy in 40 cancer patients (BC, n=19) with no change in
age-and sex-matched controls.35 Mizia-Stec et al. extended these findings by demonstrating that
carotid artery stiffness increased from pre-to post anthracycline therapy in 35 BC patients.34
Finally, Didier and colleagues comparing cancer survivors (n=11, BC n=10, anthracycline
treated n=3) and age- and sex-matched controls (n=9) found that the former group had an
impaired muscle blood flow response to sub-maximal (20% of maximal voluntary contraction)
rhythmic hand-grip exercise.37

82
Taken together, the few studies performed to date suggest that vascular stiffening and
reduced muscle blood flow may contribute to the impaired exercise tolerance found in cancer
survivors. Currently, no study has examined whether blood flow to major locomotor muscle is
impaired, and if this impairment is related to arterial stiffening in BC survivors. Single leg knee
extension (SLKE) where the limiting role of the heart is minimized, has been used to identify
peripheral blood flow limitations to exercise in non-cancer populations (heart failure patients
with preserved or reduced ejection fraction) who have abnormal exercise cardiac function.125-127
Using SLKE exercise we tested the hypothesis that leg blood flow and vascular conductance
would be significantly reduced, and femoral artery stiffness would be significantly increased in
anthracycline treated BC survivors compared to age-and sex-matched controls (CON).
4.1 c) Methods:
4.1 c) i: Participants: Female BC survivors and CON were recruited from the local Dallas/Fort Worth community
via recruitment flyers and by word of mouth. Informed, written consent was obtained from all
subjects, and the study was approved by the University of Texas at Arlington Institutional
Review Board.
Breast cancer survivors had to have completed anthracycline chemotherapy more than 1 year
prior to study enrollment. Exclusion criteria for both groups were: orthopedic limitation to
exercise, resting blood pressure exceeding 160/100 mmHg for BC survivors or 140/90 mmHg for
CON, and inability to acquire a femoral artery ultrasound image of sufficient quality for analysis.
Additional exclusion criteria for control participants were presence of cardiovascular disease or
current cardio-active medication.
83
4.1 c) ii: Protocol Overview: Visit One: Physical activity and leg muscle mass: Participants self-reported their level of
physical activity (Stanford Leisure Time Activity Category Item) and medical history using a
researcher developed questionnaire.128 Height and weight were measured using a standiometer
and electronic scale, and thigh length, circumference (proximal, mid and distal) and skinfold
were measured using a flexible measuring tape and skinfold calipers to estimate quadriceps
muscle mass using a previously validated equation by Andersen and Saltin.129
Incremental SLKE exercise test: Participants were seated on a custom SLKE ergometer during
which time a finger blood pressure cuff (Finapress, AD Instruments, Australia) and ECG (lead
II) were continuously measured. An image of the right, common femoral artery was optimized
(landmarked at the femoral artery bifurication) using B-mode ultrasound. After optimization, a
duplex image was acquired, with the pulsed wave velocity sample volume positioned 2 cm
proximal to the femoral artery bifurication. The angle of insonation was limited to 60ᵒ, and the
sample volume was parallel to the artery walls. Two-minutes of resting duplex ultrasound were
recorded using a video capture device (Video Capture, Elgato, Germany) for offline analysis.
Participants were then familiarized with SLKE exercise. Specifically, they were instructed to
“kick” to a metronome set at 50 beats per minute, and to relax their leg entirely during rebound
driven by flywheel momentum. Once participants achieved a cadence of 50 revolutions per
minute, the resistance was increased to 10 watts (W) and then increased by 10 W every 2
minutes thereafter until volitional exhaustion or an inability to adhere to the pre-specified
cadence.
Visit Two: Peripheral hemodynamic responses during sub-maximal SLKE exercise: Participants
were instrumented as per Visit 1. After image optimization, 2 minutes of duplex ultrasound were

84
recorded, and then participants began their first sub-maximal SLKE power output. Workloads
were targeted to 25, 50 and 75% of the previously determined maximal power output. Each
workload was performed for 5 minutes with concomitant femoral artery imaging. Five minutes
of post-exercise recovery were recorded. Workloads were separated by 10 minutes of rest. In a
subset of participants, a third visit identical to Visit 2, was performed to test repeatability. The
average measures interclass correlation was 0.92 for femoral artery blood flow. Data from Visit 2
are reported.
4.1 c) iii: Measurements: Duplex ultrasound recordings were analyzed offline using automated edge detection
software (CardioSuite, Quipu, Italy). Femoral artery blood flow was calculated as: π(Dmean/2)2 x
V/60 when Dmean = femoral artery diameter in cm, V/60 = blood velocity in cm/min. Blood flow
during SLKE was calculated using a noise-free 30-60 second velocity average from the final 120
seconds of exercise (stable, steady state), and a 60 second diameter average from post-exercise
recovery. Data were cleaned to remove non-physiologic data-points and blood flow was
normalized to estimated quadriceps mass. Single leg vascular conductance was calculated as: leg
blood flow/mean arterial pressure where mean arterial pressure was averaged over the final
minute of each stage. Femoral artery stiffness was quantified as pressure-strain (Young’s elastic
modulus, E = K[pulse pressure]/strain) where strain = [Ddiastolic – Dsystolic]/Ddiastolic and K = 133.3
N/m2/mmHg, as previously described.130 Femoral artery systolic and diastolic diameters were
measured immediately upon exercise cessation (<20 seconds) using 3 independent cardiac cycles
within a 10 second window while pulse pressure was averaged over the same period.
4.1 c) iv: Statistical analysis: Continuous descriptive and outcome variables were compared between groups using
independent t-tests. In the case of non-parametric distribution of continuous variables (confirmed
85
by the Shapiro-Wilk test) or scale measures, the Mann Whitney U-test was used. A 2-way
repeated measures ANOVA was used to compare blood flow, pressure, conductance, heart rate,
and pressure-strain responses to SLKE. A Pearson’s correlation was used to test for a bivariate
relationship between femoral artery stiffness and blood flow. Data are presented as mean ±
standard deviation, significance was set at p<0.05.
4.1 d) Results:
4.1 d) i: Participants: Fifteen BC survivors and 11 age- and sex-matched CON were recruited to the study. One
participant from each group was excluded prior to Visit 2 with the post-hoc exclusion criterion of
the presence of an arterial branch superior to the femoral artery bifurcation resulting in an
atypical femoral artery blood velocity profile. One CON participant was excluded due to high
blood pressure. The BC survivors were on average 12 ± 6 years post anthracycline therapy, and
93% of participants received doxorubicin while 71% underwent radiation therapy and hormone
therapy each (Table 1). The BC and CON were well matched for age, body mass index and self-
reported physical activity. The BC survivors had a significantly lower estimated quadriceps mass
(1803 ± 607 vs. 2601 ± 1002 g, p=0.04) and quadriceps mass as a percent of body mass (2.6 ±
0.7 vs 3.6 ± 1.1 %, p=0.02) compared to CON.
4.1 d) ii: Incremental to maximal SLKE Exercise: Power output (BC: 28 ± 11 vs. CON: 34±17 W, p=0.35), heart rate (BC: 109 ± 14 vs. CON:
103 ± 13 bpm, p=0.36) and mean arterial pressure (BC: 122 ± 18 vs. CON: 119 ± 26 mmHg,
p=0.33) were not different between groups during maximal SLKE exercise (Figure 1, table 2).
4.1 d) iii: Peripheral hemodynamic at rest and sub-maximal SLKE Exercise: Resting heart rate, mean arterial pressure, leg blood flow and vascular conductance were
similar between BC and CON (Figure 1). Due to video-capture malfunction, duplex ultrasound
86
records were lost at the 50 and 75% submaximal workloads in one CON participant. As maximal
power was not different between groups, relative work rates at 25, 50 and 75% of maximal
SLKE exercise were similar between groups. Additionally, heart rate, mean arterial pressure and
leg vascular conductance were similar at rest and during submaximal exercise (Figure 1).
Femoral artery blood flow was not significantly different between groups at rest or during
submaximal exercise (Figure 1). Similarly, no group differences were found in femoral artery
strain (Wilks’ Lambda, p=0,216 for intensity effect) or pressure-strain at rest and immediately
following sub-maximal exercise (Figure 2). Leg blood flow, conductance, mean arterial pressure
and pressure-strain increased from rest to submaximal exercise (Figures 1, 2).
4.1 d) iv: Relationship between femoral artery stiffness and blood flow: No relationship was found between femoral artery blood flow and femoral artery stiffness as
measured as pressure-strain at rest, or immediately after 25, 50 or 75% of maximal SLKE (Table
3).
4.1 e) Discussion Breast cancer survivors have severely reduced exercise tolerance.109 Emerging evidence
suggests that anthracycline chemotherapy may be associated with peripheral dysfunction that
may contribute to decreased exercise tolerance.13, 17 The major new finding of this study was that
leg blood flow and conductance during sub-maximal SLKE exercise, where the limiting role of
the heart is minimized, was not significantly different between BC and age and sex-matched
CON. Further, to our knowledge we provide the first data on femoral artery stiffness at rest and
immediately following submaximal exercise in long-term survivors of anthracycline treated BC
and report no difference for this outcome between BC and CON.

87
4.1 e) i: Leg Blood Flow in Long-Term BC Survivors: Our finding of preserved leg blood flow during non-cardiac limited exercise is contrary to
findings from Didier et al. who reported that forearm blood flow was attenuated in 11 long-term
cancer survivors treated with adjuvant therapy (n=10 BC, mean age=56, mean 3 years post-
therapy).37 The attenuated blood flow was attributed to a blunted arterial blood pressure
response, secondary to impaired left ventricular ejection time index derived from an arterial
pressure waveform. In contrast, we found no differences in the heart rate or blood pressure
responses to exercise, and found a comparable blood flow response when indexed to 100 g of
muscle mass during moderate intensity exercise (25 and 50% of peak SLKE, figure 1). Further,
at the highest exercise intensity (75% of peak SLKE) we also did not unmask a leg blood flow
deficit in BC. The discrepancy in findings may be due to regional differences in muscle mass and
adiposity. Critically, we measured blood flow at the level of a conduit artery which supplies the
entire leg. Physiologic increases in blood flow should closely match metabolic demand;
however, blood may be delivered to vascular beds in close proximity resulting in normal
“muscle” blood flow. Metabolite spillover, conductive vasodilation and heat cause increased
blood flow to local tissues, including to adipose tissue adjacent to active muscle.131 Thus, given
that we observed reduced quadriceps mass but preserved leg conductance in BC compared to
controls, it is possible that blood flow was shunted through non-force producing tissue. In the
forearm, this effect may be minimized due to smaller active muscle mass, lower vascular
conductance, lower adiposity, and lower work rates producing fewer metabolites and less heat
spill over to non-force producing tissue.132
A consequence of blood flow shunting through less metabolically active tissue (inactive
muscle, adipose tissue, skin) is reduced oxygen uptake during whole body peak exercise. In heart
failure with preserved ejection fraction, a syndrome marked by extreme exercise intolerance, the

88
ratio of intermuscular fat to skeletal muscle is inversely related to peak oxygen uptake.30 This
physiologic relationship is explained by shunting of blood through intermuscular fat, resulting in
an impaired matching of cardiac output and peak VO2. In a study of 14 cancer survivors (mean
age 54 years, >12-months post-therapy) and 14 age- and sex-matched controls, the same effect
was observed whereby intermuscular fat was associated with reduced exercise capacity.29
Our findings demonstrate preserved leg blood flow in response to SLKE despite reduced
quadriceps mass in anthracycline treated BC survivors. Preserving or increasing muscle mass is
therefore an important target for interventions directed at increasing exercise tolerance in BC.
Dietary and exercise interventions have proven efficacy for reducing adiposity and preserving or
increasing muscle mass.133-136 Accordingly, favorable changes in body composition could
dramatically improve cardiorespiratory fitness through increasing efficiency of blood flow
delivery to active muscle, thus preventing progression of BC survivors towards a HFpEF-like
phenotype.
4.1 e) ii: Femoral Artery Stiffness in Long-Term BC Survivorship Vascular toxicity, specifically vascular stiffening, is a proposed mechanism of anthracycline
related decline in cardiovascular health.6 To our knowledge, only two studies have measured
conduit artery stiffness. Mizia-Stec et al. reported a decrease in common carotid artery
compliance from pre to post-anthracycline therapy (n=35, age: 50 years)34 while Koelwyn et al.
report no difference in common carotid artery compliance or distensibility (n=30, 6 years post
treatment, age: 61 years) compared to control subjects.19 Koelwyn et al. also reported impaired
ventricular-arterial coupling in anthracycline treated BC survivors under stress conditions (25, 50
and 75% of peak cycling work rate). Arterial elastance, estimated from echocardiography
derived cardiac volumes and brachial artery end-systolic blood pressures, was not impaired in
89
BC. Here, we measured arterial stiffness in a large conduit artery feeding major locomotor
muscle, and found no decrement in femoral artery pressure-strain. Importantly, pressure strain
was not impaired at rest, nor under conditions of increasing blood flow or pressure- consistent
with estimated arterial elastance as previously reported.19 Finally, we found no relationship
between leg blood flow and femoral artery pressure-strain (table 3). Therefore, stiffening of
conduit arteries does not appear to limit blood flow to major locomotor muscle during sub-
maximal SLKE where the limiting role of the heart is minimized.
4.1 e) iii: Limitations: A limitation of the study is that blood flow was measured in the common femoral artery,
rather than at the level of active muscle. While we have interpreted our findings in the context of
the available literature, it is unclear whether perturbations in blood flow delivery to active
muscle microvasculature exist, or whether muscle oxygen utilization is preserved in long term
survivors of anthracycline treated BC. To our knowledge, no data on mitochondrial function are
available, nor on active-muscle blood flow and diffusive oxygen conductance- two possible
contributors to exercise intolerance and functional disability.
4.1 e) iv: Conclusion: Leg blood flow, vascular conductance and arterial stiffness during sub-maximal SLKE
exercise are not significantly different between BC survivors treated with anthracycline
chemotherapy and age and sex-matched CON. Body composition (i.e. increasing lower extremity
muscle mass) may be an important target when tailoring dietary and exercise interventions to
improve cardiovascular health in long-term survivors of anthracycline treated BC.

90
4.1 f) References 6. Kirkham AA, Beaudry RI, Paterson DI, Mackey JR and Haykowsky MJ. Curing breast cancer
and killing the heart: A novel model to explain elevated cardiovascular disease and mortality risk among
women with early stage breast cancer. Prog Cardiovasc Dis. 2019.
7. McGowan JV, Chung R, Maulik A, Piotrowska I, Walker JM and Yellon DM. Anthracycline
Chemotherapy and Cardiotoxicity. Cardiovascular Drugs and Therapy. 2017;31:63-75.
13. Jones LW, Courneya KS, Mackey JR, Muss HB, Pituskin EN, Scott JM, Hornsby WE, Coan AD,
Herndon JE, Douglas PS and Haykowsky M. Cardiopulmonary Function and Age-Related Decline
Across the Breast Cancer Survivorship Continuum. JOURNAL OF CLINICAL ONCOLOGY.
2012;30:2530-2537.
15. Gulati M, Pandey DK, Arnsdorf MF, Lauderdale DS, Thisted RA, Wicklund RH, Al-Hani AJ and
Black HR. Exercise capacity and the risk of death in women - The St James Women Take Heart Project.
CIRCULATION. 2003;108:1554-1559.
16. Khouri MG, Hornsby WE, Risum N, Velazquez EJ, Thomas S, Lane A, Scott JM, Koelwyn GJ,
Herndon JE, Mackey JR, Douglas PS and Jones LW. Utility of 3-dimensional echocardiography, global
longitudinal strain, and exercise stress echocardiography to detect cardiac dysfunction in breast cancer
patients treated with doxorubicin-containing adjuvant therapy. Breast cancer research and treatment.
2014;143:531-539.
17. Jones LW, Haykowsky M, Pituskin EN, Jendzjowsky NG, Tomczak CR, Haennel RG and
Mackey JR. Cardiovascular reserve and risk profile of postmenopausal women after chemoendocrine
therapy for hormone receptor - Positive operable breast cancer. ONCOLOGIST. 2007;12:1156-1164.
19. Koelwyn GJ, Lewis NC, Ellard SL, Jones LW, Gelinas JC, Rolf JD, Melzer B, Thomas SM,
Douglas PS, Khouri MG and Eves ND. Ventricular-Arterial Coupling in Breast Cancer Patients After
Treatment With Anthracycline-Containing Adjuvant Chemotherapy. ONCOLOGIST. 2016;21:141-149.
29. Reding KW, Brubaker P, D’Agostino R, Kitzman DW, Nicklas B, Langford D, Grodesky M and
Hundley WG. Increased skeletal intermuscular fat is associated with reduced exercise capacity in cancer
survivors: a cross-sectional study. Cardio-Oncology. 2019;5:3.
30. Haykowsky MJ, Kouba EJ, Brubaker PH, Nicklas BJ, Eggebeen J and Kitzman DW. Skeletal
muscle composition and its relation to exercise intolerance in older patients with heart failure and
preserved ejection fraction. Am J Cardiol. 2014;113:1211-6.
34. Mizia-Stec K, Goscinska A, Mizia M, Haberka M, Chmiel A, Poborski W and Gasior Z.
Anthracycline chemotherapy impairs the structure and diastolic function of the left ventricle and induces
negative arterial remodelling. Kardiol Pol. 2013;71:681-90.
35. Chaosuwannakit N, D'Agostino R, Hamilton CA, Lane KS, Ntim WO, Lawrence J, Melin SA,
Ellis LR, Torti FM, Little WC and Hundley WG. Aortic Stiffness Increases Upon Receipt of
Anthracycline Chemotherapy. JOURNAL OF CLINICAL ONCOLOGY. 2010;28:166-172.
37. Didier KD. Altered Blood Flow Response to Small Muscle Mass Exercise in Cancer Survivors
Treated With Adjuvant Therapy. 2017;6.
105. Patnaik JL, Byers T, DiGuiseppi C, Dabelea D and Denberg TD. Cardiovascular disease
competes with breast cancer as the leading cause of death for older females diagnosed with breast cancer:
a retrospective cohort study. BREAST CANCER RESEARCH. 2011;13:R64.
109. Peel AB, Thomas SM, Dittus K, Jones LW and Lakoski SG. Cardiorespiratory Fitness in Breast
Cancer Patients: A Call for Normative Values. JOURNAL OF THE AMERICAN HEART ASSOCIATION.
2014;3:e000432.
122. Siegel RL, Miller KD and Jemal A. Cancer statistics, 2019. CA Cancer J Clin. 2019;69:7-34.
123. Foulkes S, Howden EJ, Bigaran A, Janssens K, Antill Y, Loi S, Claus P, Haykowsky MJ, Daly
RM, Fraser SF and La Gerche A. Persistent Impairment in Cardiopulmonary Fitness following Breast
Cancer Chemotherapy. Med Sci Sports Exerc. 2019.
91
124. Beaudry R, Howden, E., Foulkes, S., Bigaran, A., Claus, P., Haykowsky, M., La Gerche, A.
Determinants of Exercise Intolerance in Breast Cancer Patients Prior to Anthracycline Chemotherapy.
Physiological Reports. 2019;7:e13971.
125. Esposito F, Mathieu-Costello O, Shabetai R, Wagner PD and Richardson RS. Limited maximal
exercise capacity in patients with chronic heart failure: partitioning the contributors. J Am Coll Cardiol.
2010;55:1945-54.
126. Barrett-O'Keefe Z, Lee JF, Berbert A, Witman MA, Nativi-Nicolau J, Stehlik J, Richardson RS
and Wray DW. Hemodynamic responses to small muscle mass exercise in heart failure patients with
reduced ejection fraction. Am J Physiol Heart Circ Physiol. 2014;307:H1512-20.
127. Magnusson G, Gordon A, Kaijser L, Sylven C, Isberg B, Karpakka J and Saltin B. High intensity
knee extensor training, in patients with chronic heart failure. Major skeletal muscle improvement. Eur
Heart J. 1996;17:1048-55.
128. Kiernan M, Schoffman DE, Lee K, Brown SD, Fair JM, Perri MG and Haskell WL. The Stanford
Leisure-Time Activity Categorical Item (L-Cat): a single categorical item sensitive to physical activity
changes in overweight/obese women. International Journal of Obesity. 2013;37:1597-1602.
129. Andersen P and Saltin B. Maximal perfusion of skeletal muscle in man. The Journal of
physiology. 1985;366:233-249.
130. Godia EC, Madhok R, Pittman J, Trocio S, Ramas R, Cabral D, Sacco RL and Rundek T. Carotid
artery distensibility: a reliability study. J Ultrasound Med. 2007;26:1157-1165.
131. Heinonen I, Bucci M, Kemppainen J, Knuuti J, Nuutila P, Boushel R and Kalliokoski KK.
Regulation of subcutaneous adipose tissue blood flow during exercise in humans. Journal of applied
physiology (Bethesda, Md : 1985). 2012;112:1059-63.
132. Pivarnik JM, Grafner TR and Elkins ES. Metabolic, thermoregulatory, and psychophysiological
responses during arm and leg exercise. Med Sci Sports Exerc. 1988;20:1-5.
133. Addison O, Marcus RL, Lastayo PC and Ryan AS. Intermuscular fat: a review of the
consequences and causes. International journal of endocrinology. 2014;2014:309570.
134. Christiansen T, Paulsen SK, Bruun JM, Overgaard K, Ringgaard S, Pedersen SB, Positano V and
Richelsen B. Comparable reduction of the visceral adipose tissue depot after a diet-induced weight loss
with or without aerobic exercise in obese subjects: a 12-week randomized intervention study. European
journal of endocrinology. 2009;160:759-67.
135. Murphy JC, McDaniel JL, Mora K, Villareal DT, Fontana L and Weiss EP. Preferential
reductions in intermuscular and visceral adipose tissue with exercise-induced weight loss compared with
calorie restriction. Journal of applied physiology (Bethesda, Md : 1985). 2012;112:79-85.
136. Avila JJ, Gutierres JA, Sheehy ME, Lofgren IE and Delmonico MJ. Effect of moderate intensity
resistance training during weight loss on body composition and physical performance in overweight older
adults. Eur J Appl Physiol. 2010;109:517-25.
92
4.1 g) Figure Legends:
4.1 g) i: Figure 1: Single leg knee extension power (A), and blood flow (B), mean arterial pressure (C), leg
conductance (D) and heart rate (E) responses. Significant intensity effect (p<0.05) indicated by
*vs rest, † vs 25%, ‡ vs 50%, # vs 75%.
4.1 g) ii: Figure 2: Femoral artery pressure-strain at rest and during submaximal exercise. Significant intensity
effect (p<0.05) indicated by *vs rest, † vs 25%.
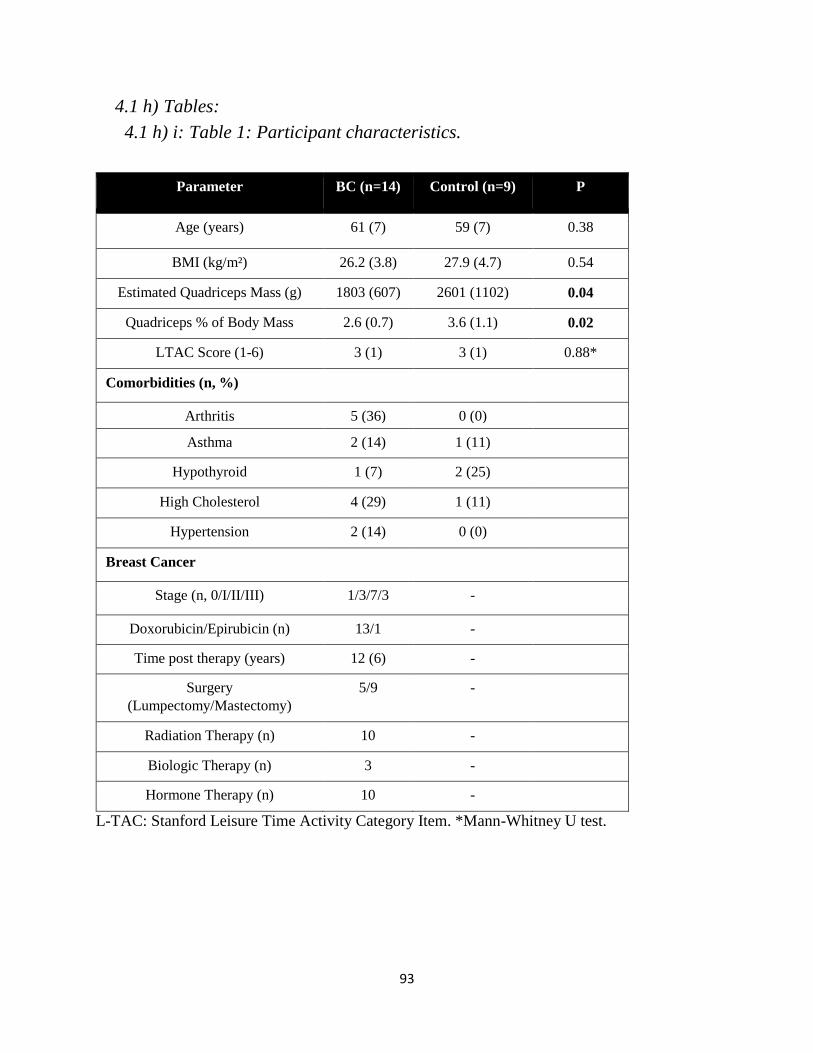
93
4.1 h) Tables:
4.1 h) i: Table 1: Participant characteristics. Table 6 Participant Characteristics
Parameter BC (n=14) Control (n=9) P
Age (years) 61 (7) 59 (7) 0.38
BMI (kg/m²) 26.2 (3.8) 27.9 (4.7) 0.54
Estimated Quadriceps Mass (g) 1803 (607) 2601 (1102) 0.04
Quadriceps % of Body Mass 2.6 (0.7) 3.6 (1.1) 0.02
LTAC Score (1-6) 3 (1) 3 (1) 0.88*
Comorbidities (n, %)
Arthritis 5 (36) 0 (0)
Asthma 2 (14) 1 (11)
Hypothyroid 1 (7) 2 (25)
High Cholesterol 4 (29) 1 (11)
Hypertension 2 (14) 0 (0)
Breast Cancer
Stage (n, 0/I/II/III) 1/3/7/3 -
Doxorubicin/Epirubicin (n) 13/1 -
Time post therapy (years) 12 (6) -
Surgery
(Lumpectomy/Mastectomy)
5/9 -
Radiation Therapy (n) 10 -
Biologic Therapy (n) 3 -
Hormone Therapy (n) 10 -
L-TAC: Stanford Leisure Time Activity Category Item. *Mann-Whitney U test.

94
4.1 h) ii: Table 2: Power output, heart rate and mean arterial pressure during
maximal SLKE exercise. Table 7 Maximal single leg knee extension parameters
Parameter BC
(n=14)
Control
(n=9)
P
Power (W) 28 (11) 34 (17) 0.35
Heart Rate (bpm) 109 (14) 103 (13) 0.36
Mean Arterial Pressure
(mmHg)
122 (18) 119 (26) 0.33
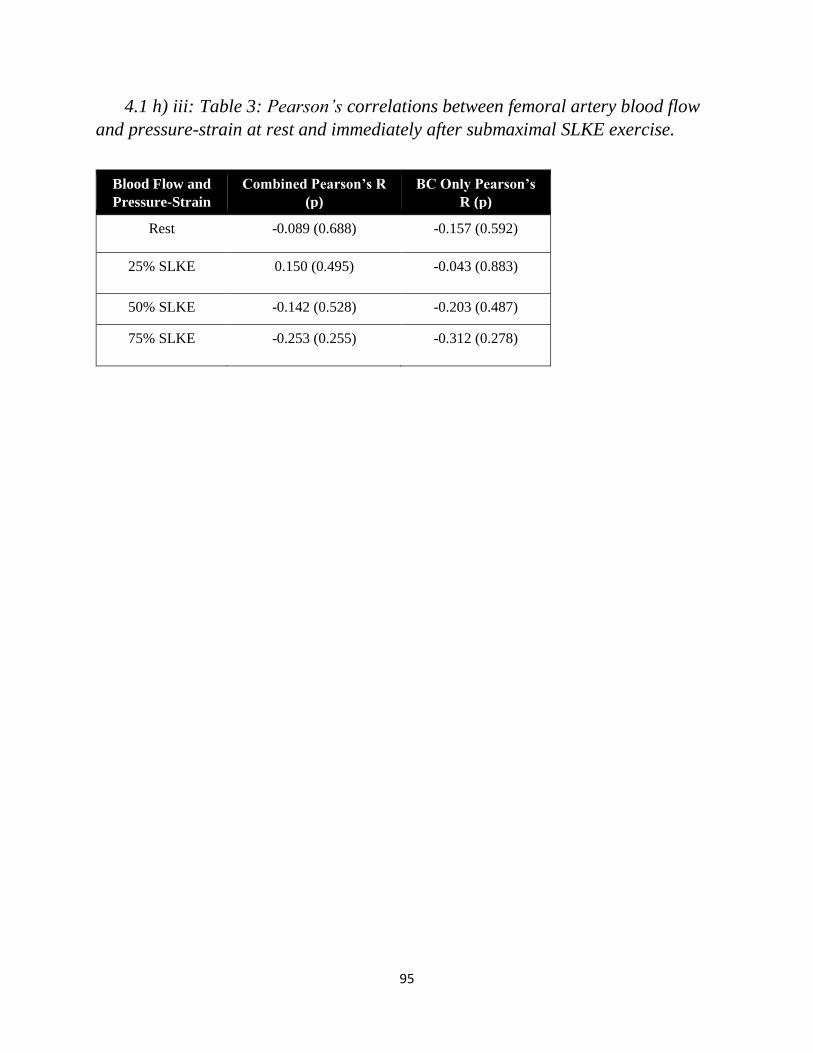
95
4.1 h) iii: Table 3: Pearson’s correlations between femoral artery blood flow
and pressure-strain at rest and immediately after submaximal SLKE exercise. Table 8 Pearson's correlations between femoral artery blood flow and pressure-strain
Blood Flow and
Pressure-Strain
Bivariate
Relationship
Combined Pearson’s R
(p)
BC Only Pearson’s
R (p)
Rest -0.089 (0.688) -0.157 (0.592)
25% SLKE 0.150 (0.495) -0.043 (0.883)
50% SLKE -0.142 (0.528) -0.203 (0.487)
75% SLKE -0.253 (0.255) -0.312 (0.278)

96
4.1 i) Figures:
4.1 i) i: Figure 1: SLKE power and hemodynamic responses to SLKE exercise.
Single leg knee extension power (A), and blood flow (B), mean arterial pressure (C), leg
conductance (D) and heart rate (E) responses. Significant intensity effect (p<0.05) indicated by
*vs rest, † vs 25%, ‡ vs 50%, # vs 75%.
Figure 7Power output, leg blood flow, mean arterial pressure and leg conductance at rest and during single leg knee extension
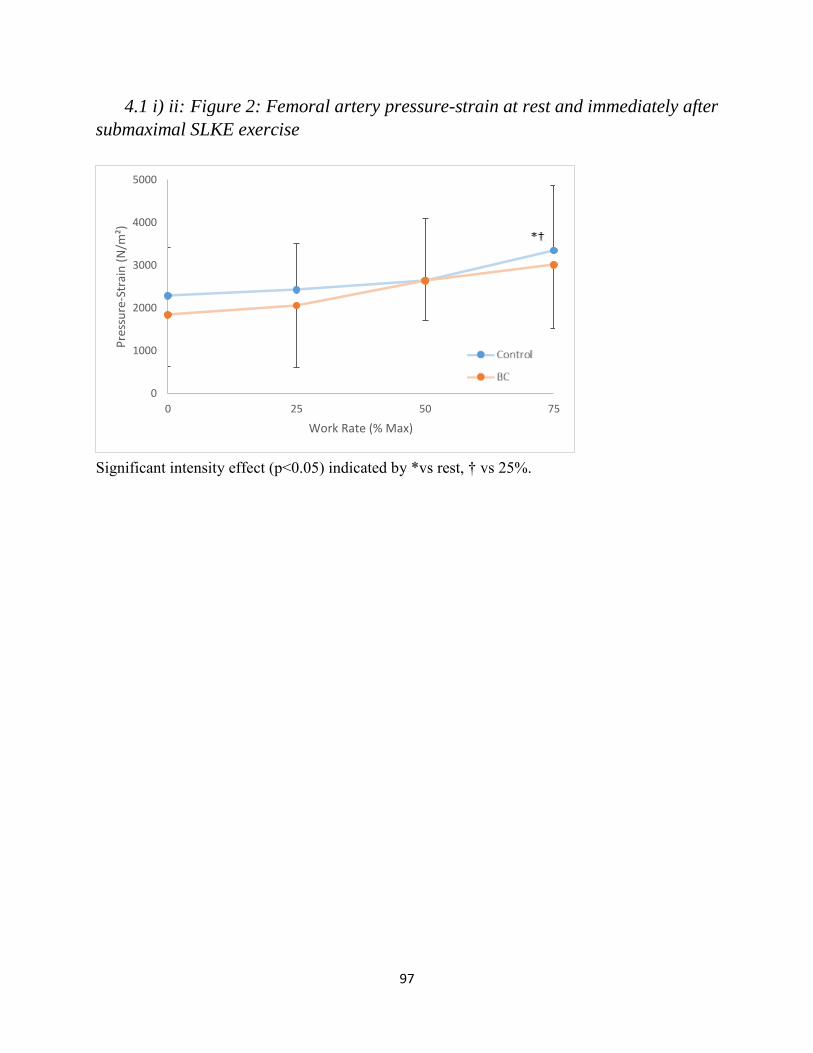
97
4.1 i) ii: Figure 2: Femoral artery pressure-strain at rest and immediately after
submaximal SLKE exercise
;
Significant intensity effect (p<0.05) indicated by *vs rest, † vs 25%.
Figure 8 Femoral artery pressure-strain
0
1000
2000
3000
4000
5000
0 25 50 75
Pre
ssu
re-S
trai
n (
N/m
²)
Work Rate (% Max)

98
99
5.1 Exercise intolerance in anthracycline-treated breast cancer survivors: the role
of skeletal muscle bioenergetics, oxygenation and composition.
Beaudry RI1, Kirkham AA2, Thompson RB2, Grenier JG2, Mackey JR3, Haykowsky MJ1.
1College of Nursing and Health Innovation, University of Texas at Arlington, Arlington, USA
2Department of Biomedical Engineering, University of Alberta, Edmonton, Canada
3Department of Oncology, University of Alberta, Edmonton, Canada
Submitted to The Oncologist

100
5.1 a) Abstract Background: Peak oxygen consumption (VO2) is reduced in women with a history of breast
cancer (BC). We measured leg blood flow, oxygenation, bioenergetics, and muscle composition
in women with BC treated with anthracycline chemotherapy (n=16, mean age: 56) and age- and
body mass index-matched controls (n=16).
Methods: Whole-body peak VO2 was measured during cycle exercise. 31Phospohous magnetic
resonance (MR) spectroscopy was used to measure muscle bioenergetics during and after
incremental to maximal plantar flexion exercise (PFE). MR imaging was used to measure lower
leg blood flow, venous saturation (SvO2) and VO2 during submaximal PFE, and abdominal,
thigh and lower leg intermuscular fat (IMF) and skeletal muscle (SM).
Results: Whole body peak VO2 was significantly lower in BC survivors vs. controls (23.1±7.5
vs. 29.5±7.7 ml/kg/min). Muscle bioenergetics and mitochondrial oxidative capacity were not
different between groups. No group differences were found during submaximal PFE for lower
leg blood flow, SvO2 or VO2. The IMF:SM ratio was higher in the thigh and lower leg in BC
survivors (0.36±0.19 vs 0.22±0.07, p=0.01; 0.10±0.06 vs 0.06±0.02, p=0.03, respectively) and
were inversely related to whole-body peak VO2 (r= -0.71, p=0.002; r=-0.68, p=0.003,
respectively). In the lower leg, IMF:SM ratio was inversely related to VO2 and O2 extraction
during PFE.
Conclusion: SM bioenergetics and oxidative capacity in response to PFE are not impaired
following anthracycline treatment. Abnormal SM composition (increased thigh and lower leg
IMF:SM ratio) may be an important contributor to reduced peak VO2 during whole body
exercise among anthracycline-treated BC survivors.
101
5.1 b) Implications for Practice: Peak oxygen consumption (VO2) is reduced in breast cancer (BC) survivors and is prognostic of
increased risk of cardiovascular disease-related and all-cause mortality. We demonstrated that in
the presence of deficits in peak VO2 one year post-anthracycline therapy, skeletal muscle
bioenergetics and oxygenation are not impaired. Rather, body composition deterioration (e.g.
increased ratio of intermuscular fat to skeletal muscle) may contribute to reduced exercise
tolerance in anthracycline BC survivors. This finding points to the importance of lifestyle
interventions including caloric restriction and exercise training to restore body composition and
cardiovascular health in the BC survivorship setting.
102
5.1 c) Introduction Advances in prevention, early detection, and treatment of early stage breast cancer (BC) have
dramatically improved survival, and consequently, other conditions including cardiovascular
disease (CVD) now compete with BC as the primary cause of mortality.1, 2 Women with a history
of BC are at greater risk for CVD and related mortality relative to women without BC. It is well
established that following treatment for BC, cardiorespiratory fitness, measured as peak oxygen
uptake (peak VO2) during whole-body exercise, is ≈20% lower than age- and sex-matched
controls.13, 16, 17, 19, 124, 137 Low cardiorespiratory fitness is associated with increased heart failure
incidence, cardiovascular events, and both CVD disease-related and all-cause mortality.138
Several BC therapies can cause cardiovascular injury, including anthracycline chemotherapy,
which is associated with a dose-dependent, progressive, myocardial injury.7 Accordingly,
impairments in peak VO2 could be attributed to ‘central’ limitations that reduce peak exercise
cardiac output.17, 123 However, ‘peripheral’ impairments in exercise blood flow, citrate synthase
activity, and relative reductions in oxidative muscle fiber and capillarity have been reported in
individuals after systemic cancer therapy.31, 139 Abnormalities in skeletal muscle composition may
also limit exercise tolerance; Reding et al. reported peak VO2 was inversely related to the ratio of
intermuscular fat (IMF) to skeletal muscle (SM) within the paraspinal muscles in cancer
survivors.29 Given that O2 consumption during cycle exercise occurs predominantly in the muscles
of the thigh and lower leg, skeletal muscle composition in the leg is likely a more important
determinant of peak VO2. Prior reports studied populations heterogeneous for both cancer type
and treatment, or only assessed acute changes during active treatment. Accordingly, the aims of
this study were to: 1) comprehensively compare non-invasive measures of leg SM composition,
rest and exercise blood flow, O2 extraction, VO2 and oxidative metabolism during plantar flexion
exercise (PFE) using magnetic resonance (MR) imaging, 31P spectroscopy and whole body (cycle)
103
peak VO2 in BC survivors approximately one-year post-anthracycline treatment and age- and BMI-
matched non-cancer controls; and 2) evaluate the relationship between thigh, lower leg, and
paraspinal SM composition and whole-body peak VO2. We hypothesized that BC survivors would
have attenuated exercise leg blood flow, impaired SM oxidative capacity, and unfavorable SM
composition compared to controls, and that IMF:SM ratio in the leg would be inversely related to
peak VO2. An exploratory objective was to assess underlying effects of the IMF:SM ratio by
examining its relationship with measures of exercise metabolism, blood flow, VO2, and O2
extraction in the lower leg of anthracycline-treated BC survivors and non-cancer controls.
5.1 d) Methods
5.1 d) i: Participants Thirty-two women participated in this cross-sectional study, with sixteen BC survivors and
sixteen age and BMI matched non-cancer controls. The women with BC were recruited from a
randomly selected cohort of 75 BC survivors who received anthracycline treatment at the Cross
Cancer Institute (Edmonton, Canada) in the previous year, by mailing an invitation to participate.
The women with BC who responded to the letter were then further screened for eligibility,
including an additional inclusion criterion of a minimum of 3.5 months since receipt of their last
anthracycline-based chemotherapy treatment to avoid effects of acute cardiotoxicity.11 The
control participants were recruited from the local community via word of mouth and recruitment
posters. Exclusion criteria for both groups included a history of cardiovascular disease, diabetes,
or lung disease, and contraindications to MRI. Controls were also excluded if they had a history
of cancer of any type. Informed, written consent was obtained from all participants, and the study
was approved by the University of Alberta Research Ethics Board.
104
5.1 d) ii: Cardiorespiratory fitness Exercise testing was performed on an electrically-braked upright cycle ergometer (Ergoselect
II 1200, Ergoline, Germany) using a staged protocol that started at 20 watts (W) and increased by
15 W every minute until volitional exhaustion. Expired gas was collected and analysed using a
commercially available metabolic measurement system (Encore229 Vmax, SensorMedics, USA)
and the highest 20-second average was used as whole-body peak VO2. Heart rate (lead II ECG)
was monitored continuously while rating of perceived exertion (RPE) was recorded every 2
minutes and at peak exercise.
5.1 e) MR Imaging and 31P Magnetic Resonance Spectroscopy Skeletal muscle function, resting and exercise metabolism, and composition were evaluated
using a 3.0 T MRI system (PRISMA, Siemens Healthineers, Erlangen, Germany).
Incremental PFE – 31P Metabolism
Subjects performed an incremental to maximal, unilateral (left leg), supine PFE test using a
commercially available MRI ergometer (Trispect Module, Ergospect, Austria; Figure 1) inside
the scanner. Plantar flexion exercise utilizes relatively small muscle mass, where the limiting
role of the heart is minimized,140 and elicits a metabolic response similar to the common daily
activity of stair climbing.141 The initial power output was set at 4 W and increased by 2 W every
minute until volitional exhaustion. A metronome provided a consistent cadence of 30
contractions/minute and a study member provided feedback and encouragement from inside the
scanner room to ensure test consistency. Tests were terminated at volitional exhaustion or
technique breakdown (involvement of non-plantar flexor muscle groups or inability to perform
30 contractions/minute).

105
31P spectra, averaged over 12-second intervals, were acquired continuously from rest,
throughout exercise, and for four minutes of recovery after cessation of exercise (TR = 1.5
seconds, flip angle = 30 degrees, 8 cm diameter 31P radiofrequency coil was used for excitation
and signal reception). Relative concentrations (area under the individual spectra) of
phosphocreatine (PCr) and inorganic phosphate (Pi) were measured to generate Pi:PCr ratios,
and intracellular pH was calculated from the chemical shift difference between the Pi and PCr
signals.142 The Pi:PCr ratio and pH were compared at 60% of peak power output as a
representative moderate-intensity workload that occurred prior to a marked reduction in pH for
all participants. From the time of exercise completion, a mono-exponential curve was fit to the
PCr recovery data to calculate the PCr recovery time constant, (PCr). The Pi:PCr ratio at the
moderate exercise intensities and the PCr recovery were measured as indicators of skeletal
muscle oxidative metabolism.143 31P spectra were analyzed using custom, in-house developed
MATLAB code (MATLAB, MathWorks, USA).
Sub-maximal PFE Leg Blood Flow, Oxygen Extraction and VO2
Following 15-20 minutes of recovery after the incremental test, participants performed four
minutes of constant work load sub-maximal PFE using the right leg, at 60% of peak power
output. Blood flow and venous oxygen saturation were measured in the right superficial femoral
vein just superior to the knee at rest (prior to exercise), and immediately (<1 second) after
cessation of exercise, using a previously described method.140, 144-146 Briefly, MR susceptometry-
based oximetry was used to estimate venous oxygen saturation (SvO2) based on the magnetic
field shift associated with the concentration of deoxyhemoglobin.145 The same MRI acquisition
included simultaneous quantification of blood flow (ml/min) in the superficial femoral vein.
Images were acquired perpendicular to the superficial femoral vein (axial image orientation)
106
proximal to the knee (Figure 1). Together with arterial oxygen saturation (SaO2, finger pulse
oximetry) and hemoglobin (Hb) concentration (obtained from blood tests immediately prior to
the MRI scan), lower leg VO2 and O2 extraction were calculated in accordance with the Fick
Principle:
Lower leg VO2 (ml/min) = blood flow (ml/min) · [(SaO2 – SvO2, %) · Hb g/dL] · 1.34 mL O2/g Hb.
While Lower leg O2 extraction was calculated as:
O2 extraction = (SaO2 – SvO2)/SaO2 x 100%.
Skeletal Muscle and Fat Composition
At each of the lower leg, thigh and abdomen regions, a multi-slice multi-echo acquisition was
used to reconstruct water and fat separated images using the modified Dixon approach (Figure
2).147 Typical image parameters include a 4 mm slice thickness, axial slice orientation, 1.0-1.3
mm in-plane resolution, with 30 slices covering the lower leg, 50 slices covering the thigh and 12
slices in the abdomen, with a sub-set of images selected for analysis at each location. For the
lower leg, slices were analysed from 5 cm below the proximal end of tibial plateau, as identified
on a sagittal localizer image of the lower leg, to the distal elimination of the gastrocnemius. For
the thigh, 10 consecutive slices were analyzed starting 40 mm from the most distal point of the
femur, as identified using the sagittal localizer image of femur. In the abdomen, three slices
centered at the middle of the third lumbar vertebrae were identified using sagittal localizer
images of the spine.
Absolute volumes of muscle (SM), intermuscular fat (IMF) and subcutaneous fat were
measured in the lower leg, thigh and abdomen. Visceral fat (VF) was also measured in the
abdomen. For image segmentation, custom MATLAB code was used to perform semi-automated

107
analysis to identify the boundaries of subcutaneous fat, SM, IMF, VF and bones. All regions
were manually checked and adjusted in each slice to ensure accuracy of the automated
delineation. Volumes for each component were quantified using the disk summation method at
each of the three regions (lower leg, thigh and abdomen). The SM and IMF volumes were used
to calculate the ratio of IMF to SM as well as the SM fat fraction (IMF/(IMF+SM)*100%) in
each region.
5.1 e) i: Descriptive information Cardiovascular risk factors and usual physical activity in the past month were collected
by researcher-developed questionnaire and the Godin Leisure-Time Exercise Questionnaire.148
Diagnosis and treatment history were extracted from medical records.
Statistical Analysis
Categorical descriptive characteristics were compared between groups using chi square
tests or Fisher’s exact test for variables with cell size above or below n=5, respectively. Student’s
t-tests for independent samples were used to compare continuous variables between groups. In
the case of non-parametric distribution of continuous variables (confirmed by the Shapiro-Wilk
test), the Mann Whitney U-test was used instead. Bivariate associations between IMF:SM and
SM fat fraction in each region and relative peak VO2 were characterized with Pearson’s product-
moment correlations within both groups combined and confirmed within the BC group alone.
Pearson’s correlations were also used to characterize associations between our parameters of
lower leg function and metabolism and the IMF:SM ratio in the lower leg. Continuous data are
presented as mean ± standard deviation.

108
5.1 f) Results
5.1 f) i: Participants Twenty-two women with BC responded to recruitment letters, and after further screening, six
were excluded due to a history of diabetes (n=2), MRI incompatibility (n=2), and failure to
respond to follow-up calls regarding scheduling (n=2). Of the remaining sixteen BC survivors
who enrolled, fifteen received epirubicin, one received doxorubicin, fifteen received radiation
therapy, and none received Trastuzumab (Table 1). On average, BC survivors were studied
12.84.7 months after administration of the final anthracycline treatment. The groups were well-
matched for age, weight, body mass index, hemoglobin, cardiovascular risk factors, and self-
reported exercise (Table 1).
5.1 f) ii: Cardiorespiratory Fitness Peak cycle ergometer power output (132±31 vs. 165±30 W, p<0.01), absolute peak VO2
(1.69±0.37 vs. 2.13±0.41 L/min, p<0.01) and peak VO2 indexed to body mass (23.1±7.5 vs.
29.5±7.7 ml/kg/min, p=0.02) were significantly lower in BC survivors compared to controls.
Peak exercise heart rate, SaO2, respiratory exchange ratio, and rating of perceived exertion did
not differ between groups (Table 2).
Skeletal muscle oxidative capacity
Resting Pi:PCr ratio and pH were similar in both groups (Table 2). Peak PFE power
output, heart rate, rating of perceived exertion, Pi:PCr ratio and pH were not different between
groups (Table 2). Skeletal muscle oxidative capacity, measured as Pi:PCr ratio at a moderate-
intensity sub-maximal exercise workloads and by post-exercise PCr recovery τ did not differ
between BC and controls, with similar results for pH (Table 2)
109
5.1 f) iii: Rest and sub-maximal exercise lower leg VO2 and its determinants
Resting lower leg SvO2 was lower in the BC as compared to control group (745 vs
805%, p<0.01), corresponding to a higher O2 extraction ratio (0.240.06 vs 0.180.05, p=0.01),
while leg blood flow was lower in the BC group (5523 vs 7729 ml/min, p=0.02) resulting in
no difference between groups for resting leg VO2 (Table 2). Sub-maximal exercise power output,
VO2, blood flow, SvO2 and O2 extraction were similar between groups (Table 2, Figure 3).
Body composition
Subcutaneous fat volume did not differ between groups for the abdomen, thigh or lower leg
regions (Table 3). In the abdomen, visceral fat volume was higher (BC 406217 vs 273+123 mL,
p=0.04), paraspinal SM volume was lower (31339 vs 34032 ml, p=0.04), but absolute IMF
volume, IMF:SM, and SM fat fraction did not differ between groups. In the thigh, SM volume
did not differ between groups, but IMF volume (8231 vs 5817 ml, p=0.01), IMF:SM ratio
(0.360.19 vs 0.220.07, p=0.01) and SM fat fraction (2510 vs 185, p=0.02) were all
significantly higher in BC compared to controls. In the lower leg SM was reduced (752149 vs
903162 ml, p=0.01; Table 3), IMF volume did not differ, while the IMF:SM ratio (0.100.06 vs
0.060.02, p=0.03) and the SM fat fraction (95 vs 52%, p=0.02) (Table 3) were significantly
higher in BC.
5.1 f) iv: Relationship of skeletal muscle and intermuscular fat with whole-
body peak VO2 On analysis of all study participants combined, the IMF:SM ratio in the paraspinal, thigh,
and lower leg muscle groups each had a strong, inverse relationship to whole-body relative peak
VO2 (r=-0.70, p<0.001, r= -0.72, p<0.001, and r=-0.66, p<0.001 respectively; Figure 3). These
relationships were similarly strong in the BC group (paraspinal: r=-0.70, p=0.003; thigh: r= -

110
0.71, p=0.002; lower leg: r=-0.68, p=0.003). The SM fat fraction had a slightly stronger
relationship with whole-body peak VO2 than the IMF:SM ratio, in all regions (paraspinal: r=-
0.73, p<0.001; thigh: r= -0.78, p<0.001; lower leg: r=-0.71, p<0.001).
5.1 f) v: Relationship of lower leg muscle composition, resting and exercise
metabolism, blood flow, oxygen consumption, and extraction The lower leg IMF:SM ratio was not related to lower leg peak power output, Pi:PCr ratio, or
pH (Table 4). Lower leg IMF:SM ratio correlated strongly and positively with lower leg sub-
maximal exercise SvO2 (r=0.70, p<0.001). The IMF:SM ratio also had a strong inverse
relationship with lower leg sub-maximal exercise VO2 and O2 extraction (r=-0.64, p=0.008; r=-
0.67, p<0.001) and a moderate inverse relationship with lower leg exercise blood flow (r=-0.35,
p=0.05; Table 4). These relationships were similarly evident within the BC group alone, except
for blood flow, where the correlation effect size was similar but no longer significant due to
greater variability (r=-0.37, p=0.16).
Discussion
Peak VO2 is a strong independent predictor of CVD, disability and mortality in healthy
and clinical populations.149 Following BC treatment, women have a peak VO2 that is on average
20% lower than age-matched healthy sedentary women.13, 16, 17, 19, 124, 137 The mechanisms
responsible for the reduced exercise tolerance are not well understood, however recent evidence
suggests that ‘non-cardiac’ peripheral abnormalities associated with chemotherapy may be
important contributors to reduced exercise tolerance.29, 31 The major new finding of this study is
that despite a significantly lower peak VO2 during whole body exercise, BC survivors had
preserved lower leg blood flow, leg VO2 and mitochondrial oxidative capacity relative to
controls during unilateral PFE. A second novel finding is that the IMF:SM ratio and SM fat
111
fraction in the thigh and lower leg are strongly related to peak VO2, explaining approximately
50% of the variability in cardiorespiratory fitness. We also uncovered potential mediating
mechanisms for the impact of the IMF:SM ratio on local VO2. Specifically, a higher IMF:SM
ratio in the lower leg was associated with increased SvO2, reduced muscle VO2, blood flow, and
O2 extraction with moderate-intensity unilateral PFE. Taken together, these results suggest that
the primary peripheral impairments evident approximately one-year after anthracyclines are
abnormalities in skeletal muscle composition, namely increased IMF, which is an important
contributor to the reduced whole-body VO2 and O2 extraction in BC survivors.
5.1 f) vi: Skeletal mitochondrial oxidative capacity in BC survivors Contrary to our hypothesis, we did not observe impaired muscle function or reduced
oxidative capacity in our group of BC survivors. Specifically, in response to unilateral PFE for
which maximal blood flow is not limited by convective O2 delivery, the peak PFE workloads
achieved by the BC survivors did not differ from the controls. This was unexpected given the
significant and marked reduction in cycle ergometer power output achieved by the BC group
relative to the control group. Further, the Pi:PCr ratio, which reflects coupling of ATP use and
resynthesis, did not differ between groups at rest or at moderate and peak intensity exercise,
indicating similar patterns of aerobic and anaerobic metabolism during exercise (Table 2).
Notably, the peak pH at the end of exercise was similar between groups, indicating comparable
states of metabolic acidosis, allowing for comparison of post-exercise PCr recovery.150 The PCr
post-exercise recovery τ, a measure of mitochondrial ATP synthesis,151-153 was not different
between groups, nor blood flow, a potential confounding factor (Table 2). Taken together, these
results suggest that, on average, women who received anthracyclines for BC do not have
impaired SM mitochondrial function in response to small muscle mass exercise where the
limiting role of the heart is minimized.
112
Using vastus lateralis skeletal muscle biopsy, Mijwel et al. showed that during receipt of
anthracycline chemotherapy, women with BC experienced a reduction in oxidative muscle
fibers, citrate synthase, and capillarity.31 These deteriorations were attributed to deconditioning
rather than a result of chemotherapy as a 16-week exercise intervention consisting of high-
intensity aerobic and resistance interval training during adjuvant chemotherapy attenuated the
decline in mitochondrial function.31 In the present study, the women with BC were on average 13
months post-anthracycline treatment, and 75% self-reported performing some physical activity in
the previous month. It is possible that this length of time since treatment and/or the physical
activity performed may have contributed to recovery or preservation of mitochondrial function.
5.1 f) vii: Skeletal Muscle Composition and its relationship to VO2 Haykowsky et al. previously reported that the reduced peak VO2 in patients with heart failure
and preserved ejection fraction (HFpEF) was associated with a higher thigh IMF:SM ratio.30
Similarly, Reding et al. found inverse correlations between peak VO2 and paraspinal IMF:SM ratio
in 14 cancer survivors with mixed diagnoses and timing since treatment.29 However, Reding et al.
did not find differences in absolute amounts of IMF or the IMF:SM ratio of the paraspinal muscles
between cancer survivors and non-cancer controls. In our study, we used a similar approach to
assess the paraspinal muscle and found a similarly strong relationship between IMF:SM ratio and
whole-body peak VO2. We also assessed composition of the thigh and lower leg muscles, as the
primary muscles driving oxygen uptake during cycle and PFE. We extended prior non-cancer and
cancer studies by demonstrating that BC survivors previously treated with anthracycline
chemotherapy have increased thigh IMF, IMF:SM ratio, SM fat fraction, and reduced lower leg
SM, and increased lower leg IMF:SM and SM fat fraction compared to controls. Moreover, while
the average IMF:SM ratio and SM fraction varied among the paraspinal, thigh, and lower leg
muscles, it was inversely related to peak whole-body VO2 during cycle exercise in all three regions,

113
implicating IMF in the pathophysiology of anthracycline-related VO2 deterioration. A further
illustration of the extent of impairment in SM composition among women with BC is that the
IMF:SM ratio in our BC group was similar to that reported by Haykowsky et al. in patients with
HFpEF.30
We have further added to the understanding of the impact of IMF on SM metabolism by using
novel MRI techniques to non-invasively assess lower leg local VO2 and O2 extraction during
submaximal PFE. We did not find any relationship between IMF:SM and SM exercise metabolism
as assessed by 31P spectroscopy. However, lower leg IMF:SM ratio was inversely related to local
exercise VO2 and O2 extraction in both groups (Table 4). Specifically, the greater the amount of
IMF relative to the amount of SM, the less O2 consumed or extracted with exercise. That we found
this relationship between IMF:SM and VO2 for both whole-body and small muscle mass exercise
indicates that the impact of IMF on VO2 is independent of potential ‘central’ limitations. A
potential explanation for this IMF effect can be drawn from a study demonstrating that blood flow
to subcutaneous fat adjacent to exercising muscle increases in an intensity-dependent manner.131
This study of subcutaneous fat proposed potential mechanisms of vasodilation of adipose tissue
vessels including: 1) heat conduction from working muscle; 2) adenosine formation that occurs in
fat during exercise; and 3) conductive vasodilation up the arterial tree. It is possible that a similar
effect occurs in IMF where blood flow is shunted through the metabolically inactive IMF, resulting
in increased mixed venous O2 content.131 Consequently, this could explain the strong relationship
between lower leg IMF:SM ratio and both SvO2 and O2 extraction (Table 4). Another potential
mechanism for the impact of IMF on oxygen extraction is that the deposits of adipose tissue in the
muscle could reduce muscle oxygen diffusive conductance due to a greater distance for O2 to travel
from the capillaries to muscle mitochondria and a limited ability to locally restrict vascular
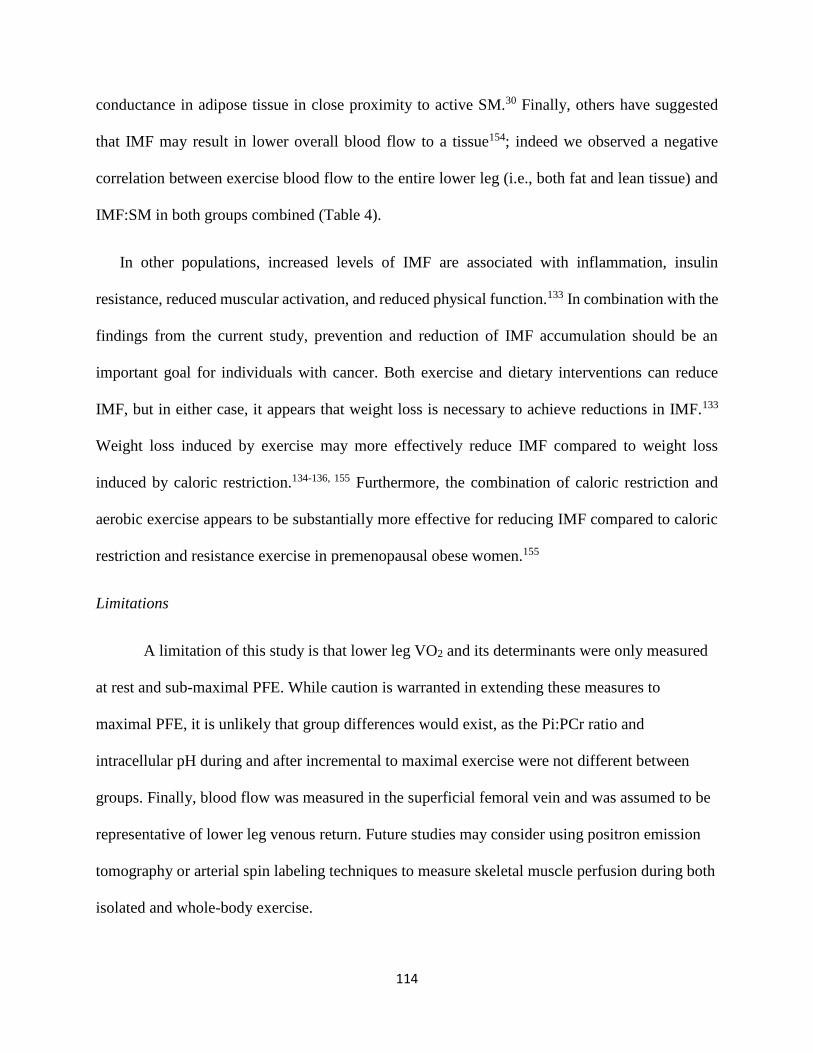
114
conductance in adipose tissue in close proximity to active SM.30 Finally, others have suggested
that IMF may result in lower overall blood flow to a tissue154; indeed we observed a negative
correlation between exercise blood flow to the entire lower leg (i.e., both fat and lean tissue) and
IMF:SM in both groups combined (Table 4).
In other populations, increased levels of IMF are associated with inflammation, insulin
resistance, reduced muscular activation, and reduced physical function.133 In combination with the
findings from the current study, prevention and reduction of IMF accumulation should be an
important goal for individuals with cancer. Both exercise and dietary interventions can reduce
IMF, but in either case, it appears that weight loss is necessary to achieve reductions in IMF.133
Weight loss induced by exercise may more effectively reduce IMF compared to weight loss
induced by caloric restriction.134-136, 155 Furthermore, the combination of caloric restriction and
aerobic exercise appears to be substantially more effective for reducing IMF compared to caloric
restriction and resistance exercise in premenopausal obese women.155
Limitations
A limitation of this study is that lower leg VO2 and its determinants were only measured
at rest and sub-maximal PFE. While caution is warranted in extending these measures to
maximal PFE, it is unlikely that group differences would exist, as the Pi:PCr ratio and
intracellular pH during and after incremental to maximal exercise were not different between
groups. Finally, blood flow was measured in the superficial femoral vein and was assumed to be
representative of lower leg venous return. Future studies may consider using positron emission
tomography or arterial spin labeling techniques to measure skeletal muscle perfusion during both
isolated and whole-body exercise.

115
5.1 g) Conclusion In women with BC treated with anthracycline chemotherapy one year earlier, peak VO2
and power output during whole body (cycle) exercise are significantly reduced relative to age-
and BMI-matched controls. However, during small muscle mass exercise that is not limited by
cardiac reserve, women with BC were able to perform a similar amount of work with a similar
lower leg VO2, blood flow, O2 extraction and oxidative capacity to controls. The primary
peripheral anomaly in BC compared to controls was in SM composition, with an increased
IMF:SM ratio and SM fat fraction in the thigh and lower leg among the women with BC. This is
an importance difference as a higher IMF:SM ratio was associated with lower whole-body peak
VO2 and reduced lower leg blood flow, VO2 and O2 extraction. Therefore, IMF appears to play
an important role in the impaired cardiorespiratory fitness reported following completion of BC
treatment. Diet and exercise interventions targeted to reduce the relative amount of IMF and
increase the absolute amount of SM in the legs should be investigated as possible therapies to
improve cardiorespiratory fitness following cancer therapy.
116
5.1 h) References 1. Siegel RL, Miller KD and Jemal A. Cancer statistics, 2018. CA: A Cancer Journal for Clinicians.
2018;68:7-30.
2. American C, Society. Cancer treatment & survivorship: facts & figures 2015-2016. Online.
2017;February 5, 2017:https://www.cancer.org/cancer/breast-cancer.html.
7. McGowan JV, Chung R, Maulik A, Piotrowska I, Walker JM and Yellon DM. Anthracycline
Chemotherapy and Cardiotoxicity. Cardiovascular Drugs and Therapy. 2017;31:63-75.
11. Cardinale D, Colombo A, Bacchiani G, Tedeschi I, Meroni CA, Veglia F, Civelli M, Lamantia G,
Colombo N, Curigliano G, Fiorentini C and Cipolla CM. Early Detection of Anthracycline Cardiotoxicity
and Improvement With Heart Failure Therapy. Circulation. 2015;131:1981-1988.
13. Jones LW, Courneya KS, Mackey JR, Muss HB, Pituskin EN, Scott JM, Hornsby WE, Coan AD,
Herndon JE, Douglas PS and Haykowsky M. Cardiopulmonary Function and Age-Related Decline
Across the Breast Cancer Survivorship Continuum. JOURNAL OF CLINICAL ONCOLOGY.
2012;30:2530-2537.
16. Khouri MG, Hornsby WE, Risum N, Velazquez EJ, Thomas S, Lane A, Scott JM, Koelwyn GJ,
Herndon JE, Mackey JR, Douglas PS and Jones LW. Utility of 3-dimensional echocardiography, global
longitudinal strain, and exercise stress echocardiography to detect cardiac dysfunction in breast cancer
patients treated with doxorubicin-containing adjuvant therapy. Breast cancer research and treatment.
2014;143:531-539.
17. Jones LW, Haykowsky M, Pituskin EN, Jendzjowsky NG, Tomczak CR, Haennel RG and
Mackey JR. Cardiovascular reserve and risk profile of postmenopausal women after chemoendocrine
therapy for hormone receptor - Positive operable breast cancer. ONCOLOGIST. 2007;12:1156-1164.
19. Koelwyn GJ, Lewis NC, Ellard SL, Jones LW, Gelinas JC, Rolf JD, Melzer B, Thomas SM,
Douglas PS, Khouri MG and Eves ND. Ventricular-Arterial Coupling in Breast Cancer Patients After
Treatment With Anthracycline-Containing Adjuvant Chemotherapy. ONCOLOGIST. 2016;21:141-149.
29. Reding KW, Brubaker P, D’Agostino R, Kitzman DW, Nicklas B, Langford D, Grodesky M and
Hundley WG. Increased skeletal intermuscular fat is associated with reduced exercise capacity in cancer
survivors: a cross-sectional study. Cardio-Oncology. 2019;5:3.
30. Haykowsky MJ, Kouba EJ, Brubaker PH, Nicklas BJ, Eggebeen J and Kitzman DW. Skeletal
muscle composition and its relation to exercise intolerance in older patients with heart failure and
preserved ejection fraction. Am J Cardiol. 2014;113:1211-6.
31. Mijwel S, Cardinale DA, Norrbom J, Chapman M, Ivarsson N, Wengstrom Y, Sundberg CJ and
Rundqvist H. Exercise training during chemotherapy preserves skeletal muscle fiber area, capillarization,
and mitochondrial content in patients with breast cancer. FASEB journal : official publication of the
Federation of American Societies for Experimental Biology. 2018;32:5495-5505.
123. Foulkes S, Howden EJ, Bigaran A, Janssens K, Antill Y, Loi S, Claus P, Haykowsky MJ, Daly
RM, Fraser SF and La Gerche A. Persistent Impairment in Cardiopulmonary Fitness following Breast
Cancer Chemotherapy. Med Sci Sports Exerc. 2019.
124. Beaudry R, Howden, E., Foulkes, S., Bigaran, A., Claus, P., Haykowsky, M., La Gerche, A.
Determinants of Exercise Intolerance in Breast Cancer Patients Prior to Anthracycline Chemotherapy.
Physiological Reports. 2019;7:e13971.
131. Heinonen I, Bucci M, Kemppainen J, Knuuti J, Nuutila P, Boushel R and Kalliokoski KK.
Regulation of subcutaneous adipose tissue blood flow during exercise in humans. Journal of applied
physiology (Bethesda, Md : 1985). 2012;112:1059-63.
133. Addison O, Marcus RL, Lastayo PC and Ryan AS. Intermuscular fat: a review of the
consequences and causes. International journal of endocrinology. 2014;2014:309570.
134. Christiansen T, Paulsen SK, Bruun JM, Overgaard K, Ringgaard S, Pedersen SB, Positano V and
Richelsen B. Comparable reduction of the visceral adipose tissue depot after a diet-induced weight loss
with or without aerobic exercise in obese subjects: a 12-week randomized intervention study. European
journal of endocrinology. 2009;160:759-67.
117
135. Murphy JC, McDaniel JL, Mora K, Villareal DT, Fontana L and Weiss EP. Preferential
reductions in intermuscular and visceral adipose tissue with exercise-induced weight loss compared with
calorie restriction. Journal of applied physiology (Bethesda, Md : 1985). 2012;112:79-85.
136. Avila JJ, Gutierres JA, Sheehy ME, Lofgren IE and Delmonico MJ. Effect of moderate intensity
resistance training during weight loss on body composition and physical performance in overweight older
adults. Eur J Appl Physiol. 2010;109:517-25.
137. Burnett D, Kluding P, Porter C, Fabian C and Klemp J. Cardiorespiratory fitness in breast cancer
survivors. SpringerPlus. 2013;2:1-7.
138. Ozemek C, Laddu DR, Lavie CJ, Claeys H, Kaminsky LA, Ross R, Wisloff U, Arena R and Blair
SN. An Update on the Role of Cardiorespiratory Fitness, Structured Exercise and Lifestyle Physical
Activity in Preventing Cardiovascular Disease and Health Risk. Prog Cardiovasc Dis. 2018;61:484-490.
139. Didier KD, Ederer AK, Reiter LK, Brown M, Hardy R, Caldwell J, Black C, Bemben MG and
Ade CJ. Altered Blood Flow Response to Small Muscle Mass Exercise in Cancer Survivors Treated With
Adjuvant Therapy. Journal of the American Heart Association. 2017;6:e004784.
140. Thompson RB, Tomczak CR and Haykowsky MJ. Evaluation of Cardiac, Vascular, and Skeletal
Muscle Function With MRI: Novel Physiological End Points in Cardiac Rehabilitation Research. Can J
Cardiol. 2016;32:S388-s396.
141. Mancini DM, Ferraro N, Tuchler M, Chance B and Wilson JR. Detection of abnormal calf muscle
metabolism in patients with heart failure using phosphorus-31 nuclear magnetic resonance. American
Journal of Cardiology. 1988;62:1234-1240.
142. Moon RB and Richards JH. Determination of intracellular pH by 31P magnetic resonance. The
Journal of biological chemistry. 1973;248:7276-8.
143. McCully KK, Kakihira H, Vandenborne K and Kent-Braun J. Noninvasive measurements of
activity-induced changes in muscle metabolism. Journal of biomechanics. 1991;24 Suppl 1:153-61.
144. Mathewson KW, Haykowsky MJ and Thompson RB. Feasibility and reproducibility of
measurement of whole muscle blood flow, oxygen extraction, and VO2 with dynamic exercise using
MRI. Magn Reson Med. 2015;74:1640-51.
145. Thompson RB, Pagano JJ, Mathewson KW, Paterson I, Dyck JR, Kitzman DW and Haykowsky
MJ. Differential Responses of Post-Exercise Recovery of Leg Blood Flow and Oxygen Uptake Kinetics
in HFpEF versus HFrEF. PLOS ONE. 2016;11:e0163513.
146. Yang E, Kirkham AA, Grenier J and Thompson RB. Measurement and correction of the bulk
magnetic susceptibility effects of fat: application in venous oxygen saturation imaging. Magn Reson Med.
2019;81:3124-3137.
147. Hernando D, Kellman P, Haldar JP and Liang ZP. Robust water/fat separation in the presence of
large field inhomogeneities using a graph cut algorithm. Magn Reson Med. 2010;63:79-90.
148. Godin G and Shephard RJ. A simple method to assess exercise behavior in the community.
Canadian journal of applied sport sciences Journal canadien des sciences appliquees au sport.
1985;10:141-6.
149. Myers J, Prakash M, Froelicher V, Do D, Partington S and Atwood JE. Exercise capacity and
mortality among men referred for exercise testing. N Engl J Med. 2002;346:793-801.
150. Argov Z, Lofberg M and Arnold DL. Insights into muscle diseases gained by phosphorus
magnetic resonance spectroscopy. Muscle Nerve. 2000;23:1316-34.
151. Quistorff B, Johansen L and Sahlin K. Absence of phosphocreatine resynthesis in human calf
muscle during ischaemic recovery. The Biochemical journal. 1993;291 ( Pt 3):681-6.
152. Forbes SC, Paganini AT, Slade JM, Towse TF and Meyer RA. Phosphocreatine recovery kinetics
following low- and high-intensity exercise in human triceps surae and rat posterior hindlimb muscles. Am
J Physiol Regul Integr Comp Physiol. 2009;296:R161-70.
153. Kemp GJ, Ahmad RE, Nicolay K and Prompers JJ. Quantification of skeletal muscle
mitochondrial function by 31P magnetic resonance spectroscopy techniques: a quantitative review. Acta
Physiol (Oxf). 2015;213:107-44.

118
154. Goodpaster BH, Thaete FL and Kelley DE. Thigh adipose tissue distribution is associated with
insulin resistance in obesity and in type 2 diabetes mellitus. Am J Clin Nutr. 2000;71:885-92.
155. Janssen I, Fortier A, Hudson R and Ross R. Effects of an energy-restrictive diet with or without
exercise on abdominal fat, intermuscular fat, and metabolic risk factors in obese women. Diabetes Care.
2002;25:431-8.
119
5.1 a) Figure Legends:
5.1 a) i: Figure 1: A) Experimental set up for plantarflexion exercise device. B) Image acquisition for
determination of lower-leg VO2, showing the typical location for imaging of the superficial
femoral vein and representative SvO2 and blood velocity images, at rest and immediately post-
exercise. In this subject, SvO2 ≈ 86% at rest and 57% post exercise, with corresponding blood
velocities of 7 cm/s and 25 cm/s.
5.1 a) ii: Figure 2: MR body composition acquisition and analysis by the modified Dixon fat-water separation
approach in the A) lower leg, B) thigh, and C) abdomen of a representative participant with low
intermuscular fat and in the D) lower leg, E) thigh and F) abdomen of a participant with high
intermuscular fat.
5.1 a) iii: Figure 3: Relationship between IMF: SM ratio and whole-body peak VO2 for the paraspinal, thigh and
lower leg muscle regions.

120
5.1 b) Figures:
5.1 b) i: Figure 1: A) Experimental set up for plantarflexion exercise device. B) Image
acquisition for determination of lower-leg VO2, showing the typical location for imaging of the
superficial femoral vein and representative SvO2 and blood velocity images, at rest and
immediately post-exercise. In this subject, SvO2 ≈ 86% at rest and 57% post exercise, with
corresponding blood velocities of 7 cm/s and 25 cm/s.
Figure 9 Experimental set-up for plantarflexion exercise and image acquisition for determination of lower-leg oxygen uptake
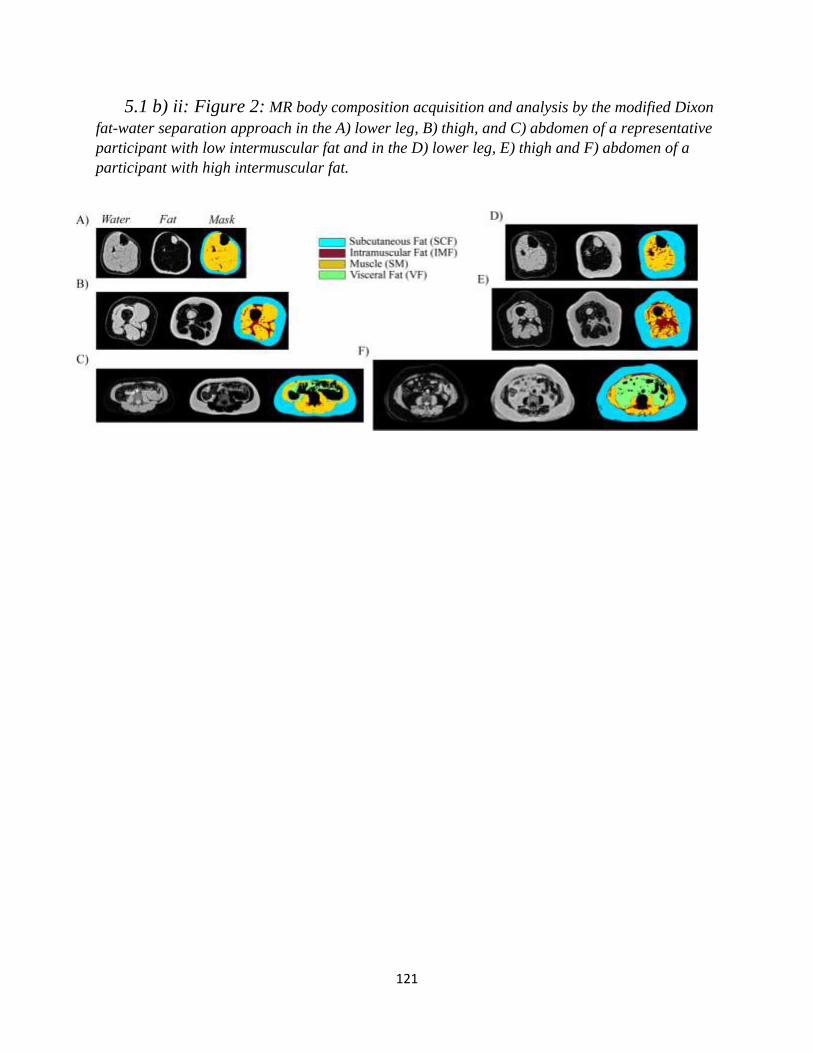
121
5.1 b) ii: Figure 2: MR body composition acquisition and analysis by the modified Dixon
fat-water separation approach in the A) lower leg, B) thigh, and C) abdomen of a representative
participant with low intermuscular fat and in the D) lower leg, E) thigh and F) abdomen of a
participant with high intermuscular fat.
Figure 10 MRI body composition acquisition and analysis
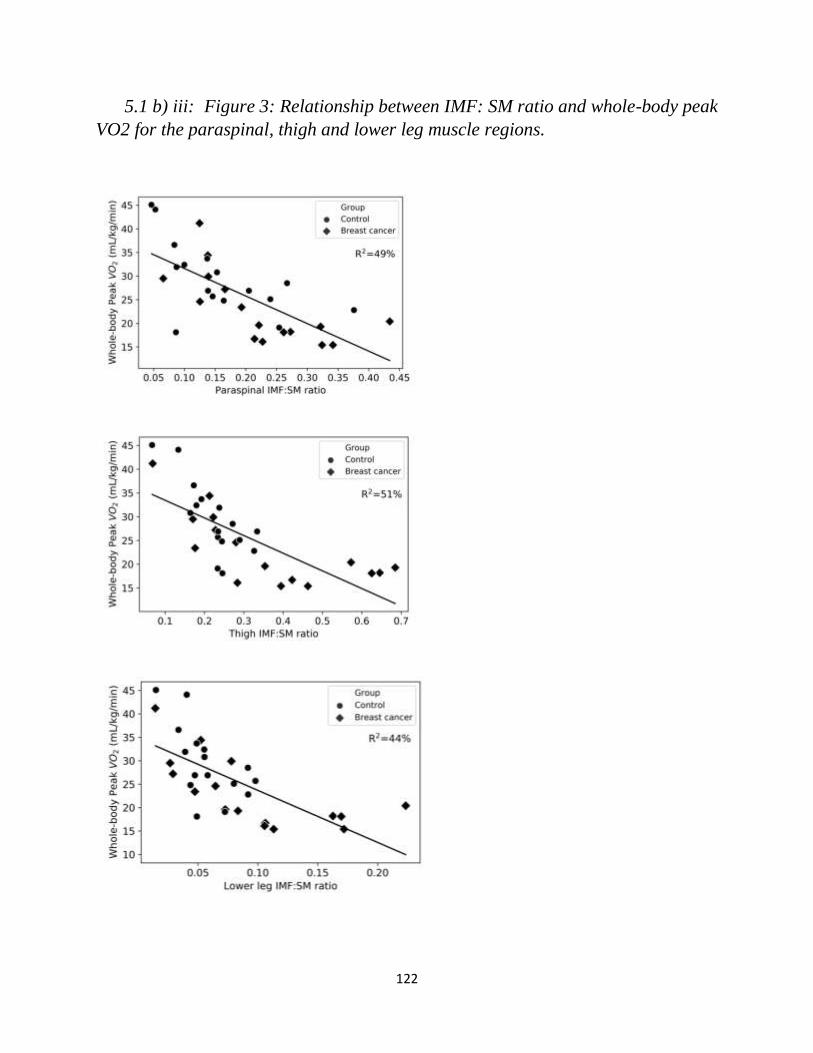
122
5.1 b) iii: Figure 3: Relationship between IMF: SM ratio and whole-body peak
VO2 for the paraspinal, thigh and lower leg muscle regions. Figure 11 Relationship between IMF:SM ratio and whole body peak oxygen uptake
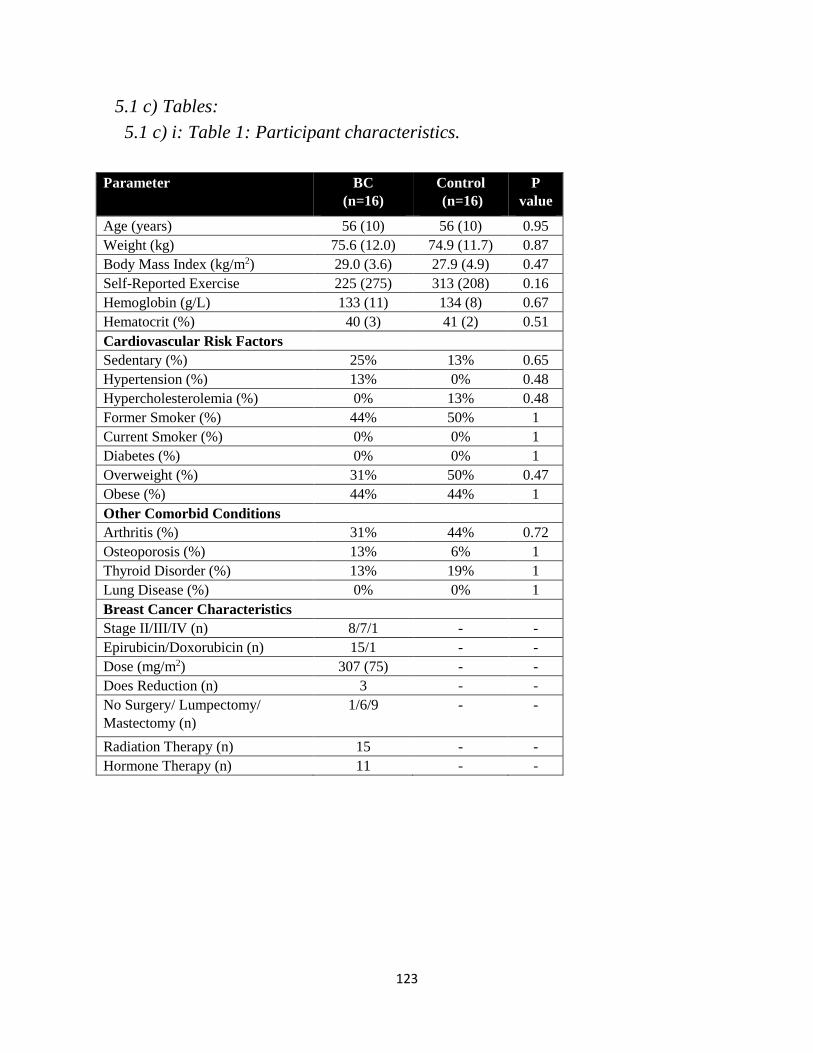
123
5.1 c) Tables:
5.1 c) i: Table 1: Participant characteristics. Table 9 Participant characteristics
Parameter BC
(n=16)
Control
(n=16)
P
value
Age (years) 56 (10) 56 (10) 0.95
Weight (kg) 75.6 (12.0) 74.9 (11.7) 0.87
Body Mass Index (kg/m2) 29.0 (3.6) 27.9 (4.9) 0.47
Self-Reported Exercise
(minutes/week)*
225 (275) 313 (208) 0.16
Hemoglobin (g/L) 133 (11) 134 (8) 0.67
Hematocrit (%) 40 (3) 41 (2) 0.51
Cardiovascular Risk Factors
Sedentary (%) 25% 13% 0.65
Hypertension (%) 13% 0% 0.48
Hypercholesterolemia (%) 0% 13% 0.48
Former Smoker (%) 44% 50% 1
Current Smoker (%) 0% 0% 1
Diabetes (%) 0% 0% 1
Overweight (%) 31% 50% 0.47
Obese (%) 44% 44% 1
Other Comorbid Conditions
Arthritis (%) 31% 44% 0.72
Osteoporosis (%) 13% 6% 1
Thyroid Disorder (%) 13% 19% 1
Lung Disease (%) 0% 0% 1
Breast Cancer Characteristics
Stage II/III/IV (n) 8/7/1 - -
Epirubicin/Doxorubicin (n) 15/1 - -
Dose (mg/m2) 307 (75) - -
Does Reduction (n) 3 - -
No Surgery/ Lumpectomy/
Mastectomy (n)
1/6/9 - -
Radiation Therapy (n) 15 - -
Hormone Therapy (n) 11 - -
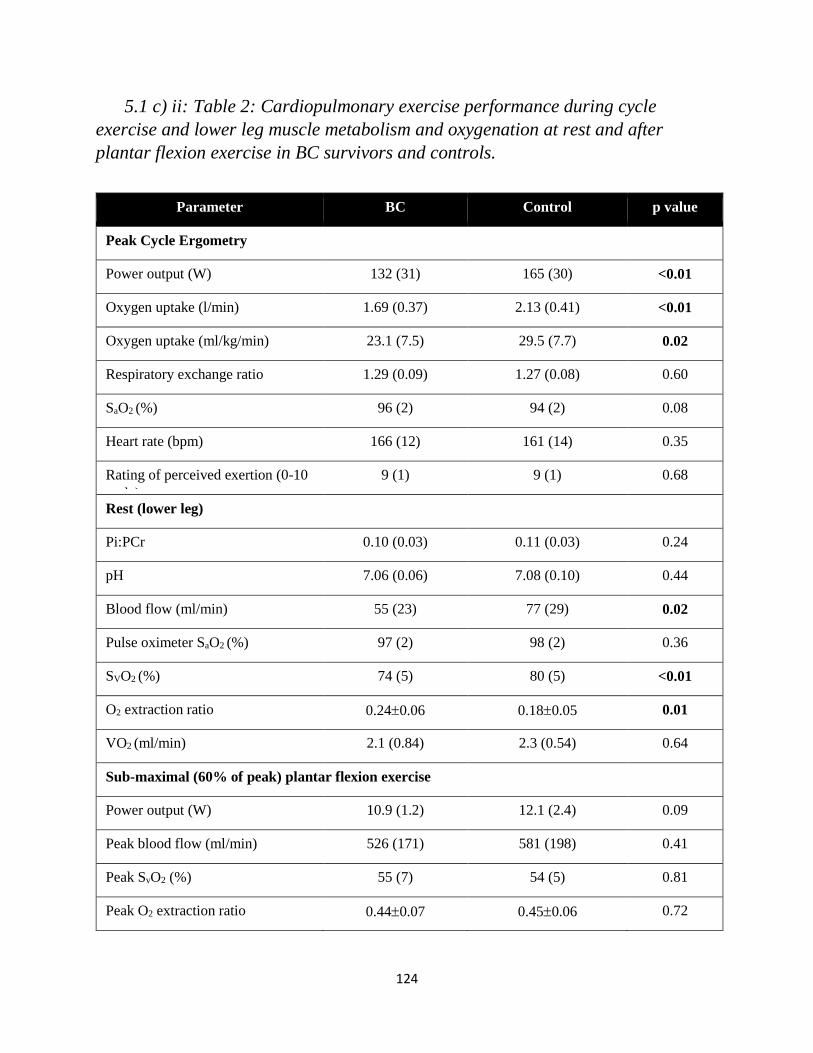
124
5.1 c) ii: Table 2: Cardiopulmonary exercise performance during cycle
exercise and lower leg muscle metabolism and oxygenation at rest and after
plantar flexion exercise in BC survivors and controls. Table 10 Cardiopulmonary exercise performance and lower leg muscle bioenergetics
Parameter BC Control p value
Peak Cycle Ergometry
Power output (W) 132 (31) 165 (30) <0.01
Oxygen uptake (l/min) 1.69 (0.37) 2.13 (0.41) <0.01
Oxygen uptake (ml/kg/min) 23.1 (7.5) 29.5 (7.7) 0.02
Respiratory exchange ratio 1.29 (0.09) 1.27 (0.08) 0.60
SaO2 (%) 96 (2) 94 (2) 0.08
Heart rate (bpm) 166 (12) 161 (14) 0.35
Rating of perceived exertion (0-10
scale)
9 (1) 9 (1) 0.68
Rest (lower leg)
Pi:PCr 0.10 (0.03) 0.11 (0.03) 0.24
pH 7.06 (0.06) 7.08 (0.10) 0.44
Blood flow (ml/min) 55 (23) 77 (29) 0.02
Pulse oximeter SaO2 (%) 97 (2) 98 (2) 0.36
SVO2 (%) 74 (5) 80 (5) <0.01
O2 extraction ratio 0.240.06 0.180.05 0.01
VO2 (ml/min) 2.1 (0.84) 2.3 (0.54) 0.64
Sub-maximal (60% of peak) plantar flexion exercise
Power output (W) 10.9 (1.2) 12.1 (2.4) 0.09
Peak blood flow (ml/min) 526 (171) 581 (198) 0.41
Peak SvO2 (%) 55 (7) 54 (5) 0.81
Peak O2 extraction ratio 0.440.07 0.450.06 0.72
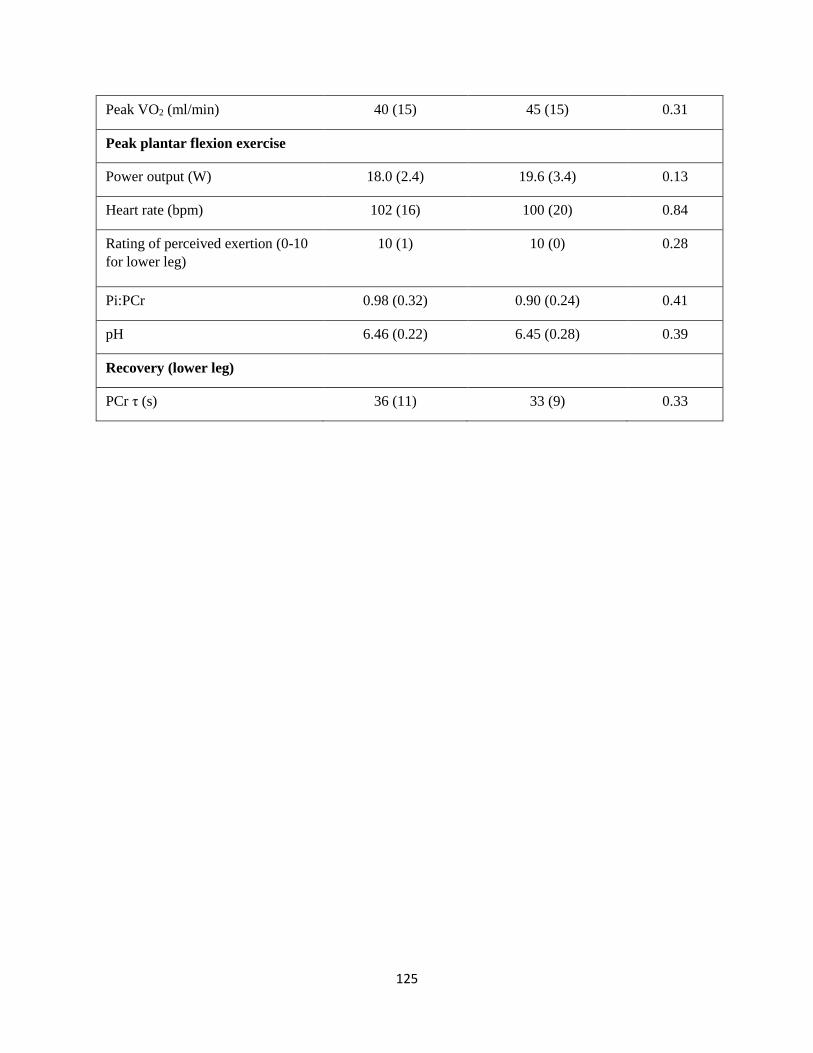
125
Peak VO2 (ml/min) 40 (15) 45 (15) 0.31
Peak plantar flexion exercise
Power output (W) 18.0 (2.4) 19.6 (3.4) 0.13
Heart rate (bpm) 102 (16) 100 (20) 0.84
Rating of perceived exertion (0-10
for lower leg)
10 (1) 10 (0) 0.28
Pi:PCr 0.98 (0.32) 0.90 (0.24) 0.41
pH 6.46 (0.22) 6.45 (0.28) 0.39
Recovery (lower leg)
PCr τ (s) 36 (11) 33 (9) 0.33

126
5.1 c) iii: Table 3: Body composition in the thigh, lower leg and abdomen.
*Thigh data is for 4 cm of transverse slices starting at 4 cm from distal end of
femur. †Lower leg data is for whole lower leg starting 5 cm below tibial plateau
until distal end of gastrocnemius.‡ Lumbar spine data is 1.2 cm section of
transverse images at the center of the third lumbar vertebrae.
Table 11 Body
composition of the thigh, lower leg and abdomen
Variable BC (n=16) Controls (n=16) P-value
Thigh* Total volume (mL) 75483 771147 0.70
Subcutaneous fat (g) 39783 420127 0.55
Muscle (g) 24953 26637 0.27
Intermuscular fat (g) 8231 5817 0.01
IMF:SM 0.360.19 0.220.07 0.01
SM fat fraction (%) 2510 185 0.02
Lower leg†
Total volume (mL) 1599285 1884395 0.03
Subcutaneous fat (g) 659189 787264 0.13
Muscle (g) 752149 903162 0.01
Intermuscular fat (g) 6532 5123 0.06
IMF:SM 0.100.06 0.060.02 0.03
SM fat fraction (%) 95 52 0.02
Abdomen‡
Total volume 1684471 1490473 0.25
Subcutaneous fat 897258 823379 0.52
Muscle 31339 34032 0.04
Intermuscular fat 6927 5328 0.13
IMF:SM 0.220.10 0.160.09 0.06
SM fat fraction 186 136 0.06
Visceral fat 406217 273+123 0.04
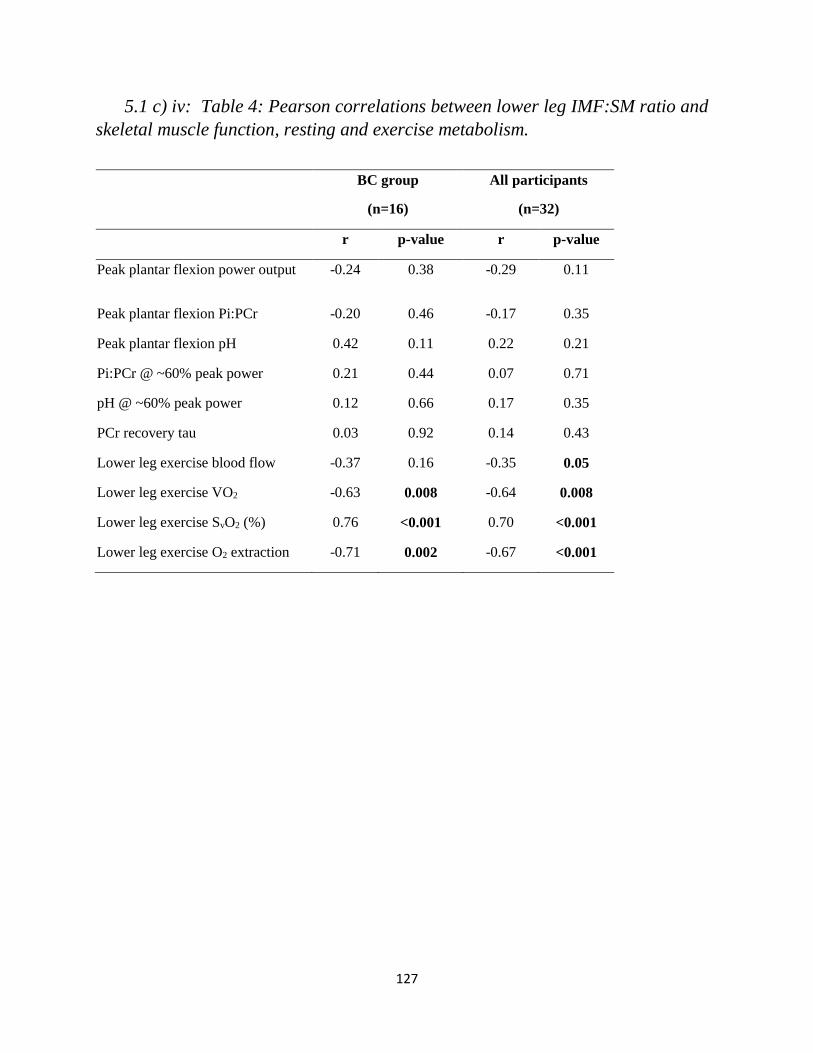
127
5.1 c) iv: Table 4: Pearson correlations between lower leg IMF:SM ratio and
skeletal muscle function, resting and exercise metabolism. Table 12 Pearson's correlations between lower leg IMF:SM ratio and skeletal muscle bioenergetics
BC group
(n=16)
All participants
(n=32)
r p-value r p-value
Peak plantar flexion power output -0.24 0.38 -0.29 0.11
Peak plantar flexion Pi:PCr -0.20 0.46 -0.17 0.35
Peak plantar flexion pH 0.42 0.11 0.22 0.21
Pi:PCr @ ~60% peak power 0.21 0.44 0.07 0.71
pH @ ~60% peak power 0.12 0.66 0.17 0.35
PCr recovery tau 0.03 0.92 0.14 0.43
Lower leg exercise blood flow -0.37 0.16 -0.35 0.05
Lower leg exercise VO2 -0.63 0.008 -0.64 0.008
Lower leg exercise SvO2 (%) 0.76 <0.001 0.70 <0.001
Lower leg exercise O2 extraction -0.71 0.002 -0.67 <0.001

128
6.1 Conclusion

129
Breast cancer (BC) mortality has decreased by more than 40% over the last three
decades.122 Accordingly, cardiovascular health is becoming an increasingly important focus
when planning cancer treatment, and care beyond antineoplastic therapy. Anthracyclines are
proven to provide a BC survivorship advantage, however, at the potential cost of cardiovascular
health.6 We developed and used non-invasive imaging technology to comprehensively
investigate pathophysiologic mechanisms leading to cardiovascular decline in BC survivorship.
The strongest predictor of all-cause and cardiovascular mortality in healthy and clinical
populations is VO2 peak, which is reduced by 20% in BC survivors relative to age- and sex-
matched control subjects. In Chapter 3, we demonstrate reduced VO2 peak in BC patients prior to
receipt of anthracycline chemotherapy. In these patients, using state of the art exercise cMRI we
found that peak cardiac output is reduced relative to controls. Importantly, the lower exercise
cardiac output was the result of reduced cardiac size rather than cardiac dysfunction, and was
evident in the absence of a cardiotoxic stimulus. Supine peak cardiac output was significantly
related to upright VO2 peak, but explained less than half of the variance in effect.
We further investigated VO2 peak deficits in BC survivors by studying non-cardiac,
peripheral determinants in Chapter 4. Using single leg knee extension exercise, where the
limiting role of the heart is minimized, we found that long-term BC survivors (12 years post
anthracycline therapy) had no decrement in peak work rate or leg blood flow, but had reduced
estimated quadriceps mass. The finding of preserved leg blood flow in the face of reduced
muscle mass implicates uncoupling of the former with oxygen use (i.e. inefficient delivery of
blood to active muscle). In Chapter 5, using novel MR strategies, we further investigated this
phenomenon to comprehensively measure leg composition, lower leg blood flow, and muscle
oxidative capacity. Specifically, BC survivors (>3 months post anthracycline therapy) and age-

130
and sex matched controls underwent incremental to maximal plantar flexion exercise, another
paradigm whereby the limiting role of the heart is minimized. Peak work rate, peak Pi:PCr ratio,
muscle acidity, and mitochondrial oxidative capacity in the lower leg as measured by 31PMRS
were not different between BC survivors and controls. Further, in response to submaximal
plantarflexion exercise, no differences were found in lower-leg blood flow, oxygen extraction or
VO2, despite a severe reduction in whole-body VO2 peak. However, BC survivors had poor body
composition relative to controls, as indicated by reduced muscle mass, increased adiposity, or an
unfavorable shift in the ratio of adipose tissue to skeletal muscle. Whole body VO2 peak was
strongly related to muscle composition; specifically, an inverse relationship was found between
the intermuscular fat (IMF) to skeletal muscle (SM) ratio and VO2 peak. An increased IMF:SM
ratio could impair VO2 peak through mechanisms including: 1) shunting of blood through IMF,
resulting in poor matching of blood flow to metabolic demand; 2) diffusive conductance
limitations resulting in impaired oxygen extraction; or 3) insulin resistance mediated
perturbations in oxidative SM function resulting in reduced oxygen utilization. The relationship
between IMF:SM ratio and VO2 peak was evident across BC and controls; BC had a greater
IMF:SM ratio in the thigh, the predominant source of oxygen consumption during
cardiopulmonary (cycle) exercise testing.
Taken together, our findings do not support a causal relationship between anthracycline
toxicity and exercise intolerance. Several studies report underlying VO2 peak deficits in BC prior
to receipt of anthracycline therapy, and we demonstrate that reductions in peak cardiac output are
present prior to anthracycline administration (Chapter 3).109, 124 Further, our findings do not
support unique peripheral mechanisms of anthracycline related exercise intolerance. Instead,
reduced VO2 peak was strongly linked to skeletal muscle mass and muscle composition, with a

131
propensity of BC survivors having higher adiposity and lower muscle mass relative to disease
and treatment naive control subjects. Importantly, neither this phenotype, nor the
cardiopulmonary effects of this phenotype are unique to BC (Chapter 5).
While we observed reduced VO2 peak prior to administration of anthracycline therapy,
there is convincing evidence of further reductions in VO2 peak from pre-to-post-therapy. Early
evidence is available to establish a working theory of physiologic mechanisms leading to
reduced VO2 peak in BC. First, Howden et al. reported that VO2 peak declined by 15% from pre (0
months) to post anthracycline therapy (4 months) in BC patients (n=14).156 Further, this decline
was attributed to a reduction in calculated arterial-venous oxygen content difference (a-vO2), as
peak cardiac output was unchanged by anthracycline therapy. In the same study, a group of BC
patients (n=14) underwent an exercise training intervention which maintained VO2 peak, by
preserving peak cardiac output and a-vO2 difference. Moreover, a subset of participants who
were followed up at 16 months, at which time changes in VO2 peak persisted from 4 months, but
did not worsen.123 By 16 months, peak cardiac output was significantly reduced as a result of
reduced biventricular ejection fraction and ejection fraction reserve. Notably, this change in peak
cardiac output indicates a “compensatory” increase in a-vO2 difference to preserve VO2 peak. One
interpretation of these findings is that aberrant peripheral changes occur, resulting in later cardiac
adaptation towards normal cardiac output to VO2 peak matching.
In support of this theory, one study is available providing information on muscle
composition and quality changes from pre-to-post-anthracycline therapy. Mijwel et al. provide
strong evidence of muscle deterioration using baseline and post-therapy vastus lateralis biopsy.31
In the usual care group, mitochondrial oxidative capacity and type I (oxidative) muscle fiber
cross-sectional area decreased. In the same study, intervention groups underwent resistance or
132
aerobic exercise training which preserved mitochondrial function and muscle fiber composition.
The authors proposed that changes observed in the usual care group were related to anthracycline
associated reductions in physical activity, rather than anthracycline myo-toxicity. Indeed, these
results align well with a study from nearly 2-decades earlier that found that adjuvant therapy was
associated with a reduction in physical activity without an accompanying reduction in caloric
intake, leading to muscle loss with net weight gain.27 The consequence of reduced muscle mass
and increased adiposity is reduced VO2 peak.
Taken together with our finding of a physiologic link between an increased IMF:SM ratio
and reduced VO2 peak, it is possible that peak cardiac output adapts to the minimal value needed
to meet peripheral demands. Indeed, we observed increasing VO2 peak with increasing cardiac
output (Chapter 3) as well as decreasing IMF:SM ratio (Chapter 5) independent of a history of
BC. Accordingly, preserving or improving body composition should be an important goal and
clinical endpoint when designing interventions to improve cardiovascular function in BC
survivorship. Critically, there is already a wealth of data demonstrating the efficacy of exercise
training to preserve or improve muscle composition in older women, while cardiac adaptation
presents a greater challenge.157-159 Data from Foulkes et al. demonstrating aberrant cardiac
changes only 12 months after completing therapy stresses the importance of initiating cardio-
protective and/or body composition protective exercise training interventions during, or
immediately after completion of adjuvant therapy.123 To this end, future studies are required to
test effectiveness of interventions at increasing VO2 peak and curving CV risk. In consideration of
clinical feasibility of an exercise intervention, strategies should consider the cost effectiveness,
the minimal amount of exercise needed to preserve cardiorespiratory fitness, patient feasibility,
and long term sustainability.
133
6.1 a) References 6. Kirkham AA, Beaudry RI, Paterson DI, Mackey JR and Haykowsky MJ. Curing breast cancer
and killing the heart: A novel model to explain elevated cardiovascular disease and mortality risk among
women with early stage breast cancer. Prog Cardiovasc Dis. 2019.
27. Demark-Wahnefried W, Peterson BL, Winer EP, Marks L, Aziz N, Marcom PK, Blackwell K and
Rimer BK. Changes in weight, body composition, and factors influencing energy balance among
premenopausal breast cancer patients receiving adjuvant chemotherapy. Journal of clinical oncology :
official journal of the American Society of Clinical Oncology. 2001;19:2381-9.
31. Mijwel S, Cardinale DA, Norrbom J, Chapman M, Ivarsson N, Wengstrom Y, Sundberg CJ and
Rundqvist H. Exercise training during chemotherapy preserves skeletal muscle fiber area, capillarization,
and mitochondrial content in patients with breast cancer. FASEB journal : official publication of the
Federation of American Societies for Experimental Biology. 2018;32:5495-5505.
109. Peel AB, Thomas SM, Dittus K, Jones LW and Lakoski SG. Cardiorespiratory Fitness in Breast
Cancer Patients: A Call for Normative Values. JOURNAL OF THE AMERICAN HEART ASSOCIATION.
2014;3:e000432.
122. Siegel RL, Miller KD and Jemal A. Cancer statistics, 2019. CA Cancer J Clin. 2019;69:7-34.
123. Foulkes S, Howden EJ, Bigaran A, Janssens K, Antill Y, Loi S, Claus P, Haykowsky MJ, Daly
RM, Fraser SF and La Gerche A. Persistent Impairment in Cardiopulmonary Fitness following Breast
Cancer Chemotherapy. Med Sci Sports Exerc. 2019.
124. Beaudry R, Howden, E., Foulkes, S., Bigaran, A., Claus, P., Haykowsky, M., La Gerche, A.
Determinants of Exercise Intolerance in Breast Cancer Patients Prior to Anthracycline Chemotherapy.
Physiological Reports. 2019;7:e13971.
156. Howden E, Bigaran, A., Beaudry, R., Fraser, S., Selig, S., Foulkes, S., Antil, A., Nightingale, S.,
Loi, S., Haykowsky, M., La Gerche, A. Exercise as a diagnostic and therapeutic tool for the prevention of
functional disability in breast cancer patients. European Journal of Preventive Cardiology (Accepted).
2018.
157. Hersey WC, 3rd, Graves JE, Pollock ML, Gingerich R, Shireman RB, Heath GW, Spierto F,
McCole SD and Hagberg JM. Endurance exercise training improves body composition and plasma insulin
responses in 70- to 79-year-old men and women. Metabolism. 1994;43:847-54.
158. Peterson MD, Sen A and Gordon PM. Influence of resistance exercise on lean body mass in aging
adults: a meta-analysis. Medicine and science in sports and exercise. 2011;43:249-258.
159. Howden EJ, Sarma S, Lawley JS, Opondo M, Cornwell W, Stoller D, Urey MA, Adams-Huet B
and Levine BD. Reversing the Cardiac Effects of Sedentary Aging in Middle Age—A Randomized
Controlled Trial: Implications For Heart Failure Prevention. Circulation. 2018;137:1549-1549.

134
7.1 Appendix

135
7.1 a) Chapter 3 Data Supplement
0
25
50
75
Age
(Ye
ars)
1
1.5
2
2.5B
od
y Su
rfac
e A
rea
(m²)
15
25
35
45
Bo
dy
Mas
s In
dex
(Kg
/m²)
Supplemental Figure 1:
Distributions of participant characteristics for A)
age, B) body mass index and C) body surface area.
No differences were found between BC subgroups,
or BC subgroups and healthy controls.
A
B
C

136
10
20
30
40
Peak
VO
2
(ml/
kg/m
in)
1
2
3
Peak
VO
2 (l
/min
)
45
60
75
90
105
LV E
DV
(m
l/m²)
9
12
15
18
21
Peak
Car
dia
c O
utp
ut
(l/m
in)
10
20
30
40
Pre
dic
ted
VO
2
(ml/
kg/m
in)
Supplemental Figure 2:
Distributions of A) predicted peak VO2, B) absolute
peak VO2 C) relative VO2 D) left ventricular end-
diastolic volume and E) peak cardiac output No
differences were found between BC subgroups. Both
subgroups were significantly different (p<0.01)
versus controls for all variables.
A
B C
D E
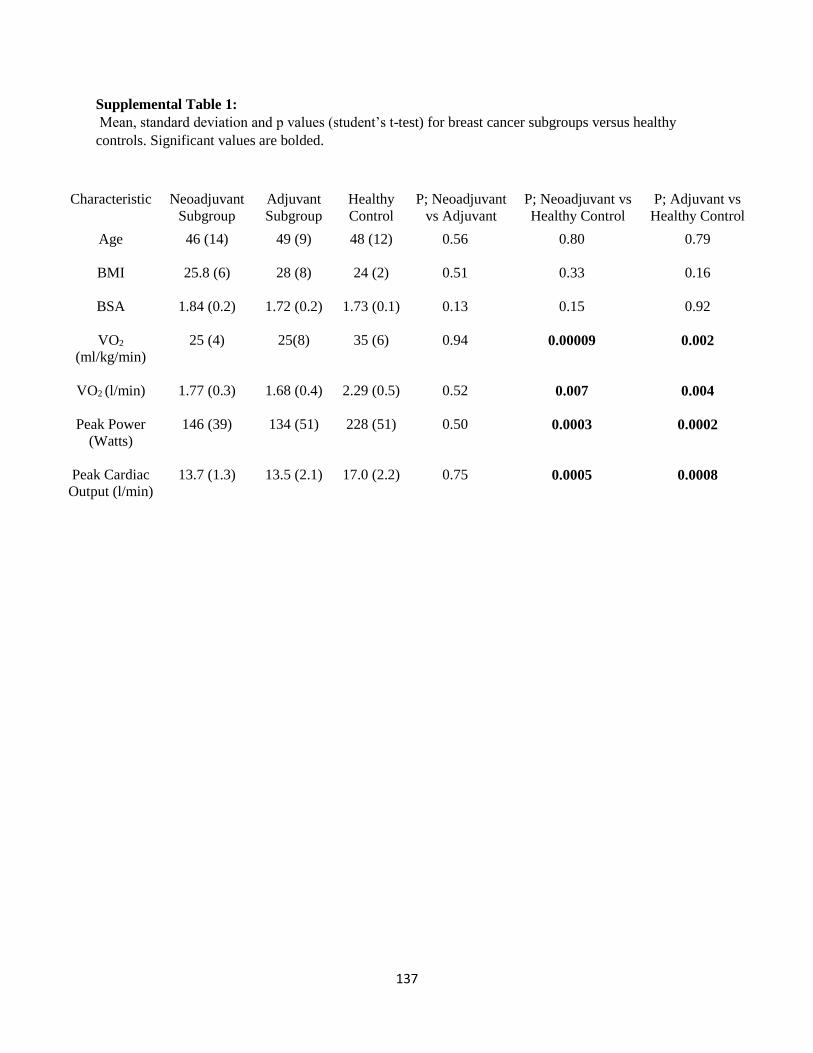
137
Supplemental Table 1:
Mean, standard deviation and p values (student’s t-test) for breast cancer subgroups versus healthy
controls. Significant values are bolded.
Characteristic Neoadjuvant
Subgroup
Adjuvant
Subgroup
Healthy
Control
P; Neoadjuvant
vs Adjuvant
P; Neoadjuvant vs
Healthy Control
P; Adjuvant vs
Healthy Control
Age
46 (14) 49 (9) 48 (12) 0.56 0.80 0.79
BMI
25.8 (6) 28 (8) 24 (2) 0.51 0.33 0.16
BSA
1.84 (0.2) 1.72 (0.2) 1.73 (0.1) 0.13 0.15 0.92
VO2
(ml/kg/min)
25 (4) 25(8) 35 (6) 0.94 0.00009 0.002
VO2 (l/min)
1.77 (0.3) 1.68 (0.4) 2.29 (0.5) 0.52 0.007 0.004
Peak Power
(Watts)
146 (39) 134 (51) 228 (51) 0.50 0.0003 0.0002
Peak Cardiac
Output (l/min)
13.7 (1.3) 13.5 (2.1) 17.0 (2.2) 0.75 0.0005 0.0008