Path Plots and Automated Post Processing in … Advantage CAE Associates are the leading simulation...
50
Path Plots and Automated Post Automated Post Processing in MADPL and MADPL and Workbench 6/20/2012 CAE Associates Inc. and ANSYS Inc. Proprietary © 2012 CAE Associates Inc. and ANSYS Inc. All rights reserved.
Transcript of Path Plots and Automated Post Processing in … Advantage CAE Associates are the leading simulation...

Path Plots and Automated Post Automated Post
Processing in MADPL and MADPL and Workbench
6/20/2012
CAE Associates Inc. and ANSYS Inc. Proprietary© 2012 CAE Associates Inc. and ANSYS Inc. All rights reserved.
Introduction
CAE Associates Inc. and ANSYS Inc. Proprietary© 2012 CAE Associates Inc. and ANSYS Inc. All rights reserved.
Engineering Advantage
CAE Associates are the leading simulation engineers in the North East CAE Associates are the leading simulation engineers in the North East region. With global reach and local focus, we have been assisting, best in class, engineers since 1981 and chosen by ANSYS to be one of the original 4 exclusive Channel Partners in 1985. (Over 250 today…)original 4 exclusive Channel Partners in 1985. (Over 250 today…)
CAE integrates simulation and analysis solutions into their client's projects as well as into their client's portfolio of skills.
3

How CAEA Works with your Company
We offer tailored solutions to work We offer tailored solutions to work within your timing, budget and manpower guidelines by identifying:
— Consulting Services to assist and/or solve your simulation needs
— Software Solutions to match your user needs
— Training to ensure you maximize yourTraining to ensure you maximize your investment
— One on one "Jump-Start" mentoring customized around your projectFle ible partnering options to ork— Flexible partnering options to work with you in any way that will help you achieve your simulation goals
4
Engineering Advantage
CAE Associates brings unmatched simulation expertise from a team that CAE Associates brings unmatched simulation expertise from a team that utilizes simulation tools on a daily basis. This team, with an average of 15+ years of practical experience and all holding advanced degrees, doubles as your direct support line, no call center, just timely response foras your direct support line, no call center, just timely response for successful results.
5

CAEA Technical Staff
Nicholas M. Veikos, Ph.D., President
Peter R. Barrett, M.S.C.E., P.E., Vice President
Michael Bak, Ph.D., Sr. Engineering Manager
P t i k C i h M S M E S E i i MPatrick Cunningham, M.S.M.E., Sr. Engineering Mgr.
James Kosloski, M.S.M.E., Sr. Engineering Manager
Steven Hale, M.S.M.E., Sr. Engineering Manager, , g g g
Hsin-Hua Tsuei, Ph.D., CFD Manager
George Bauer, M.S.M.E., Engineering Manager
Eric Stamper, M.S.M.E., Project Manager
Michael Kuron, M.S.M.E., Project Manager
Reni Raju Ph D Project ManagerReni Raju, Ph.D, Project Manager
Lawrence L. Durocher, Ph.D., Director
6
ANSYS Technical Support
CAE Associates provides ANSYS hotline support to over 150 different CAE Associates provides ANSYS hotline support to over 150 different companies, including two of the world's biggest ANSYS users.
Our Clients have chosen us above all others because of our practical, technical knowledge of both the ANSYS software and their engineeringtechnical knowledge of both the ANSYS software and their engineering applications.
We handle upwards of 99% of the questions ourselves with same day responseresponse.
7

Training Center In Middlebury, CT
8
Training Classes
Introduction to ANSYS Mechanical Multiphysics Simulation for MEMS Introduction to ANSYS Mechanical APDL Part I
Introduction to ANSYS Mechanical APDL Part II
Multiphysics Simulation for MEMS Advanced Structural Material
Nonlinearities Random Vibration
Introduction to ANSYS Mechanical ANSYS DesignModeler CFD Fundamentals
Random Vibration ANSYS/LS-Dyna (Explicit Dynamics) Advanced ANSYS Modeling &
Meshing Introduction to CFX Introduction to ICEM Meshing Heat Transfer
g FEA Fundamentals FEA Best Practices ANSYS Customization &
Structural Nonlinearities Modeling Contact with ANSYS Dynamics
Programming (APDL) Introduction to AUTODYN Introduction to CivilFEMy
Introduction to Fatigue and Fracture ANSYS Composite PrepPost
Multiple Customized Training Programs
9
CAEA Averages Over 100 Classes Annually

Mentoring and Consulting Specialties
Structural Analysis Structural Analysis— Linear and Nonlinear— Static and Dynamic
Implicit and Explicit Dynamics— Implicit and Explicit Dynamics Thermal Analysis
— Linear and NonlinearSt d St t d T i t— Steady-State and Transient
— Coupled Thermal-Flow CFD
— Aerodynamics analysis, Flowfield analysis— Turbo machinery, Propulsion — Chemical reacting flows, Physical models
Custom Software Development
10

Path Plots
CAE Associates Inc. and ANSYS Inc. Proprietary© 2012 CAE Associates Inc. and ANSYS Inc. All rights reserved.

Path Operations in MAPDL
One useful way to review results is via path operations which allow you to: One useful way to review results is via path operations, which allow you to:— Map results data onto an arbitrary “path” through the model.— Perform mathematical operations along the path, including integration and
differentiationdifferentiation.— Display a “path plot” — see how a result item varies along the path.
Available only for models containing 2D or 3D solid elements or shell elementselements.
12

Path Operations
Three steps to produce a path plot: Three steps to produce a path plot:1. Define a path.2. Map data onto the path.3 Plot the data3. Plot the data.
1. Define a path:— Requires the following information:
• Points defining the path (2 to 1000). You can use existing nodes, locations on the working plane or locations in the global cartesian system.
• Path curvature determined by the active coordinate system (CSYS)Path curvature, determined by the active coordinate system (CSYS).• A name for the path.
13
Path Operations
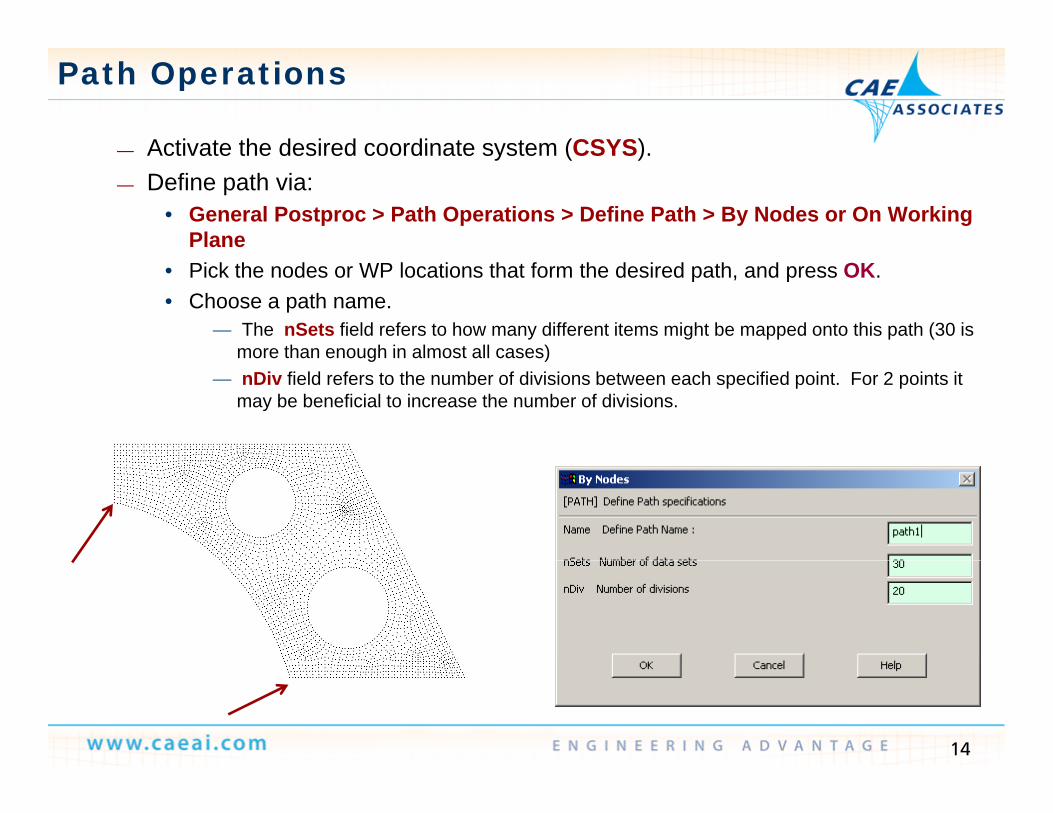
Activate the desired coordinate system (CSYS)— Activate the desired coordinate system (CSYS).— Define path via:
• General Postproc > Path Operations > Define Path > By Nodes or On Working Plane
• Pick the nodes or WP locations that form the desired path, and press OK.• Choose a path name.
— The nSets field refers to how many different items might be mapped onto this path (30 is more than enough in almost all cases)more than enough in almost all cases)
— nDiv field refers to the number of divisions between each specified point. For 2 points it may be beneficial to increase the number of divisions.
14

Path Operations
2 Map data onto path:2. Map data onto path:— Choose the desired quantity, such as S1, and enter a label to be used on plots
and listings:• General Postproc > Path Operations > Map onto Path (or PDEF command)General Postproc Path Operations Map onto Path (or PDEF command)
— You can now display the path if needed.• General Postproc > Path Operations > Plot Paths• (or issue /PBC,PATH,1 followed by NPLOT or EPLOT)
15

Path Operations
By default there are 3 data items defined for each path By default there are 3 data items defined for each path.— XG, YG, ZG: Global coordinates of each path point— S: Distance along the path.
16

Path Operations
Plot the data: Plot the data:— You can plot path items either on a graph:
• PLPATH or General Postproc > Path Operations > Plot Path Item > On Graph• The data is always plotted vs S (distance along path)The data is always plotted vs. S (distance along path).
— Or along path geometry:• PLPAGM or General Postproc > Path Operations > Plot Path Item > On
Geometry
17

Path Operations
ANSYS allows you to define multiple paths, each with a unique name that you assign. Only one path can be active at a time.
— To change the active path use • Recall Path
Besides plots and listings, there are many other path biliti i l dicapabilities, including:
— Stress linearization — used in the pressure vessel industry to decompose stress along a path into its membrane and bending componentsmembrane and bending components.
— Calculus functions — used in fracture mechanics to calculate J-integrals and stress concentration factors. Also useful in thermal analyses to calculate the heat ylost or gained across a path.
— Dot products and cross products — used widely in electromagnetics analyses to operate on vector
titi
18
quantities.

Stress Linearization
When doing stress linearization the path MUST be defined by 2 nodes When doing stress linearization, the path MUST be defined by 2 nodes.— If you try to do a stress linearization on a path defined by coordinates, you will
get an error:
The path must also be completely contained in the model. I.e. it cannot pass through a hole or gappass through a hole, or gap.
— If there are gaps in the path you will get an error:
19

Stress Linearization
For stress linearization the section path is defined by the two end nodes For stress linearization, the section path is defined by the two end nodes, and by 47 intermediate points that are automatically determined by linear interpolation in the active display coordinate system.
— The number and location of the intermediate points are not affected by the— The number and location of the intermediate points are not affected by the number of divisions set by PATH,,,,nDiv.
20
Stress Linearization
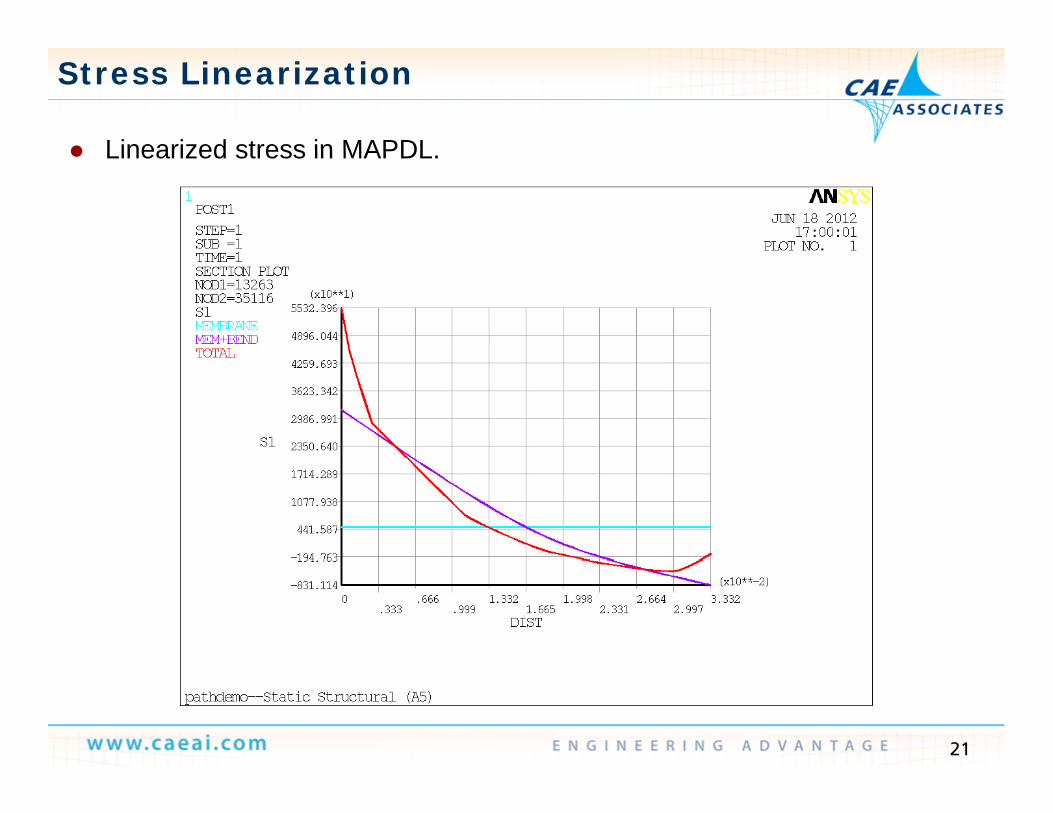
Linearized stress in MAPDL Linearized stress in MAPDL.
21
Listing Paths
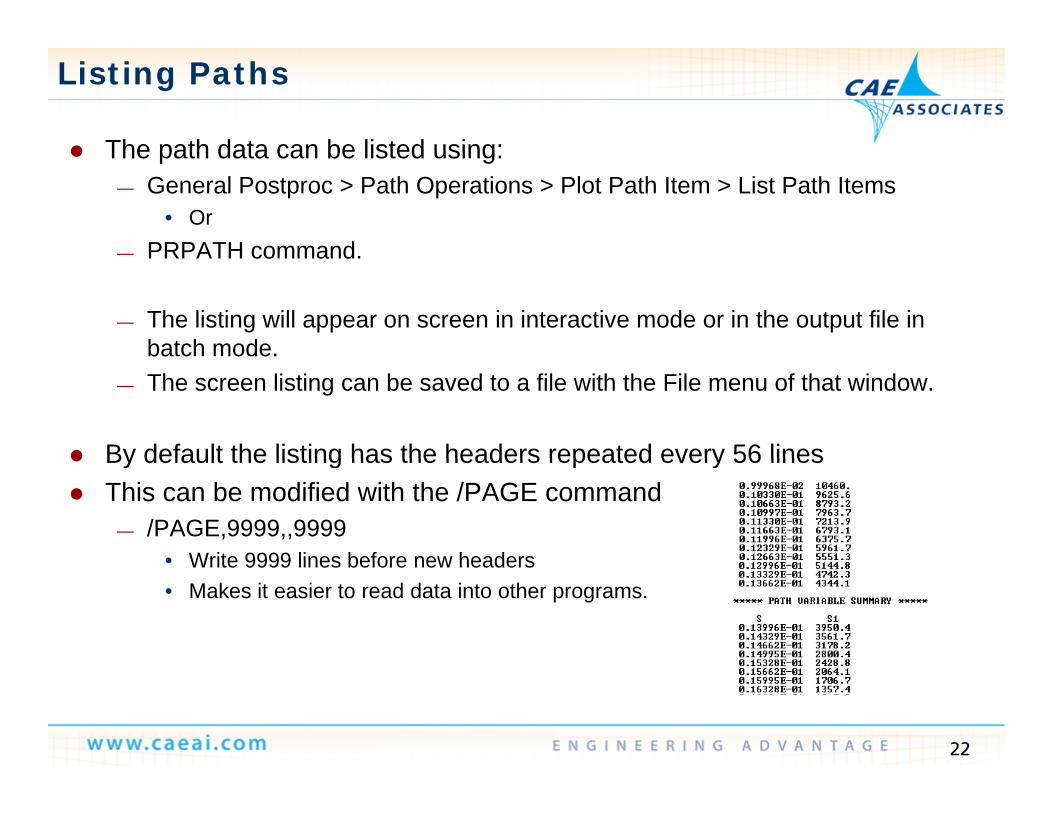
The path data can be listed using: The path data can be listed using:— General Postproc > Path Operations > Plot Path Item > List Path Items
• OrPRPATH command— PRPATH command.
— The listing will appear on screen in interactive mode or in the output file in batch mode.batch mode.
— The screen listing can be saved to a file with the File menu of that window.
By default the listing has the headers repeated every 56 lines By default the listing has the headers repeated every 56 lines This can be modified with the /PAGE command
— /PAGE,9999,,9999• Write 9999 lines before new headers• Write 9999 lines before new headers• Makes it easier to read data into other programs.
22
Path Automation
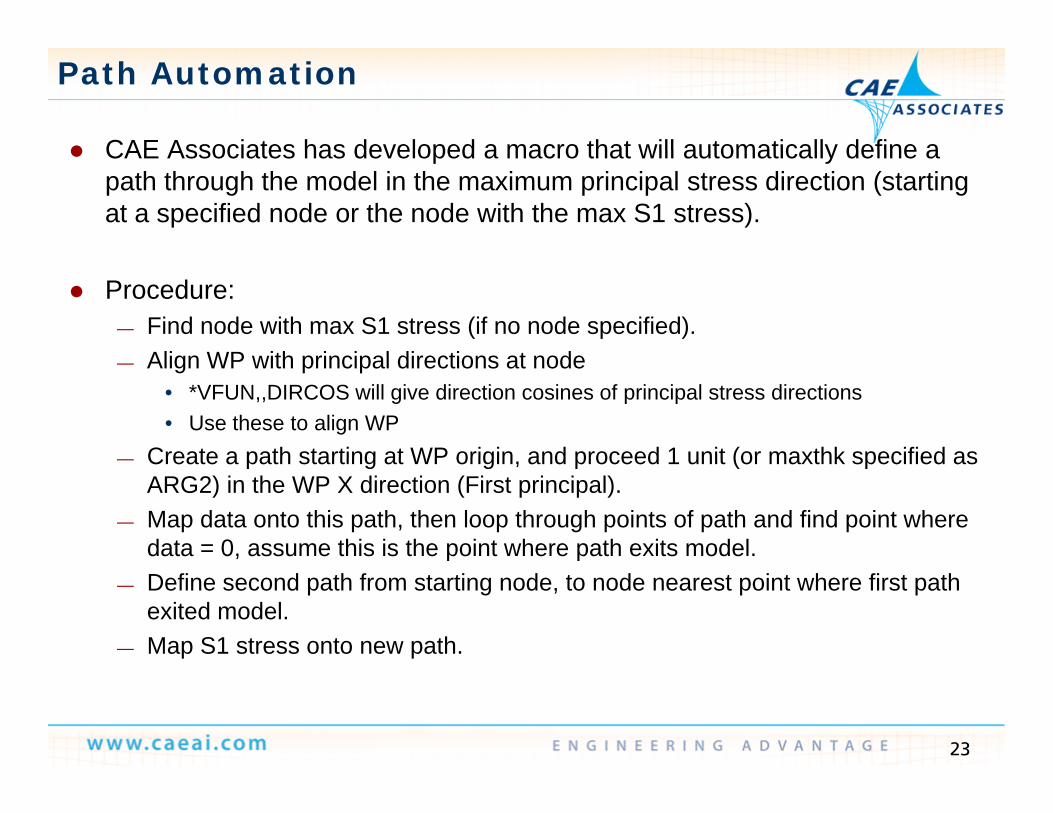
CAE Associates has developed a macro that will automatically define a CAE Associates has developed a macro that will automatically define a path through the model in the maximum principal stress direction (starting at a specified node or the node with the max S1 stress).
Procedure:— Find node with max S1 stress (if no node specified).
Ali WP ith i i l di ti t d— Align WP with principal directions at node• *VFUN,,DIRCOS will give direction cosines of principal stress directions• Use these to align WP
Create a path starting at WP origin and proceed 1 unit (or maxthk specified as— Create a path starting at WP origin, and proceed 1 unit (or maxthk specified as ARG2) in the WP X direction (First principal).
— Map data onto this path, then loop through points of path and find point where data = 0, assume this is the point where path exits model.p p
— Define second path from starting node, to node nearest point where first path exited model.
— Map S1 stress onto new path.
23

Paths in WB
Similarly paths can be defined in the Workbench Mechanical interface Similarly paths can be defined in the Workbench Mechanical interface.— In Mechanical, paths are considered construction geometry.— To create a path, first insert the Construction Geometry Item to the tree.
Then under construction geometry insert a path— Then under construction geometry insert a path
24
In Mechanical paths can be defined by:
Paths in WB
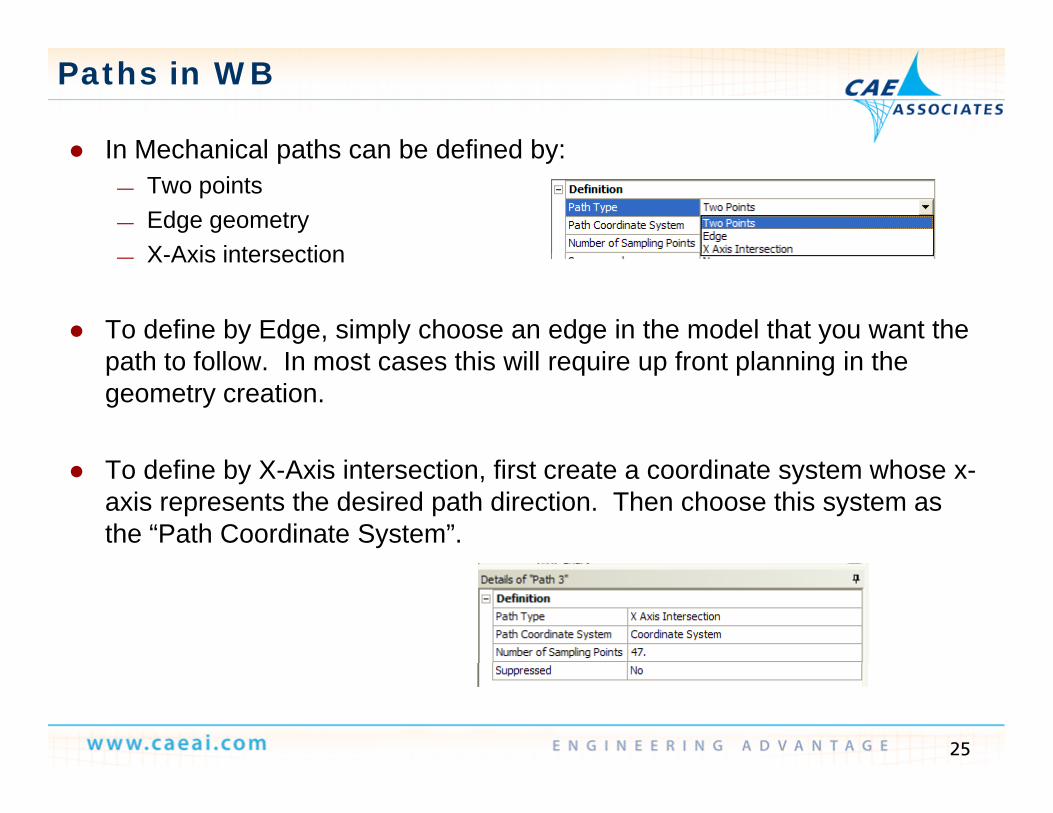
In Mechanical paths can be defined by:— Two points— Edge geometry
X Axis intersection— X-Axis intersection
To define by Edge, simply choose an edge in the model that you want the th t f ll I t thi ill i f t l i i thpath to follow. In most cases this will require up front planning in the
geometry creation.
To define by X-Axis intersection, first create a coordinate system whose x-axis represents the desired path direction. Then choose this system as the “Path Coordinate System”.
25

To define by two points the user must select the beginning and ending
Paths in WB
To define by two points, the user must select the beginning and ending point for the path by clicking on items in the model, or typing in coordinates in the specified coordinate system.
— Clicking on a geometry item will center the point at the centroid of that— Clicking on a geometry item will center the point at the centroid of that geometry.
Selecting this surface centers the path point
h CG f hat the CG of the cylindrical surface
Selecting this edge l t th thlocates the path point at the arc center.
26

Paths in WB
To define a path at a more arbitrary location it is necessary to switch to To define a path at a more arbitrary location it is necessary to switch to coordinate picking mode.
Then any arbitrary location in the model can be chosen.— Locations must be on the model geometry.— The path end points can be forced to use an actual node in the model by right
click and choose “snap to mesh nodes”.— It may also help to display the mesh
27

Paths in WB
Warning when defining the path using two points only the coordinates of Warning, when defining the path using two points, only the coordinates of the points are saved.
If the geometry is updated, the paths are not updated to move with the geometry even if a vertex line or surface was selected to define the endgeometry, even if a vertex, line or surface was selected to define the end points.
If you want a path to move with geometry updates, create coordinate you a t a pat to o e t geo et y updates, c eate coo d atesystems associated with geometry and define the path using these coordinate systems.
28

Paths in WB
To use a path in Mechanical you must scope a result item to the path To use a path in Mechanical, you must scope a result item to the path.— By default result items are scoped to “All Bodies”.— After inserting the desired item (i.e. Max Principal Stress), change the Scoping
Method to “Path”Method to Path
— Then choose the path form the drop down list.
29

Paths in WB
When adding a Linearized Stress item the scoping method is automatically When adding a Linearized Stress item the scoping method is automatically set to “Path”.
30
Paths in WB
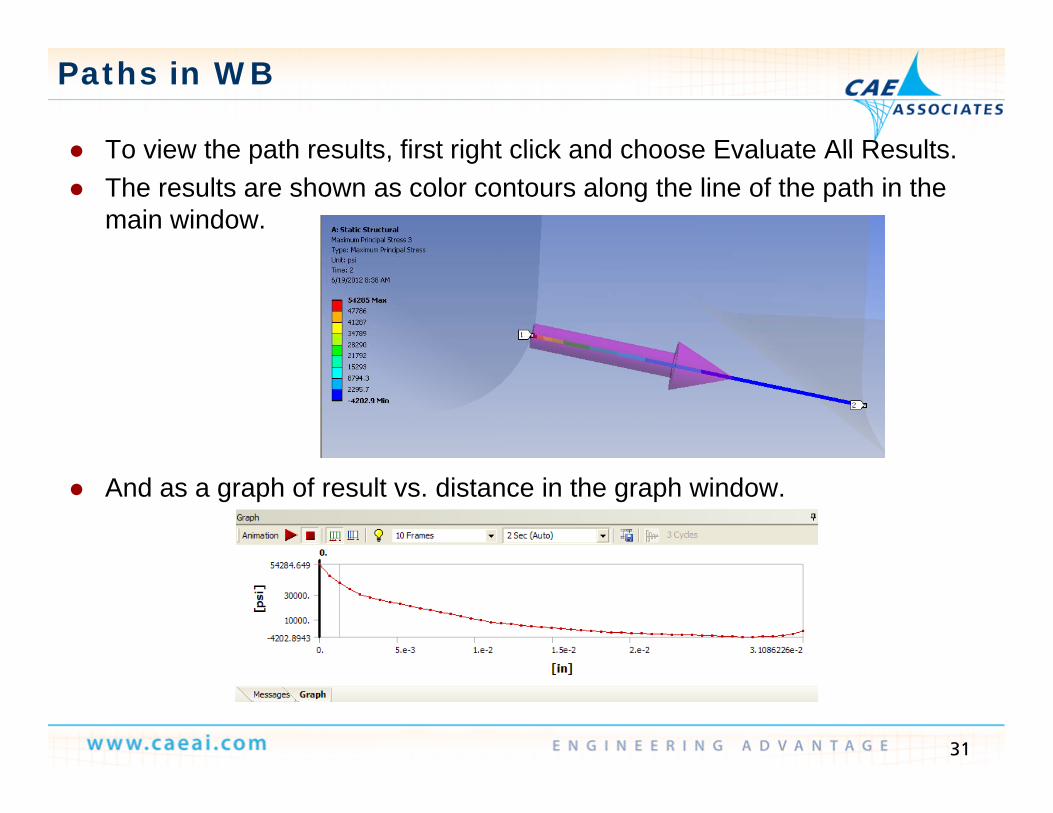
To view the path results first right click and choose Evaluate All Results To view the path results, first right click and choose Evaluate All Results. The results are shown as color contours along the line of the path in the
main window.
And as a graph of result vs. distance in the graph window.
31

Paths in WB
To compare results of two different paths the chart tool can be used: To compare results of two different paths, the chart tool can be used:
Once the chart is added, you can select multiple items in the tree to compare;
32
Saving Images
CAE Associates Inc. and ANSYS Inc. Proprietary© 2012 CAE Associates Inc. and ANSYS Inc. All rights reserved.

Saving Plots as Image Files
In both MAPDL and Workbench plots can be saved as image files In both MAPDL and Workbench plots can be saved as image files. In MAPDL use:
— PlotCtrls > Redirect Plots > To JPEG File• Or any of the other image file options• Or any of the other image file options.
Recommended to set:Q lit 100— Quality = 100
— Force White BG and Black FG = On
34
Saving Plots as Image Files
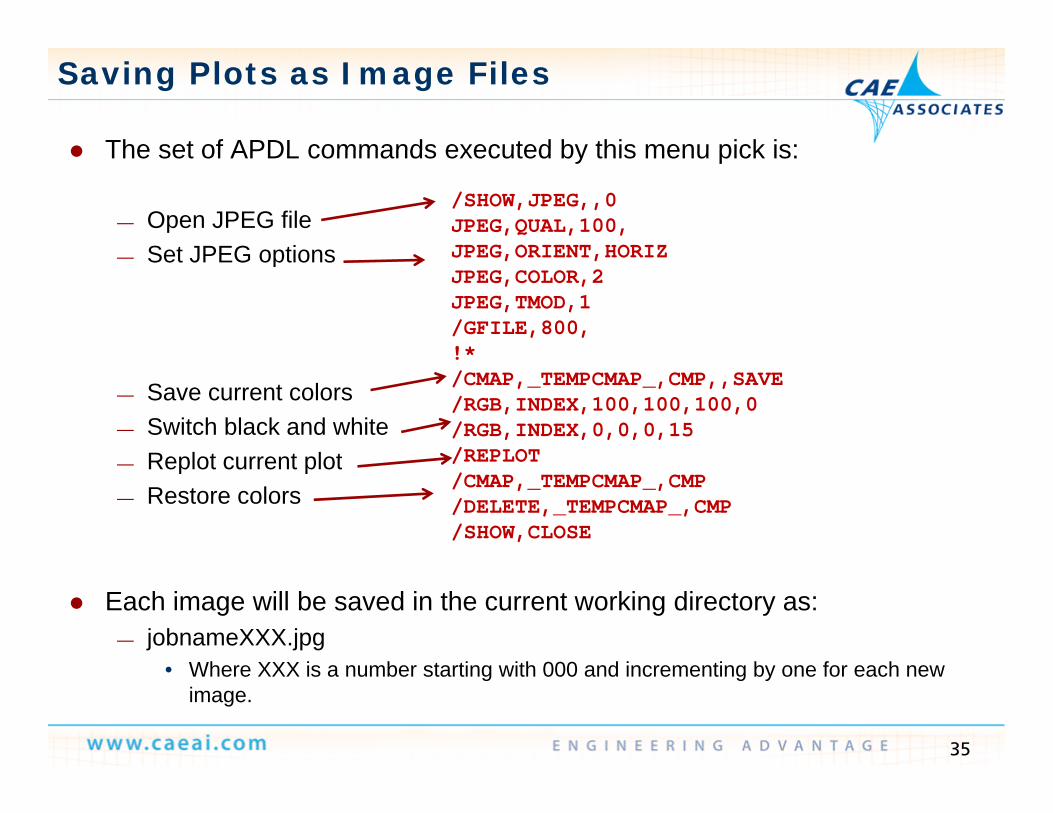
The set of APDL commands executed by this menu pick is: The set of APDL commands executed by this menu pick is:
— Open JPEG fileSet JPEG options
/SHOW,JPEG,,0 JPEG,QUAL,100, JPEG ORIENT HORIZ— Set JPEG options JPEG,ORIENT,HORIZ JPEG,COLOR,2JPEG,TMOD,1 /GFILE,800, !*
— Save current colors— Switch black and white
Replot current plot
! /CMAP,_TEMPCMAP_,CMP,,SAVE /RGB,INDEX,100,100,100,0/RGB,INDEX,0,0,0,15 /REPLOT— Replot current plot
— Restore colors
/REPLOT /CMAP,_TEMPCMAP_,CMP/DELETE,_TEMPCMAP_,CMP /SHOW,CLOSE
Each image will be saved in the current working directory as:— jobnameXXX.jpg
Wh XXX i b t ti ith 000 d i ti b f h
35
• Where XXX is a number starting with 000 and incrementing by one for each new image.
Saving Plots as Image Files
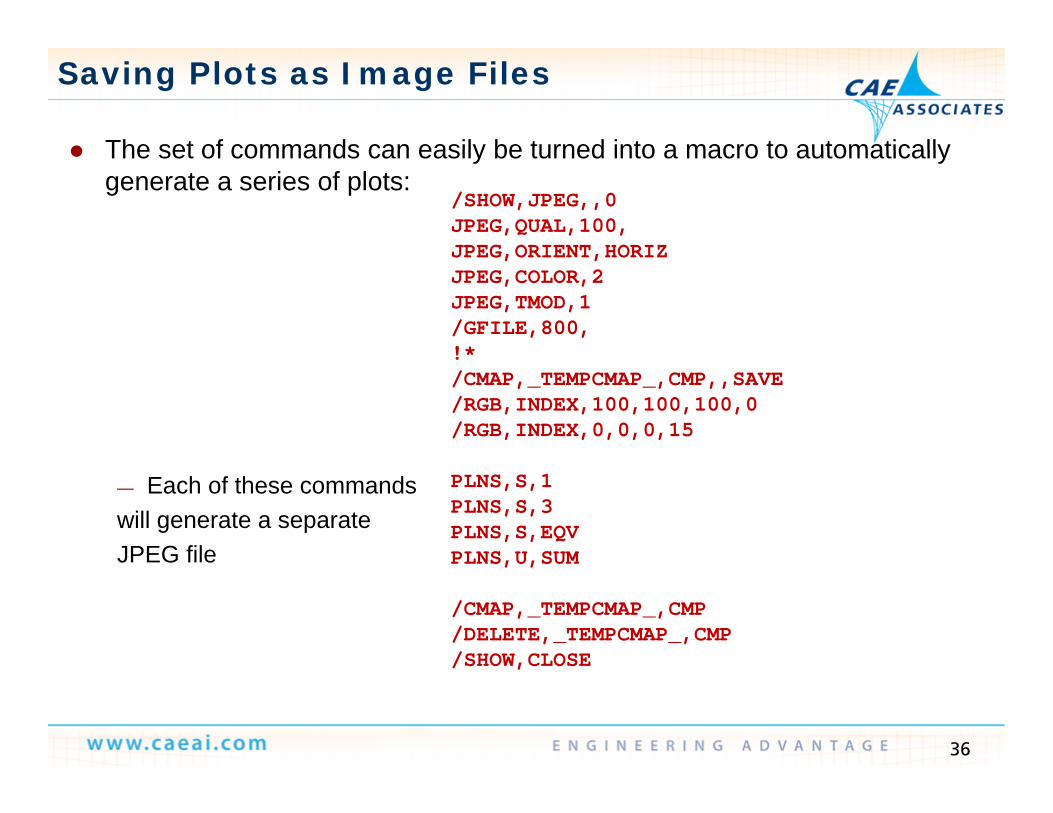
The set of commands can easily be turned into a macro to automatically The set of commands can easily be turned into a macro to automatically generate a series of plots:
/SHOW,JPEG,,0 JPEG,QUAL,100, JPEG ORIENT HORIZJPEG,ORIENT,HORIZ JPEG,COLOR,2JPEG,TMOD,1 /GFILE,800, !*! /CMAP,_TEMPCMAP_,CMP,,SAVE /RGB,INDEX,100,100,100,0/RGB,INDEX,0,0,0,15
— Each of these commandswill generate a separate JPEG file
PLNS,S,1PLNS,S,3PLNS,S,EQVPLNS U SUMJPEG file PLNS,U,SUM
/CMAP,_TEMPCMAP_,CMP/DELETE,_TEMPCMAP_,CMP /SHOW,CLOSE
36
/SHOW,CLOSE

Saving Plots as Image Files
It may be convenient to rename the plot files something more descriptive It may be convenient to rename the plot files something more descriptive than just jobname000.jpg.
The problem is that you cannot be sure what number plot you are up to. To address this there is a command to t rn OFF a tomatic n mbering To address this there is a command to turn OFF automatic numbering.
— /DEV,PSFN,NINC• With this option set the plot is always sent to jobname.jpg• So it is easy to rename /• So it is easy to rename /DEV,PSFN,NINC
/SHOW,JPEG,,0 …/inquire,jnam,JOBNAME
1PLNS,S,1/rename,,jpg,,%jnam(1)%_S1,jpgPLNS,S,3/rename,,jpg,,%jnam(1)%_S3,jpg
S S QPLNS,S,EQV/rename,,jpg,,%jnam(1)%_SEQV,jpgPLNS,U,SUM/rename,,jpg,,%jnam(1)%_USUM,jpg
37
…/SHOW,CLOSE

Plots to File in WB
In Workbench the current view can be saved to an image file by clicking: In Workbench, the current view can be saved to an image file by clicking:
— Which will bring up a dialog box for saving the file.
However Workbench has built-in procedures for generating a report and However, Workbench has built in procedures for generating a report and saving it to MS Word or PPT.
— This report will automatically contain any “Figures” or “Images” added to the tree.
• Image: A static image of the current view, cannot be modified.• Figure: A separate view of the current tree item.
— Figures can be rotated, zoomed, etc, just like the main view.Ch i th f Fi d I ill k th t ti
38
• Changing the name of Figures and Images will make the report captions more meaningful.
WB Report Generation
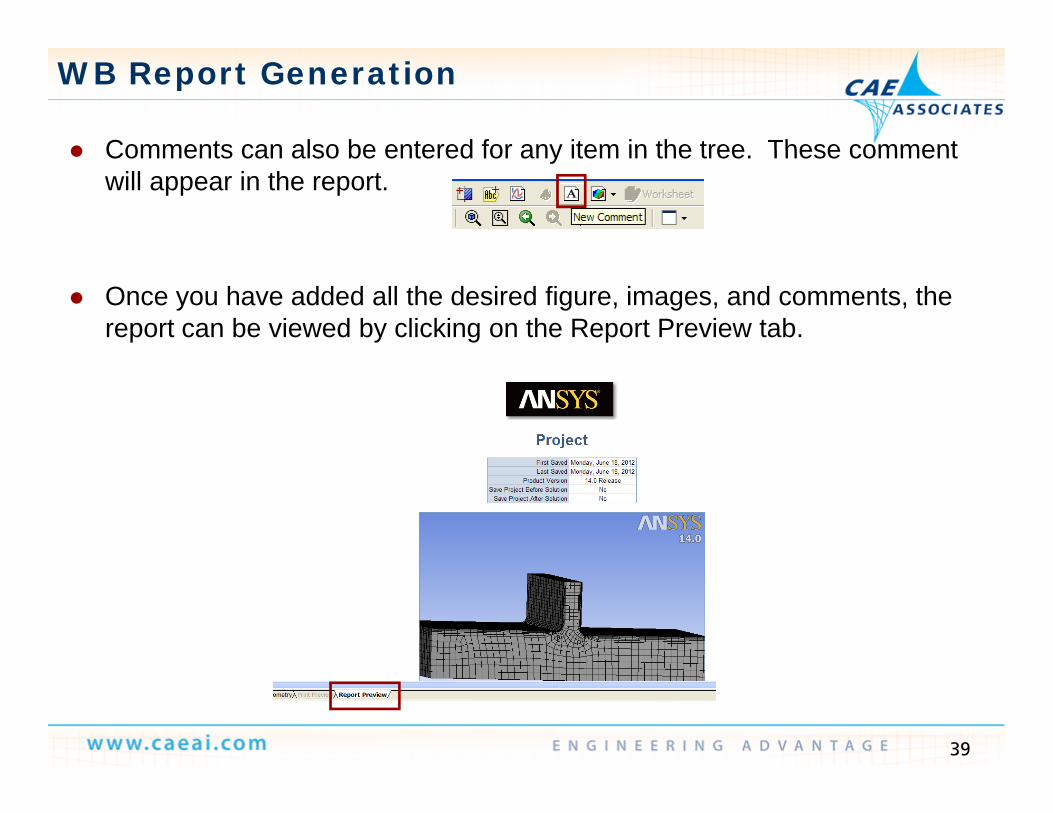
Comments can also be entered for any item in the tree These comment Comments can also be entered for any item in the tree. These comment will appear in the report.
Once you have added all the desired figure, images, and comments, the report can be viewed by clicking on the Report Preview tab.
39
WB Report Generation
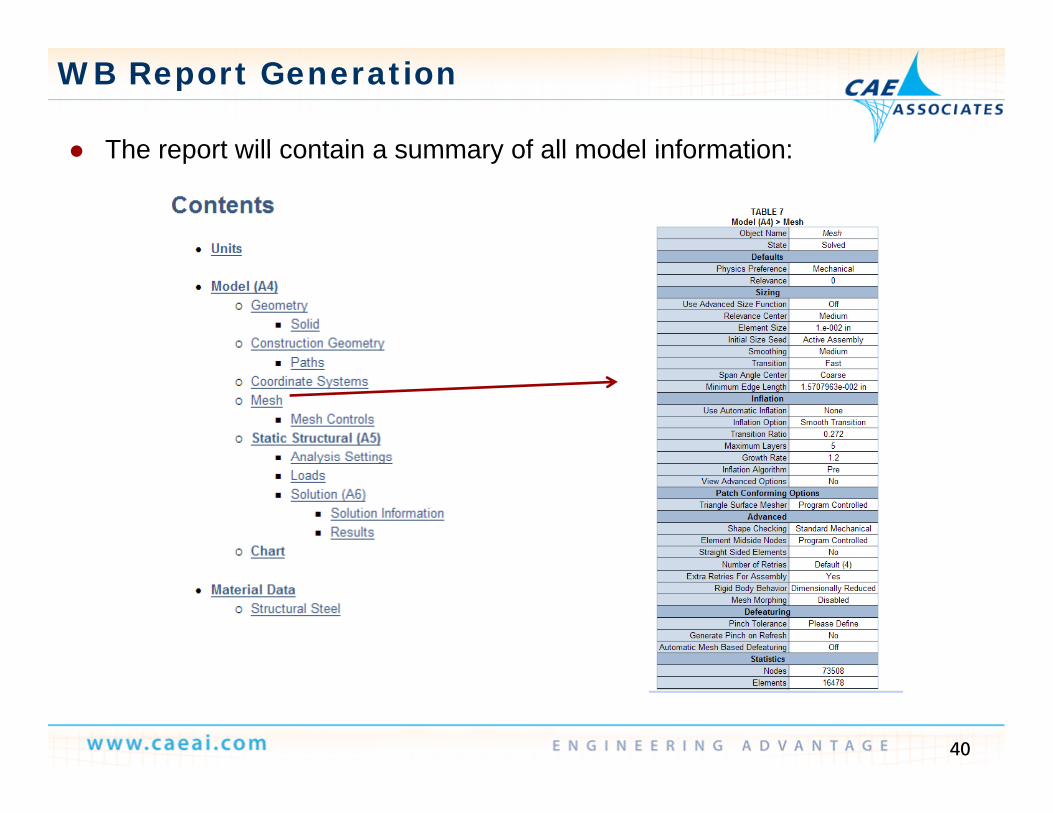
The report will contain a summary of all model information: The report will contain a summary of all model information:
40

WB Report Generation
Path results are automatically included as plots and tabular data: Path results are automatically included as plots and tabular data:
41
WB Report Generation
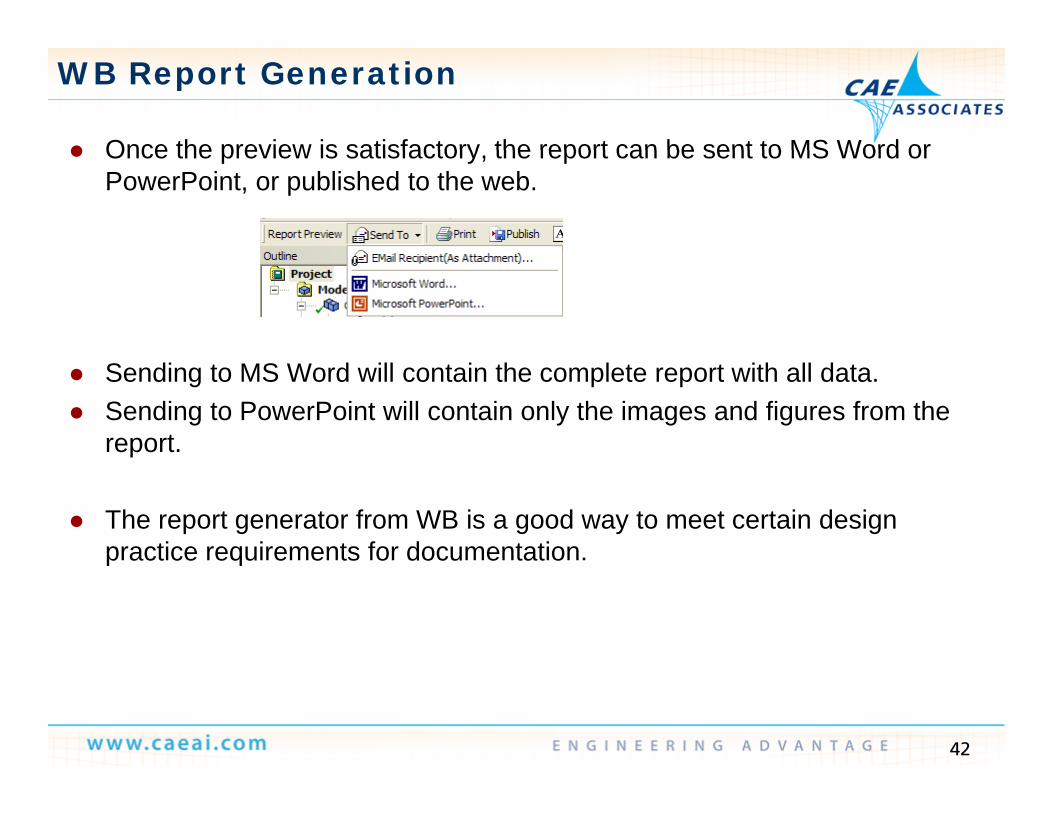
Once the preview is satisfactory the report can be sent to MS Word or Once the preview is satisfactory, the report can be sent to MS Word or PowerPoint, or published to the web.
Sending to MS Word will contain the complete report with all data. Sending to PowerPoint will contain only the images and figures from the
report.
The report generator from WB is a good way to meet certain design practice requirements for documentation. p act ce equ e e ts o docu e tat o
42

Automated Stress E t tiExtraction
CAE Associates Inc. and ANSYS Inc. Proprietary© 2012 CAE Associates Inc. and ANSYS Inc. All rights reserved.

Stress Extraction
There are a number of ways to determine and store the maximum stress There are a number of ways to determine and store the maximum stress for a particular load case:
— *GET,,PLNSOL – Get the maximum value from the last plotNSORT; *GET SORT – Get the maximum value from the last sort— NSORT; GET,,SORT – Get the maximum value from the last sort
— *VGET,,NODE,S,1 ; *VSCFUN,,MAX – Store stress data for all nodes in an array and find the maximum from that array.
Using these methods in a *DO loop that loops over all load cases, one can find the maximum stress value of all load cases.
44
Stress Extraction
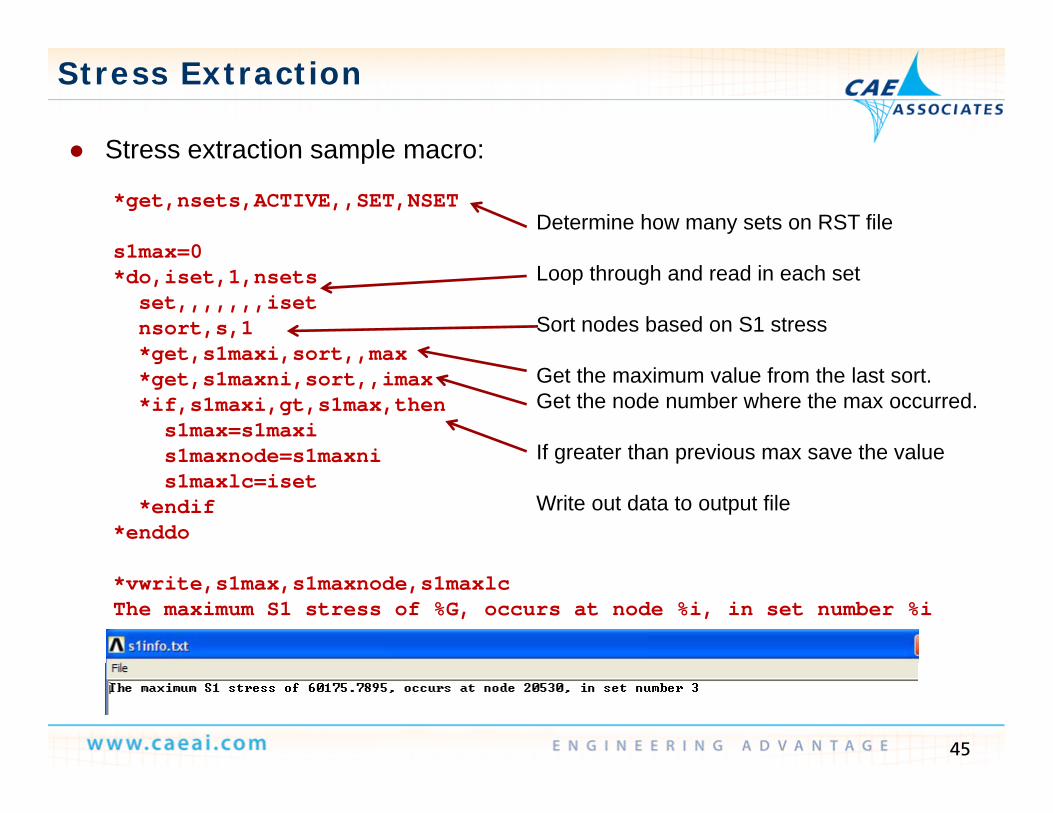
Stress extraction sample macro: Stress extraction sample macro:
*get,nsets,ACTIVE,,SET,NSET
s1max=0Determine how many sets on RST file
s1max=0*do,iset,1,nsetsset,,,,,,,isetnsort,s,1*get s1maxi sort max
Loop through and read in each set
Sort nodes based on S1 stressget,s1maxi,sort,,max
*get,s1maxni,sort,,imax*if,s1maxi,gt,s1max,then
s1max=s1maxis1maxnode=s1maxni
Get the maximum value from the last sort.Get the node number where the max occurred.
If greater than previous max save the values1maxnode=s1maxnis1maxlc=iset
*endif*enddo
If greater than previous max save the value
Write out data to output file
*vwrite,s1max,s1maxnode,s1maxlcThe maximum S1 stress of %G, occurs at node %i, in set number %i
45

Stress Extraction
The *VWRITE command is useful for writing data to files in a specified The VWRITE command is useful for writing data to files in a specified format. Lets modify the macro slightly to write the max S1 stress for each results set.
*get,nsets,ACTIVE,,SET,NSET *dim,slist,array,nsets,2*do,iset,1,nsets
Define an array nsetsX2
Loop through and read in each setset,,,,,,,isetnsort,s,1*get,slist(iset,1),sort,,max*get,slist(iset,2),sort,,imax
Loop through and read in each set
Store the maximum value in first column of array.Store the node number in the second*enddo
*cfopen,s1out,csv*vwrite
1
Store the node number in the second column.
Open a new file for writing to.
Load Case, Max S1, Node
*vwrite,SEQU,slist(1,1),slist(1,2)%I, %G, %I* f l
Write out headers to file
Write array data to file
46
*cfclose
Stress Extraction
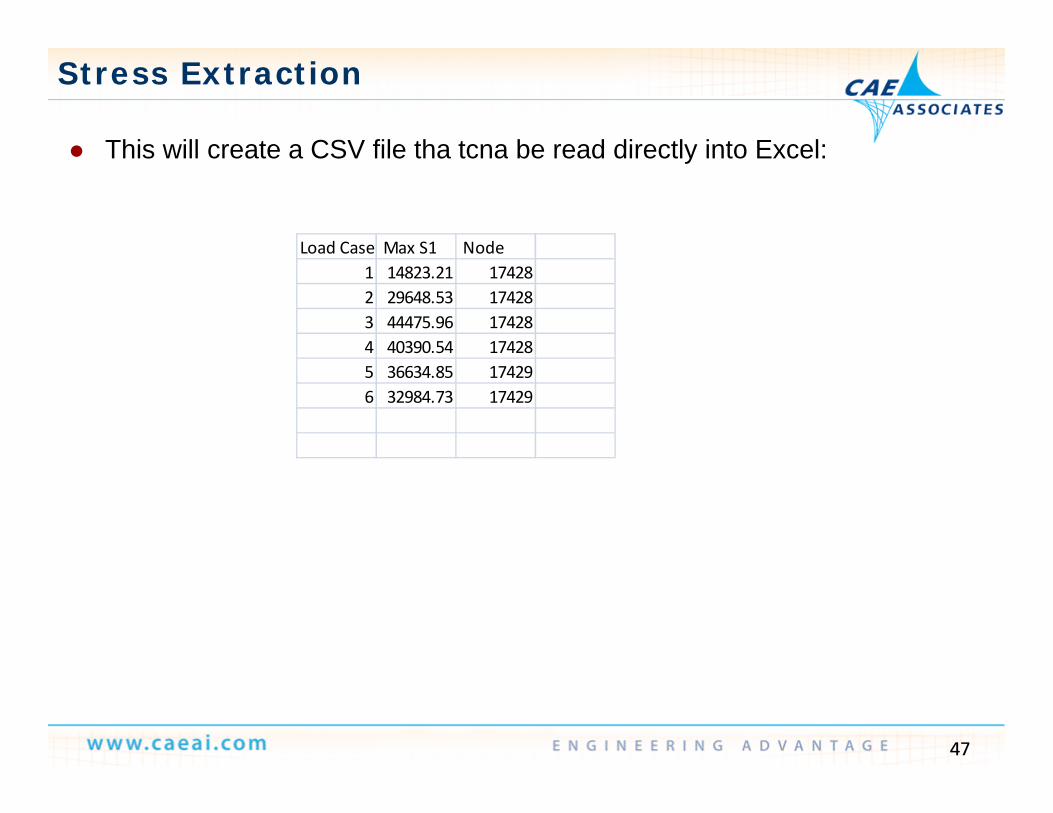
This will create a CSV file tha tcna be read directly into Excel: This will create a CSV file tha tcna be read directly into Excel:
Load Case Max S1 NodeLoad Case Max S1 Node1 14823.21 174282 29648.53 174283 44475.96 174284 40390.54 174285 36634.85 174296 32984.73 17429
47
Maximum Stress in WB
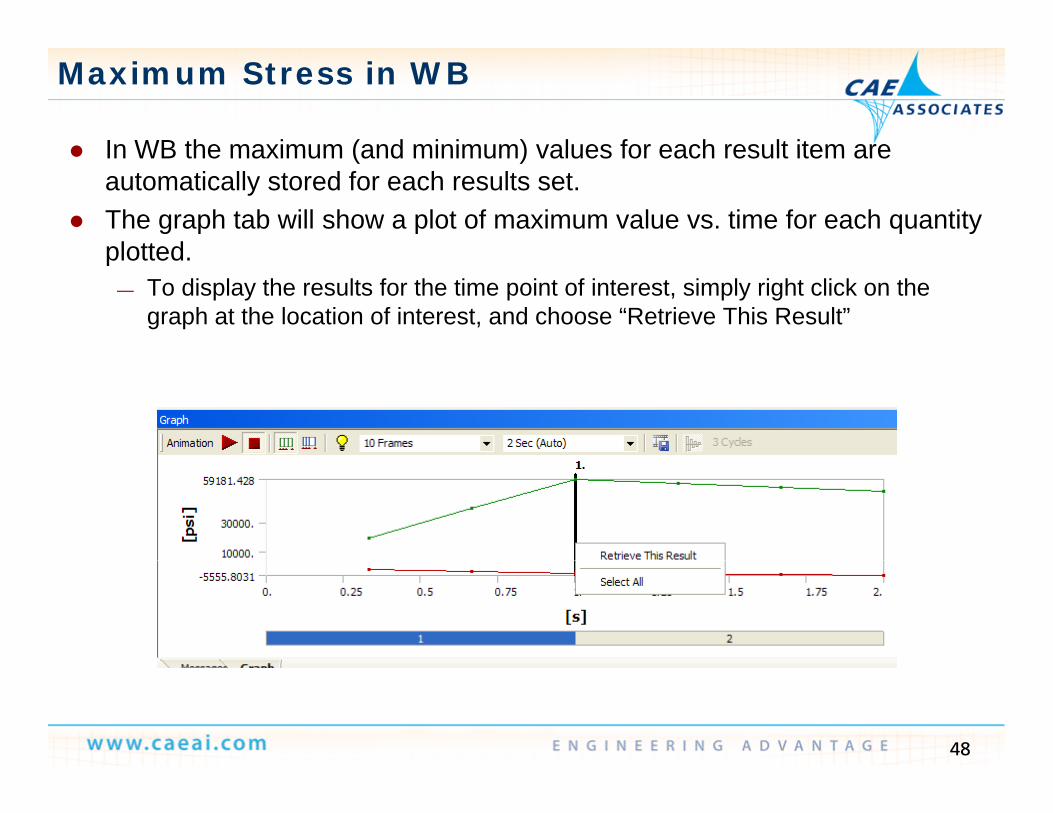
In WB the maximum (and minimum) values for each result item are In WB the maximum (and minimum) values for each result item are automatically stored for each results set.
The graph tab will show a plot of maximum value vs. time for each quantity plottedplotted.
— To display the results for the time point of interest, simply right click on the graph at the location of interest, and choose “Retrieve This Result”
48

Macro Library and Toolbar
One of the major issues with postprocessing is consistency across the One of the major issues with postprocessing is consistency across the company.
We have seen how the WB report generator can be used to create a comprehensive report with consistent types of information for all userscomprehensive report with consistent types of information for all users.
Another way to help with consistency is to make the same macros available to all users.
This can be done by storing these macros in a macro library— This can be done by storing these macros in a macro library.— A macro library is a company wide accessible network directory that is
identified by a system environment variable: ANSYS_MACROLIBIf this environment variable is defined ANSYS will search in the directory— If this environment variable is defined ANSYS will search in the directory specified for macros.
49
Macro Library and Toolbar
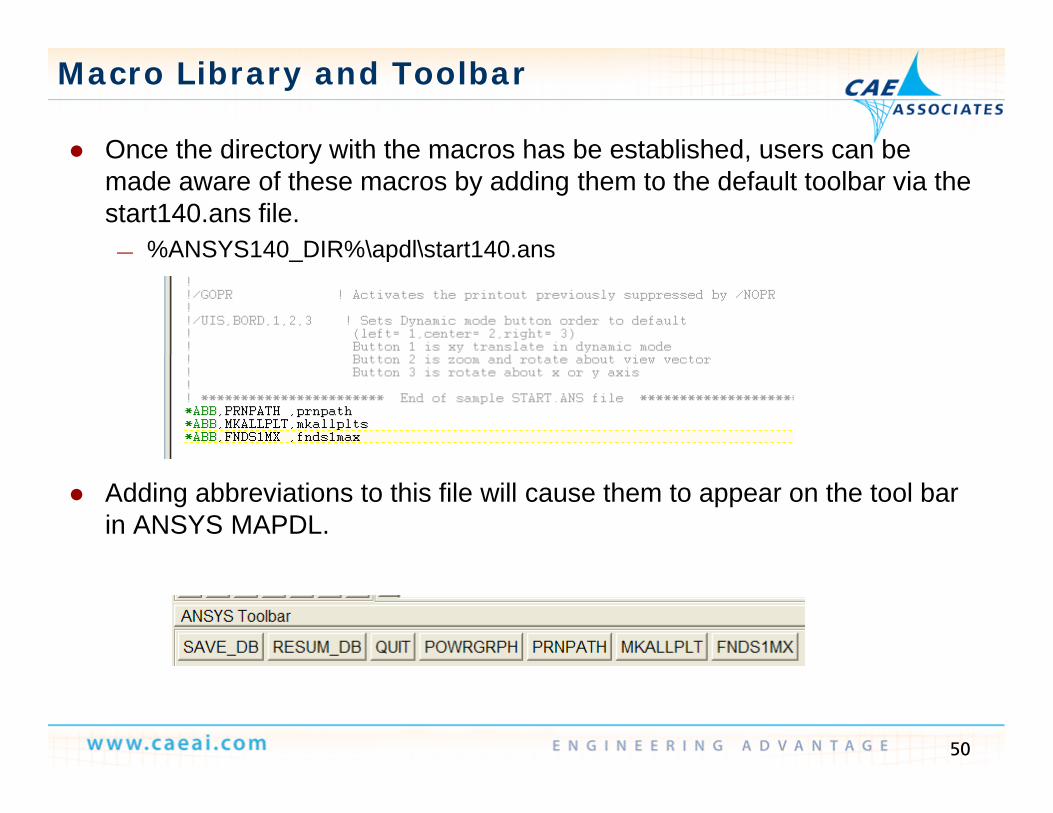
Once the directory with the macros has be established users can be Once the directory with the macros has be established, users can be made aware of these macros by adding them to the default toolbar via the start140.ans file.
— %ANSYS140 DIR%\apdl\start140 ans— %ANSYS140_DIR%\apdl\start140.ans
Adding abbreviations to this file will cause them to appear on the tool bar in ANSYS MAPDL.
50