
Paterson, RW; Bartlett, JW; Blennow, K; Fox, NC; Alzheimer...
9
Paterson, RW; Bartlett, JW; Blennow, K; Fox, NC; Alzheimer’s Dis- ease Neuroimaging Initiative; Shaw, LM; Trojanowski, JQ; Zetter- berg, H; Schott, JM (2014) Cerebrospinal fluid markers including trefoil factor 3 are associated with neurodegeneration in amyloid- positive individuals. Transl Psychiatry, 4. e419. ISSN 2158-3188 DOI: 10.1038/tp.2014.58 Downloaded from: http://researchonline.lshtm.ac.uk/1846477/ DOI: 10.1038/tp.2014.58 Usage Guidelines Please refer to usage guidelines at http://researchonline.lshtm.ac.uk/policies.html or alterna- tively contact [email protected]. Available under license: http://creativecommons.org/licenses/by-nc-nd/2.5/
Transcript of Paterson, RW; Bartlett, JW; Blennow, K; Fox, NC; Alzheimer...

Paterson, RW; Bartlett, JW; Blennow, K; Fox, NC; Alzheimer’s Dis-ease Neuroimaging Initiative; Shaw, LM; Trojanowski, JQ; Zetter-berg, H; Schott, JM (2014) Cerebrospinal fluid markers includingtrefoil factor 3 are associated with neurodegeneration in amyloid-positive individuals. Transl Psychiatry, 4. e419. ISSN 2158-3188DOI: 10.1038/tp.2014.58
Downloaded from: http://researchonline.lshtm.ac.uk/1846477/
DOI: 10.1038/tp.2014.58
Usage Guidelines
Please refer to usage guidelines at http://researchonline.lshtm.ac.uk/policies.html or alterna-tively contact [email protected].
Available under license: http://creativecommons.org/licenses/by-nc-nd/2.5/

OPEN
ORIGINAL ARTICLE
Cerebrospinal fluid markers including trefoil factor 3 areassociated with neurodegeneration in amyloid-positiveindividualsRW Paterson1, JW Bartlett2, K Blennow3, NC Fox1, Alzheimer’s Disease Neuroimaging Initiative6, LM Shaw4, JQ Trojanowski4,H Zetterberg3,5 and JM Schott1
We aimed to identify cerebrospinal fluid (CSF) biomarkers associated with neurodegeneration in individuals with and without CSFevidence of Alzheimer pathology. We investigated 287 Alzheimer’s Disease Neuroimaging Initiative (ADNI) subjects(age= 74.9 ± 6.9; 22/48/30% with Alzheimer’s disease/mild cognitive impairment/controls) with CSF multiplex analyte data andserial volumetric MRI. We calculated brain and hippocampal atrophy rates, ventricular expansion and Mini Mental State Examinationdecline. We used false discovery rate corrected regression analyses to assess associations between CSF variables and atrophy ratesin individuals with and without amyloid pathology, adjusting in stages for tau, baseline volume, p-tau, age, sex, ApoE4 status anddiagnosis. Analytes showing statistically significant independent relationships were entered into reverse stepwise analyses.Adjusting for tau, baseline volume, p-tau, age, sex and ApoE4, 4/83 analytes were significantly independently associated with brainatrophy rate, 1/83 with ventricular expansion and 2/83 with hippocampal atrophy. The strongest CSF predictor for the three atrophymeasures was low trefoil factor 3 (TFF3). High cystatin C (CysC) was associated with higher whole brain atrophy and hippocampalatrophy rates. Lower levels of vascular endothelial growth factor and chromogranin A (CrA) were associated with higher wholebrain atrophy. In exploratory reverse stepwise analyses, lower TFF3 was associated with higher rates of whole brain, hippocampalatrophy and ventricular expansion. Lower levels of CrA were associated with higher whole brain atrophy rate. The relationshipbetween low TFF3 and increased hippocampal atrophy rate remained after adjustment for diagnosis. We identified a series of CSFmarkers that are independently associated with rate of neurodegeneration in amyloid-positive individuals. TFF3, a substrate forNOTCH processing may be an important biomarker of neurodegeneration across the Alzheimer spectrum.
Translational Psychiatry (2014) 4, e419; doi:10.1038/tp.2014.58; published online 29 July 2014
INTRODUCTIONAlthough Alzheimer’s disease (AD) is a relentless progressivecondition there is considerable variation in the rate of progressionbetween individuals.1 Previous studies have suggested thatatrophy rates may be affected by the age of onset,2 diseaseseverity,3 by the concurrence of other pathologies includingvascular disease4 and TDP43 burden.5 However, the majority ofthe variance in rates of atrophy between individuals remainsunaccounted for.6 A more detailed understanding of factorsinfluencing this variability could allow for prognostication forpatients, and aid in clinical trial design or interpretation whereinterindividual variance in atrophy rate increases required samplesizes;6 and provide insights into the underlying biology of AD, inturn leading to the discovery of new targets for disease preventionstrategies. Biomarkers provide a means both of quantifying therate of disease progression and exploring its influences. Rates ofatrophy, either of brain or brain substructures can be measuredwith a high degree of precision from serially acquired MRI andprovide a robust measure of progression which correlates with
cognitive decline.7 Cerebrospinal fluid (CSF) can be used to assessneuronal, synaptic, inflammatory, and other proteins involved, orpotentially involved, in AD pathogenesis.8 To date, Aβ1-42 and tauare routinely measured as AD biomarkers,8 with good evidencethat these are markers of AD pathology and predict cognitivedecline in mild cognitive impairment.9 What is less clear howeveris which CSF markers best reflect rates of neuronal damage or lossin AD—and therefore may be useful predictors of progression. Aprevious exploratory pilot study of CSF biomarkers in healthyelderly with amyloid pathology identified a number of analytesthat may predict atrophy in specific brain regions.10 In this studywe aimed to assess whether any analytes in a large panel of CSFbiomarkers were associated with increased rates of atrophy acrossthe Alzheimer spectrum.
PATIENTS AND METHODSSubjectsWe investigated subjects from the Alzheimer’s Disease NeuroimagingInitiative (ADNI) (adni.loni.ucla.edu), a multicenter publicly/privately funded
1Department of Neurodegeneration, Dementia Research Centre, UCL Institute of Neurology, London, UK; 2Department of Medical Statistics, London School of Hygiene andTropical Medicine, London, UK; 3Department of Psychiatry and Neurochemistry, Institute of Neuroscience and Physiology, Sahlgrenska Academy, University of Gothenburg,Mölndal, Sweden; 4Department of Pathology and Laboratory Medicine, Institute on Aging and Center for Neurodegenerative Disease Research, Perelman School of Medicine,University of Pennsylvania, Philadelphia, PA, USA and 5Department of Molecular Neuroscience, UCL Institute of Neurology, London, UK. Correspondence: Dr JM Schott,Department of Neurodegeneration, Dementia Research Centre, Box 16, UCL Institute of Neurology, Queen Square, London WC1N 3BG, UK.E-mail: [email protected] of the Alzheimer’s Disease Neuroimaging Initiative are listed before References.Received 9 January 2014; revised 23 May 2014; accepted 27 May 2014
Citation: Transl Psychiatry (2014) 4, e419; doi:10.1038/tp.2014.58© 2014 Macmillan Publishers Limited All rights reserved 2158-3188/14
www.nature.com/tp

longitudinal study of individuals with AD, amnestic mild cognitiveimpairment (MCI) and normal cognition. Institutional review boardsapproved the study and subjects gave written consent. Subjects under-went baseline and periodic clinical and neuropsychological assessmentand serial MRI. Approximately 60% had CSF. A selected group hadadditional CSF analysis for the ADNI Biomarkers Consortium project ‘Use ofTargeted Multiplex Proteomic Strategies to Identify Novel CerebrospinalFluid (CSF) Biomarkers in AD’ as described on the ADNI website. Wedownloaded data from LONI (http://adni.loni.ucla.edu) that included allsubjects with this supplementary CSF multiplex data. As our aim was toexplore factors influencing atrophy rates in individuals with AD pathologywe dichotomised subjects using a baseline CSF Aβ1-42 level of 192pgml− 1, a level shown to distinguish individuals with autopsy confirmedAD pathology and controls with ~ 96% sensitivity and ~ 77% specificity.11
We excluded subjects who did not have useable 1.5T MRI scans at baselineand 1 year, and one subject without a defined diagnosis. We recordedApoE status and genotype at the rs7280100 SNP, which has been identifieda candidate locus for trefoil factor 3 (TFF3),12 as well as Mini Mental StateExamination (MMSE) at baseline and 12 months.
Cerebrospinal fluidCSF collection, processing and storage procedures have previously beendescribed.11 Processing, aliquoting and storage was carried out accordingto the ADNI Biomarker Core Laboratory Standard Operating Procedures(http://adni-info.org/Scientists/Pdfs/adniproceduresmanual12.pdf). Sam-ples were analyzed using a multiplex-based immunoassay panel basedupon Luminex immunoassay technology developed by Rules BasedMedicine (MyriadRBM, Austin, TX, USA). CSF Aβ1-42, total tau (t-tau) andphosphorylated tau (p-tau) and a panel of 159 analytes includinginflammatory, metabolic, lipid and other disease relevant analytes weretested. Data were prepared for analysis according to the biomarkersconsortium statistical analysis plan (http://adni.loni.ucla.edu/wp-content/uploads/2012/01/2011Dec28-Biomarkers-Consortium-Data-Primer-FINAL1.pdf), and as previously described.13 Of 159 analytes, 76 had greater than10% of quality control data missing, leaving 83 available for analysis. Foreach analyte, the normality of data was assessed by the ADNI BiomarkersConsortium: non-normal data were transformed using the Box and Coxtechnique.14
Image acquisitionDetails of the MRI methodology have previously been described.15 T1weighted, inversion-recovery prepared structural images were acquired atbaseline and 12 months on 1.5T MRI units using standardized protocols.Corrections for distortion due to gradient nonlinearity and for imageintensity non-uniformity and scalings were made based on phantommeasures. Images underwent central quality control evaluation forprotocol compliance and internal quality control at the Dementia ResearchCentre.
Volume loss measurementImage analysis was performed using in-house MIDAS software.16 Wholebrain and lateral ventricles were delineated semi-automatically andhippocampal volumes were measured using the automated HMAPSmethod.17 Volume loss (ml) between scans was obtained using theboundary shift integral (BSI) following a 9-degrees-of-freedom registrationand differential bias correction of the follow-up to baseline scans. Forlateral ventricles and hippocampi, change over time was quantified usingthe ventricular (VBSI)18 and hippocampal BSI (HBSI)17 respectively. Rates ofvolume loss were annualized using the interscan interval.
Statistical analysisTo assess the relationship between CSF analytes and rates of brain volumechange, we fitted separate regression models for rates of ventricularexpansion, brain and hippocampal atrophy for each CSF variable, includingbaseline volume (brain, ventricular and hippocampal volume, respectively)and tau as covariates in both the amyloid positive and negative groups.Subsequent analyses in the amyloid-positive group alone were repeatedincluding age, gender, APOE4 status and phospho-tau (p-tau) as additionalcovariates and finally also adjusting for baseline diagnosis (AD, MCI,control). We used an implementation of the false discovery rate (FDR)procedure19 with control at the 5% level to correct for multiplecomparisons, and report the adjusted regression coefficients between
each atrophy rate and those CSF variables showing FDR significantrelationships. We then performed three exploratory reverse stepwiseregression analyses to identify combinations of CSF analytes indepen-dently predicting increased rates of change for each measure, using FDRsignificant CSF variables identified in the preceding step and the three setsof adjustment variables. In each stepwise analysis, the correspondingadjustment variables were forced to be included in regression models.Finally, we assessed whether CSF analytes were associated with cognitivefunction. We first established whether there was a decline in MMSEbetween baseline and 12 months that was significantly different from zero.We then determined if atrophy rates and decline in MMSE scores at12 months were correlated using separate regression models for rates ofventricular expansion, brain and hippocampal atrophy. We then fittedseparate regression models for annualized change in MMSE score andeach CSF variable found to be (after FDR control) associated with at leastone atrophy measure.The FDR procedure used was derived assuming independence between
test statistics.19 However, it has been shown that the procedure is validunder certain types of dependence,20 and in a simulation study (results notshown) matching the analysis used here, the procedure correctlycontrolled the FDR at 5%.To quantify the unadjusted group discrimination ability of the analytes
that were FDR significant adjusted for baseline brain volumes, sex, age,APOE4 status, tau and p-tau the area under the ROC curve for detectingbetween AD and control groups was estimated.
RESULTSBaseline group characteristicsA flow chart outlining subject inclusion is provided in Figure 1The demographics, genetic characteristics, cognitive scores and
atrophy measures of the 287 subjects included in this analysis aredescribed in Table 1. The mean± s.d. age of this group was74.9 ± 6.9 years, 21.6% had a clinical diagnosis of AD, 48.1% MCIand 30.3% were controls. Eighty-three CSF analytes as well as CSFtau, Aβ1-42 and p-tau were available for analysis (SupplementaryTable 1).
Analytes predicting atrophyIn subjects without evidence for significant amyloid deposition,that is, those with baseline CSF Aβ1-42 4192 pgml− 1, afteradjusting for baseline brain volumes and CSF t-tau and with FDRcorrection to control for multiple comparisons, none of the CSFanalytes was significantly associated with any of the atrophymeasures.In subjects with CSF Aβ1-42 ⩽ 192 pgml− 1, after adjusting for
baseline volumes and t-tau and with FDR correction to control formultiple comparisons, 10/83 analytes were associated with wholebrain atrophy rate, 45/83 analytes with ventricular expansion rate,and 4/83 with hippocampal atrophy rate (Table 2). Afteradditionally adjusting for p-tau, age, ApoE status and sex andwith FDR correction to control for multiple comparisons, 4/83
287 ADNI subjects recruited to ADNI 1 with extended CSF analysis and
Volumetric MRI at baseline and 12 months satisfying central quality control evaluation for protocol
compliance and internal quality control at the Dementia Research Centre
Baseline CSF Aβ1-42 ≤192pg/ml(200 subjects)
Baseline CSF Aβ1-42 >192pg/ml(87 subjects)
Figure 1. Subjects included in analysis. ADNI, Alzheimer's DiseaseNeuroimaging Initiative; CSF, cerebrospinal fluid.
Trefoil factor 3 predicts neurodegeneration rateRW Paterson et al
2
Translational Psychiatry (2014), 1 – 8 © 2014 Macmillan Publishers Limited

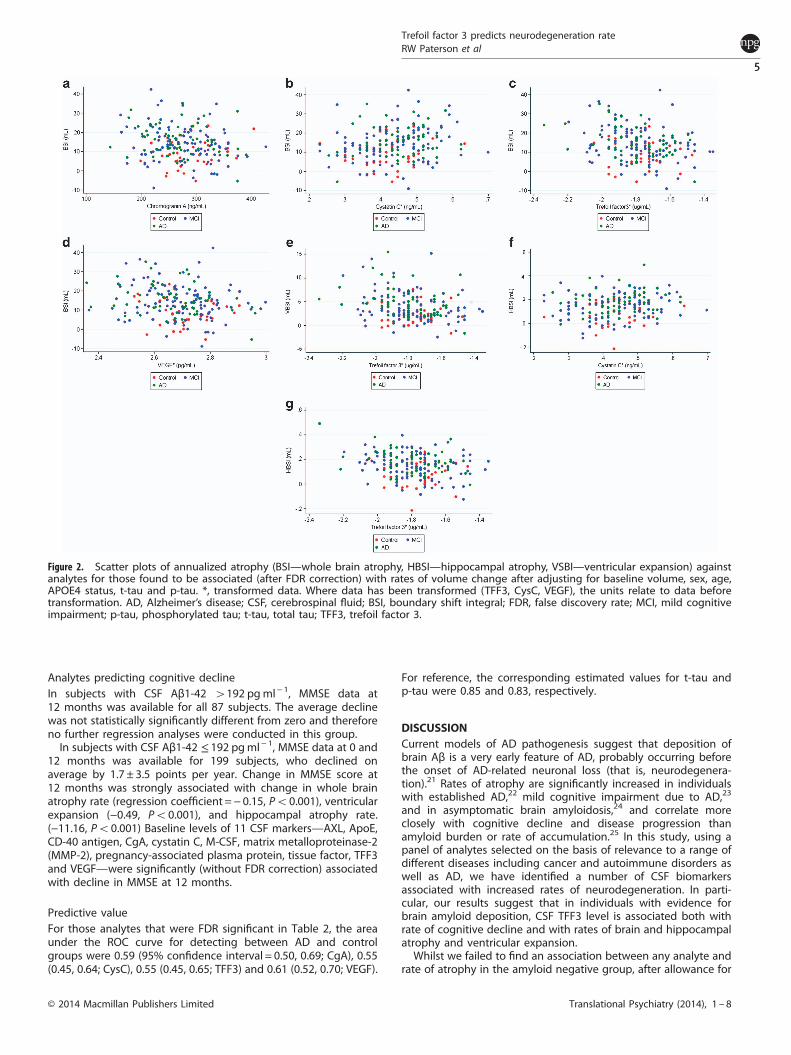
analytes were associated with whole brain atrophy rate, 1/83analyte with ventricular expansion rate, and 2/83 with hippocam-pal atrophy rate (Table 2). These relationships are illustrated usingscatter plots in Figure 2. After additionally adjusting for baselinediagnosis, only 2/83 analytes were associated with hippocampalatrophy, and none with brain atrophy or ventricular expansion(Table 2).Lower levels of TFF3 were consistently associated with greater
ventricular expansion (Po0.001), hippocampal atrophy rate(Po0.001) and whole brain atrophy rate (Po0.001) even afteradjusting for baseline brain volumes, t-tau, p-tau, age, APOE statusand sex. After additionally adjusting for baseline diagnosis, lowerlevels of TFF3 were still associated with higher hippocampalatrophy (P = 0.007). Higher levels of Cystatin C (CysC) werepositively associated with all three atrophy measures afteradjusting for baseline brain volumes and t-tau and remainedpredictive of higher whole brain (P= 0.009) and hippocampalatrophy (P = 0.034) after adjusting for p-tau, age, ApoE status andsex. Lower levels of vascular endothelial growth factor (VEGF) werepositively associated with all three atrophy measures afteradjusting for baseline brain volumes and t-tau and remainedassociated with higher whole brain atrophy (P= 0.023) afteradjusting for p-tau, age, APOE status and sex. Lower levels ofChromogranin-A (CgA) were associated with higher whole brainatrophy (0.008) and ventricular expansion (0.009) after adjustingfor baseline volumes and t-tau and predicts higher whole brain
atrophy (P= 0.009) after additionally adjusting for p-tau, age, ApoEstatus and sex.In exploratory reverse stepwise models that included only those
variables showing FDR significant associations in the initialanalyses (Table 3), lower levels of TFF3 were associated withhigher rates of whole brain atrophy, ventricular expansion andhippocampal atrophy, even when, p-tau, age, APOE status and sexwere included in the model. Lower levels of CgA were associatedwith higher whole brain atrophy and ventricular expansion whent-tau and baseline volume were included in the model; and withhigher whole brain atrophy when p-tau, age, APOE status and sexwere also included as covariates. In addition, adjusting for baselinediagnosis, TFF3 was the only analyte independently associatedwith hippocampal atrophy rate; and no analytes were (indepen-dently) associated with whole brain atrophy or ventricularexpansion.Twenty-three of the subjects had a minor allele at the
rs7280100 locus (predicted to reduce CSF TFF3). These individualshad 18% higher rates of ventricular expansion, 14% higher rates ofbrain atrophy and 30% higher rates of hippocampal atrophycompared with noncarriers, the latter reaching borderlinesignificance after adjustment for baseline diagnosis, (P = 0.07).
Table 1. Baseline demographics, ApoE genotype, cognitive profiles, CSF profiles, brain volumes and 1 year atrophy rates of 200 subjects with Aβ1-42≤ 192 pgml− 1 and 87 subjects with Aβ1-424192 pgml− 1
Subjects with Aβ1-42 ≤ 192 pg ml− 1 (n= 200)
Combined Controls (n=33) MCI (n= 108) AD (n=59)
Age at CSF exam (years) 74.8± 6.7 76.5± 5.5 74.4± 7.0 74.5± 7.4Gender (% male) 59.4 54.5 63.9 52.5APOE4 positive (%) 65.5 51.5 69.0 78.0MMSE (mean) 26.1± 2.5 29.1± 0.1 26.7± 1.8 23.5± 1.8Modified ADAS-cog 13.1± 6.2 7.1± 3.4 12.1± 4.6 18.5± 6.1Aβ1-42 (pgml− 1) 137.2± 22.7 146.5± 25.5 136.5± 29.0 133.1± 23.2t-tau (pgml− 1) 114.4± 55.3 82.5± 30.7 115.3± 56.0 130.7± 57.7p-tau (pgml− 1) 39.5± 17.5 31.2± 17.4 39.8 ± 15.4 43.6± 19.8KBSI (ml per year) 13.8± 8.7 8.9± 7.3 14.2± 9 15.7± 7.8VBSI (ml per year) 3.8± 3.1 2.1± 2.0 3.8± 3.1 4.9± 3.1HBSI (ml per year) 0.15± 0.10 0.08± 0.1 0.1± 0.1 0.2± 0.1MMSE decline from baseline to 12 months (points per year; n= 199) 1.7± 3.5 0.4± 1.7 1.4± 2.7 3.0± 4.8% of individuals with minor allele rs7280100 12.2 12.5 10.9 14.6
Subjects with Aβ1-424192 pg ml− 1 (n= 87)
Combined Controls (n=54) MCI (n=30) AD (n= 3)
Age at CSF exam (years) 75.4± 6.3 74.9± 5.2 75.5± 8.0 81.4± 6Gender (% male) 62.1 50 80 100APOE4 positive (%) 89.6 90.7 86.7 100.0MMSE (mean) 28.3± 1.7 29.0± 1.0 27.2± 1.9 25.3± 1.2Modified ADAS-cog 7.6± 1.4 5.7± 2.5 10.5± 3.8 14.4± 6.8Aβ1-42 (pgml− 1) 244.4± 26.1 243.1± 25.6 246.5± 26.0 247.0± 45.7t-tau (pgml− 1) 62.2± 20.9 60.8± 21.4 64.3± 20.2 66± 22.3p-tau (pgml− 1) 21.0± 8.0 20.6± 7.9 21.8± 8.5 21.3± 7.5KBSI (ml per year) 6.0± 6.7 4.7± 5.4 7.5± 8.0 12.6± 10.5VBSI (ml per year) 1.4± 1.6 1.1± 1.1 1.7± 2.1 2.5± 2.5HBSI (ml per year) 0.05± 0.1 0.03± 0.09 0.07± 0.1 0.1± 0.06MMSE decline from baseline to 12 months (points per year; n= 199) 0.1± 1.6 0.06± 1.3 0.2± 2 0± 2% of individuals with minor allele rs7280100 12.0 13.2 11.1 0
Abbreviations: AD, Alzheimer’s disease; ADAS-cog, Alzheimer’s Disease Assessment Scale-cognitive subscale; CSF, cerebrospinal fluid; HBSI, hippocampalboundary shift integral; KBSI, whole brain boundary shift integral; MCI, mild cognitive impairment; MMSE, mini mental state examination; p-tau,phosphorylated tau; t-tau, total tau; VBSI, ventricular boundary shift integral. Mean± s.d. provided unless stated.
Trefoil factor 3 predicts neurodegeneration rateRW Paterson et al
3
© 2014 Macmillan Publishers Limited Translational Psychiatry (2014), 1 – 8

Table 2. Regression coefficients for dependence of atrophy measures on CSF with control for the false discovery rate in subjects with low CSFAβ1-42(⩽192 pgml− 1): adjusted for baseline brain volumes and tau; adjusted for baseline brain volumes, sex, age, APOE4 status, t-tau and p-tau; adjustedfor baseline brain volumes, sex, age, APOE4 status, t-tau, p-tau and baseline diagnosis
Brain atrophy Ventricular expansion Hippocampal atrophy
Regressioncoefficient
P Regressioncoefficient
P Regressioncoefficient
P
Adjusting for baseline brain volumes and t-tauAlpha-1-Microglobulina (µgml− 1) − 3.17 0.002Alpha-2-Macroglobulina (mgml− 1) − 4.31 0.006Alpha-1-Antitrypsina (mgml− 1) − 0.19 0.018Angiotensin-converting enzymea (ngml− 1) − 3.17 0.027Angiopoietin-2a (ngml− 1) − 3.24 0.013Apolipoprotein A-Ia (mgml− 1) − 2.39 0.018Apolipoprotein C-IIIa(µgml− 1) − 2.02 0.042Apolipoprotein Da (µgml− 1) − 3.54 0.003Apolipoprotein Ea (µgml− 1) − 14.71 0.017 − 0.26 0.002Apolipoprotein Ha (µgml− 1) − 2.99 0.004AXL receptor tyrosine kinase (ngml− 1) − 1.59 0.01 − 0.40 0.018Beta-2-Microglobulina (µgml− 1) − 3.87 0.018Complement C3a (mgml− 1) − 3.80 0.003CD-40 antigena (ngml− 1) − 5.20 0.004Chromogranin-A (ngml− 1) − 0.05 0.008 − 0.013 0.009Clusterina (µgml− 1) − 11.90 0.023 − 4.20 0.002Cystatin-Ca (ngml− 1) 32.89 0.003 10.77 o0.001 0.34 0.019Fibroblast growth factor 4a (pgml− 1) 3.45 0.022Fibrinogena (mgml− 1) − 0.28 0.001Heparin-binding EGF-like growth factora (pgml− 1) − 4.08 0.048Hepatocyte growth factora (ngml− 1) − 2.59 0.048Immunoglobulin Aa (mgml− 1) − 1.28 0.048Interleukin-3a (ngml− 1) − 5.66 0.036 − 2.02 0.003Insulin-like growth factor-binding protein (ngml− 1) − 0.017 0.004Interferon gamma induced Protein 10a (pgml− 1) − 0.17 0.034Lectin-like oxidized LDL receptor 1 (ngml− 1) − 0.30 0.006Macrophage colony-stimulating factor 1a (ngml− 1) − 15.02 0.023 − 5.89 o0.001Monokine induced by gamma interferona (pgml− 1) − 1.66 0.009Neutrophil gelatinase-associated lipocalina (ngml− 1) − 2.49 0.018N-terminal prohormone of brain natriuretic peptidea
(pgml− 1)− 3.91 0.006 − 0.15 0.035
Placenta growth factora (pgml− 1) − 2.34 0.043Pancreatic polypeptidea (pgml− 1) − 1.31 0.038Serum amyloid P-componenta (µgml− 1) − 1.56 0.03Stem cell factora (pgml− 1) − 0.18 0.027Sex hormone-binding globulina (nmol/l) − 2.23 0.018Thyroxine-binding globulina (µgml− 1) − 0.18 0.023Tissue factora (µgml− 1) − 11.79 0.017 − 3.73 0.003Trefoil factor 3a (µgml− 1) − 14.69 0.003 − 6.19 o0.001 − 0.178 0.002Tissue inhibitor of metalloproteinases 1a (ngml− 1) − 3.88 0.015Thrombomodulina (ngml− 1) − 2.52 0.045Tumor necrosis factor receptor 2a (ngml− 1) − 4.05 0.007TNF-related apoptosis-inducing ligand receptor 3a
(ngml− 1)− 4.05 0.004
Vascular cell adhesion molecule-1a (ngml− 1) 3.46 0.018Vascular endothelial growth factora (pgml− 1) − 21.32 0.004 − 6.86 o0.001 − 0.21 0.034von Willebrand factora (µgml− 1) − 4.18 0.003
Adjusting for baseline brain volumes, sex, age, APOE4 status, tau and p-tauChromogranin-A (ngml− 1) − 0.05 0.009Cystatin-Ca (ngml− 1) 32.58 0.009 0.35 0.034Trefoil factor 3a (µgml− 1) − 16.43 0.009 − 4.46 0.03 − 0.23 0.001Vascular endothelial growth factora (pgml− 1) − 20.09 0.023
Adjusting for baseline brain volumes, sex, age, APOE4 status, tau, p-tau and baseline diagnosisTrefoil factor 3a (µgml− 1) − 0.21 0.007N-terminal prohormone of brain natriuretic peptidea
(pgml− 1)− 0.16 0.05
Abbreviations: CSF, cerebrospinal fluid; EGF, endothelial growth factor; FDR, false discovery rate; p-tau, phosphorylated tau; t-tau, total tau. aTransformed data.The statistics are presented for the transformed values (see Patients and Methods). Where data has been transformed, the units relate to data beforetransformation. None of the analytes in Supplementary Table 1 was FDR significant except those shown in this table. Regression coefficients are shown forthose measures showing FDR significant (5% level) associations. P-values are FDR (5% level) corrected.
Trefoil factor 3 predicts neurodegeneration rateRW Paterson et al
4
Translational Psychiatry (2014), 1 – 8 © 2014 Macmillan Publishers Limited
Analytes predicting cognitive declineIn subjects with CSF Aβ1-42 4192 pgml− 1, MMSE data at12 months was available for all 87 subjects. The average declinewas not statistically significantly different from zero and thereforeno further regression analyses were conducted in this group.In subjects with CSF Aβ1-42 ≤ 192 pgml− 1, MMSE data at 0 and
12 months was available for 199 subjects, who declined onaverage by 1.7 ± 3.5 points per year. Change in MMSE score at12 months was strongly associated with change in whole brainatrophy rate (regression coefficient =− 0.15, Po0.001), ventricularexpansion (−0.49, Po0.001), and hippocampal atrophy rate.(−11.16, Po0.001) Baseline levels of 11 CSF markers—AXL, ApoE,CD-40 antigen, CgA, cystatin C, M-CSF, matrix metalloproteinase-2(MMP-2), pregnancy-associated plasma protein, tissue factor, TFF3and VEGF—were significantly (without FDR correction) associatedwith decline in MMSE at 12 months.
Predictive valueFor those analytes that were FDR significant in Table 2, the areaunder the ROC curve for detecting between AD and controlgroups were 0.59 (95% confidence interval = 0.50, 0.69; CgA), 0.55(0.45, 0.64; CysC), 0.55 (0.45, 0.65; TFF3) and 0.61 (0.52, 0.70; VEGF).
For reference, the corresponding estimated values for t-tau andp-tau were 0.85 and 0.83, respectively.
DISCUSSIONCurrent models of AD pathogenesis suggest that deposition ofbrain Aβ is a very early feature of AD, probably occurring beforethe onset of AD-related neuronal loss (that is, neurodegenera-tion).21 Rates of atrophy are significantly increased in individualswith established AD,22 mild cognitive impairment due to AD,23
and in asymptomatic brain amyloidosis,24 and correlate moreclosely with cognitive decline and disease progression thanamyloid burden or rate of accumulation.25 In this study, using apanel of analytes selected on the basis of relevance to a range ofdifferent diseases including cancer and autoimmune disorders aswell as AD, we have identified a number of CSF biomarkersassociated with increased rates of neurodegeneration. In parti-cular, our results suggest that in individuals with evidence forbrain amyloid deposition, CSF TFF3 level is associated both withrate of cognitive decline and with rates of brain and hippocampalatrophy and ventricular expansion.Whilst we failed to find an association between any analyte and
rate of atrophy in the amyloid negative group, after allowance for
Figure 2. Scatter plots of annualized atrophy (BSI—whole brain atrophy, HBSI—hippocampal atrophy, VSBI—ventricular expansion) againstanalytes for those found to be associated (after FDR correction) with rates of volume change after adjusting for baseline volume, sex, age,APOE4 status, t-tau and p-tau. *, transformed data. Where data has been transformed (TFF3, CysC, VEGF), the units relate to data beforetransformation. AD, Alzheimer’s disease; CSF, cerebrospinal fluid; BSI, boundary shift integral; FDR, false discovery rate; MCI, mild cognitiveimpairment; p-tau, phosphorylated tau; t-tau, total tau; TFF3, trefoil factor 3.
Trefoil factor 3 predicts neurodegeneration rateRW Paterson et al
5
© 2014 Macmillan Publishers Limited Translational Psychiatry (2014), 1 – 8

multiple comparisons in the amyloid-positive group in which weadjusted for baseline brain volume and t-tau, we found that 45analytes predicted increased ventricular expansion and tenpredicted rate of whole brain atrophy. Ventricular expansionand brain atrophy are closely correlated,26 and as expected, allten factors predicting increased rates of whole brain atrophy alsopredicted increased ventricular expansion. The higher precisionwith which rate of ventricular change can be quantified18 is likelyto explain the larger number of analytes associated withventricular expansion compared with whole brain loss.When we additionally adjusted for p-tau, ApoE status and sex,
adjusting for multiple comparisons, the number of factorsassociated with rates of neurodegeneration in the amyloid-positive group alone was considerably reduced, with only fouranalytes showing an association with rates of neurodegenera-tion. Lower levels of TFF3, VEGF and CrA and higher levels ofCysC were associated with increased rates of brain atrophy; lowerlevels of TFF3 with increased ventricular expansion; and lowerlevels of TFF3 and higher levels of CysC with increased rates ofhippocampal atrophy. In exploratory reverse stepwise analyses,TFF3 was significantly associated with rate of decline in all threemeasures (Table 3), with an effect both independent from and atleast as great as CSF t-tau, which as expected, also (unadjusted)predicted all three measures of neurodegeneration.27 The effectof TFF3 persisted even once baseline p-tau, age, sex and APOE4status had been accounted for (Table 3), and was still associatedwith rate of hippocampal atrophy even once clinical diagnosis(for example, control/MCI/AD) had been accounted for. Theseresults therefore support an association between CSF TFF3 andincreased rates of neurodegeneration independent of estab-lished CSF biomarkers in individuals with amyloid deposition,suggesting that CSF TFF3 may be a novel and valuable biomarkerof decline across the spectrum of AD.
Trefoil Factor 3 (TFF3)Encoded by the TFF3 gene on chromosome 21, TFF3 is a proteinexpressed by secretory epithelial cells principally in the gastro-intestinal tract, and also in human hypothalamus and pituitary,28
and in the hippocampi, temporal cortices and cerebellum ofmice.29 Its function in the central nervous system is unknown,29
although TFF3 administration to mice has been reported toimprove memory.30 In the periphery, TFF3 has important roles inNOTCH processing, and measurement of TFF3 in blood/urine/faeces has been patented31 and used32 as a means of assessingNOTCH-related side-effects in trials of gamma-secretase inhibi-tors for the treatment of AD. To our knowledge, this is the firststudy to implicate TFF3 as a marker for neurodegeneration acrossthe AD spectrum, and furthermore to show that this isindependent of t-tau and p-tau: while there are few data onwhich to suggest mechanisms, one intriguing possibility is thatthis effect might in some way be mediated by alterations ingamma-secretase processing. While numbers with a minor allelewere too small for anything more than an exploratory analysis,the observation that genotype at the rs7280100, a candidatelocus associated with TFF3, is intriguing, and if replicated inindependent samples, suggests that CSF TFF3 and/or thers7280100 genotype may both help predict the rate ofneurodegeneration in individuals with amyloid pathology; andthat elucidating the function of TFF3 in the central nervoussystem may provide insights into mechanisms influencingneurodegeneration in the presence of brain amyloidosis.
Cystatin C (CysC), Vascular Endothelial Growth Factor (VEGF) andChromogranin-A (CgA)Of the other three biomarkers emerging prominently from ouranalyses, CysC colocalizes with β amyloid in amyloid plaques,amyloid-laden vascular walls in cerebral amyloid angiopathy andTa
ble3.
Exploratory
reversestep
wiseregressionan
alysisofCSF
analytes
withan
FDRsignificantassociationwithbrain
atrophymeasuremen
tin
subjectswithlowCSF
Aβ1
-42(⩽19
2pgml−
1):when
adjusted
fort-tauan
dbaselinevo
lume;when
adjusted
forbaselinevo
lume,sex,ag
e,APO
E4status,t-tauan
dp-tau
;when
adjusted
forbaselinevo
lume,sex,ag
e,APO
E4status,t-tauan
dp-tau
and
baselinediagnosis
Brainatroph
yVentricular
expa
nsion
Hippo
campa
latrop
hy
Ana
lyte
Adjustedregression
coefficient
PAna
lyte
Adjusted
regression
coefficient
PAna
lyte
Adjustedregression
coefficient
P
Adjustedfort-tauan
dba
selinevolume
TFF3
a(µgml−
1)
−12
.30.00
1TF
F3a(µgml−
1)
−4.7
o0.00
1TF
F3a(µgml−
1)
−0.18
o0.00
1Chromogranin-A
(ngml−
1)
−0.04
0.00
6Fibrinogen
a(m
gml−
1)
−1.4
0.00
2Angiotensin-convertingen
zymea
(ngml−
1)
4.3
0.01
2
Macrophag
eco
lony-stim
ulatingfactor1a
(ngml−
1)
−4.2
0.03
0
Chromogranin-A
(ngml−
1)
−0.01
0.03
2
Adjustedforba
selinevolume,sex,ag
e,APO
E4status,t-tau
andp-tau
TFF3
a(µgml−
1)
−13
.20.00
4TF
F3a(µgml−
1)
−4.5
o0.00
1TF
F3a(µgml−
1)
−0.23
o0.00
1Chromogranin-A
(ngml−
1)
−0.04
0.00
4
Adjustedforba
selinevolume,sex,ag
e,APO
E4status,t-tau
andp-tauan
dba
selinediag
nosis
TFF3
a(µgml−
1)
−0.23
o0.00
1
Abbreviations:
CSF,cereb
rospinal
fluid;FDR,false
disco
very
rate;p
-tau
,phosphorylatedtau;t-tau
,totaltau
;TFF3,
trefoilfactor3.
aTran
sform
eddata.Th
estatistics
arepresentedforthetran
sform
edvalues
(see
Patien
tsan
dMethods).W
heredatahas
bee
ntran
sform
edtheunitsrelate
todatabefore
tran
sform
ation.P-values
shownheredonotacco
untformultiple
comparisons.
Trefoil factor 3 predicts neurodegeneration rateRW Paterson et al
6
Translational Psychiatry (2014), 1 – 8 © 2014 Macmillan Publishers Limited

in Down’s syndrome and is typically reduced in AD CSF, withmultiple lines of evidence suggesting that it has protective roles inAD principally due to influences on amyloid processing anddeposition.33 Conversely, increased CysC immunoreactivity is seenin specific neuronal population in AD suggesting a role inneurodegeneration;33 and in dopaminergic neurons, CysC hasbeen shown to have a role in neuronal injury-mediated microglialactivation and neurotoxicity.34 Our finding of a positive relation-ship between rates of atrophy and CysC, in individuals in whomamyloid deposition has already occurred, could therefore beexplained in terms of a harmful neuroinflammatory responsewhich results in neuronal damage. VEGF, abundantly expressed inthe CNS, has roles in modulation of angiogenesis, vascularremodelling, repair, permeability and inflammation,35 and isinvolved in microglial chemotaxis perhaps reflecting an earlyresponse to amyloid deposition.36 Our finding of increasedatrophy with lower levels of CSF VEGF is consistent with VEGFhaving a protective role in AD, and in keeping with reports thattransgenic AD mice with increased neuronal expression of VEGFhave a functional improvement in memory,35 suggests thatupregulation of VEGF may be a useful therapeutic strategy forAD. Increased levels of CSF VEGF has been seen in individuals withAD and vascular dementia compared with controls37—this couldalso represent a protective response although VEGF levels werenot correlated with rate of atrophy or rate of cognitive decline.,The neuroendocrine secretory protein CgA is the major protein oflarge dense-core synaptic vesicles and may be a marker ofsynaptic dysfunction.38 In one study lower CSF levels of CgA werereported in the CSF of subjects with early onset sporadic orfamilial Alzheimer’s disease,39 potentially in keeping with ourfinding of inverse relationship between CgA level and increasedrates of brain atrophy and ventricular expansion.In a previous study using this same panel of analytes, ten CSF
measures (ACE, CgA, AXL, TNF-related apoptosis-inducing ligandreceptor, CD-40, M-CSF, beta-2-microglobulin, stem cell factor,CLU and IL-3) were shown to predict increased rates of amyloiddeposition in cognitively normal elderly individuals.13 Whencomparing these results aiming at identifying markers predictingrate of amyloid accumulation in healthy controls with ours(assessing rate of neurodegeneration in individuals with likelyamyloid pathology) it is notable that in our initial analysis, weidentified five CSF analytes common to both: AXL, CgA, CLU, IL-3and M-CSF; and including more stringent covariates that CgAremained a consistent finding. While this could reflect that rates ofamyloid deposition and brain atrophy are highly correlated—aswould be predicted in the mid-phase of AD pathogenesis—thiswould also be consistent with common mechanisms linkingamyloid deposition to subsequent neurodegeneration. However,the fact that TFF3, CysC and VEGF were not identified in previousanalyses may suggest that these analytes may be exerting theireffects on neurodegeneration independent of amyloid deposition.This study has a number of limitations. The number of subjects
is relatively small, particularly relative to the number of analytes,and these findings thus require replication in other, larger cohorts.However, we have used a statistical procedure to control formultiple comparisons, indicating that the evidence for associa-tions is moderately strong. While the use of reverse stepwiseanalysis must be considered exploratory, the consistency withwhich TFF3 emerges as a strong independent predictor of atrophyis striking. However, it is perhaps less surprising that the sameanalytes often predict all three atrophy measures, given that theatrophy measures are mutually correlated. A relatively smallpercentage of the variance in atrophy rates is explained by thesefindings suggesting that other factors and other biomarkersreflecting other independent pathways have yet to be identified,noting that a certain proportion of variance may also be due tomeasurement error. Including all individuals with low Aβ1-42 inour analysis assumes that all patients with brain amyloidosis are
on the same neuropathological spectrum. While larger, morehomogeneous samples are required to assess whether therelationships we show are driven by individuals with asympto-matic amyloidosis, MCI or established AD, it is notable that therelationship between TFF3 and hippocampal atrophy remainseven after adjusting for clinical diagnosis—which in this studyprobably simply reflects different stages of disease.We have identified a number of CSF markers that may be
associated with the rate of neurodegeneration in individuals withamyloid deposition. These candidate biomarkers warrant furtherinvestigation, potentially providing prognostic information forpatients; covariates for clinical trials; and insights into AD biology.While several of the CSF biomarkers hint at immune-mediatedlinks between responses to amyloid deposition and brain volumeloss, the function of TFF3, which we found to be the singlestrongest predictor of neurodegeneration across the spectrum ofbrain amyloidosis, is unknown. Further studies to replicate thesefindings and in particular to investigate the role of TFF3 in thepathogenesis of AD are required.
CONFLICT OF INTERESTThe authors declare no conflict of interest.
ACKNOWLEDGMENTSWe gratefully acknowledge the support of Iceland Foods, the Leonard WolfsonExperimental Neurology Centre and Alzheimer’s Research UK. This work wassupported by the NIHR Queen Square Dementia BRU. We are very grateful to thereviewers for their thoughtful suggestions. Data collection and sharing for this projectwas funded by the Alzheimer's Disease Neuroimaging Initiative (ADNI; NationalInstitutes of Health Grant U01 AG024904). ADNI is funded by the National Institute onAging, the National Institute of Biomedical Imaging and Bioengineering and throughgenerous contributions from the following: Alzheimer’s Association; Alzheimer’s DrugDiscovery Foundation; BioClinica; Biogen Idec; Bristol-Myers Squibb Company; Eisai;Elan Pharmaceuticals; Eli Lilly and Company; F. Hoffmann-La Roche and its affiliatedcompany Genentech; GE Healthcare; Innogenetics, N.V.; IXICO; Janssen AlzheimerImmunotherapy Research & Development, LLC; Johnson & Johnson PharmaceuticalResearch & Development, LLC; Medpace; Merck; Meso Scale Diagnostics, LLC;NeuroRx Research; Novartis Pharmaceuticals Corporation; Pfizer; Piramal Imaging;Servier; Synarc; and Takeda Pharmaceutical Company. The Canadian Institutes ofHealth Research is providing funds to support ADNI clinical sites in Canada. Privatesector contributions are facilitated by the Foundation for the National Institutes ofHealth (www.fnih.org). The grantee organization is the Northern California Institutefor Research and Education, and the study is coordinated by the Alzheimer's DiseaseCooperative Study at the University of California, San Diego, CA, USA. ADNI data aredisseminated by the Laboratory for Neuro Imaging at the University of California, LosAngeles, CA, USA. This research was also supported by NIH grants P30 AG010129 andK01 AG030514.
AUTHOR CONTRIBUTIONSRWP, JWB, HZ, KB, NCF and JMS were involved in study design.The investigators within the ADNI, JQT and LMS contributed to thedesign and implementation. RWP, JWB, JMS conducted thestatistical analysis, RWP wrote the manuscript first draft, whichwas reviewed and edited by NCF, JMS, LMS, JQT, HZ and JWB.
MEMBERS OF THE ALZHEIMER’S DISEASE NEUROIMAGINGINITIATIVEData used in preparation of this article were obtained from theAlzheimer’s Disease Neuroimaging Initiative (ADNI) database(adni.loni.usc.edu). As such, the investigators within the ADNIcontributed to the design and implementation of ADNI and/orprovided data but did not participate in analysis or writing of thisreport. A complete listing of ADNI investigators can be found at:http://adni.loni.usc.edu/wp-content/uploads/how_to_apply/ADNI_Acknowledgement_List.pdf
Trefoil factor 3 predicts neurodegeneration rateRW Paterson et al
7
© 2014 Macmillan Publishers Limited Translational Psychiatry (2014), 1 – 8

REFERENCES1 Schott JM, Frost C, Whitwell JL, Macmanus DG, Boyes RG, Rossor MN et al.
Combining short interval MRI in Alzheimer’s disease: implications fortherapeutic trials. J Neurol 2006; 253: 1147–1153.
2 Woo JI, Kim JH, Lee JH. Age of onset and brain atrophy in Alzheimer's disease. IntPsychogeriatr 1997; 9: 183–196.
3 Chan D, Janssen JC, Whitwell JL, Watt HC, Jenkins R, Frost C et al. Change in ratesof cerebral atrophy over time in early-onset Alzheimer's disease: longitudinalMRI study. Lancet 2003; 362: 1121–1122.
4 Barnes J, Carmichael OT, Leung KK, Schwarz C, Ridgway GR, Bartlett JW et al.Vascular and Alzheimer’s disease markers independently predict brain atrophyrate in Alzheimer’s Disease Neuroimaging Initiative controls. Neurobiol Aging2013; 34: 1996–2002.
5 Josephs KA, Whitwell JL, Knopman DS, Hu WT, Stroh DA, Baker M et al. AbnormalTDP-43 immunoreactivity in AD modifies clinicopathologic and radiologic phe-notype. Neurology 2008; 70: 1850–1857.
6 Schott JM, Bartlett JW, Barnes J, Leung KK, Ourselin S, Fox NC. Reduced samplesizes for atrophy outcomes in Alzheimer’s disease trials: baseline adjustment.Neurobiol Aging 2010; 31: 1452–1462.
7 Fox NC, Scahill RI, Crum WR, Rossor MN. Correlation between rates of brainatrophy and cognitive decline in AD. Neurology 1999; 52: 1687–1689.
8 Blennow K, Hampel H, Weiner M, Zetterberg H. Cerebrospinal fluid and plasmabiomarkers in Alzheimer disease. Nat Rev Neurol 2010; 6: 131–144.
9 Hansson O, Zetterberg H, Buchhave P, Londos E, Blennow K, Minthon L. Asso-ciation between CSF biomarkers and incipient Alzheimer’s disease in patientswith mild cognitive impairment: a follow-up study. Lancet Neurol 2006; 5:228–234.
10 Mattsson N, Insel P, Nosheny R, Trojanowski JQ, Shaw LM, Jack CR Jr et al. Effectsof cerebrospinal fluid proteins on brain atrophy rates in cognitively healthyolder adults. Neurobiol Aging 2014; 35: 614–622.
11 Shaw LM, Vanderstichele H, Knapik-Czajka M, Clark CM, Aisen PS, Petersen RCet al. Cerebrospinal fluid biomarker signature in Alzheimer's disease neuroima-ging initiative subjects. Ann Neurol 2009; 65: 403–413.
12 Kauwe J, Bailey M, Ridge P, Cruchaga C, Foutz S, Perry R et al. Association ofgenetic variants with cerebrospinal fluid protein levels of ACE, MMP3 and otherproteins and risk for Alzheimer’s disease. Alzheimers Dement 2013; 9: 677–678.
13 Mattsson N, Insel P, Nosheny R, Zetterberg H, Trojanowski JQ, Shaw LM et al. CSFprotein biomarkers predicting longitudinal reduction of CSF beta-amyloid42 incognitively healthy elders. Transl Psychiatry 2013; 3: e293.
14 Box GEP, Cox DR. An analysis of transformations. J Roy Stat Soc B 1964; 26:211–252.
15 Jack CR Jr, Bernstein MA, Fox NC, Thompson P, Alexander G, Harvey D et al. TheAlzheimer's Disease Neuroimaging Initiative (ADNI): MRI methods. J Magn ResonImaging 2008; 27: 685–691.
16 Freeborough PA, Fox NC. The boundary shift integral: an accurate and robustmeasure of cerebral volume changes from registered repeat MRI. IEEE Trans MedImaging 1997; 16: 623–629.
17 Leung KK, Barnes J, Ridgway GR, Bartlett JW, Clarkson MJ, Macdonald K et al.Automated cross-sectional and longitudinal hippocampal volume measurementin mild cognitive impairment and Alzheimer's disease. Neuroimage. 2010; 51:1345–1359.
18 Schott JM, Price SL, Frost C, Whitwell JL, Rossor MN, Fox NC. Measuring atrophy inAlzheimer disease: a serial MRI study over 6 and 12 months. Neurology 2005; 65:119–124.
19 Klipper-Aurbach Y, Wasserman M, Braunspiegel-Weintrob N et al. Mathematicalformulae for the prediction of the residual beta cell function during the first twoyears of disease in children and adolescents with insulin-dependent diabetesmellitus. Med Hypotheses 1995; 45: 486–490.
20 Benjamini Y, Drai D, Elmer G, Kafkafi N, Golani I. Controlling the false discoveryrate in behavior genetics research. Behav Brain Res 2001; 125: 279–284.
21 Jack CR Jr, Knopman DS, Jagust WJ, Petersen RC, Weiner MW, Aisen PS et al.Tracking pathophysiological processes in Alzheimer's disease: an updated hypo-thetical model of dynamic biomarkers. Lancet Neurol 2013; 12: 207–216.
22 Fox NC, Schott JM. Imaging cerebral atrophy: normal ageing to Alzheimer's dis-ease. Lancet 2004; 363: 392–394.
23 Jack CR Jr., Shiung MM, Gunter JL, O’Brien PC, Weigand SD, Knopman DS et al.Comparison of different MRI brain atrophy rate measures with clinical diseaseprogression in AD. Neurology 2004; 62: 591–600.
24 Andrews KA, Modat M, Macdonald KE, Yeatman T, Cardoso MJ, Leung KK et al.Atrophy rates in asymptomatic amyloidosis: implications for Alzheimerprevention trials. PloS One 2013; 8: e58816.
25 Villemagne VL, Burnham S, Bourgeat P, Brown B, Ellis KA, Salvado O et al. Amyloidbeta deposition, neurodegeneration, and cognitive decline in sporadic Alzhei-mer's disease: a prospective cohort study. Lancet Neurol 2013; 12: 357–367.
26 Whitwell JL, Petersen RC, Negash S, Weigand SD, Kantarci K, Ivnik RJ et al. Patternsof atrophy differ among specific subtypes of mild cognitive impairment. ArchNeurol 2007; 64: 1130–1138.
27 Blennow K, Hampel H. CSF markers for incipient Alzheimer's disease. LancetNeurol 2003; 2: 605–613.
28 Probst JC, Zetzsche T, Weber M, Theilemann P, Skutella T, Landgraf R et al. Humanintestinal trefoil factor is expressed in human hypothalamus and pituitary: evi-dence for a novel neuropeptide. FASEB J 1996; 10: 1518–1523.
29 Hinz M, Schwegler H, Chwieralski CE, Laube G, Linke R, Pohle W et al. Trefoil factorfamily (TFF) expression in the mouse brain and pituitary: changes in the devel-oping cerebellum. Peptides 2004; 25: 827–832.
30 Shi HS, Yin X, Song L, Guo QJ, Luo XH. Neuropeptide Trefoil factor 3 improveslearning and retention of novel object recognition memory in mice. Behav BrainRes 2012; 227: 265–269.
31 Denton R, Meredith JE. Gamma secretase Notch biomarkers. US patent US7,989,208; 2011.
32 Tong G, Wang JS, Sverdlov O, Huang SP, Slemmon R, Croop R et al. Multicenter,randomized, double-blind, placebo-controlled, single-ascending dose study ofthe oral gamma-secretase inhibitor BMS-708163 (Avagacestat): tolerability profile,pharmacokinetic parameters, and pharmacodynamic markers. Clin Ther 2012; 34:654–667.
33 Kaur G, Levy E. Cystatin C in Alzheimer's disease. Front Mol Neurosci 2012; 5: 79.34 Dutta G, Barber DS, Zhang P, Doperalski NJ, Liu B. Involvement of dopaminergic
neuronal cystatin C in neuronal injury-induced microglial activation and neuro-toxicity. J Neurochem 2012; 122: 752–763.
35 Religa P, Cao R, Religa D, Xue Y, Bogdanovic N, Westaway D et al. VEGF sig-nificantly restores impaired memory behavior in Alzheimer’s mice by improve-ment of vascular survival. Sci Rep 2013; 3: 2053.
36 McLarnon JG. Microglial chemotactic signaling factors in Alzheimer's disease. AmJ Neurodegener Dis 2012; 1: 199–204.
37 Tarkowski E, Issa R, Sjogren M, Wallin A, Blennow K, Tarkowski A et al. Increasedintrathecal levels of the angiogenic factors VEGF and TGF-beta in Alzheimer’sdisease and vascular dementia. Neurobiol Aging 2002; 23: 237–243.
38 Fagan AM, Perrin RJ. Upcoming candidate cerebrospinal fluid biomarkers ofAlzheimer's disease. Biomark Med 2012; 6: 455–476.
39 Blennow K, Davidsson P, Wallin A, Ekman R. Chromogranin A in cerebrospinalfluid: a biochemical marker for synaptic degeneration in Alzheimer’s disease?.Dementia 1995; 6: 306–311.
This work is licensed under a Creative Commons Attribution 3.0Unported License. The images or other third party material in this
article are included in the article’s Creative Commons license, unless indicatedotherwise in the credit line; if the material is not included under the Creative Commonslicense, users will need to obtain permission from the license holder to reproduce thematerial. To view a copy of this license, visit http://creativecommons.org/licenses/by/3.0/
Supplementary Information accompanies the paper on the Translational Psychiatry website (http://www.nature.com/tp)
Trefoil factor 3 predicts neurodegeneration rateRW Paterson et al
8
Translational Psychiatry (2014), 1 – 8 © 2014 Macmillan Publishers Limited
![22.10.2010 SVN Accounts [NPFL094:/] … vojtech.diatka = rw ejemr = rw machacekmatous = rw sedlak = rw masekj = rw.](https://static.fdocuments.us/doc/165x107/56649e115503460f94afcb54/22102010httpufalmffcuniczcoursenpfl0941-svn-accounts-npfl094.jpg)