Patents and the Performance of Voluntary Standard...
36
Patents and the Performance of Voluntary Standard Setting Organizations * Marc Rysman Boston University, Department of Economics Tim Simcoe J.L. Rotman School of Management, University of Toronto June 2007 * Financial support for this research was provided by CITRIS, and the NET Institute. Useful comments were received from Kevin Lang, Josh Lerner, David Mowery, Bronwyn Hall, Avi Goldfarb, Shane Greenstein, Ken Corts, Katrin Cremers, Michael Ward and seminar participants at Brandies University, UC Berkeley, the International Industrial Organization Conference in Boston (2006) and the NET Institute Conference (NY, 2006). Address for correspondence: Joseph L. Rotman School of Management, 105 St. George Street, Toronto, ON M5S 3E6,Canada. E-mail: [email protected]
Transcript of Patents and the Performance of Voluntary Standard...
Patents and the Performance of Voluntary Standard Setting
Organizations ∗
Marc Rysman
Boston University, Department of Economics
Tim Simcoe
J.L. Rotman School of Management, University of Toronto
June 2007
∗Financial support for this research was provided by CITRIS, and the NET Institute. Useful commentswere received from Kevin Lang, Josh Lerner, David Mowery, Bronwyn Hall, Avi Goldfarb, Shane Greenstein,Ken Corts, Katrin Cremers, Michael Ward and seminar participants at Brandies University, UC Berkeley, theInternational Industrial Organization Conference in Boston (2006) and the NET Institute Conference (NY,2006). Address for correspondence: Joseph L. Rotman School of Management, 105 St. George Street, Toronto,ON M5S 3E6,Canada. E-mail: [email protected]
Patents and the Performance of Voluntary Standard Setting
Organizations
Abstract
This paper examines the economic and technological significance of voluntary stan-dard setting organizations (SSOs). These groups are common in industries withstrong network effects, where they provide a forum for collective decision-makingand an alternative to coordination through market competition or government reg-ulation. We use patent citations as a measure of SSO performance. Specifically,we model the flow of citations to a sample of U.S. patents disclosed during thestandard-setting process at four major SSOs. Our main results show that the agedistribution of SSO patent citations is shifted towards later years (relative to anaverage patent), and that citations increase substantially following disclosure. Thissuggests that SSOs identify promising solutions and play an important role in pro-moting their adoption and diffusion. These results provide the first empirical lookat patents disclosed to SSOs.
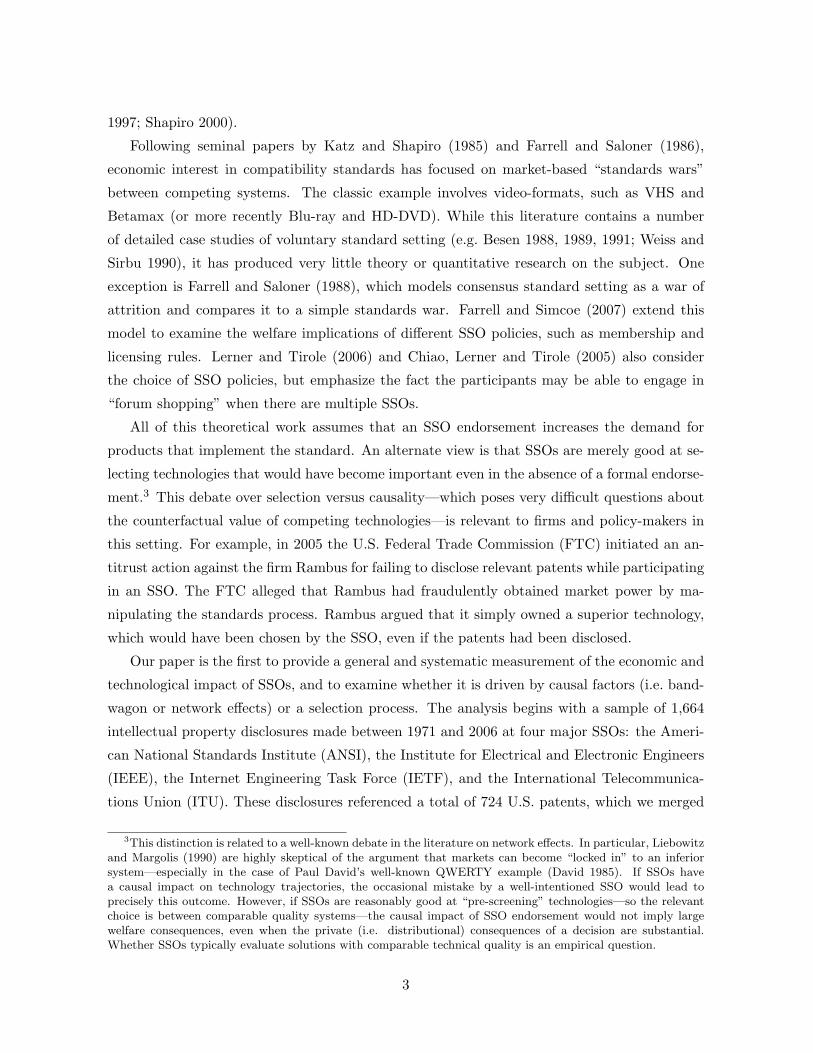
1 Introduction
Voluntary standard setting organizations (SSOs) are a diverse set of institutions that produce
new standards and promote voluntary codes of conduct through labeling and certification pro-
grams. They include global organizations such as the International Organization for Standards
(ISO) or the Forest Stewardship Council, national standards developers like Health Level Seven,
and a wide variety of private consortia and industry associations.1 SSOs provide a forum for
collective decision-making and an alternative to standardization through market competition
or government regulation. They are thus a leading venue for industry self-regulation (Maxwell
et al 2000) and the private provision of public goods (Buchanan 1965).
A defining feature of SSOs is their lack of formal authority. They cannot force firms to
comply with their standards. As a result, SSOs work to create a consensus around particular
solutions. This process resembles decision-making at multi-lateral institutions—such as the
United Nations or the World Trade Organization—where voting rules must be “self enforcing”
(Maggi and Morelli 2006). The goal is to produce standards that can serve as a focal point for
industry coordination or lead to a bandwagon process among adopters.
How well does the consensus process work? Despite the vast scope of standard-setting
activity, there is little systematic evidence on the economic impact of voluntary standards.
Measuring the impact of SSOs is difficult because they operate in diverse markets and their
effect on such standard variables as price and quantity is usually ambiguous. In this paper, we
use patent citations as a window onto the role of SSOs in economic and technological change.
Participants in the standard setting process are usually obliged to disclose relevant patents to
an SSO. We model the flow of citations to a particular patent and observe what happens when
an SSO creates a new standard based on the underlying technology.2
In order to link a standard to a set of patents associated with the underlying technology,
we focus on a specific domain—technical compatibility standards—where intellectual property
plays a prominent role in the standard setting process. Compatibility standards are partic-
ularly important for industries where consumers value inter-operability (e.g. computing and
telecommunications). Firms in these industries devote substantial resources to the standard
setting process, which is often seen as critical to opening up new technology markets (Cargill
1The Forest Stewardship Council promotes sustainable forest management by producing a voluntary code ofconduct and administering a certification and labeling program that has been adopted by many of the largestforest-products retailers (e.g. Home Depot). Health Level Seven develops inter-operability standards for healthcare information systems to promote the sharing of clinical and administrative data, particularly among U.S.hospitals.
2This approach builds on a large literature that has established patent citations as a valid measure of economicvalue and technological significance (Harhoff et al 1999; Jaffe and Trajtenberg, 2004; Hall, Jaffe and Trajtenberg,2005).
2
1997; Shapiro 2000).
Following seminal papers by Katz and Shapiro (1985) and Farrell and Saloner (1986),
economic interest in compatibility standards has focused on market-based “standards wars”
between competing systems. The classic example involves video-formats, such as VHS and
Betamax (or more recently Blu-ray and HD-DVD). While this literature contains a number
of detailed case studies of voluntary standard setting (e.g. Besen 1988, 1989, 1991; Weiss and
Sirbu 1990), it has produced very little theory or quantitative research on the subject. One
exception is Farrell and Saloner (1988), which models consensus standard setting as a war of
attrition and compares it to a simple standards war. Farrell and Simcoe (2007) extend this
model to examine the welfare implications of different SSO policies, such as membership and
licensing rules. Lerner and Tirole (2006) and Chiao, Lerner and Tirole (2005) also consider
the choice of SSO policies, but emphasize the fact the participants may be able to engage in
“forum shopping” when there are multiple SSOs.
All of this theoretical work assumes that an SSO endorsement increases the demand for
products that implement the standard. An alternate view is that SSOs are merely good at se-
lecting technologies that would have become important even in the absence of a formal endorse-
ment.3 This debate over selection versus causality—which poses very difficult questions about
the counterfactual value of competing technologies—is relevant to firms and policy-makers in
this setting. For example, in 2005 the U.S. Federal Trade Commission (FTC) initiated an an-
titrust action against the firm Rambus for failing to disclose relevant patents while participating
in an SSO. The FTC alleged that Rambus had fraudulently obtained market power by ma-
nipulating the standards process. Rambus argued that it simply owned a superior technology,
which would have been chosen by the SSO, even if the patents had been disclosed.
Our paper is the first to provide a general and systematic measurement of the economic and
technological impact of SSOs, and to examine whether it is driven by causal factors (i.e. band-
wagon or network effects) or a selection process. The analysis begins with a sample of 1,664
intellectual property disclosures made between 1971 and 2006 at four major SSOs: the Ameri-
can National Standards Institute (ANSI), the Institute for Electrical and Electronic Engineers
(IEEE), the Internet Engineering Task Force (IETF), and the International Telecommunica-
tions Union (ITU). These disclosures referenced a total of 724 U.S. patents, which we merged
3This distinction is related to a well-known debate in the literature on network effects. In particular, Liebowitzand Margolis (1990) are highly skeptical of the argument that markets can become “locked in” to an inferiorsystem—especially in the case of Paul David’s well-known QWERTY example (David 1985). If SSOs havea causal impact on technology trajectories, the occasional mistake by a well-intentioned SSO would lead toprecisely this outcome. However, if SSOs are reasonably good at “pre-screening” technologies—so the relevantchoice is between comparable quality systems—the causal impact of SSO endorsement would not imply largewelfare consequences, even when the private (i.e. distributional) consequences of a decision are substantial.Whether SSOs typically evaluate solutions with comparable technical quality is an empirical question.
3

with the NBER U.S. patents database (Hall, Jaffe and Trajtenberg 2001).
Our first look at citation patterns reveals that SSO patents receive many more citations
than an average patent from the same technological field and application year. Not surprisingly,
SSO patents are more important than the average patent. A more striking result uses methods
developed by Mehta, Rysman, and Simcoe (2006) to demonstrate a significant difference in the
age distribution of these citations. Specifically, SSO patent citations are less concentrated in
the first few years after the patent is granted—suggesting that these patents are both more
significant and have a longer useful life than the average patent.
Why do the SSO patents exhibit a different citation-age distribution? We consider two
possible explanations—SSOs may select patents corresponding to important technologies, or
they might cause patents to exhibit the observed citation profile. The selection effect is natural
given that SSOs explicitly attempt to identify the best technology to serve a given need. The
causal effect may arise because an SSO embeds a technology in a standard that exhibits long-
lasting economic importance through network effects and path-dependence, or because an SSO
disclosure represents a public announcement that attracts attention to a patent and creates
bandwagons in the technology adoption process.
Distinguishing between the selection and causal effects requires the estimation of a counter-
factual: what would have happened to a disclosed patent if the disclosure had never occurred?
We consider two approaches to this problem. The first approach focuses on SSO patents and
uses pre-disclosure observations to estimate the counterfactual citation rate. In this model,
the impact of disclosure is identified by within-patent changes in citation frequency following
disclosure. Our second approach combines the SSO patents with a set of “controls” in a pooled
cross-sectional regression. This allows estimation of both a time-invariant SSO effect, and a
post-disclosure coefficient (which we interpret as a measure of network effects).4 Both methods
rely on variation in the age of patents when they are disclosed. While we cannot sign the
potential bias from measurement error or endogeneity of the disclosure date, the main results
do not change when we vary our assumptions about the timing of disclosure.
We find that the baseline citation rate for SSO patents is roughly double that of an average
patent. We also find that disclosure produces a 20 to 40 percent increase in the SSO patent ci-
tation rate. These results indicate that SSOs select technologies that are already important and
increase their significance through formal endorsement and other efforts to promote industry
coordination. Although it is difficult to attach a dollar value to citation counts, the estimates
in Harhoff et al (1999) and Hall, Jaffe and Trajtenberg (2005) suggest that our findings are
4In our regressions, the “selection effect” measures differences between an average patent and an SSO patent.This could be larger or smaller than the difference between a patent “at risk” for disclosure (i.e. a patent on atechnology that is evaluated by an SSO), and a patent that is essential to implement the formal standard.
4

economically meaningful.
In the next section, we describe the four SSOs examined in this paper and how they treat
intellectual property. Section 3 describes the data set, while Section 4 takes an initial look at
the difference in citation patterns between the SSO and control samples. Section 5 examines
the post-disclosure increase in citation rates. Section 6 offers some conclusions.
2 SSOs and Intellectual Property
This four SSOs examined in this paper are the American National Standards Institute (ANSI),
the Institute of Electrical and Electronics Engineers (IEEE), the Internet Engineering Task
Force (IETF), and the International Telecommunications Union - Telecommunication Stan-
dardization Sector (ITU-T, or often, ITU). The ITU is an international institution focused
primarily on telecommunications standards. While international in scope, the IEEE and IETF
draw the majority of their participants from North America and are usually associated with
the computer hardware and software industries. ANSI is an umbrella organization that pro-
mulgates a common set of rules and procedures for U.S. standards developers in a wide variety
of industries. Most of the patents disclosed to these four SSOs cover computing and commu-
nications technology, as Table 1 illustrates using the primary technology-class assigned to each
patent by the U.S. Patent and Trademark Office (USPTO).
The ITU is the oldest of the four SSOs, with origins dating back to around 1865. Its orig-
inal mission was to promote international coordination among the various rapidly expanding
domestic telephone networks. The ITU is based in Switzerland, and its membership consists
of delegates from member nations along with representatives of the larger firms or network
operators in each of these countries. The ITU’s standard setting activities continue to em-
phasize the protocols used to operate the international telephone network. Recent efforts have
focused on numbering and addressing, network services, physical interconnection, monitoring
and accounting, traffic management, and quality of service.
The IEEE was founded in 1884 by several pioneers in the field of electrical engineering.
Although the IEEE is a professional society whose members are individual engineers, it is
possible to become a corporate member when participating in its standard setting activities.
The IEEE’s standard setting efforts cover a wide range of subjects, from electrical safety, to
cryptography, to standards for semiconductor testing equipment. In recent years, the IEEE’s
most commercially significant standards work has revolved around the 802.11 specifications for
wireless networking, commonly known as Wi-Fi.
ANSI was formed in 1918 to coordinate the ongoing standards development efforts of a
5
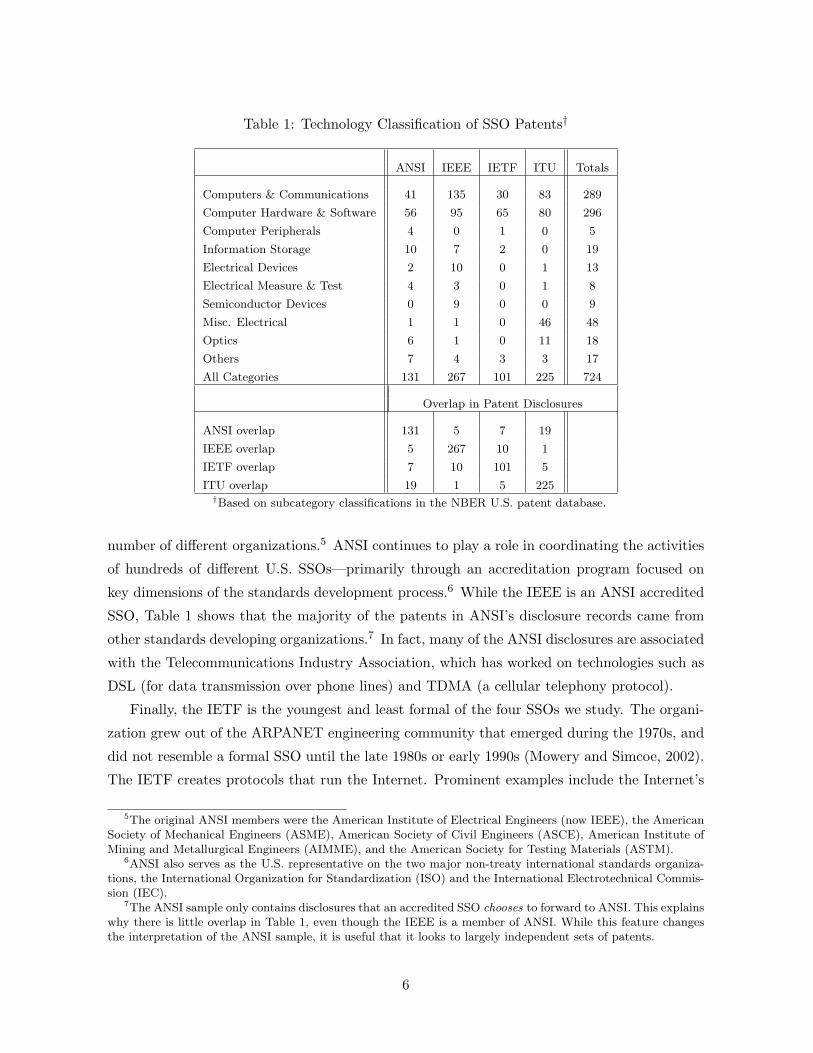
Table 1: Technology Classification of SSO Patents†
ANSI IEEE IETF ITU Totals
Computers & Communications 41 135 30 83 289
Computer Hardware & Software 56 95 65 80 296
Computer Peripherals 4 0 1 0 5
Information Storage 10 7 2 0 19
Electrical Devices 2 10 0 1 13
Electrical Measure & Test 4 3 0 1 8
Semiconductor Devices 0 9 0 0 9
Misc. Electrical 1 1 0 46 48
Optics 6 1 0 11 18
Others 7 4 3 3 17
All Categories 131 267 101 225 724
Overlap in Patent Disclosures
ANSI overlap 131 5 7 19
IEEE overlap 5 267 10 1
IETF overlap 7 10 101 5
ITU overlap 19 1 5 225†Based on subcategory classifications in the NBER U.S. patent database.
number of different organizations.5 ANSI continues to play a role in coordinating the activities
of hundreds of different U.S. SSOs—primarily through an accreditation program focused on
key dimensions of the standards development process.6 While the IEEE is an ANSI accredited
SSO, Table 1 shows that the majority of the patents in ANSI’s disclosure records came from
other standards developing organizations.7 In fact, many of the ANSI disclosures are associated
with the Telecommunications Industry Association, which has worked on technologies such as
DSL (for data transmission over phone lines) and TDMA (a cellular telephony protocol).
Finally, the IETF is the youngest and least formal of the four SSOs we study. The organi-
zation grew out of the ARPANET engineering community that emerged during the 1970s, and
did not resemble a formal SSO until the late 1980s or early 1990s (Mowery and Simcoe, 2002).
The IETF creates protocols that run the Internet. Prominent examples include the Internet’s
5The original ANSI members were the American Institute of Electrical Engineers (now IEEE), the AmericanSociety of Mechanical Engineers (ASME), American Society of Civil Engineers (ASCE), American Institute ofMining and Metallurgical Engineers (AIMME), and the American Society for Testing Materials (ASTM).
6ANSI also serves as the U.S. representative on the two major non-treaty international standards organiza-tions, the International Organization for Standardization (ISO) and the International Electrotechnical Commis-sion (IEC).
7The ANSI sample only contains disclosures that an accredited SSO chooses to forward to ANSI. This explainswhy there is little overlap in Table 1, even though the IEEE is a member of ANSI. While this feature changesthe interpretation of the ANSI sample, it is useful that it looks to largely independent sets of patents.
6
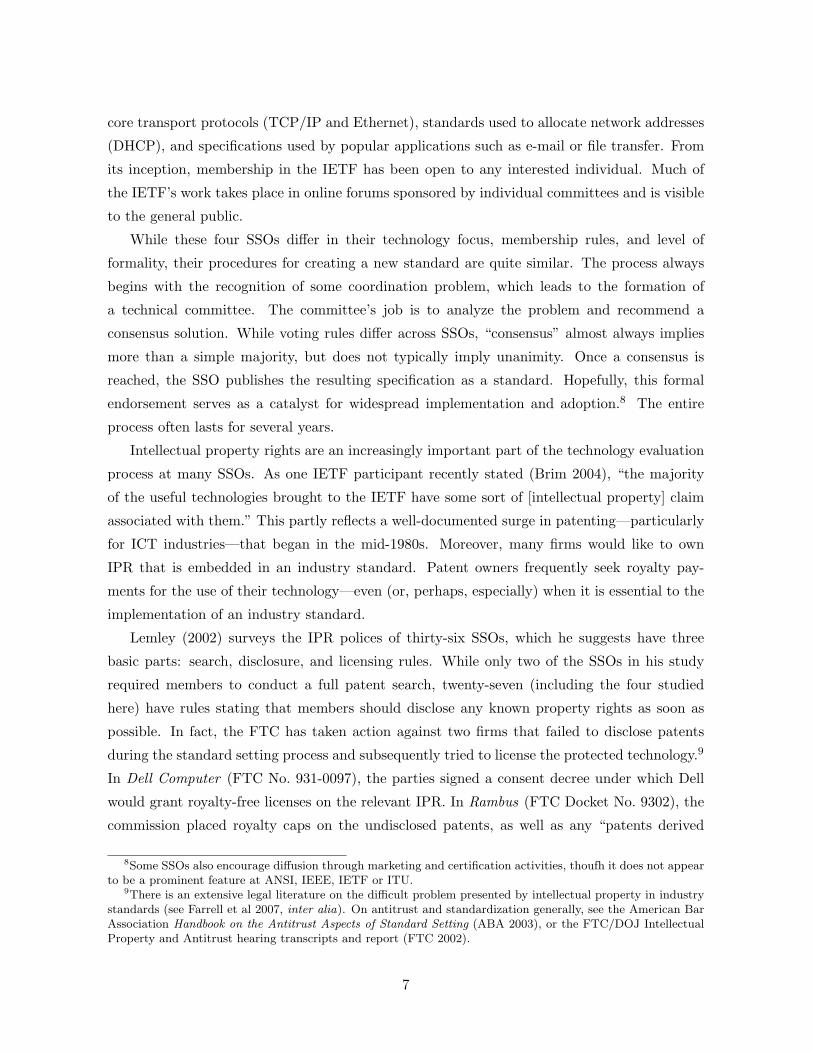
core transport protocols (TCP/IP and Ethernet), standards used to allocate network addresses
(DHCP), and specifications used by popular applications such as e-mail or file transfer. From
its inception, membership in the IETF has been open to any interested individual. Much of
the IETF’s work takes place in online forums sponsored by individual committees and is visible
to the general public.
While these four SSOs differ in their technology focus, membership rules, and level of
formality, their procedures for creating a new standard are quite similar. The process always
begins with the recognition of some coordination problem, which leads to the formation of
a technical committee. The committee’s job is to analyze the problem and recommend a
consensus solution. While voting rules differ across SSOs, “consensus” almost always implies
more than a simple majority, but does not typically imply unanimity. Once a consensus is
reached, the SSO publishes the resulting specification as a standard. Hopefully, this formal
endorsement serves as a catalyst for widespread implementation and adoption.8 The entire
process often lasts for several years.
Intellectual property rights are an increasingly important part of the technology evaluation
process at many SSOs. As one IETF participant recently stated (Brim 2004), “the majority
of the useful technologies brought to the IETF have some sort of [intellectual property] claim
associated with them.” This partly reflects a well-documented surge in patenting—particularly
for ICT industries—that began in the mid-1980s. Moreover, many firms would like to own
IPR that is embedded in an industry standard. Patent owners frequently seek royalty pay-
ments for the use of their technology—even (or, perhaps, especially) when it is essential to the
implementation of an industry standard.
Lemley (2002) surveys the IPR polices of thirty-six SSOs, which he suggests have three
basic parts: search, disclosure, and licensing rules. While only two of the SSOs in his study
required members to conduct a full patent search, twenty-seven (including the four studied
here) have rules stating that members should disclose any known property rights as soon as
possible. In fact, the FTC has taken action against two firms that failed to disclose patents
during the standard setting process and subsequently tried to license the protected technology.9
In Dell Computer (FTC No. 931-0097), the parties signed a consent decree under which Dell
would grant royalty-free licenses on the relevant IPR. In Rambus (FTC Docket No. 9302), the
commission placed royalty caps on the undisclosed patents, as well as any “patents derived
8Some SSOs also encourage diffusion through marketing and certification activities, thoufh it does not appearto be a prominent feature at ANSI, IEEE, IETF or ITU.
9There is an extensive legal literature on the difficult problem presented by intellectual property in industrystandards (see Farrell et al 2007, inter alia). On antitrust and standardization generally, see the American BarAssociation Handbook on the Antitrust Aspects of Standard Setting (ABA 2003), or the FTC/DOJ IntellectualProperty and Antitrust hearing transcripts and report (FTC 2002).
7

from applications filed while Rambus was a member of [the SSO].”10
When a member does disclose a patent or other piece of intellectual property, the SSO will
generally seek assurances that the owner is willing to grant a non-exclusive license to any inter-
ested party on “reasonable and non-discriminatory” (RAND) terms. Lemley (2002) indicates
that a RAND promise commits firms to non-exclusive licensing and prevents them from pur-
suing injunctive relief in any patent litigation. However, the precise meaning of “reasonable”
royalty rates is a contentious issue that is currently under litigation (Nokia Inc. vs. Qualcomm
Inc. Civ. A. No. 2330-N, Delaware).11 ANSI, IEEE and the ITU have explicit RAND policies,
while the IETF’s policy is closer to a de facto RAND requirement implemented by individual
technical committees.
Beyond seeking disclosure and RAND commitments, SSOs have been very hesitant to be-
come involved in the licensing process. For example, the IEEE explicitly prohibited any mention
of patent licensing prior to 2007. This rule was recently modified to allow firms to state a max-
imum royalty rate as part of their IPR disclosure—though they are still not allowed to discuss
these rates at technical committee meetings. This cautiousness reflects SSOs’ concerns about
the antitrust implications associated with any type of collective pricing agreement.12 It also
suggests that some SSOs fear alienating particular members.
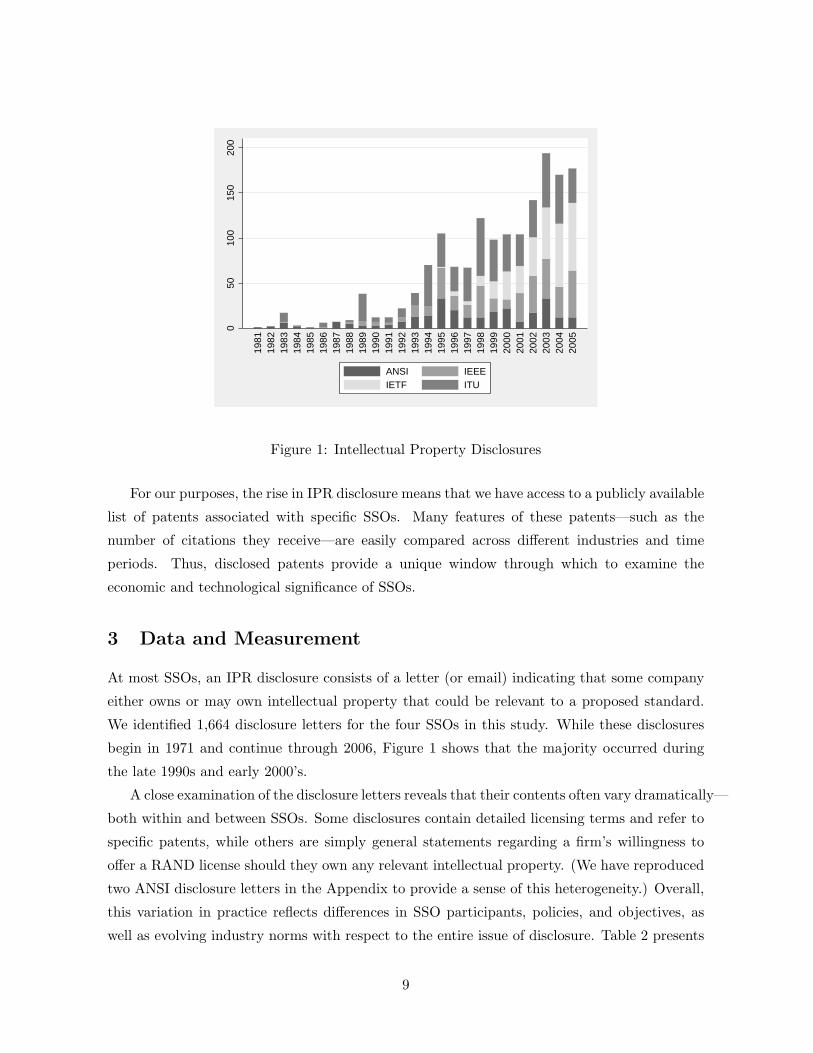
Our empirical work uses information collected from the publicly available IPR disclosure
archives of ANSI, IEEE, IETF and the ITU. Figure 1 illustrates the growth in disclosures at
these four SSOs. (We define a disclosure as an announcement on a given date by a single firm
that it potentially owns one or more pieces of intellectual property needed to implement a pro-
posed standard.13) Although initially quite small, the number of IPR disclosures began to grow
during the early 1990’s. By the early 2000s, all four SSOs were experiencing significant growth.
This increase reflects several factors: the surge in ICT patents granted; increased demand for
compatibility standards, driven by diffusion of the Internet and wireless telecommunications;
and a perceived strengthening of disclosure requirements, especially in the wake of Dell and
Rambus.
10Opinion of the Commission on Remedy (pg. 28).11In particular, the RAND promise is rarely taken to mean that the technology must be offered at a uniform
price. When the intellectual-property holder has not made an ex ante commitment to some set of licensing terms,each potential implementor of the standard will negotiate their own terms. And while licensors are expected tonegotiate in good faith with any potential developer, the individual terms offered may vary widely.
12The Standards Development Organization Advancement Act of 2004 (H.R. 1086) addressed some of theseantitrust concerns by extending to certain SSOs protections in the National Cooperative Research and ProductionAct of 1993: making them subject to the rule of reason standard in any antitrust action, and limiting liability toactual rather than treble damages. Nevertheless, SSOs often cite fears of (perhaps baseless) antitrust lawsuits.Recently, antitrust agencies have sought to assuage such concerns: see e.g. Majoras (2005) or the discussion inthe FTC’s unanimous Rambus opinion (FTC 2006, page 36).
13When a firm claims that a single patent covers two or more standards, each one counts as a separatedisclosure. However, we only keep one copy of the patent in our data for analysis.
8
050
100
150
200
1981
1982
1983
1984
1985
1986
1987
1988
1989
1990
1991
1992
1993
1994
1995
1996
1997
1998
1999
2000
2001
2002
2003
2004
2005
ANSI IEEEIETF ITU
Figure 1: Intellectual Property Disclosures
For our purposes, the rise in IPR disclosure means that we have access to a publicly available
list of patents associated with specific SSOs. Many features of these patents—such as the
number of citations they receive—are easily compared across different industries and time
periods. Thus, disclosed patents provide a unique window through which to examine the
economic and technological significance of SSOs.
3 Data and Measurement
At most SSOs, an IPR disclosure consists of a letter (or email) indicating that some company
either owns or may own intellectual property that could be relevant to a proposed standard.
We identified 1,664 disclosure letters for the four SSOs in this study. While these disclosures
begin in 1971 and continue through 2006, Figure 1 shows that the majority occurred during
the late 1990s and early 2000’s.
A close examination of the disclosure letters reveals that their contents often vary dramatically—
both within and between SSOs. Some disclosures contain detailed licensing terms and refer to
specific patents, while others are simply general statements regarding a firm’s willingness to
offer a RAND license should they own any relevant intellectual property. (We have reproduced
two ANSI disclosure letters in the Appendix to provide a sense of this heterogeneity.) Overall,
this variation in practice reflects differences in SSO participants, policies, and objectives, as
well as evolving industry norms with respect to the entire issue of disclosure. Table 2 presents
9
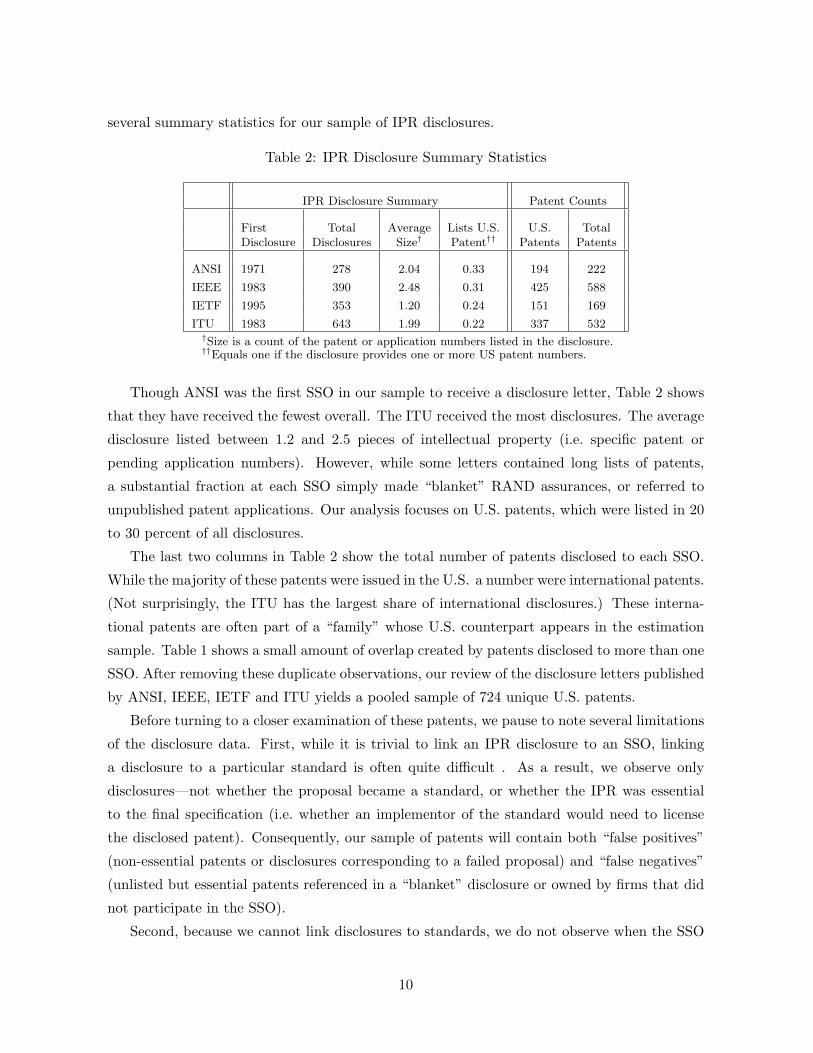
several summary statistics for our sample of IPR disclosures.
Table 2: IPR Disclosure Summary Statistics
IPR Disclosure Summary Patent Counts
First Total Average Lists U.S. U.S. TotalDisclosure Disclosures Size† Patent†† Patents Patents
ANSI 1971 278 2.04 0.33 194 222
IEEE 1983 390 2.48 0.31 425 588
IETF 1995 353 1.20 0.24 151 169
ITU 1983 643 1.99 0.22 337 532†Size is a count of the patent or application numbers listed in the disclosure.††Equals one if the disclosure provides one or more US patent numbers.
Though ANSI was the first SSO in our sample to receive a disclosure letter, Table 2 shows
that they have received the fewest overall. The ITU received the most disclosures. The average
disclosure listed between 1.2 and 2.5 pieces of intellectual property (i.e. specific patent or
pending application numbers). However, while some letters contained long lists of patents,
a substantial fraction at each SSO simply made “blanket” RAND assurances, or referred to
unpublished patent applications. Our analysis focuses on U.S. patents, which were listed in 20
to 30 percent of all disclosures.
The last two columns in Table 2 show the total number of patents disclosed to each SSO.
While the majority of these patents were issued in the U.S. a number were international patents.
(Not surprisingly, the ITU has the largest share of international disclosures.) These interna-
tional patents are often part of a “family” whose U.S. counterpart appears in the estimation
sample. Table 1 shows a small amount of overlap created by patents disclosed to more than one
SSO. After removing these duplicate observations, our review of the disclosure letters published
by ANSI, IEEE, IETF and ITU yields a pooled sample of 724 unique U.S. patents.
Before turning to a closer examination of these patents, we pause to note several limitations
of the disclosure data. First, while it is trivial to link an IPR disclosure to an SSO, linking
a disclosure to a particular standard is often quite difficult . As a result, we observe only
disclosures—not whether the proposal became a standard, or whether the IPR was essential
to the final specification (i.e. whether an implementor of the standard would need to license
the disclosed patent). Consequently, our sample of patents will contain both “false positives”
(non-essential patents or disclosures corresponding to a failed proposal) and “false negatives”
(unlisted but essential patents referenced in a “blanket” disclosure or owned by firms that did
not participate in the SSO).
Second, because we cannot link disclosures to standards, we do not observe when the SSO
10
reaches a consensus or makes a formal endorsement. We would certainly examine these other
dates if they were available. However, the disclosure date is appealing as it represents the
moment when the link between IPR and proposed standard becomes public. In practice, this
tends to occur shortly before standardization. As we noted above, participants that delay for
too long may forfeit their property rights. At the same time, premature disclosure may lead
a committee to reconsider the technology proposed by a particular member. Chiao, Lerner
and Tirole (forthcoming) cite concerns that disclosure may reveal sensitive information about
a firm’s R&D strategy or spur efforts to “invent around” a particularly strong patent.14 And
from a practical perspective, firms may save money by delaying a full patent search until the
outlines of a final specification become clear (there is often considerable uncertainty at the start
of the standard-setting process).
Finally, it is unlikely that our sample of disclosed patents are broadly representative of the
technology evaluated by these four SSOs. Rather, these patents are likely to be concentrated
within several of the most commercially significant standard setting efforts. And as Table 1 sug-
gests, these standards are highly concentrated in the ICT sector. Nevertheless, we believe the
patents listed in these IPR disclosures provide a unique window into the technology evaluated
by SSOs, and can be used to address important questions about SSO performance.
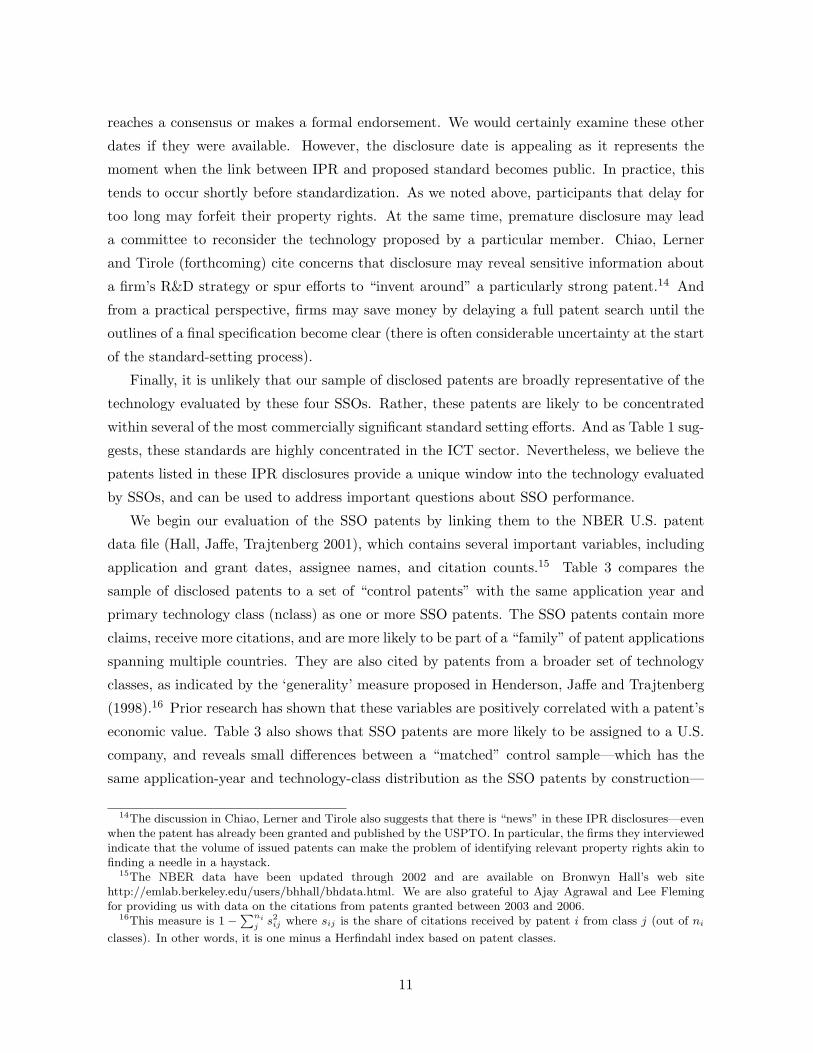
We begin our evaluation of the SSO patents by linking them to the NBER U.S. patent
data file (Hall, Jaffe, Trajtenberg 2001), which contains several important variables, including
application and grant dates, assignee names, and citation counts.15 Table 3 compares the
sample of disclosed patents to a set of “control patents” with the same application year and
primary technology class (nclass) as one or more SSO patents. The SSO patents contain more
claims, receive more citations, and are more likely to be part of a “family” of patent applications
spanning multiple countries. They are also cited by patents from a broader set of technology
classes, as indicated by the ‘generality’ measure proposed in Henderson, Jaffe and Trajtenberg
(1998).16 Prior research has shown that these variables are positively correlated with a patent’s
economic value. Table 3 also shows that SSO patents are more likely to be assigned to a U.S.
company, and reveals small differences between a “matched” control sample—which has the
same application-year and technology-class distribution as the SSO patents by construction—
14The discussion in Chiao, Lerner and Tirole also suggests that there is “news” in these IPR disclosures—evenwhen the patent has already been granted and published by the USPTO. In particular, the firms they interviewedindicate that the volume of issued patents can make the problem of identifying relevant property rights akin tofinding a needle in a haystack.
15The NBER data have been updated through 2002 and are available on Bronwyn Hall’s web sitehttp://emlab.berkeley.edu/users/bhhall/bhdata.html. We are also grateful to Ajay Agrawal and Lee Flemingfor providing us with data on the citations from patents granted between 2003 and 2006.
16This measure is 1 −∑ni
js2
ij where sij is the share of citations received by patent i from class j (out of ni
classes). In other words, it is one minus a Herfindahl index based on patent classes.
11
and the set of all eligible control patents.17
Table 3: SSO Patent Characteristics
Pooled Sample Individual SSOs
Matched AllSSO Controls† Controls† ANSI IEEE IETF ITU
Total Claims 20.54 14.80 14.58 20.38 23.17 22.83 17.41
Total Cites 22.26 9.93 6.81 26.37 19.72 26.68 20.89
Cites/Year 2.36 1.16 0.92 2.41 2.19 3.14 2.18
Cites/Year/Claim 0.23 0.16 0.13 0.23 0.21 0.34 0.23
Generality 0.52 0.43 0.40 0.57 0.53 0.51 0.49
Int’l Family 0.42 0.33 0.31 0.37 0.39 0.29 0.56
Application Year 1992.7 1992.7 1993.9 1990.7 1993.6 1994.4 1992.0
Assignee TypeUS Company 0.67 0.57 0.56 0.73 0.70 0.71 0.57Foreign Company 0.26 0.36 0.38 0.17 0.23 0.19 0.39Other 0.07 0.07 0.06 0.10 0.07 0.11 0.04
Patents 724 724 185,357 131 267 101 225†Control patents have the same application-year and primary 3-digit USPTO technology clas-sification (nclass) as one or more of the SSO patents. The “matched” controls are a randomlyselected one-to-one match (i.e. the joint distribution of application-year and technology-classis identical to the SSO sample).
While the control patents in Table 3 serve as a useful point of reference, it is unlikely that
they are a valid set of “controls” in the sense that they are statistically indistinguishable from
a pre-disclosure SSO patent. Our analysis uses the control patents to address macro changes
to the patenting regime, and our main results are based largely on variation within the SSO
sample. When we compare SSO patents to the control sample, it will be with an eye towards
comparing SSO patents to “average” patents, rather than patents that are truly identical but
for disclosure.
In the remainder of the paper, our primary measure of economic and technological signifi-
cance is based on forward-citations (i.e. the citations received by a particular patent). These
citations identify relevant “prior art” for an invention, thus delimiting the scope of its claims.
We expect more valuable patents to be relevant to a larger share of future inventive activity,
and therefore receive more forward-citations. In fact, a number of papers suggest that citations
are a valid measure of economic and technological significance. For example, Hall, Jaffe and
Trajtenberg (2005) show that citation weighted patent counts are more correlated with a firm’s
market value than un-weighted patent counts. Harhoff et al (1999) find a positive relationship
17While this suggests that sampling weights are important, we use fixed-effects to control for any difference inthe application-year cohort and technology class of the control patents, as described below.
12
between citations and estimates of patent-value obtained from a survey of patent-holders. And
a substantial body of research builds on the Jaffe, Trajtenberg and Henderson (1993) interpre-
tation of citations as an indicator of knowledge transfers. This is the first paper to use citations
as a measure of the economic and technological impact of SSOs.
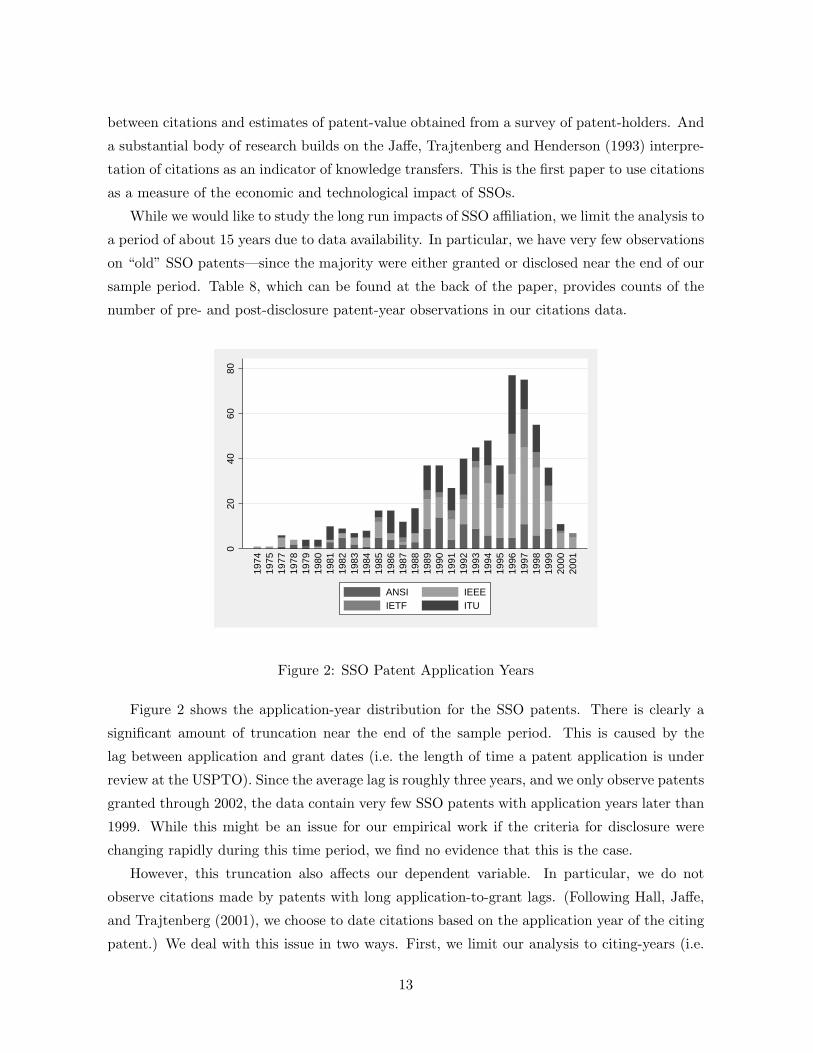
While we would like to study the long run impacts of SSO affiliation, we limit the analysis to
a period of about 15 years due to data availability. In particular, we have very few observations
on “old” SSO patents—since the majority were either granted or disclosed near the end of our
sample period. Table 8, which can be found at the back of the paper, provides counts of the
number of pre- and post-disclosure patent-year observations in our citations data.
020
4060
80
1974
1975
1977
1978
1979
1980
1981
1982
1983
1984
1985
1986
1987
1988
1989
1990
1991
1992
1993
1994
1995
1996
1997
1998
1999
2000
2001
ANSI IEEEIETF ITU
Figure 2: SSO Patent Application Years
Figure 2 shows the application-year distribution for the SSO patents. There is clearly a
significant amount of truncation near the end of the sample period. This is caused by the
lag between application and grant dates (i.e. the length of time a patent application is under
review at the USPTO). Since the average lag is roughly three years, and we only observe patents
granted through 2002, the data contain very few SSO patents with application years later than
1999. While this might be an issue for our empirical work if the criteria for disclosure were
changing rapidly during this time period, we find no evidence that this is the case.
However, this truncation also affects our dependent variable. In particular, we do not
observe citations made by patents with long application-to-grant lags. (Following Hall, Jaffe,
and Trajtenberg (2001), we choose to date citations based on the application year of the citing
patent.) We deal with this issue in two ways. First, we limit our analysis to citing-years (i.e.
13

application-years for the citing patent) through 2001—even though we collected citations from
patents granted through 2006. This ensures that we only lose citations from patents with a
lag greater than five years, which is only observed for 1.02 percent of the patents in the NBER
data. Second, we include a set of citing-year dummies in all of our regressions.
4 Citation Age Profiles
In this section, we examine the distribution of forward-citations to patents in the SSO and
control samples, focusing on the citation age profile—i.e. the average citation rate conditional
on the age of the cited patent.18 We begin with a direct comparison of the average citation rates
for SSO and control patents before turning to an econometric model that includes application-
and citing-year fixed effects to control for a number of confounding factors.
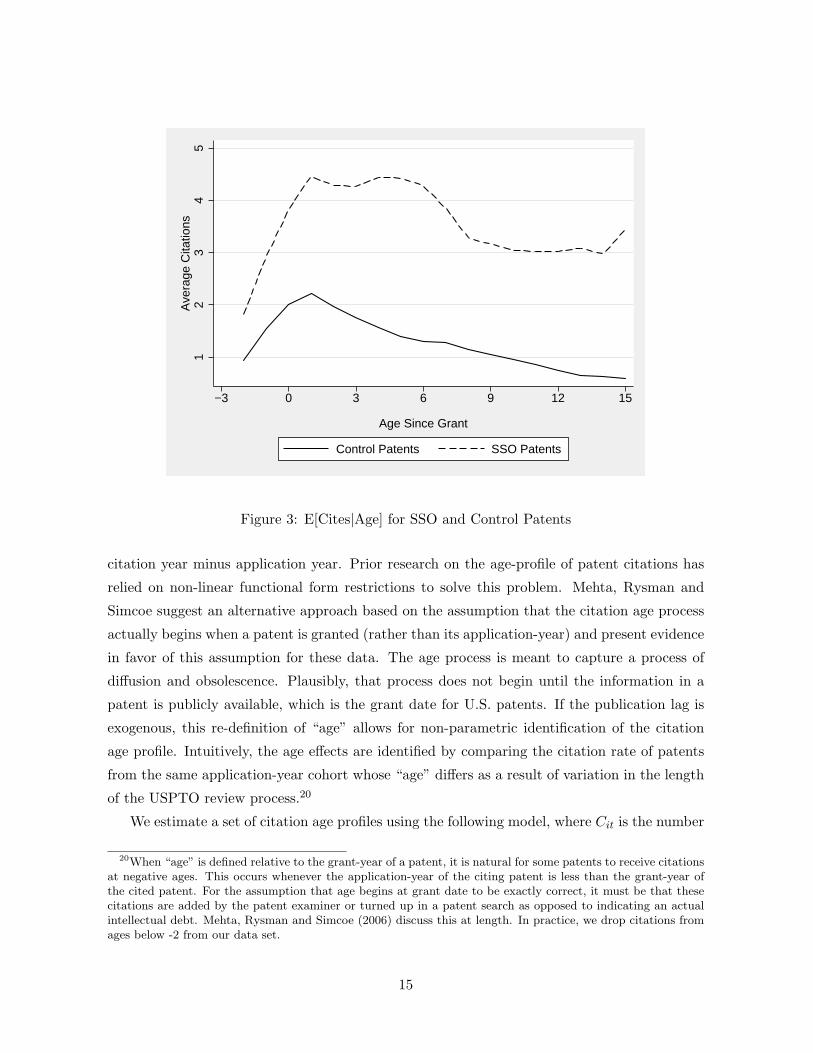
Figure 3 illustrates this section’s two main results. First, SSO patents are cited far more
frequently than controls.19 This difference in citation rates is both substantial and persistent.
Second, the shape of the citation age-profile is different for the SSO patents. In particular, the
peak citation age for SSO patents is later, and the SSO patents receive a larger share of their
cumulative citations in later years.
We find these patterns interesting for several reasons. The large difference in average cita-
tion rates suggests that the technology disclosed to SSOs is quite valuable. The market value
regressions in Hall Jaffe, and Trajtenberg (2005) also indicate that the “unexpected future
citations” reflected in a flatter SSO age-profile are more valuable than an average citation. Fi-
nally, the fact that citations to SSO patents differ from control patents suggests two competing
hypotheses: either SSOs cause an increase in the citation rate, or they select patents on the
basis of an expected increase in future citations. However, before turning to this question in
greater detail, we develop an econometric model to illustrate the substantial difference in the
age profile of the SSO and control patents.
We estimate the citation age profile following an approach proposed in Mehta, Rysman and
Simcoe (2006). This method uses a full set of application- and citing-year effects to control
for various confounding factors—such as policy changes and funding issues at the USPTO,
increases in citation propensity over time, and differences in the technological significance or
“fertility” of various application-year cohorts. It is well known that one cannot identify a full
set of patent-age, application-year and citing-year effects in a linear model—since age equals
18Hall, Jaffe, and Trajtenberg (2001) refer to this statistic as the lag distribution.19The SSO patent with the most cumulative citations is number 4,405,829, which covers essential methods for
public-key cryptography. Granted in 1983, this patent had received 368 citations by 2002. The inventors on thispatent are Ronald Rivest, Adi Shamir and Leonard Adelman (RSA).
14
12
34
5A
vera
ge C
itatio
ns
−3 0 3 6 9 12 15
Age Since Grant
Control Patents SSO Patents
Figure 3: E[Cites|Age] for SSO and Control Patents
citation year minus application year. Prior research on the age-profile of patent citations has
relied on non-linear functional form restrictions to solve this problem. Mehta, Rysman and
Simcoe suggest an alternative approach based on the assumption that the citation age process
actually begins when a patent is granted (rather than its application-year) and present evidence
in favor of this assumption for these data. The age process is meant to capture a process of
diffusion and obsolescence. Plausibly, that process does not begin until the information in a
patent is publicly available, which is the grant date for U.S. patents. If the publication lag is
exogenous, this re-definition of “age” allows for non-parametric identification of the citation
age profile. Intuitively, the age effects are identified by comparing the citation rate of patents
from the same application-year cohort whose “age” differs as a result of variation in the length
of the USPTO review process.20
We estimate a set of citation age profiles using the following model, where Cit is the number
20When “age” is defined relative to the grant-year of a patent, it is natural for some patents to receive citationsat negative ages. This occurs whenever the application-year of the citing patent is less than the grant-year ofthe cited patent. For the assumption that age begins at grant date to be exactly correct, it must be that thesecitations are added by the patent examiner or turned up in a patent search as opposed to indicating an actualintellectual debt. Mehta, Rysman and Simcoe (2006) discuss this at length. In practice, we drop citations fromages below -2 from our data set.
15

of citations received by patent i in year t, αy are fixed effects for application year y, αt are
fixed effects for citing year t (as measured by the application year of the citing patent), αc are
fixed effects for the three-digit USPTO technology classification, αCTRLa and αSSO
a are the age
effects for the control patents and SSO patents at age a, εit is a patent-year error term that is
uncorrelated with the fixed effects, and f() is a Poisson process. Here, age is defined relative
to the grant year g, i.e. a = t − g.
Cit = f(αy, αt, αc, αCTRLa , αSSO
a , εit) (1)
This specification is based on the assumption that the application-year and citing-year
effects are identical for the SSO and control sample, but the age profiles can be different.21
While both the control sample and the SSO sample contribute to identifying the application-
year and citing-year effects, the number of observations in the control sample dwarfs the number
in the SSO sample. Conceptually, we are using the control sample to identify the application-
year and citing-year effects, while estimating a separate age profile for each sample. Hence, the
choice of the control sample has little effect of the shape of the SSO age profile.
We estimate Equation (1) separately on the pooled sample and for each SSO. Table 9,
which can be found at the end of the paper, provides a complete set of age coefficients from
each of these regressions.22 The table shows that the SSO age effects—which also capture any
difference in the average citation rate—are larger than the comparable estimates for the control
sample. This is not surprising given that most of the control patents receive very few citations
(as can be seen in Figure 3). Still, the absolute difference in citation rates is striking.
Since it is difficult to evaluate hypotheses about the shape of the age distribution using
figures or the coefficients in Equation (1), we rely on summary statistics. In particular, we
predict the number of citations conditional on age (setting the dummy variables for application
year 1999 and citation year 1999 on and leaving all other application and citation years off) and
use these values to compute a probability distribution. Then, we use the probability distribution
to compute an “average citation age” for each group of patents. We compute standard errors
for this statistic using the delta method, and test the hypothesis that the mean citation-age is
equal in the SSO and control samples.23
21This additive specification also assumes that there is no “co-mingling” of the age, year and cohort effects(e.g. the age profiles are not changing over time). In principle, this approach can be used to estimate a separatenon-parametric age profile for each application-year cohort. Of course, this would complicate any comparisonof the SSO and control patent age profiles. We experimented with interacting the citing-year and cohort effectsand found that it made little difference.
22One patent disclosed to the IETF has an application year of 1977 while all the rest are applied for in 1985or later. We drop the 1977 patent in the following analysis.
23We use a heteroskedasticity-consistent variance-covariance matrix (clustered on patents) to perform thesecalculations.
16
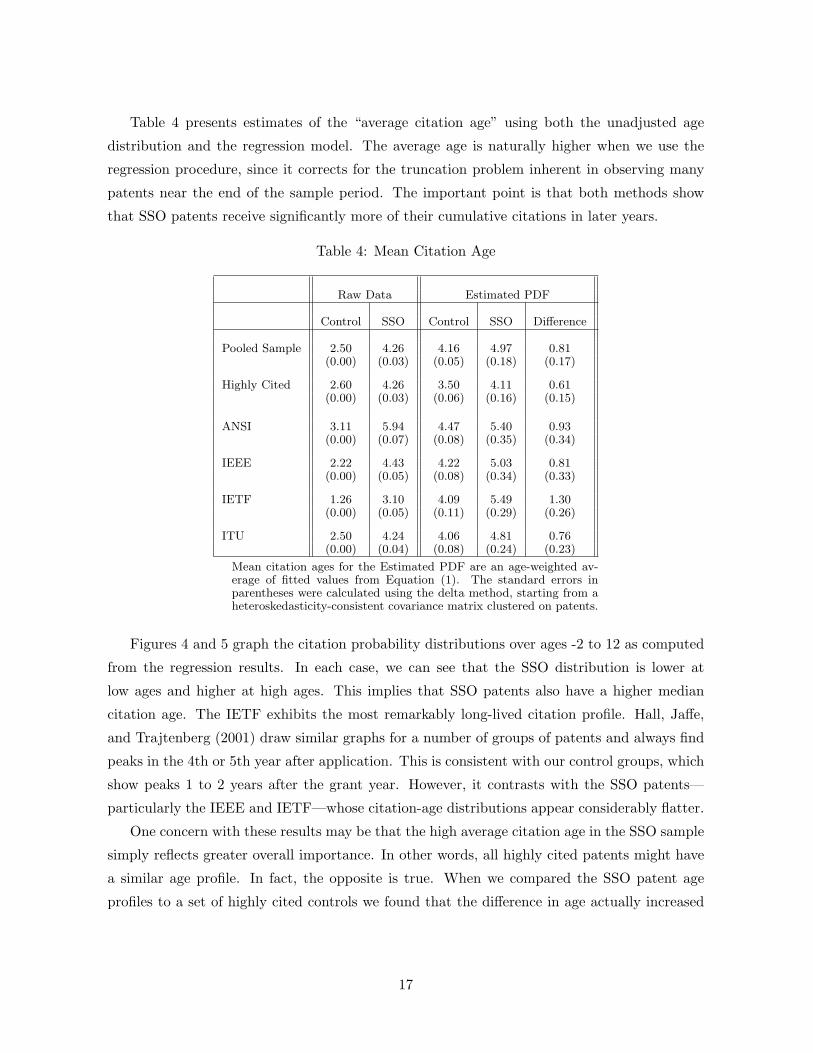
Table 4 presents estimates of the “average citation age” using both the unadjusted age
distribution and the regression model. The average age is naturally higher when we use the
regression procedure, since it corrects for the truncation problem inherent in observing many
patents near the end of the sample period. The important point is that both methods show
that SSO patents receive significantly more of their cumulative citations in later years.
Table 4: Mean Citation Age
Raw Data Estimated PDF
Control SSO Control SSO Difference
Pooled Sample 2.50 4.26 4.16 4.97 0.81(0.00) (0.03) (0.05) (0.18) (0.17)
Highly Cited 2.60 4.26 3.50 4.11 0.61(0.00) (0.03) (0.06) (0.16) (0.15)
ANSI 3.11 5.94 4.47 5.40 0.93(0.00) (0.07) (0.08) (0.35) (0.34)
IEEE 2.22 4.43 4.22 5.03 0.81(0.00) (0.05) (0.08) (0.34) (0.33)
IETF 1.26 3.10 4.09 5.49 1.30(0.00) (0.05) (0.11) (0.29) (0.26)
ITU 2.50 4.24 4.06 4.81 0.76(0.00) (0.04) (0.08) (0.24) (0.23)
Mean citation ages for the Estimated PDF are an age-weighted av-erage of fitted values from Equation (1). The standard errors inparentheses were calculated using the delta method, starting from aheteroskedasticity-consistent covariance matrix clustered on patents.
Figures 4 and 5 graph the citation probability distributions over ages -2 to 12 as computed
from the regression results. In each case, we can see that the SSO distribution is lower at
low ages and higher at high ages. This implies that SSO patents also have a higher median
citation age. The IETF exhibits the most remarkably long-lived citation profile. Hall, Jaffe,
and Trajtenberg (2001) draw similar graphs for a number of groups of patents and always find
peaks in the 4th or 5th year after application. This is consistent with our control groups, which
show peaks 1 to 2 years after the grant year. However, it contrasts with the SSO patents—
particularly the IEEE and IETF—whose citation-age distributions appear considerably flatter.
One concern with these results may be that the high average citation age in the SSO sample
simply reflects greater overall importance. In other words, all highly cited patents might have
a similar age profile. In fact, the opposite is true. When we compared the SSO patent age
profiles to a set of highly cited controls we found that the difference in age actually increased
17
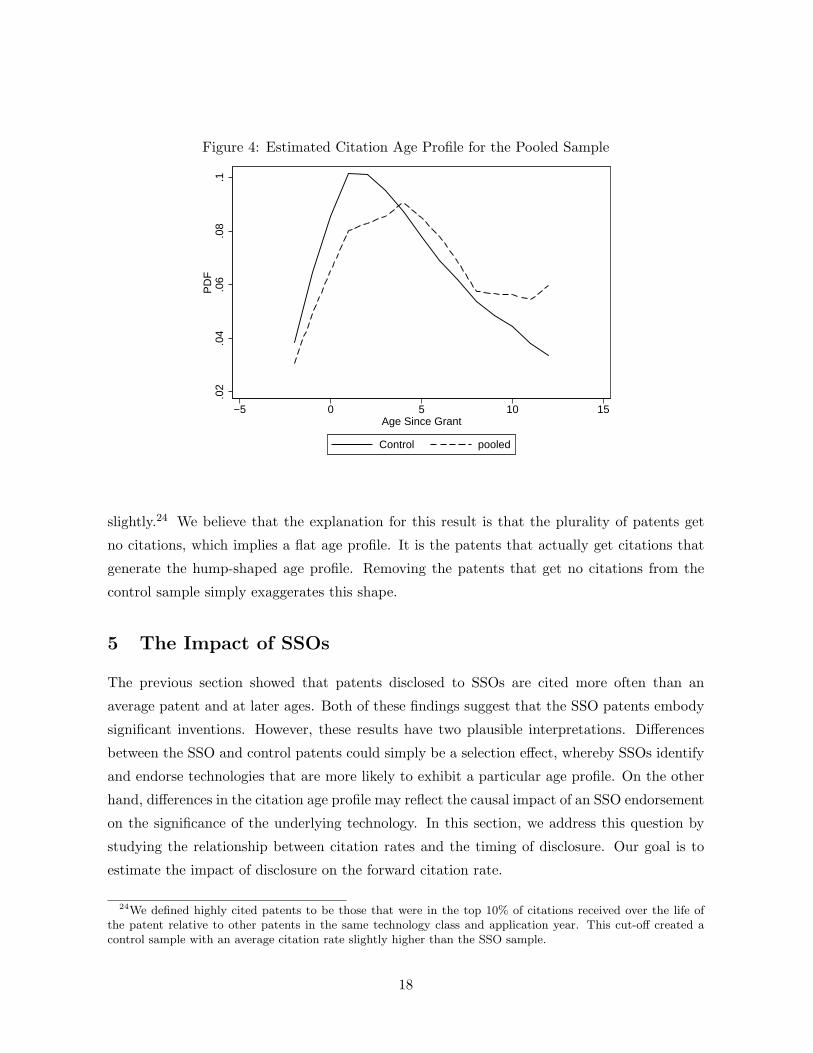
Figure 4: Estimated Citation Age Profile for the Pooled Sample
.02
.04
.06
.08
.1P
DF
−5 0 5 10 15Age Since Grant
Control pooled
slightly.24 We believe that the explanation for this result is that the plurality of patents get
no citations, which implies a flat age profile. It is the patents that actually get citations that
generate the hump-shaped age profile. Removing the patents that get no citations from the
control sample simply exaggerates this shape.
5 The Impact of SSOs
The previous section showed that patents disclosed to SSOs are cited more often than an
average patent and at later ages. Both of these findings suggest that the SSO patents embody
significant inventions. However, these results have two plausible interpretations. Differences
between the SSO and control patents could simply be a selection effect, whereby SSOs identify
and endorse technologies that are more likely to exhibit a particular age profile. On the other
hand, differences in the citation age profile may reflect the causal impact of an SSO endorsement
on the significance of the underlying technology. In this section, we address this question by
studying the relationship between citation rates and the timing of disclosure. Our goal is to
estimate the impact of disclosure on the forward citation rate.
24We defined highly cited patents to be those that were in the top 10% of citations received over the life ofthe patent relative to other patents in the same technology class and application year. This cut-off created acontrol sample with an average citation rate slightly higher than the SSO sample.
18

.02
.04
.06
.08
.1P
DF
−5 0 5 10 15Age Since Grant
Control ansi
.02
.04
.06
.08
.1P
DF
−5 0 5 10 15Age Since Grant
Control ieee
.02
.04
.06
.08
.1P
DF
−5 0 5 10 15Age Since Grant
Control ietf
.02
.04
.06
.08
.1P
DF
−5 0 5 10 15Age Since Grant
Control itu
Figure 5: Estimated Citation Age Profile for Individual SSOs
We use two different methods to estimate the disclosure effect. Our first approach discards
the control patents and uses only those patents disclosed to an SSO—relying on variation in the
timing of patent disclosures for identification. Our second approach uses a pooled cross-sectional
specification similar to the age-profile regressions presented above. However, we include an SSO
dummy to estimate the selection effect (i.e. the difference between a pre-disclosure SSO patent
and an “average” patent) and a post-disclosure dummy to estimate the marginal impact of the
SSO. In order to estimate a single SSO dummy, we restrict the age process to be the same
for the SSO and control samples. Although this is a strong assumption, doing so allows us to
make a compelling comparison between the selection and marginal effects. Remarkably, the two
approaches produce very similar estimates of the impact of an SSO endorsement: disclosure
generates a 20 to 40 percent increase in the citation rate.
5.1 Marginal Effects in the SSO Sample
In this sub-section, we use variation in the timing of SSO patent disclosures to estimate the
marginal effect. Specifically, we ignore the control patents and use pre-disclosure SSO patents
to estimate a counterfactual citation rate for disclosed patents. Since we are no longer interested
in separating the age, cohort and calendar effects, we rely on a more flexible specification that
19
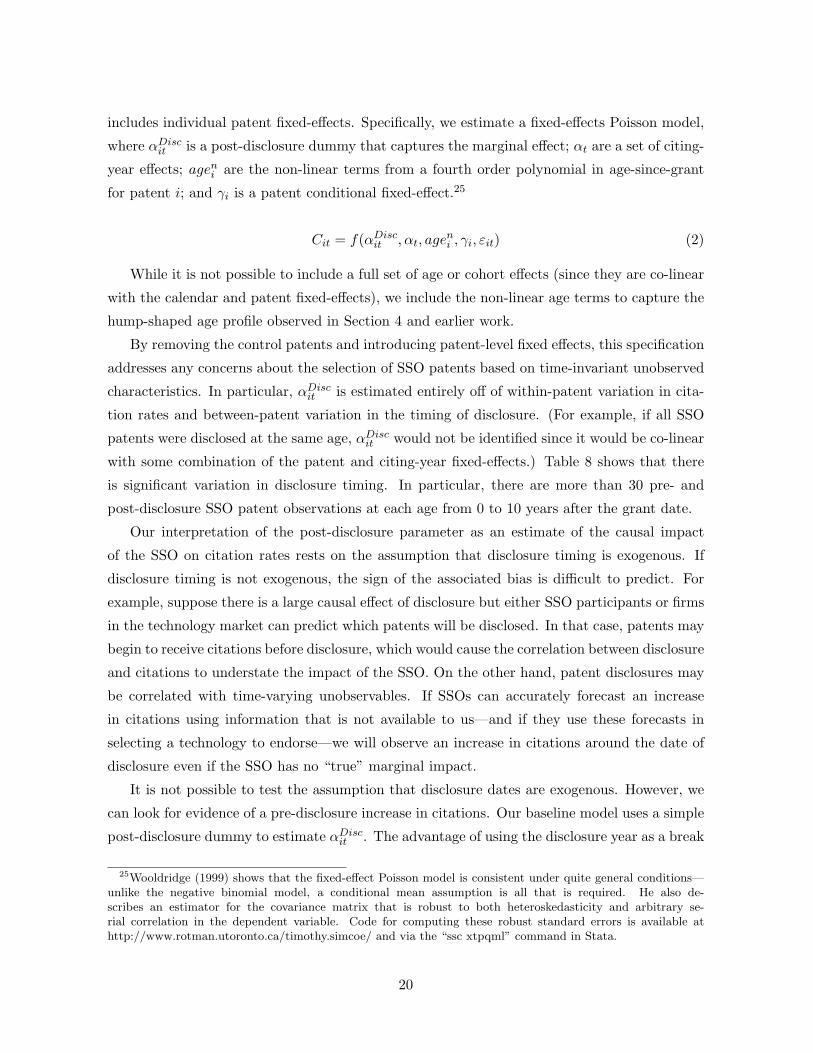
includes individual patent fixed-effects. Specifically, we estimate a fixed-effects Poisson model,
where αDiscit is a post-disclosure dummy that captures the marginal effect; αt are a set of citing-
year effects; ageni are the non-linear terms from a fourth order polynomial in age-since-grant
for patent i; and γi is a patent conditional fixed-effect.25
Cit = f(αDiscit , αt, agen
i , γi, εit) (2)
While it is not possible to include a full set of age or cohort effects (since they are co-linear
with the calendar and patent fixed-effects), we include the non-linear age terms to capture the
hump-shaped age profile observed in Section 4 and earlier work.
By removing the control patents and introducing patent-level fixed effects, this specification
addresses any concerns about the selection of SSO patents based on time-invariant unobserved
characteristics. In particular, αDiscit is estimated entirely off of within-patent variation in cita-
tion rates and between-patent variation in the timing of disclosure. (For example, if all SSO
patents were disclosed at the same age, αDiscit would not be identified since it would be co-linear
with some combination of the patent and citing-year fixed-effects.) Table 8 shows that there
is significant variation in disclosure timing. In particular, there are more than 30 pre- and
post-disclosure SSO patent observations at each age from 0 to 10 years after the grant date.
Our interpretation of the post-disclosure parameter as an estimate of the causal impact
of the SSO on citation rates rests on the assumption that disclosure timing is exogenous. If
disclosure timing is not exogenous, the sign of the associated bias is difficult to predict. For
example, suppose there is a large causal effect of disclosure but either SSO participants or firms
in the technology market can predict which patents will be disclosed. In that case, patents may
begin to receive citations before disclosure, which would cause the correlation between disclosure
and citations to understate the impact of the SSO. On the other hand, patent disclosures may
be correlated with time-varying unobservables. If SSOs can accurately forecast an increase
in citations using information that is not available to us—and if they use these forecasts in
selecting a technology to endorse—we will observe an increase in citations around the date of
disclosure even if the SSO has no “true” marginal impact.
It is not possible to test the assumption that disclosure dates are exogenous. However, we
can look for evidence of a pre-disclosure increase in citations. Our baseline model uses a simple
post-disclosure dummy to estimate αDiscit . The advantage of using the disclosure year as a break
25Wooldridge (1999) shows that the fixed-effect Poisson model is consistent under quite general conditions—unlike the negative binomial model, a conditional mean assumption is all that is required. He also de-scribes an estimator for the covariance matrix that is robust to both heteroskedasticity and arbitrary se-rial correlation in the dependent variable. Code for computing these robust standard errors is available athttp://www.rotman.utoronto.ca/timothy.simcoe/ and via the “ssc xtpqml” command in Stata.
20

point is that it is easily observed and likely to occur within a few years of standardization. (As
we argued above, firms that delay for too long risk losing their IPR, while disclosing too early
has both practical and strategic costs.)
While the disclosure date is a logical place to begin looking for network effects, we also
consider what happens if the post-disclosure dummy is activated two years before the actual
IPR disclosure. There are several reasons why an SSOs’ impact on patent citations might
precede the actual disclosure. Firms may be able to anticipate the SSO’s technology choice.
There may be a lag between the date when technical committee members became aware of
the relevant IPR and the date of the formal disclosure. (The IEEE’s policies actually ensure
that this is the case.) Finally, application lags at the USPTO—combined with our decision to
date citations based on the application-year of the citing patent—may cause a pre-disclosure
increase in citations (i.e. a cite caused by the IPR disclosure can be added to a pending patent
application whose application date precedes the disclosure date).26
Table 5 presents our estimates of the disclosure effect. (We do not report any of the
citing-year or age effects, all of which were significant.) Interpretation of these estimates is
straightforward. The regression coefficients provide a reasonable first-order approximation of
the percentage change in the citation rate. For larger coefficients (e.g. above 0.3) the incidence
rate ratio, exp(αDisc)−1, provides a slightly better approximation. Our main results are based
on the pooled sample of SSO patents. Given that we are working with relatively small numbers
of patents, we feel that the pooled estimates are less sensitive to outliers and timing issues than
the individual SSOs.27 However, we also present results from each of the individual SSOs for
comparison.
The first row of Table 5 presents our baseline estimates, which use a simple post-disclosure
dummy to estimate the marginal effect. The post-disclosure coefficient for the pooled sample
indicates that disclosure is associated with a 19 percent increase in the citation rate. The
individual SSO results show a positive and statistically significant disclosure effect at the
IETF—corresponding to an increase of roughly 33 percent. The ANSI and ITU coefficients
are comparable to the pooled effect, but statistically insignificant, and the IEEE effect is neg-
ligible.
The second and third rows in Table 5 consider models that use alternative definitions of
disclosure. In Model 2, we artificially move the disclosure date forward by two years. This
causes the pooled sample sample coefficient to increase slightly, and leads to an increase in the
marginal effect at each of the individual SSOs. In particular, the post-disclosure coefficient
26Unfortunately, we do not observe when citations are added to a pending patent application.27Table 1 showed that there are strong technological similarities across these four organizations.
21
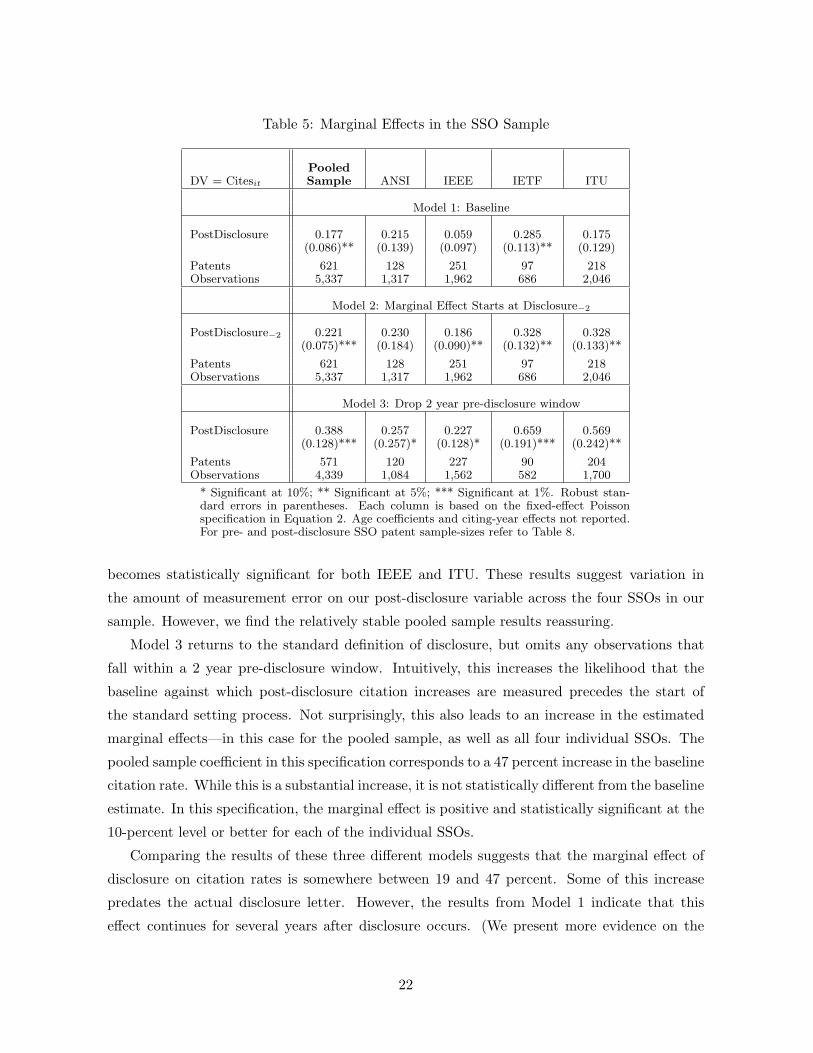
Table 5: Marginal Effects in the SSO Sample
PooledDV = Citesit Sample ANSI IEEE IETF ITU
Model 1: Baseline
PostDisclosure 0.177 0.215 0.059 0.285 0.175(0.086)** (0.139) (0.097) (0.113)** (0.129)
Patents 621 128 251 97 218Observations 5,337 1,317 1,962 686 2,046
Model 2: Marginal Effect Starts at Disclosure−2
PostDisclosure−2 0.221 0.230 0.186 0.328 0.328(0.075)*** (0.184) (0.090)** (0.132)** (0.133)**
Patents 621 128 251 97 218Observations 5,337 1,317 1,962 686 2,046
Model 3: Drop 2 year pre-disclosure window
PostDisclosure 0.388 0.257 0.227 0.659 0.569(0.128)*** (0.257)* (0.128)* (0.191)*** (0.242)**
Patents 571 120 227 90 204Observations 4,339 1,084 1,562 582 1,700
* Significant at 10%; ** Significant at 5%; *** Significant at 1%. Robust stan-dard errors in parentheses. Each column is based on the fixed-effect Poissonspecification in Equation 2. Age coefficients and citing-year effects not reported.For pre- and post-disclosure SSO patent sample-sizes refer to Table 8.
becomes statistically significant for both IEEE and ITU. These results suggest variation in
the amount of measurement error on our post-disclosure variable across the four SSOs in our
sample. However, we find the relatively stable pooled sample results reassuring.
Model 3 returns to the standard definition of disclosure, but omits any observations that
fall within a 2 year pre-disclosure window. Intuitively, this increases the likelihood that the
baseline against which post-disclosure citation increases are measured precedes the start of
the standard setting process. Not surprisingly, this also leads to an increase in the estimated
marginal effects—in this case for the pooled sample, as well as all four individual SSOs. The
pooled sample coefficient in this specification corresponds to a 47 percent increase in the baseline
citation rate. While this is a substantial increase, it is not statistically different from the baseline
estimate. In this specification, the marginal effect is positive and statistically significant at the
10-percent level or better for each of the individual SSOs.
Comparing the results of these three different models suggests that the marginal effect of
disclosure on citation rates is somewhere between 19 and 47 percent. Some of this increase
predates the actual disclosure letter. However, the results from Model 1 indicate that this
effect continues for several years after disclosure occurs. (We present more evidence on the
22

timing of the disclosure effect below.)
Table 7 presents several robustness checks. To examine whether the marginal effect is
actually driven by “publicity” or increased awareness of the patent following disclosure—as
opposed to increased economic or technological significance—the first row in this table examines
the impact of disclosure on self-citations. With self-citations, the citing and cited patent are
owned by the same assignee, so it is hard to argue that this firm was simply unaware of the
cited technology before disclosure. The self-citation analysis yields point estimates that are
very similar to the marginal effects reported above, although none of them are statistically
significant (in part because roughly half of the SSO patents receive no self-citations and are
dropped from the regression).
In the second and third row of Table 7 we estimate the same model using OLS and a fixed-
effects negative binomial specification. In both cases, the results are consistent with our earlier
estimates. We also experimented with interacting the disclosure indicator and a dummy for
whether the SSO patent was above the 75th percentile in terms of cumulative pre-disclosure
citations (relative to other patents having the same grant year). In a Poisson specification, SSO
patents below this threshold show a larger disclosure effect while the opposite holds true for
an OLS regression. While this is not surprising, it does suggest that our results do not mask
substantial response heterogeneity and are not driven by patents that are already highly cited
at disclosure.
5.2 Comparison to Selection Effects
The previous sub-section focused on identifying the disclosure effect, which we interpret as the
marginal impact of the SSO. However, we might wish to compare the size of the SSO (selection)
effect to the size of the disclosure (marginal) effect. This is not possible when the estimation
sample is restricted to SSO patents.
In this sub-section, we pool control and SSO patents in a cross-sectional regression similar
to the one used in Section 4. However, we assume that the SSO and control patents have a
common set of age effects and include an SSO dummy to estimate the selection effect, along
with a post-disclosure dummy to estimate the marginal effect of disclosure.
Our results are based on the following specification, where αy, αt, αc, and αa are application-
year, citing-year, technology-class, and age-effects respectively; the parameters of interest are
a selection effect αSSOi and a marginal effect αDisc
it ; and εit is a patent-year error term that is
uncorrelated with the all of the fixed effects, including the selection and disclosure dummies.
Cit = f(αSSOi , αDisc
it , αy, αt, αc, αa, εit) (3)
23

In order to interpret the disclosure dummy as a marginal effect, the timing of disclosure
must be exogenous. However, we naturally interpret the selection of patents to disclose as
endogenous. Thus, we do not interpret the SSO dummy to capture the effect of exogenously
forcing a patent to be disclosed to an SSO at some time in the future. Rather, we seek
to measure the extent to which the endogenous selection process leads to highly cited SSO
patents.28 If the patents that are truly at risk for disclosure to an SSO receive more citations,
our estimates will be an upper bound for the selection effect within this group—suggesting that
the relative importance of the marginal effect is even greater.
The other main assumption in this specification is that SSO and control patents have the
same pre-disclosure age profile (i.e. that disclosure explains the age-profile results in Section 4).
While this is obviously a strong assumption, it allows us to identify the coefficient on an
SSO dummy, which we use to measure the selection effect. This allows for a straightforward
comparison between the impact of selection and disclosure.
Table 6 presents estimates of the selection and disclosure effects for the pooled sample and
each of the four SSOs. We do not report the application-year, citing-year age-since-grant, and
technology-class effects—all of which are significant. The pooled sample coefficients indicate
that the selection effect is roughly four times as large as the marginal effect, at 104 percent and
28 percent respectively. Thus, our estimates suggest that 20 percent of the difference between
the patents disclosed to an SSO and an average patent from the same technology-class is due
to disclosure, while 80 percent is a selection effect. Although we do not have strong priors for
this statistic, these estimates strike us as quite reasonable.
Not surprisingly, estimates of the selection effect are positive and precisely estimated for the
pooled sample and all four individual SSOs. Conditional on age, technology-class, application-
and citing-year, SSO patents receive roughly twice as many citations as the average control
patent. Within individual SSO’s, this upper-bound on the selection effect varies from 69 percent
(ANSI) to 191 percent (IETF). Our estimate of the marginal effect for the pooled sample is
positive and significant—indicating that inclusion in the SSO process increases citations by 28
percent. For three out of the four SSOs (ANSI, IEEE and ITU), estimates of the marginal
effect are also positive and significant. These estimates range from a 21 percent increase in the
citation rate (IEEE), to a 72 percent increase (ANSI).
The second row in Table 7 shows that estimating a “saturated” model in which the citation
28Our broad control group (i.e. every patent with the same application-year and primary technology-class asone or more of the SSO patents) corresponds to a broad definition of the selection effect. In reality, “selection” canbe thought of in several stages: an SSO recognizes the need for a solution, then considers candidate technologiesand then chooses a particular option. While it might be interesting to construct control samples that identifythe selection effect relative to intermediate steps in the process, doing so in a convincing way appears challengingand we do not attempt that here.
24

Table 6: Pooled Cross-sectional Estimates of Selection and Marginal Effects
PooledDV = Citesit Sample ANSI IEEE IETF ITU
Baseline Model: Age, Year, Cohort & Technology-class Effects
SSO Patent 0.713 0.521 0.712 1.100 0.663(0.051)*** (0.115)*** (0.081)*** (0.088)*** (0.091)***
PostDisclosure 0.247 0.561 0.175 0.129 0.308(0.078)*** (0.171)*** (0.123) (0.186) (0.114)**
Observations 1,318,816 460,036 623,606 251,997 654,054
Saturated Model: Age-Year, Cohort & Technology-class Effects
SSO Patent 0.710 0.524 0.710 1.067 0.661(0.031)*** (0.066)*** (0.048)*** (0.085)*** (0.053)***
PostDisclosure 0.250 0.545 0.187 0.170 0.307(0.053)*** (0.096)*** (0.076)** (0.102)* (0.092)***
Observations 1,318,807 460,036 623,606 251,979 653,993
Selection Effect Time-trend
SSO Patent 0.680 0.781 0.505 1.165 0.949(0.111)*** (0.152)*** (0.231)** (0.180)*** (0.187)***
SSO * (DiscYear-2000) -0.012 0.028 -0.074 0.090 0.048(0.020) (0.026) (0.037)** (0.084) (0.032)
PostDisclosure 0.233 0.457 0.055 0.266 0.252(0.078)*** (0.176)*** (0.147) (0.106)** (0.111)**
Observations 1,317,205 459,844 623,606 251,580 653,488
* Significant at 10%; ** Significant at 5%; *** Significant at 1%. Robust standard errors(clustered on patents) in parentheses. Each column is based on the Poisson QML specifi-cation in Equation 3. Application-year, citing-year, age, and technology-class fixed-effectsnot reported. For SSO patent sample-sizes refer to Table 8.
age profile varies by grant-year has little or no impact on the results. The final row examines
whether the criteria for selection is changing over time. Specifically, we interact the SSO
dummy with a time trend created by subtracting 2000 from the year when a patent was initially
disclosed to an SSO. For the pooled sample and three of the four SSOs, this interaction term is
statistically insignificant. Interestingly, it is negative and significant for the IEEE—indicating
that the patents disclosed to IEEE in earlier years had a greater pre-disclosure citation rate.
One interpretation of this result is that firms with weaker patents may be seeking a share
of the anticipated licensing revenues from wireless networking (i.e. Wi-Fi and its successor
ultra-wideband).
25

5.3 Disclosure Timing and Citation Trends
The estimates in Table 6 assume that an SSO’s impact on citation rates will begin in the year
of disclosure. However, sub-section 5.1 discussed several reasons why the marginal effect of the
SSO might pre-date the formal IPR disclosure. If this is simply a measurement problem linked
to the dating of either disclosures or citations, it will bias our estimates of the true disclosure
effect towards zero.
In this sub-section we examine the timing of the increase in citations relative to disclosure by
replacing the post-disclosure dummy in Equation (3) with a series of age-relative-to-disclosure
effects for the SSO patents, omitting the dummy for one year prior to disclosure. In other
words, we estimate a series of “disclosure effects” conditional on the age of the SSO patent
relative to its actual disclosure date. (We also drop the SSO dummy since it is co-linear with
the full set of age-relative-to-disclosure effects.) This specification allows us to examine the pre-
and post-disclosure citation trajectory of the SSO patents relative to the controls. Because this
exercise is more demanding on the relatively small sample of SSO patents, we focus on the
pooled sample to increase the precision of our estimates.
−.4
−.2
0.2
.4.6
Est
imat
ed C
oeffi
cien
t
−7 −6 −5 −4 −3 −2 −1 0 1 2 3 4 5 6
Years Since Disclosure
Coefficeint 95% CI
Figure 6: Estimated Pre and Post-disclosure coefficients for SSO Patents
Figure 6 graphs our estimates of the pre- and post-disclosure SSO patent citation-trajectory,
along with a 95 percent confidence interval. There is no discernable trend in the SSO patent
citation rate from 7 years before disclosure until 2 years before disclosure. In other words, the
26
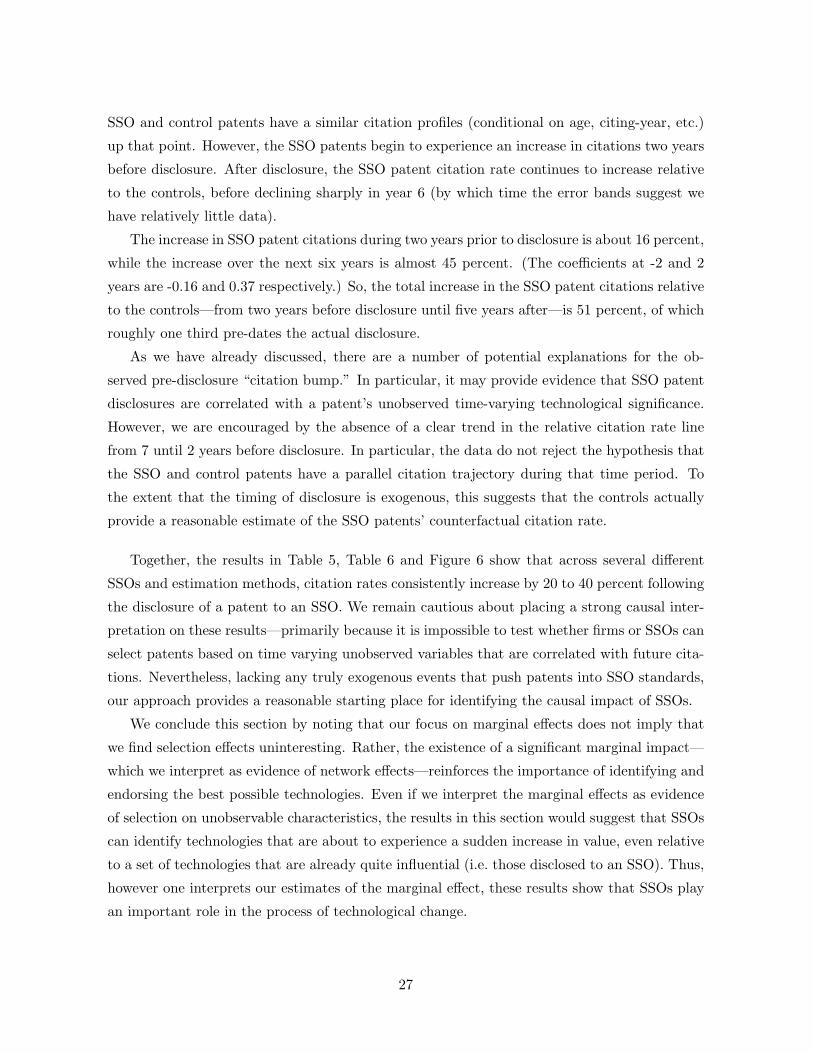
SSO and control patents have a similar citation profiles (conditional on age, citing-year, etc.)
up that point. However, the SSO patents begin to experience an increase in citations two years
before disclosure. After disclosure, the SSO patent citation rate continues to increase relative
to the controls, before declining sharply in year 6 (by which time the error bands suggest we
have relatively little data).
The increase in SSO patent citations during two years prior to disclosure is about 16 percent,
while the increase over the next six years is almost 45 percent. (The coefficients at -2 and 2
years are -0.16 and 0.37 respectively.) So, the total increase in the SSO patent citations relative
to the controls—from two years before disclosure until five years after—is 51 percent, of which
roughly one third pre-dates the actual disclosure.
As we have already discussed, there are a number of potential explanations for the ob-
served pre-disclosure “citation bump.” In particular, it may provide evidence that SSO patent
disclosures are correlated with a patent’s unobserved time-varying technological significance.
However, we are encouraged by the absence of a clear trend in the relative citation rate line
from 7 until 2 years before disclosure. In particular, the data do not reject the hypothesis that
the SSO and control patents have a parallel citation trajectory during that time period. To
the extent that the timing of disclosure is exogenous, this suggests that the controls actually
provide a reasonable estimate of the SSO patents’ counterfactual citation rate.
Together, the results in Table 5, Table 6 and Figure 6 show that across several different
SSOs and estimation methods, citation rates consistently increase by 20 to 40 percent following
the disclosure of a patent to an SSO. We remain cautious about placing a strong causal inter-
pretation on these results—primarily because it is impossible to test whether firms or SSOs can
select patents based on time varying unobserved variables that are correlated with future cita-
tions. Nevertheless, lacking any truly exogenous events that push patents into SSO standards,
our approach provides a reasonable starting place for identifying the causal impact of SSOs.
We conclude this section by noting that our focus on marginal effects does not imply that
we find selection effects uninteresting. Rather, the existence of a significant marginal impact—
which we interpret as evidence of network effects—reinforces the importance of identifying and
endorsing the best possible technologies. Even if we interpret the marginal effects as evidence
of selection on unobservable characteristics, the results in this section would suggest that SSOs
can identify technologies that are about to experience a sudden increase in value, even relative
to a set of technologies that are already quite influential (i.e. those disclosed to an SSO). Thus,
however one interprets our estimates of the marginal effect, these results show that SSOs play
an important role in the process of technological change.
27
6 Conclusions
The importance of SSOs in technology industries has been widely discussed, with many detailed
case studies of the formal standard setting process. However, there have been few attempts to
systematically measure the impact of these institutions. This paper is the first to address these
questions using patent citations as a measure of SSO performance. Our approach leads imme-
diately to the question of causality. Specifically, do SSO’s influence the process of cumulative
technological development, or merely identify and evaluate important technologies?
We find substantial evidence that SSOs identify and endorse important technologies. In
particular, patents disclosed in the standard setting process receive roughly twice as many
citations as a set of controls from the same technology-class and application-year. Moreover,
we find a significant increase in the citation rate of SSO patents following disclosure. This
marginal effect accounts for roughly 20 percent of the difference in citation rates between SSO
and control patents—suggesting that SSO efforts to promote industry coordination contribute
to the lasting significance of the technologies they endorse.
Although this paper emphasizes the positive question of SSOs’ impact on technological
change, our principal findings are relevant to current policy debates regarding intellectual prop-
erty and compatibility standards. In particular, our findings suggest that an SSO endorsement
has economic value. This implies that firms ought to compete to have their own technologies
(and patents) endorsed by SSOs. The question of how firms compete for endorsement raises a
number of questions that we hope to address in future research. However, we should acknowl-
edge that it is hard to draw any clear welfare implications from our current results. The impact
of IPR on industry standards will depend on SSO rules and participants’ willingness to abide
by them, as well as related public policy.
Finally, though we have focused on compatibility standards, our results offer insights into
the larger question of industry self-regulation—particularly the impact of policies endorsed by
multi-lateral consensus-based institutions. Since these groups lack enforcement power, it is not
surprising that their agendas exhibit strong selection effects. However, our results suggest that
in some cases, they are also a catalyst for lasting change. Of course, this is a broad gener-
alization. Much work remains to determine how much compatibility standards can actually
teach us about standards for safety or quality measurement. In particular, there is a clear
need for theories that illustrate how the post-SSO process of market or political competition
influences participation, agenda formation and standards selection within these private political
institutions.
28

References
ABA. 2003. Resources Relating to Antitrust and Standards Setting. American Bar Association.
Besen, S. M., & Farrell, J. 1991. The Role of the ITU in Standardization - Pre-Eminence, Impotence
or Rubber Stamp. Telecommunications Policy, 15(4), 311–321.
Besen, S. M., & Johnson, L. 1988. Compatibility Standards, Competition and Innovation in the Broad-
casting Industry. Tech. rept. R-3453-NSF. RAND.
Besen, S. M., & Saloner, G. 1989. The Economics of Telecommunications Standards. Pages 177–
220 of: Crandall, R., & Flamm, K. (eds), Changing the Rules: Technological Change, International
Competition, and Regulation in Telecommunications. Washington: Brookings.
Brim, S. 2004 (February). Guidelines for Working Groups on Intellectual Property Issues (RFC 3669).
Tech. rept. Internet Engineering Task Force.
Buchanan, J. M. 1965. An Economic-Theory of Clubs. Economica, 32(125), 1–14.
Cargill, C. F. 1997. Open Systems Standardization: A Business Approach. Upper Saddle River, NJ:
Prentice Hall PTR.
Chiao, B., Lerner, J., & Tirole, J. 2005. The Rules of Standard Setting Organizations: An Empirical
Analysis. RAND Journal of Economics, forthcoming.
David, P. A. 1985. Clio and the Economics of QWERTY. American Economic Review, 75(2), 332–337.
Farrell, J., & Saloner, G. 1986. Installed Base and Compatibility - Innovation, Product Preannounce-
ments, and Predation. American Economic Review, 76(5), 940–955.
Farrell, J., & Saloner, G. 1988. Coordination through Committees and Markets. RAND Journal of
Economics, 19(2), 235–252.
Farrell, J., & Simcoe, T. 2007. Choosing the Rules for Formal Standardization. Manuscript.
FTC. 2002. Competition and Intellectual Property Law and Policy in the Knowledge-Based Economy.
Tech. rept. Federal Trade Commission.
Hall, B., Jaffe, A., & Trajtenberg, M. 2001. The NBER Patent Citations Data File: Lessons, Insights,
and Methodological Tools. NBER Working Paper #8498.
Hall, B. H., Jaffe, A., & Trajtenberg, M. 2005. Market Value and Patent Citations. RAND Journal of
Economics, 36(1), 16–38.
Harhoff, D., Narin, F., Scherer, F. M., & Vopel, K. 1999. Citation Frequency and the Value of Patented
Inventions. Review of Economics and Statistics, 81(3), 511–515.
29

Henderson, R., Jaffe, A. B., & Trajtenberg, M. 1998. Universities as a Source of Commercial Technology:
A Detailed Analysis of University Patenting, 1965-1988. Review of Economics and Statistics, 80(1),
119–127.
Jaffe, A., & Trajtenberg, M. 2004. Patents, Citations and Innovations: A Window on the Knowledge
Economy. Cambridge: MIT Press.
Jaffe, A., Trajtenberg, M., & Henderson, R. 1993. Geographic Localization of Knowledge Spillovers as
Evidenced by Patent Citations. Quarterly Journal of Economics, 108, 577–598.
Katz, M. L., & Shapiro, C. 1985. Network Externalities, Competition, and Compatibility. American
Economic Review, 75(3), 424–440.
Lemley, M. 2002. Intellectual Property Rights and Standard Setting Organizations. California Law
Review, 90, 1889–1981.
Lerner, J., & Tirole, J. 2006. A Model of Forum Shopping with Special Reference to Standard Setting
Organizations. American Economic Review, 96(4), 1091–1113.
Liebowitz, S. J., & Margolis, S. E. 1990. The Fable of the Keys. Journal of Law and Economics, 33(1),
1–25.
Maggi, G., & Morelli, M. 2006. Self-enforcing Voting in International Organizations. American Economic
Review, 96(4), 1137–1158.
Majoras, D.P. 2005 (September 23, 2005). Speech : Recognizing the Procompetitive Potential of Royalty
Discussions in Standard Setting.
Maxwell, J. W., Lyon, T. P., & Hackett, S. C. 2000. Self-regulation and Social Welfare: The Political
Economy of Corporate Environmentalism. Journal of Law & Economics, 43(2), 583–617.
Mehta, A., Rysman, M., & Simcoe, T. 2006. Identifying the Age Profile of Patent Citations.
Mowery, D. C., & Simcoe, T. 2002. Is the Internet a US Invention? - An Economic and Technological
History of Computer Networking. Research Policy, 31(8-9), 1369–1387.
Shapiro, C. 2000. Setting Compatibility Standards: Cooperation or Collusion? Haas School of Business
Working Paper.
Weiss, M., & Sirbu, M. 1990. Technological Choice in Voluntary Standards Committees: An Empirical
Analysis. Economics of Innovation and New Technology, 1, 111–134.
Wooldridge, J. M. 1999. Distribution-free Estimation of Some Nonlinear Panel Data Models. Journal
of Econometrics, 90(1), 77–97.
30
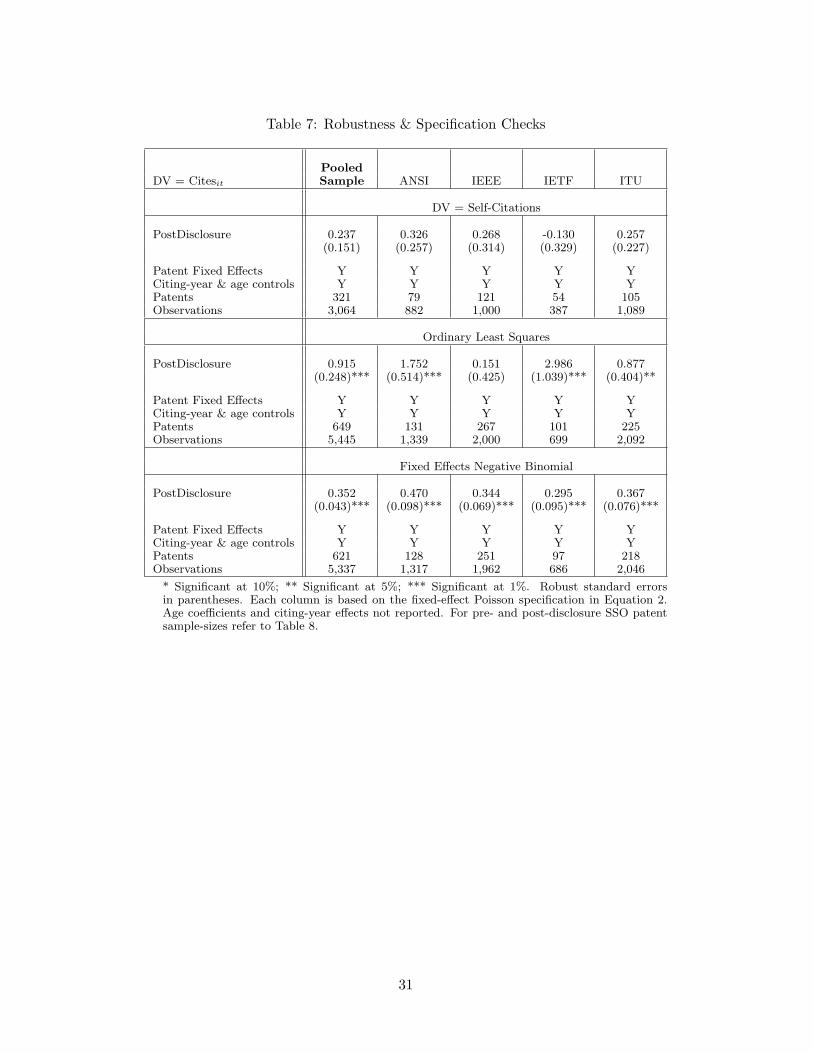
Table 7: Robustness & Specification Checks
PooledDV = Citesit Sample ANSI IEEE IETF ITU
DV = Self-Citations
PostDisclosure 0.237 0.326 0.268 -0.130 0.257(0.151) (0.257) (0.314) (0.329) (0.227)
Patent Fixed Effects Y Y Y Y YCiting-year & age controls Y Y Y Y YPatents 321 79 121 54 105Observations 3,064 882 1,000 387 1,089
Ordinary Least Squares
PostDisclosure 0.915 1.752 0.151 2.986 0.877(0.248)*** (0.514)*** (0.425) (1.039)*** (0.404)**
Patent Fixed Effects Y Y Y Y YCiting-year & age controls Y Y Y Y YPatents 649 131 267 101 225Observations 5,445 1,339 2,000 699 2,092
Fixed Effects Negative Binomial
PostDisclosure 0.352 0.470 0.344 0.295 0.367(0.043)*** (0.098)*** (0.069)*** (0.095)*** (0.076)***
Patent Fixed Effects Y Y Y Y YCiting-year & age controls Y Y Y Y YPatents 621 128 251 97 218Observations 5,337 1,317 1,962 686 2,046
* Significant at 10%; ** Significant at 5%; *** Significant at 1%. Robust standard errorsin parentheses. Each column is based on the fixed-effect Poisson specification in Equation 2.Age coefficients and citing-year effects not reported. For pre- and post-disclosure SSO patentsample-sizes refer to Table 8.
31
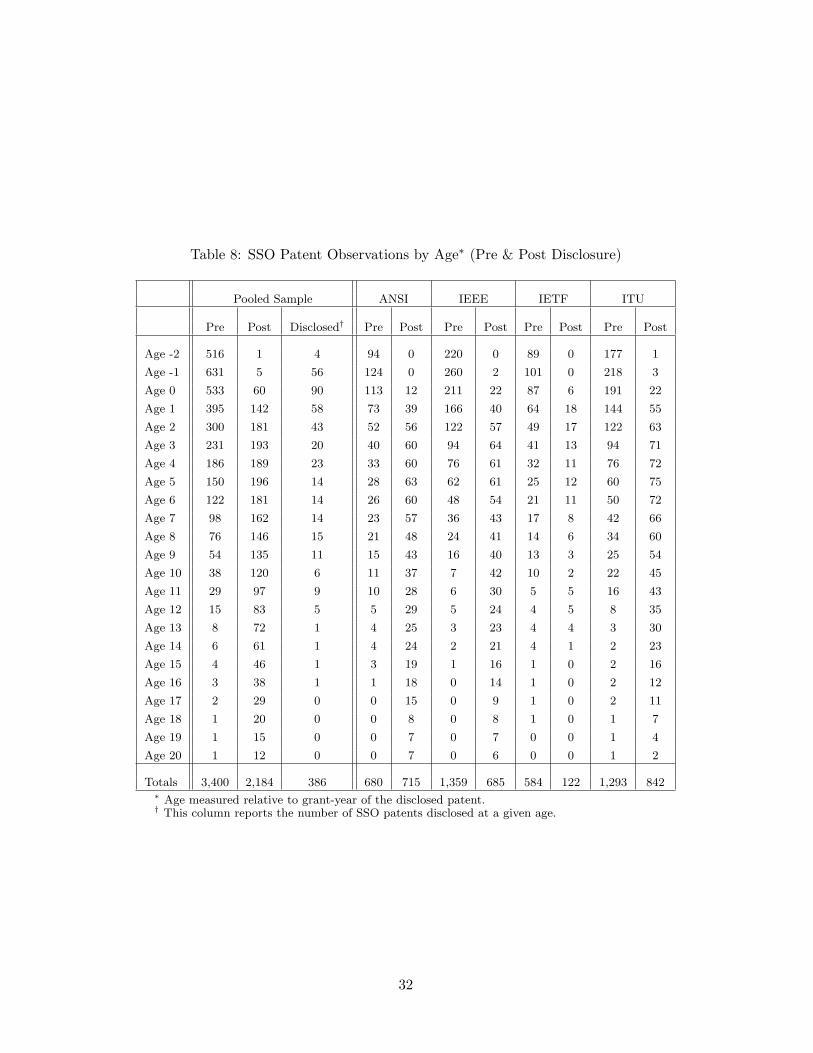
Table 8: SSO Patent Observations by Age∗ (Pre & Post Disclosure)
Pooled Sample ANSI IEEE IETF ITU
Pre Post Disclosed† Pre Post Pre Post Pre Post Pre Post
Age -2 516 1 4 94 0 220 0 89 0 177 1
Age -1 631 5 56 124 0 260 2 101 0 218 3
Age 0 533 60 90 113 12 211 22 87 6 191 22
Age 1 395 142 58 73 39 166 40 64 18 144 55
Age 2 300 181 43 52 56 122 57 49 17 122 63
Age 3 231 193 20 40 60 94 64 41 13 94 71
Age 4 186 189 23 33 60 76 61 32 11 76 72
Age 5 150 196 14 28 63 62 61 25 12 60 75
Age 6 122 181 14 26 60 48 54 21 11 50 72
Age 7 98 162 14 23 57 36 43 17 8 42 66
Age 8 76 146 15 21 48 24 41 14 6 34 60
Age 9 54 135 11 15 43 16 40 13 3 25 54
Age 10 38 120 6 11 37 7 42 10 2 22 45
Age 11 29 97 9 10 28 6 30 5 5 16 43
Age 12 15 83 5 5 29 5 24 4 5 8 35
Age 13 8 72 1 4 25 3 23 4 4 3 30
Age 14 6 61 1 4 24 2 21 4 1 2 23
Age 15 4 46 1 3 19 1 16 1 0 2 16
Age 16 3 38 1 1 18 0 14 1 0 2 12
Age 17 2 29 0 0 15 0 9 1 0 2 11
Age 18 1 20 0 0 8 0 8 1 0 1 7
Age 19 1 15 0 0 7 0 7 0 0 1 4
Age 20 1 12 0 0 7 0 6 0 0 1 2
Totals 3,400 2,184 386 680 715 1,359 685 584 122 1,293 842∗ Age measured relative to grant-year of the disclosed patent.† This column reports the number of SSO patents disclosed at a given age.
32
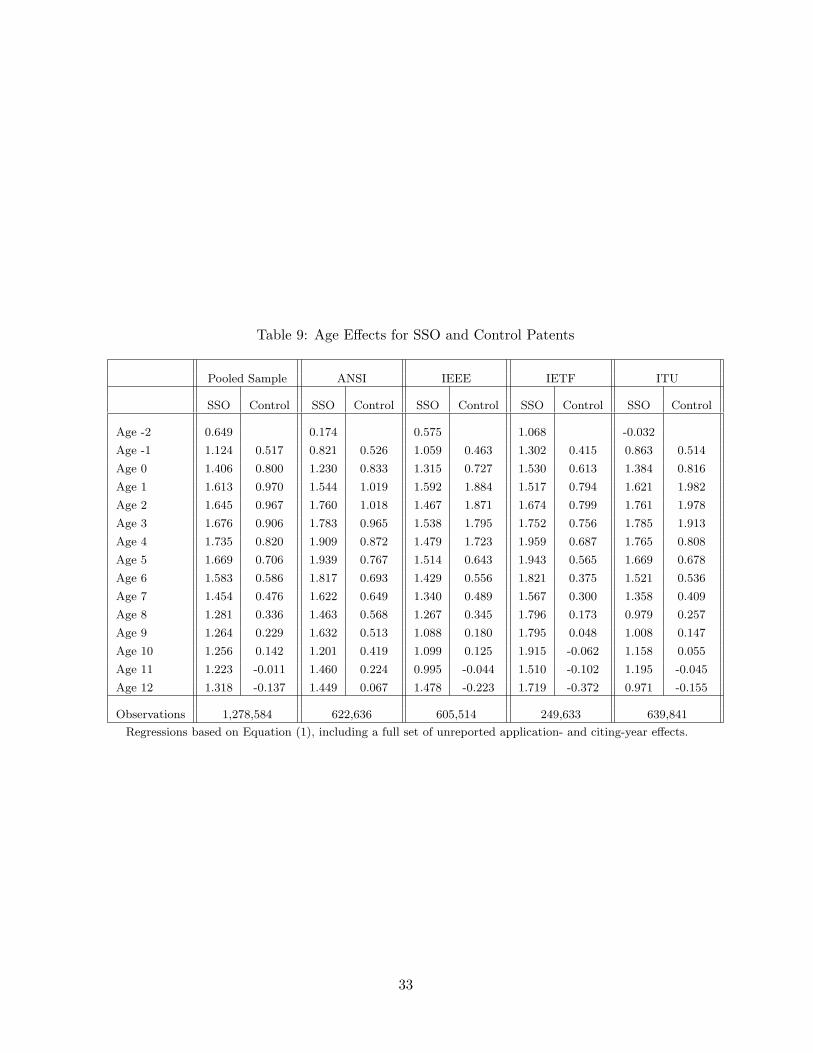
Table 9: Age Effects for SSO and Control Patents
Pooled Sample ANSI IEEE IETF ITU
SSO Control SSO Control SSO Control SSO Control SSO Control
Age -2 0.649 0.174 0.575 1.068 -0.032
Age -1 1.124 0.517 0.821 0.526 1.059 0.463 1.302 0.415 0.863 0.514
Age 0 1.406 0.800 1.230 0.833 1.315 0.727 1.530 0.613 1.384 0.816
Age 1 1.613 0.970 1.544 1.019 1.592 1.884 1.517 0.794 1.621 1.982
Age 2 1.645 0.967 1.760 1.018 1.467 1.871 1.674 0.799 1.761 1.978
Age 3 1.676 0.906 1.783 0.965 1.538 1.795 1.752 0.756 1.785 1.913
Age 4 1.735 0.820 1.909 0.872 1.479 1.723 1.959 0.687 1.765 0.808
Age 5 1.669 0.706 1.939 0.767 1.514 0.643 1.943 0.565 1.669 0.678
Age 6 1.583 0.586 1.817 0.693 1.429 0.556 1.821 0.375 1.521 0.536
Age 7 1.454 0.476 1.622 0.649 1.340 0.489 1.567 0.300 1.358 0.409
Age 8 1.281 0.336 1.463 0.568 1.267 0.345 1.796 0.173 0.979 0.257
Age 9 1.264 0.229 1.632 0.513 1.088 0.180 1.795 0.048 1.008 0.147
Age 10 1.256 0.142 1.201 0.419 1.099 0.125 1.915 -0.062 1.158 0.055
Age 11 1.223 -0.011 1.460 0.224 0.995 -0.044 1.510 -0.102 1.195 -0.045
Age 12 1.318 -0.137 1.449 0.067 1.478 -0.223 1.719 -0.372 0.971 -0.155
Observations 1,278,584 622,636 605,514 249,633 639,841
Regressions based on Equation (1), including a full set of unreported application- and citing-year effects.
33
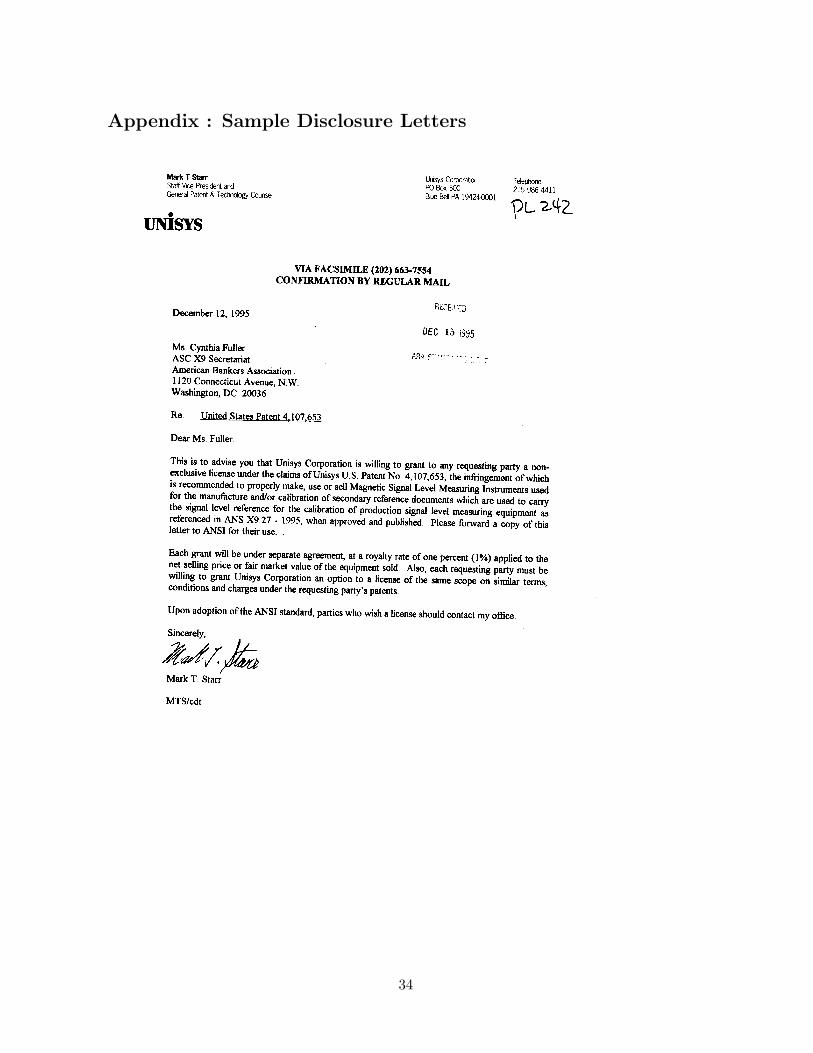
Appendix : Sample Disclosure Letters
34
Heather Benko
From: [email protected]
Sent: Wednesday, January 12, 2005 4:18 PM
Subject: IPR/Patent Holder Statement
Page 1 of 1
1/12/2005
Document InformationReference Doc. No. PN-3-3972-UGRV.SF1
(refer to Project Number, Standards Proposal Number or title--one form per document. Note, may fill one statement for a document with multi-parts.)
Publication ID TIA-733-A [SF1]
Document Title Software Distribution for TIA-733-A - High Rate Speech Service Option17 for Wideband Spread Spectrum"
General InformationYour Name Michael WangYour TitleCompany Nortel NetworksCompany Phone 972-684-2848IPR Contact Michelle LeeAddress1 Mail Stop 036NO151Address2 8200 DIXIE ROAD SUITE 100City BRAMPTONState ONTARIOZip L6T 5P6Country CANADAPhone Number 905-863-1148"Fax NumberEmail [email protected] Nortel Networks states: 2b. A license under any Essential Patent(s) or published pending patent application(s) held by the undersigned company will be made available under reasonable terms and conditions that are demonstrably free of any unfair discrimination to applicants only and to the extent necessary for the practice of the TIA Publication. 3a. The commitment to license above selected will be made available only on a reciprocal basis. The term 'reciprocal' means that the licensee is willing to license the licensor in compliance with either (2a) or (2b) above as respects the practice of the TIA Publication.
35