Patent Trial and Appeal Board Statistics PTAB.pdf · Patent Trial and Appeal Board Statistics ......
14
Patent Trial and Appeal Board Statistics 6/30/2015
Transcript of Patent Trial and Appeal Board Statistics PTAB.pdf · Patent Trial and Appeal Board Statistics ......

Patent Trial and Appeal Board
Statistics 6/30/2015

2
Narrative: This pie chart shows the total number of cumulative AIA
petitions filed to date broken out by trial type (i.e., IPR,
CBM, and PGR).
*Data current as of: 6/30/2015
3160
90%
362
10%
10
0%
3532 Total AIA Petitions*
Total IPR Petitions Total CBM Petitions Total PGR Petitions
Cumulative from 09/16/2012
3
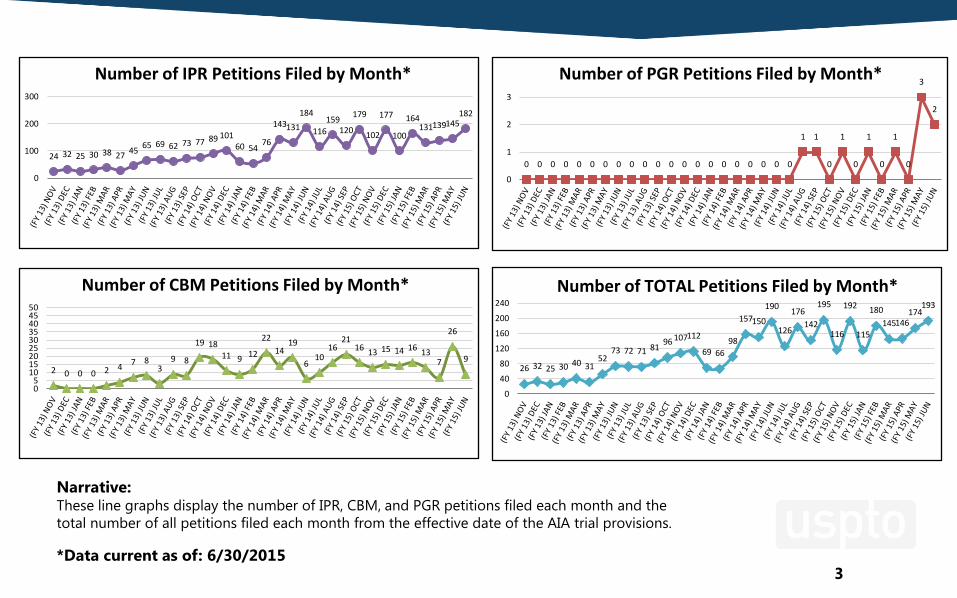
Narrative: These line graphs display the number of IPR, CBM, and PGR petitions filed each month and the
total number of all petitions filed each month from the effective date of the AIA trial provisions.
*Data current as of: 6/30/2015
0 0 0 0 0 0 0 0 0 0 0 0 0 0 0 0 0 0 0 0 0
1 1
0
1
0
1
0
1
0
3
2
0
1
2
3
Number of PGR Petitions Filed by Month*
24 32 25 30 38 27 45
65 69 62 73 77 89 101 60 54
76
143 131
184
116
159 120
179
102
177
100
164 131 139 145
182
0
100
200
300
Number of IPR Petitions Filed by Month*
2 0 0 0 2 4 7 8
3 9 8
19 18 11 9
12
22
14 19
6 10
16 21
16 13 15 14 16
13 7
26
9
05
101520253035404550
Number of CBM Petitions Filed by Month*
26 32 25 30 40 31 52
73 72 71 81 96 107 112
69 66
98
157 150
190
126
176
142
195
116
192
115
180
145 146 174
193
0
40
80
120
160
200
240
Number of TOTAL Petitions Filed by Month*

4
*Data current as of: 6/30/2015
Narrative: This bar graph depicts the
number of AIA petitions filed
each fiscal year, with each bar
showing the filings for that fiscal
year by trial type (i.e., IPR, CBM,
and PGR).
FY 2012 FY 2013 FY 2014 FY 2015*
0 0 2 8 8 48
177 129
17
514
1310 1319
Number of AIA Petitions Filed by Fiscal Year by Type
PGR CBM IPR

5
Narrative: This pie chart shows the total number of AIA petitions
filed in the current fiscal year to date as well as the
number and percentage of these petitions broken down
by technology.
*Data current as of: 6/30/2015
928 64%
343 23% 68
5%
113 8%
4 0%
1456 Total AIA Petitions in FY 2015* (Technology Breakdown)
Electrical/Computer - TCs 2100, 2400, 2600, 2800
Mechanical/Business Method - TCs 3600, 3700
Chemical - TC 1700
Bio/Pharma - TC 1600
Design - TC 2900

6
Narrative: These three sets of bar graphs show the number of
patent owner preliminary responses filed and
waived/not filed each fiscal year in IPR, CBM, and PGR
proceedings.
*Data current as of: 6/30/2015
FY 2013 FY 2014 FY 2015*
237
829 975 63
202 169
IPR - Number of Patent Owner Preliminary Responses by Fiscal Year
Filed Waived/Not Filed
FY 2013 FY 2014 FY 2015*
33
116 118 2
18 11
CBM - Number of Patent Owner Preliminary
Responses by Fiscal Year
Filed Waived/Not Filed
FY 2013 FY 2014 FY 2015*
0 0
3
1
PGR - Number of Patent Owner Preliminary Responses by Fiscal Year
Filed Waived/Not Filed

7
Narrative: These three sets of bar graphs show the number of decisions
on institution by fiscal year broken out by trials instituted
(including joinders) and trials denied in IPR, CBM, and PGR
proceedings. A trial that is instituted in part is counted as an
institution in these bar graphs.
*Data current as of: 6/30/2015
FY 2013 FY 2014 *FY 2015
167
557 593 10
15 102
26
193
287
IPR - Number of Decisions On Institution Per Fiscal Year by Outcome
Instituted Joinders Denials
FY 2013 FY 2014 *FY 2015
14
91 70
0
1
2
3
30
30
CBM - Number of Decisions On Institution Per Fiscal Year by Outcome
Instituted Joinders Denials
FY 2013 FY 2014 *FY 2015
0 0
2
0 0 0
PGR - Number of Decisions On Institution Per Fiscal Year by Outcome
Instituted Joinders Denials

8
Narrative: These three sets of bar graphs show settlements in AIA
trials broken down by settlements that occurred prior to
institution and settlements that occurred after institution
in IPR, CBM, and PGR proceedings.
*Data current as of: 6/30/2015
FY 2013 FY 2014 FY 2015*
20
106
217
18
104
141
IPR - Settlements
Settled Before Institution Settled After Institution
FY 2013 FY 2014 FY 2015*
3
21
11
0
6
28
CBM - Settlements
Settled Before Institution Settled After Institution
FY2013 FY 2014 FY 2015*
0 0
2
0 0 0
PGR - Settlements
Settled Before Institution Settled After Institution

9
Narrative: This graph shows a stepping stone
visual depicting the outcomes for
all IPR petitions filed to-date that
have reached a final disposition.
*Data current as of: 6/30/2015 277 Trials
All Instituted Claims
Unpatentable (17%
of Total Petitions,
36% of Trials
Instituted, 67% of
Final Written
Decisions)
74 Trials Some Instituted
Claims Unpatentable
(4% of Total
Petitions, 10% of
Trials Instituted, 18%
of Final Written
Decisions)
64 Trials No Instituted Claims
Unpatentable (4% of
Total Petitions, 8% of
Trials Instituted, 15%
of Final Written
Decisions)
415 Trials
Completed Reached Final
Written Decisions
1645 Total
Petitions
773 Trials
Instituted
872 Trials Not
Instituted Petition Denied/
Settled/
Dismissed
358 Terminated
During Trial Settled/Dismissed/
Request for
Adverse Judgment
Disposition of IPR Petitions Completed to Date*

10
Narrative: This graph shows a stepping stone
visual depicting the outcomes for
all CBM petitions filed to-date that
have reached a final disposition.
*Data current as of: 6/30/2015 41 Trials
All Instituted Claims
Unpatentable (22%
of Total Petitions,
44% of Trials
Instituted, 80% of
Final Written
Decisions)
8 Trials Some Instituted
Claims Unpatentable
(4% of Total
Petitions, 7% of Trials
Instituted, 16% of
Final Written
Decisions)
2 Trials No Instituted Claims
Unpatentable (1% of
Total Petitions, 2% of
Trials Instituted, 4%
of Final Written
Decisions)
51 Trials
Completed Reached Final
Written Decisions
195 Total
Petitions
95 Trials
Instituted
100 Trials Not
Instituted Petition Denied/
Settled/
Dismissed
44 Terminated
During Trial Settled/Dismissed/
Request for
Adverse Judgment
Disposition of CBM Petitions Completed to Date*

11
Narrative: This graph shows a stepping stone
visual depicting the outcomes for
all PGR petitions filed to-date that
have reached a final disposition.
*Data current as of: 6/30/2015 0 Trials
All Instituted Claims
Unpatentable (0% of
Total Petitions, 0% of
Trials Instituted, 0%
of Final Written
Decisions)
0 Trials Some Instituted
Claims Unpatentable
(0% of Total
Petitions, 0% of Trials
Instituted, 0% of Final
Written Decisions)
0 Trials No Instituted Claims
Unpatentable (0% of
Total Petitions, 0% of
Trials Instituted, 0%
of Final Written
Decisions)
0 Trials
Completed Reached Final
Written Decisions
4 Total
Petitions
2 Trials
Instituted
2 Trials Not
Instituted Petition Denied/
Settled/
Dismissed
0 Terminated
During Trial Settled/Dismissed/
Request for
Adverse Judgment
Disposition of PGR Petitions Completed to Date*

12
Narrative: This visual contains four bars. The first
bar shows the total number of claims
available to be challenged in the IPR
petitions filed. The second bar shows
the number of claims actually
challenged and not challenged. The
third bar shows the number of claims
on which trial was instituted and not
instituted. The fourth bar shows the
total number claims found
unpatentable in a final written decision,
the number of claims canceled or
disclaimed by patent owner, the
number of claims remaining patentable
(not subject to a final written decision),
and the number of claims found
patentable by the PTAB.
Note: Petitions terminated does not
included petitions denied.
*Data current as of: 6/30/2015
35970
16451
10296
4225
1013 Claims Found Patentable by PTAB in FinalWritten Decision
3667 Claims Remaining Patentable (Not Subjectto Final Written Decision)
1391 Claims Cancelled or Disclaimed by PatentOwner
6155 Claims Challenged but Not Instituted
19519 Claims Not Challenged
IPR Petitions Terminated to Date*
Claims Challenged
Claims Instituted
Claims Found Unpatentable by PTAB in Final Written Decision
Total Number of Claims Available to be Challenged within 1138 Petitions

13
Narrative: This visual contains four bars. The first
bar shows the total number of claims
available to be challenged in the CBM
petitions filed. The second bar shows
the number of claims actually
challenged and not challenged. The
third bar shows the number of claims
on which trial was instituted and not
instituted. The fourth bar shows the
total number claims found
unpatentable in a final written decision,
the number of claims canceled or
disclaimed by patent owner, the
number of claims remaining patentable
(not subject to a final written decision),
and the number of claims found
patentable by the PTAB.
Note: Petitions terminated does not
included petitions denied.
*Data current as of: 6/30/2015
4914
2859
1820
964
37 Claims Found Patentable by PTAB in Final Written Decision
716 Claims Remaining Patentable (Not Subject to FinalWritten Decision)
103 Claims Cancelled or Disclaimed by Patent Owner
1039 Claims Challenged but Not Instituted
2055 Claims Not Challenged
CBM Petitions Terminated to Date*
Claims Challenged
Claims Instituted
Claims Found Unpatentable by PTAB in Final Written Decision
Total Number of Claims Available to be Challenged within 132 Petitions