Patel, R P, Förster, D W, Kitchener, Andrew C, Rayan, M D ...repository.nms.ac.uk/1854/1/1854 Two...
16
Patel, R P, Förster, D W, Kitchener, Andrew C, Rayan, M D, Mohamed, S W, Werner, L, Lenz, D, Pfestorf, H, Kramer-Schadt, Stephanie, Radchuk, V, Fickel, J and Wilting, Andreas 2016. Two species of Southeast Asian cats in the genus Catopuma with diverging histories: an island endemic forest specialist and a widespread habitat generalist. Royal Society Open Science. ISSN 2054-5703 DOI: 10.1098/rsos.160350 http://repository.nms.ac.uk/1854 Deposited on: 22 May 2017 NMS Repository – Research publications by staff of the National Museums Scotland http://repository.nms.ac.uk/
Transcript of Patel, R P, Förster, D W, Kitchener, Andrew C, Rayan, M D ...repository.nms.ac.uk/1854/1/1854 Two...

Patel, R P, Förster, D W, Kitchener, Andrew C, Rayan, M D, Mohamed, S W, Werner, L, Lenz, D, Pfestorf, H, Kramer-Schadt, Stephanie, Radchuk, V, Fickel, J and Wilting, Andreas 2016. Two species of Southeast Asian cats in the genus Catopuma with diverging histories: an island endemic forest specialist and a widespread habitat generalist. Royal Society Open Science. ISSN 2054-5703 DOI: 10.1098/rsos.160350 http://repository.nms.ac.uk/1854 Deposited on: 22 May 2017
NMS Repository – Research publications by staff of the National Museums Scotland
http://repository.nms.ac.uk/

rsos.royalsocietypublishing.org
ResearchCite this article: Patel RP et al. 2016 Twospecies of Southeast Asian cats in the genusCatopumawith diverging histories: an islandendemic forest specialist and a widespreadhabitat generalist. R. Soc. open sci. 3: 160350.http://dx.doi.org/10.1098/rsos.160350
Received: 24 May 2016Accepted: 13 September 2016
Subject Category:Biology (whole organism)
Subject Areas:evolution/molecular biology/genetics
Keywords:Felidae, Southeast Asia, last glacial maximum,Toba volcanic eruption, hybrid capture, nextgeneration sequencing
Author for correspondence:Riddhi P. Patele-mail: [email protected]
Electronic supplementary material is availableonline at https://dx.doi.org/10.6084/m9.figshare.c.3500388.
Two species of SoutheastAsian cats in the genusCatopumawith diverginghistories: an island endemicforest specialist and awidespread habitatgeneralistRiddhi P. Patel1,2, Daniel W. Förster1, Andrew C.
Kitchener3,4, Mark D. Rayan5, Shariff W. Mohamed5,
Laura Werner1, Dorina Lenz1, Hans Pfestorf1, Stephanie
Kramer-Schadt1, Viktoriia Radchuk1, Jörns Fickel1,6 and
Andreas Wilting1
1Department of Evolutionary Genetics, Leibniz Institute for Zoo and Wildlife Research(IZW), Alfred-Kowalke Strasse 17, 10315 Berlin, Germany2Freie Universität Berlin, Kaiserswerther Strasse 16–18, 14195 Berlin, Germany3Department of Natural Sciences, National Museums Scotland, Chambers Street,Edinburgh EH1 1JF, UK4Institute of Geography, School of Geosciences, University of Edinburgh, DrummondStreet, Edinburgh EH8 9XP, UK5WWFMalaysia, 1 Jalan PJS 5/28A, Petaling Jaya Commercial Centre (PJCC),46150 Petaling Jaya, Selangor, Malaysia6Institute for Biochemistry and Biology, University of Potsdam,Karl-Liebknecht-Strasse 24–25, 14476 Potsdam, Germany
RPP, 0000-0003-4555-0957
Background. The bay cat Catopuma badia is endemic to Borneo,whereas its sister species the Asian golden cat Catopumatemminckii is distributed from the Himalayas and southernChina through Indochina, Peninsular Malaysia and Sumatra.Based on morphological data, up to five subspecies of the Asiangolden cat have been recognized, but a taxonomic assessment,including molecular data and morphological characters, isstill lacking. Results. We combined molecular data (wholemitochondrial genomes), morphological data (pelage) andspecies distribution projections (up to the Late Pleistocene)
2016 The Authors. Published by the Royal Society under the terms of the Creative CommonsAttribution License http://creativecommons.org/licenses/by/4.0/, which permits unrestricteduse, provided the original author and source are credited.
on May 22, 2017http://rsos.royalsocietypublishing.org/Downloaded from

2
rsos.royalsocietypublishing.orgR.Soc.opensci.3:160350
................................................to infer how environmental changes may have influenced the distribution of these sister speciesover the past 120 000 years. The molecular analysis was based on sequenced mitogenomes of 3 baycats and 40 Asian golden cats derived mainly from archival samples. Our molecular data suggesteda time of split between the two species approximately 3.16 Ma and revealed very low nucleotidediversity within the Asian golden cat population, which supports recent expansion of the population.Discussion. The low nucleotide diversity suggested a population bottleneck in the Asian golden cat,possibly caused by the eruption of the Toba volcano in Northern Sumatra (approx. 74 kya), followedby a continuous population expansion in the Late Pleistocene/Early Holocene. Species distributionprojections, the reconstruction of the demographic history, a genetic isolation-by-distance pattern anda gradual variation of pelage pattern support the hypothesis of a post-Toba population expansion ofthe Asian golden cat from south China/Indochina to Peninsular Malaysia and Sumatra. Our findingsreject the current classification of five subspecies for the Asian golden cat, but instead support eithera monotypic species or one comprising two subspecies: (i) the Sunda golden cat, distributed south ofthe Isthmus of Kra: C. t. temminckii and (ii) Indochinese, Indian, Himalayan and Chinese golden cats,occurring north of the Isthmus: C. t. moormensis.
1. BackgroundFluctuating geological and climatic conditions during the Pliocene and Pleistocene have shaped what isnow recognized as the globally important Southeast Asian biodiversity hotspot. In particular, the SundaShelf which comprises Peninsular Malaysia, Sumatra, Borneo, Java, Bali and other smaller islands is ofgreat interest to evolutionary biologists [1], as alternating glacial and interglacial periods resulted in theemergence and submergence of land bridges between the larger landmasses [2–4]. The impact of thesetransient land bridges on the distribution of genetic variation within and among species has receivedgrowing attention in the past years. For example, little or no genetic differentiation between islandpopulations of a given species supports a scenario in which members of this species were free to movebetween islands during the Last Glacial Maximum (LGM) [5,6], while significant genetic divergencebetween mainland and Sundaic or among Sundaic populations of different islands supports a scenario ofprolonged genetic isolation due to movement restriction. The latter has been demonstrated among othersfor murine rodents [7], common palm civets Paradoxurus hermaphrodites [8], clouded leopards Neofelisspp. [9] and leopards Panthera pardus [10].
A history of vicariant evolution is also ascribed to the two sister species in the genus Catopuma: thebay cat Catopuma badia (Gray, 1874) and the Asian golden cat Catopuma temminckii (Vigors & Horsfield,1827). The monotypic bay cat is endemic to the island of Borneo. Despite continuous camera-trappingefforts, this carnivore remains one of the least known cat species [11]. A characteristic morphological traitof the bay cat is its pelage. It is dense reddish (bay) or grey, with gradual transitions between these formsbeing common [11]. Occasionally occurring black or almost black morphs have also been reported [12,13].The bay cat is smaller than the Asian golden cat [14] and recent molecular studies showed that the twospecies probably split around 3.27 Ma [15].
In contrast with the island endemic bay cat, the Asian golden cat has a wide distribution in SoutheastAsia, ranging from Northeast India and Nepal to southern China, Indochina and to Peninsular Malaysiaand Sumatra in the Sunda Shelf. The species is polymorphic and has usually been divided intothree subspecies [16,17]: C. t. temminckii (Vigors & Horsfield, 1827), distributed in Sumatra, PeninsularMalaysia, Indochina, Burma to Nepal; C. t. dominicanorum (Sclater, 1898), restricted to Southern China;and C. t. tristis (Milne-Edwards, 1872) with a distribution from Tibet, Sichuan to Upper Burma. Inaddition, it has been proposed that Asian golden cats from Yunnan should be separated as C. t. bainesi(Sowerby, 1924), and those from Nepal, southern Tibet and probably northwest Yunnan and west Sichuanin China as C. t. moormensis (Hodgson, 1831). Although colour variations, ranging from orange to black,including the blotched ‘ocelot’ type in northern populations, and size differences between northernand southern Sundaic populations have been observed (JH Mazák and ACK 2011, unpublished data),a detailed study assessing these morphological traits has not yet been conducted on the Asian goldencat. The first molecular study of the Asian golden cat included two mitochondrial genes, four autosomalgenes, one X-linked and four Y-linked genes [18]. This study revealed low molecular diversity among theanalysed samples, with a moderate distinction in mtDNA between animals from north of the Isthmus ofKra and Peninsular Malaysia. Autosomal genes and sex chromosome markers showed no differentiation.Sumatran samples were not included in this study.
on May 22, 2017http://rsos.royalsocietypublishing.org/Downloaded from
3
rsos.royalsocietypublishing.orgR.Soc.opensci.3:160350
................................................
SIK = 210 26
14
1914
19
TH = 4
MA = 1
SU = 12
Bay cat = 3
VI = 1
SIC = 4
FU = 5YUN = 2
CH = 2TIB = 6
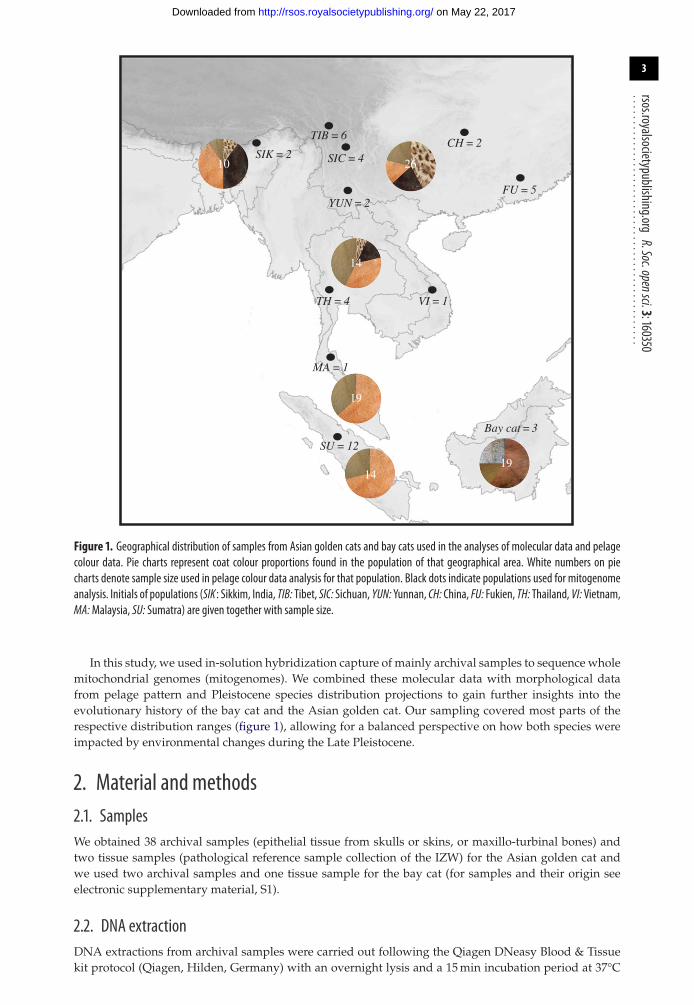
Figure 1. Geographical distribution of samples from Asian golden cats and bay cats used in the analyses of molecular data and pelagecolour data. Pie charts represent coat colour proportions found in the population of that geographical area. White numbers on piecharts denote sample size used in pelage colour data analysis for that population. Black dots indicate populations used for mitogenomeanalysis. Initials of populations (SIK : Sikkim, India, TIB: Tibet, SIC: Sichuan, YUN: Yunnan, CH: China, FU: Fukien, TH: Thailand, VI: Vietnam,MA:Malaysia, SU: Sumatra) are given together with sample size.
In this study, we used in-solution hybridization capture of mainly archival samples to sequence wholemitochondrial genomes (mitogenomes). We combined these molecular data with morphological datafrom pelage pattern and Pleistocene species distribution projections to gain further insights into theevolutionary history of the bay cat and the Asian golden cat. Our sampling covered most parts of therespective distribution ranges (figure 1), allowing for a balanced perspective on how both species wereimpacted by environmental changes during the Late Pleistocene.
2. Material and methods2.1. SamplesWe obtained 38 archival samples (epithelial tissue from skulls or skins, or maxillo-turbinal bones) andtwo tissue samples (pathological reference sample collection of the IZW) for the Asian golden cat andwe used two archival samples and one tissue sample for the bay cat (for samples and their origin seeelectronic supplementary material, S1).
2.2. DNA extractionDNA extractions from archival samples were carried out following the Qiagen DNeasy Blood & Tissuekit protocol (Qiagen, Hilden, Germany) with an overnight lysis and a 15 min incubation period at 37°C
on May 22, 2017http://rsos.royalsocietypublishing.org/Downloaded from

4
rsos.royalsocietypublishing.orgR.Soc.opensci.3:160350
................................................Table 1. Primer sequences for long-range PCR designed using Prionailurus bengalensis NCBI reference sequence NC 016189.
primer name sequence 5′-3′ product size
Prion_mt_F1 AAGYATTCCRCCCCAAACATAAG 6000. . . . . . . . . . . . . . . . . . . . . . . . . . . . . . . . . . . . . . . . . . . . . . . . . . . . . . . . . . . . . . . . . . . . . . . . . . . . . . . . . . . . . . . . . . . . . . . . . . . . . . . . . . . . . . . . . . . . . . . . . . . . . . . . . . . . . . . . . . . . . . . . . . . . . . . . . . . . . . . . . . . . . . . . . . . . . . . . . . . . . . . . . . . . . . . . . . . . . . . . . . . . . . . . . . . . . . . . .
Prion_mt_R1 TCCTTTTTGGGTTCATTCGTAGG 6000. . . . . . . . . . . . . . . . . . . . . . . . . . . . . . . . . . . . . . . . . . . . . . . . . . . . . . . . . . . . . . . . . . . . . . . . . . . . . . . . . . . . . . . . . . . . . . . . . . . . . . . . . . . . . . . . . . . . . . . . . . . . . . . . . . . . . . . . . . . . . . . . . . . . . . . . . . . . . . . . . . . . . . . . . . . . . . . . . . . . . . . . . . . . . . . . . . . . . . . . . . . . . . . . . . . . . . . . .
Prion_mt_F2 ACTAYTACTYCCCCTCCCATGA 5500. . . . . . . . . . . . . . . . . . . . . . . . . . . . . . . . . . . . . . . . . . . . . . . . . . . . . . . . . . . . . . . . . . . . . . . . . . . . . . . . . . . . . . . . . . . . . . . . . . . . . . . . . . . . . . . . . . . . . . . . . . . . . . . . . . . . . . . . . . . . . . . . . . . . . . . . . . . . . . . . . . . . . . . . . . . . . . . . . . . . . . . . . . . . . . . . . . . . . . . . . . . . . . . . . . . . . . . . .
Prion_mt_R2 ATAGTGGGGCTGTTGCTTCTTC 5500. . . . . . . . . . . . . . . . . . . . . . . . . . . . . . . . . . . . . . . . . . . . . . . . . . . . . . . . . . . . . . . . . . . . . . . . . . . . . . . . . . . . . . . . . . . . . . . . . . . . . . . . . . . . . . . . . . . . . . . . . . . . . . . . . . . . . . . . . . . . . . . . . . . . . . . . . . . . . . . . . . . . . . . . . . . . . . . . . . . . . . . . . . . . . . . . . . . . . . . . . . . . . . . . . . . . . . . . .
Prion_mt_F3 CAGACCTCCTAACCCTAACATGA 6000. . . . . . . . . . . . . . . . . . . . . . . . . . . . . . . . . . . . . . . . . . . . . . . . . . . . . . . . . . . . . . . . . . . . . . . . . . . . . . . . . . . . . . . . . . . . . . . . . . . . . . . . . . . . . . . . . . . . . . . . . . . . . . . . . . . . . . . . . . . . . . . . . . . . . . . . . . . . . . . . . . . . . . . . . . . . . . . . . . . . . . . . . . . . . . . . . . . . . . . . . . . . . . . . . . . . . . . . .
Prion_mt_R3 TGGTAGCACGAAGATTTTTGGAT 6000. . . . . . . . . . . . . . . . . . . . . . . . . . . . . . . . . . . . . . . . . . . . . . . . . . . . . . . . . . . . . . . . . . . . . . . . . . . . . . . . . . . . . . . . . . . . . . . . . . . . . . . . . . . . . . . . . . . . . . . . . . . . . . . . . . . . . . . . . . . . . . . . . . . . . . . . . . . . . . . . . . . . . . . . . . . . . . . . . . . . . . . . . . . . . . . . . . . . . . . . . . . . . . . . . . . . . . . . .
during the elution. We included multiple extraction blanks, one per set of five samples, to control forsample cross-contamination and reagent contamination. DNA extraction and library preparation ofarchival samples was carried out in specially equipped laboratories dedicated to the analysis of archivalsamples. DNA extractions from tissue samples were carried out using the Invitek DNA extraction kit(Invitek GmbH, Berlin, Germany) in a separated laboratory dedicated to the extraction of fresh samples.
2.3. Library preparation and hybridization captureIllumina libraries were prepared according to a modified paired-end sequencing protocol [19]. As theDNA extracted from archival samples was severely degraded, we used an enrichment technique (in-solution hybridization capture) to target complete mitogenomes. As none of our Catopuma sampleswas suited to generate baits for capture, we applied a cross-species capture approach [20]. Baits forcross-species capture were generated from the leopard cat (Prionailurus bengalensis) by amplifying threelarge (approx. 6 kb) overlapping regions of the mitogenome by long-range PCR (table 1); these weresubsequently sheared to approximately 250 bp using a Covaris M220 (Covaris Inc., USA), purified usingthe QiaQuick kit (Qiagen GmbH, Hilden, Germany), and pooled equimolarly. The final steps in baitgeneration were blunt-end repair and ligation of biotinylated adapters (see [21], for details). In-solutioncapture was then carried out as described in [19]. After capture, enriched libraries were amplified usingprimers IS5 and IS6 [22] and purified, and then the enriched and re-amplified libraries underwenta second round of capture using freshly prepared baits because two consecutive rounds of capturesignificantly increased target yield (data not shown; see also [23]). Libraries were sequenced on the MiSeqplatform (Illumina, San Diego, CA, USA) using MiSeq v. 3 150-cycle kits. Extraction blanks underwentthe same laboratory steps (library construction and capture procedure) and were likewise sequenced toassure absence of contaminants.
2.4. Bioinformatic analyses of CatopumamitogenomesAdapter sequences were clipped from paired-end reads using cutadapt v. 1.3 [24]. Subsequent qualitytrimming was performed on reads more than or equal to 20 bp using a sliding window approach anda phred quality threshold of Q = 20. The resulting adapter-clipped and quality-trimmed reads weremerged using the software FLASH v. 1.2.8 [25]. Mapping assembly was then performed using MITObimv. 1.7 [26] using a leopard cat mitogenome sequence (GenBank accession NC 016189) as a reference forthe first step of the iterative mapping. For each sample, a consensus sequence was generated in Geneiousv. 8.1.2 (Biomatters, Auckland, New Zealand). Each sequence was annotated for control region, CDS,tRNAs, rRNAs and ATPase in RATT [27].
2.5. Phylogeographical analyses for the Asian golden catThe dataset of 40 Asian golden cat sequences was aligned using Geneious v. 8.1.2 (Biomatters, Auckland,New Zealand). For further analysis, we excluded the control region from the alignment. PartitionFinderv. 1.1.0 [28] was applied to search for the best fitting substitution model for the dataset, with BIC(Bayesian Information Criterion) as model selector with unlinked branch length. We used HKY + I + Gas substitution rate model in MrBayes v. 3.2 [29] and GTR + I + G in RAxML as it is the only modelprovided [30] for phylogeny reconstruction. Median-joining (MJ) haplotype networks were constructed
on May 22, 2017http://rsos.royalsocietypublishing.org/Downloaded from

5
rsos.royalsocietypublishing.orgR.Soc.opensci.3:160350
................................................Table 2. Mitogenome sequences used for estimation of TMRCA and molecular clock rate for the genus Catopuma.
no. species name common name NCBI accession no.
1 Panthera pardus leopard EF 551002. . . . . . . . . . . . . . . . . . . . . . . . . . . . . . . . . . . . . . . . . . . . . . . . . . . . . . . . . . . . . . . . . . . . . . . . . . . . . . . . . . . . . . . . . . . . . . . . . . . . . . . . . . . . . . . . . . . . . . . . . . . . . . . . . . . . . . . . . . . . . . . . . . . . . . . . . . . . . . . . . . . . . . . . . . . . . . . . . . . . . . . . . . . . . . . . . . . . . . . . . . . . . . . . . . . . . . . . .
2 Panthera uncia snow leopard EF 551004. . . . . . . . . . . . . . . . . . . . . . . . . . . . . . . . . . . . . . . . . . . . . . . . . . . . . . . . . . . . . . . . . . . . . . . . . . . . . . . . . . . . . . . . . . . . . . . . . . . . . . . . . . . . . . . . . . . . . . . . . . . . . . . . . . . . . . . . . . . . . . . . . . . . . . . . . . . . . . . . . . . . . . . . . . . . . . . . . . . . . . . . . . . . . . . . . . . . . . . . . . . . . . . . . . . . . . . . .
3 Puma concolor puma JN 999997. . . . . . . . . . . . . . . . . . . . . . . . . . . . . . . . . . . . . . . . . . . . . . . . . . . . . . . . . . . . . . . . . . . . . . . . . . . . . . . . . . . . . . . . . . . . . . . . . . . . . . . . . . . . . . . . . . . . . . . . . . . . . . . . . . . . . . . . . . . . . . . . . . . . . . . . . . . . . . . . . . . . . . . . . . . . . . . . . . . . . . . . . . . . . . . . . . . . . . . . . . . . . . . . . . . . . . . . .
4 Panthera leo persica Asian lion JQ 904290. . . . . . . . . . . . . . . . . . . . . . . . . . . . . . . . . . . . . . . . . . . . . . . . . . . . . . . . . . . . . . . . . . . . . . . . . . . . . . . . . . . . . . . . . . . . . . . . . . . . . . . . . . . . . . . . . . . . . . . . . . . . . . . . . . . . . . . . . . . . . . . . . . . . . . . . . . . . . . . . . . . . . . . . . . . . . . . . . . . . . . . . . . . . . . . . . . . . . . . . . . . . . . . . . . . . . . . . .
5 Felis margarita sand cat KR 132580. . . . . . . . . . . . . . . . . . . . . . . . . . . . . . . . . . . . . . . . . . . . . . . . . . . . . . . . . . . . . . . . . . . . . . . . . . . . . . . . . . . . . . . . . . . . . . . . . . . . . . . . . . . . . . . . . . . . . . . . . . . . . . . . . . . . . . . . . . . . . . . . . . . . . . . . . . . . . . . . . . . . . . . . . . . . . . . . . . . . . . . . . . . . . . . . . . . . . . . . . . . . . . . . . . . . . . . . .
6 Leopardis pardalis ocelot KR 132583. . . . . . . . . . . . . . . . . . . . . . . . . . . . . . . . . . . . . . . . . . . . . . . . . . . . . . . . . . . . . . . . . . . . . . . . . . . . . . . . . . . . . . . . . . . . . . . . . . . . . . . . . . . . . . . . . . . . . . . . . . . . . . . . . . . . . . . . . . . . . . . . . . . . . . . . . . . . . . . . . . . . . . . . . . . . . . . . . . . . . . . . . . . . . . . . . . . . . . . . . . . . . . . . . . . . . . . . .
7 Lynx pardinus Iberian lynx KR 132583. . . . . . . . . . . . . . . . . . . . . . . . . . . . . . . . . . . . . . . . . . . . . . . . . . . . . . . . . . . . . . . . . . . . . . . . . . . . . . . . . . . . . . . . . . . . . . . . . . . . . . . . . . . . . . . . . . . . . . . . . . . . . . . . . . . . . . . . . . . . . . . . . . . . . . . . . . . . . . . . . . . . . . . . . . . . . . . . . . . . . . . . . . . . . . . . . . . . . . . . . . . . . . . . . . . . . . . . .
8 Otocolobus manul Pallas’s cat KR 132585. . . . . . . . . . . . . . . . . . . . . . . . . . . . . . . . . . . . . . . . . . . . . . . . . . . . . . . . . . . . . . . . . . . . . . . . . . . . . . . . . . . . . . . . . . . . . . . . . . . . . . . . . . . . . . . . . . . . . . . . . . . . . . . . . . . . . . . . . . . . . . . . . . . . . . . . . . . . . . . . . . . . . . . . . . . . . . . . . . . . . . . . . . . . . . . . . . . . . . . . . . . . . . . . . . . . . . . . .
9 Felis catus domestic cat NC 001700. . . . . . . . . . . . . . . . . . . . . . . . . . . . . . . . . . . . . . . . . . . . . . . . . . . . . . . . . . . . . . . . . . . . . . . . . . . . . . . . . . . . . . . . . . . . . . . . . . . . . . . . . . . . . . . . . . . . . . . . . . . . . . . . . . . . . . . . . . . . . . . . . . . . . . . . . . . . . . . . . . . . . . . . . . . . . . . . . . . . . . . . . . . . . . . . . . . . . . . . . . . . . . . . . . . . . . . . .
10 Acinonyx jubatus cheetah NC 005212. . . . . . . . . . . . . . . . . . . . . . . . . . . . . . . . . . . . . . . . . . . . . . . . . . . . . . . . . . . . . . . . . . . . . . . . . . . . . . . . . . . . . . . . . . . . . . . . . . . . . . . . . . . . . . . . . . . . . . . . . . . . . . . . . . . . . . . . . . . . . . . . . . . . . . . . . . . . . . . . . . . . . . . . . . . . . . . . . . . . . . . . . . . . . . . . . . . . . . . . . . . . . . . . . . . . . . . . .
11 Neofelis nebulosa clouded leopard NC 008450. . . . . . . . . . . . . . . . . . . . . . . . . . . . . . . . . . . . . . . . . . . . . . . . . . . . . . . . . . . . . . . . . . . . . . . . . . . . . . . . . . . . . . . . . . . . . . . . . . . . . . . . . . . . . . . . . . . . . . . . . . . . . . . . . . . . . . . . . . . . . . . . . . . . . . . . . . . . . . . . . . . . . . . . . . . . . . . . . . . . . . . . . . . . . . . . . . . . . . . . . . . . . . . . . . . . . . . . .
12 Lynx rufus bobcat NC 014456. . . . . . . . . . . . . . . . . . . . . . . . . . . . . . . . . . . . . . . . . . . . . . . . . . . . . . . . . . . . . . . . . . . . . . . . . . . . . . . . . . . . . . . . . . . . . . . . . . . . . . . . . . . . . . . . . . . . . . . . . . . . . . . . . . . . . . . . . . . . . . . . . . . . . . . . . . . . . . . . . . . . . . . . . . . . . . . . . . . . . . . . . . . . . . . . . . . . . . . . . . . . . . . . . . . . . . . . .
13 Prionailurus bengalensis euptilurus Amur leopard cat NC 016189. . . . . . . . . . . . . . . . . . . . . . . . . . . . . . . . . . . . . . . . . . . . . . . . . . . . . . . . . . . . . . . . . . . . . . . . . . . . . . . . . . . . . . . . . . . . . . . . . . . . . . . . . . . . . . . . . . . . . . . . . . . . . . . . . . . . . . . . . . . . . . . . . . . . . . . . . . . . . . . . . . . . . . . . . . . . . . . . . . . . . . . . . . . . . . . . . . . . . . . . . . . . . . . . . . . . . . . . .
14 Panthera onca jaguar NC 022842. . . . . . . . . . . . . . . . . . . . . . . . . . . . . . . . . . . . . . . . . . . . . . . . . . . . . . . . . . . . . . . . . . . . . . . . . . . . . . . . . . . . . . . . . . . . . . . . . . . . . . . . . . . . . . . . . . . . . . . . . . . . . . . . . . . . . . . . . . . . . . . . . . . . . . . . . . . . . . . . . . . . . . . . . . . . . . . . . . . . . . . . . . . . . . . . . . . . . . . . . . . . . . . . . . . . . . . . .
15 Panthera tigris tiger NC 010642. . . . . . . . . . . . . . . . . . . . . . . . . . . . . . . . . . . . . . . . . . . . . . . . . . . . . . . . . . . . . . . . . . . . . . . . . . . . . . . . . . . . . . . . . . . . . . . . . . . . . . . . . . . . . . . . . . . . . . . . . . . . . . . . . . . . . . . . . . . . . . . . . . . . . . . . . . . . . . . . . . . . . . . . . . . . . . . . . . . . . . . . . . . . . . . . . . . . . . . . . . . . . . . . . . . . . . . . .
16 Lynx lynx Eurasian lynx KM 982549. . . . . . . . . . . . . . . . . . . . . . . . . . . . . . . . . . . . . . . . . . . . . . . . . . . . . . . . . . . . . . . . . . . . . . . . . . . . . . . . . . . . . . . . . . . . . . . . . . . . . . . . . . . . . . . . . . . . . . . . . . . . . . . . . . . . . . . . . . . . . . . . . . . . . . . . . . . . . . . . . . . . . . . . . . . . . . . . . . . . . . . . . . . . . . . . . . . . . . . . . . . . . . . . . . . . . . . . .
17 Prionailurus viverrinus fishing cat KR 135742. . . . . . . . . . . . . . . . . . . . . . . . . . . . . . . . . . . . . . . . . . . . . . . . . . . . . . . . . . . . . . . . . . . . . . . . . . . . . . . . . . . . . . . . . . . . . . . . . . . . . . . . . . . . . . . . . . . . . . . . . . . . . . . . . . . . . . . . . . . . . . . . . . . . . . . . . . . . . . . . . . . . . . . . . . . . . . . . . . . . . . . . . . . . . . . . . . . . . . . . . . . . . . . . . . . . . . . . .
18 Prionailurus rubiginosus rusty-spotted cat KR 135744. . . . . . . . . . . . . . . . . . . . . . . . . . . . . . . . . . . . . . . . . . . . . . . . . . . . . . . . . . . . . . . . . . . . . . . . . . . . . . . . . . . . . . . . . . . . . . . . . . . . . . . . . . . . . . . . . . . . . . . . . . . . . . . . . . . . . . . . . . . . . . . . . . . . . . . . . . . . . . . . . . . . . . . . . . . . . . . . . . . . . . . . . . . . . . . . . . . . . . . . . . . . . . . . . . . . . . . . .
19 Prionailurus planiceps flat-headed cat KR 135743. . . . . . . . . . . . . . . . . . . . . . . . . . . . . . . . . . . . . . . . . . . . . . . . . . . . . . . . . . . . . . . . . . . . . . . . . . . . . . . . . . . . . . . . . . . . . . . . . . . . . . . . . . . . . . . . . . . . . . . . . . . . . . . . . . . . . . . . . . . . . . . . . . . . . . . . . . . . . . . . . . . . . . . . . . . . . . . . . . . . . . . . . . . . . . . . . . . . . . . . . . . . . . . . . . . . . . . . .
20 Catopuma temminckii Asian golden cat KR 135745. . . . . . . . . . . . . . . . . . . . . . . . . . . . . . . . . . . . . . . . . . . . . . . . . . . . . . . . . . . . . . . . . . . . . . . . . . . . . . . . . . . . . . . . . . . . . . . . . . . . . . . . . . . . . . . . . . . . . . . . . . . . . . . . . . . . . . . . . . . . . . . . . . . . . . . . . . . . . . . . . . . . . . . . . . . . . . . . . . . . . . . . . . . . . . . . . . . . . . . . . . . . . . . . . . . . . . . . .
21 Catopuma badia bay cat KR 135746. . . . . . . . . . . . . . . . . . . . . . . . . . . . . . . . . . . . . . . . . . . . . . . . . . . . . . . . . . . . . . . . . . . . . . . . . . . . . . . . . . . . . . . . . . . . . . . . . . . . . . . . . . . . . . . . . . . . . . . . . . . . . . . . . . . . . . . . . . . . . . . . . . . . . . . . . . . . . . . . . . . . . . . . . . . . . . . . . . . . . . . . . . . . . . . . . . . . . . . . . . . . . . . . . . . . . . . . .
22 Pardofelis marmorata marbled cat KT 288227. . . . . . . . . . . . . . . . . . . . . . . . . . . . . . . . . . . . . . . . . . . . . . . . . . . . . . . . . . . . . . . . . . . . . . . . . . . . . . . . . . . . . . . . . . . . . . . . . . . . . . . . . . . . . . . . . . . . . . . . . . . . . . . . . . . . . . . . . . . . . . . . . . . . . . . . . . . . . . . . . . . . . . . . . . . . . . . . . . . . . . . . . . . . . . . . . . . . . . . . . . . . . . . . . . . . . . . . .
using Network 4.6.1.3 [31]. The MJ-network is based on 40 Asian golden cat mitogenome sequences(without d-loop; 15 460 bp).
Diversity indices for the combined Asian golden cat samples were calculated in DnaSP 5.10.01 [32],including nucleotide (π ) and haplotype (h) diversity, as well as transition–transversion ratios. To checkfor patterns of genetic variation in geographically separated populations, we divided the Asian goldencat dataset into four geographical subsets—India, Indochina, China (including Tibet) and Sumatra.These do not correspond to the currently recognized subspecies, as these are poorly defined and partlyeven overlap (see above), but instead correspond to zoogeographical regions of mammals in southeastAsia [33]. Two samples were excluded from this analysis: the single sample from Peninsular Malaysia,because of the geographical separation of Peninsular Malaysia and Sumatra at the Strait of Malaccasince the LGM, and zoo sample CTE 2808, because its geographical origin was unknown. Pairwise FSTvalues among the four Asian golden cat subsets were calculated using the algorithm implemented inARLEQUIN 3.5 [34], significance was tested by 1000 permutations. Geographical distances betweenthe four sample subsets were calculated using a least-cost-path (LCP) analysis applied within an LGMhabitat suitability model for the Asian golden cat (see below). The LCP analysis was conducted in R(library gdistance [35]). To test if the distribution of genetic variation in Asian golden cats followed anisolation-by-distance (IBD) pattern, we applied a Mantel test implemented in R (v. 3.2.0 [36] packageade4 [37]) and plotted genetic distances as Fst/1-Fst values [38] against geographical distances using Rpackage ggplot2 [39].
2.6. Estimating divergence timesThe dataset used to estimate the time to the most recent common ancestor (TMRCA) of the genusCatopuma included all 22 Felidae mitogenomes available in NCBI (table 2). The divergence time of the
on May 22, 2017http://rsos.royalsocietypublishing.org/Downloaded from

6
rsos.royalsocietypublishing.orgR.Soc.opensci.3:160350
................................................Felidae family (10.78 million years (Myr); CI: 8.38–14.45 Myr; [40] was set as calibration point. For treereconstruction, we applied both a normal distribution prior with a Yule type speciation model and theHKY + I + G substitution rate model. Four independent analyses were conducted, using MCMC lengthsof 100 million generations, logging every 3000th generation. All runs were evaluated in Tracer v. 1.6 forESS > 200. LogCombiner v. 1.8.1 was then used to combine tree logs from the independent runs. The finaltree log was used to resolve the phylogenetic tree, which was visualized in FigTree v. 1.4.2. (http://tree.bio.ed.ac.uk/software/figtree/). The obtained TMRCA estimate of Prionailurus clade (3.71 Myr (CI95%:2.36–5.04 Myr)), puma lineage (4.99 Myr (CI95%: 3.16–6.70 Myr)), lynx lineage (3.91 Myr (CI95%: 2.51–5.35 Myr)) and Pantherinae subfamily (5.54 Myr (CI95%: 3.59–7.57 Myr)) were similar to the ones reportedin a previous study [15]. Hence, we used the TMRCA estimate of Catopuma (3.44 Myr (CI: 2.5–4.5 Myr)) toinfer divergence times at internal nodes. As the dataset included interspecies data (Asian golden cat andbay cat sequences) we applied a multi-species coalescent tree model in *BEAST with the HKY + I + Gsubstitution rate model. Four independent runs were conducted as described above.
2.7. Demographic analysisTo reconstruct the demographic history of the Asian golden cat, we used the TMRCA derived fromthe analysis conducted for the Catopuma genus (see above) with lognormal distribution as prior todetermine root model height. Coalescent extended Bayesian skyline (EBSP) was selected as tree prioras this analysis concerned intraspecific variation. Analyses were conducted with MCMC lengths of30 million generations, logging every 1000th generation in BEAST v. 1.8. Each run was evaluated forESS > 200 in Tracer v. 1.6. Results were plotted as skyline plots using R package ggplots2.
2.8. Projection of Pleistocene Asian golden cat and bay cat distributionsWe used the approach described in [10] to project the Pleistocene distribution of the Asian golden catand the bay cat. Current distribution ranges were taken from the IUCN/SSC Red List of ThreatenedSpecies. As a study area, we used the region between 87° E and 131° E longitude and between of 34° Nand 12° S latitude, to ensure that the species distribution modelling is linked to the climatic conditionsin South and Southeast Asia. We randomly selected 10% of the rasterized distribution ranges for theAsian golden cat (8302 occurrences) and for the bay cat (1261 occurrences) to serve as occurrences formodel-fitting procedures, and then pseudo absences (n = 8310 for Asian golden cat, n = 1270 for baycat) were sampled from the whole remaining study area. To avoid multicollinearity, only environmentalpredictors with −0.7 < r < 0.7 (Pearson’s correlation) were retained for model building, resulting in threepredictors for the Asian golden cat (‘min. temperature of coldest month’, ‘temperature annual range’,‘precipitation of wettest quarter’) and four predictors for the bay cat (‘max. temperature of warmestmonth’, ‘temperature annual range’, ‘precipitation of driest month’, ‘precipitation of wettest quarter’).We then built an ensemble model by taking the mean of the probabilities predicted by 18 models:three random presences sets fitted with the two algorithms (MAXENT and GBM) and with three cross-validation runs. All statistical analyses and shape file and raster manipulations were carried out using Rpackages maptools [41], rgdal [42] and raster [43].
2.9. Pelage colorationIn total we analysed the pelage colour variation data of 83 Asian golden cat individuals (52 museumspecimens, 30 camera-trap photographs and 1 zoo sample with known origin) and 19 bay cat individuals(photographs of 8 museum specimens, 9 camera-trap photographs and 2 published accounts; [44,45]).To compare pelage variation within the Asian golden cat populations from different geographicalorigins, we used the geographical sample subsets created above—India, China (including Tibet),Indochina and Sumatra, and added a fifth one: Peninsular Malaysia—to estimate geographical coatcolour frequencies (figure 1). We defined four coat colours—blotched, black or grey, red, and brownto divide samples into their corresponding colour or pattern (see electronic supplementary material,figure S2). The obtained frequencies were used to calculate a matrix of coat colour distances betweenthe geographical regions. We then employed a Mantel test implemented in R to test whether thecoat colour distances between the geographical regions correlated with the LCP distance (see above).Based on these distance matrices, we also calculated a cluster dendrogram using the R packagedendextend [46].
on May 22, 2017http://rsos.royalsocietypublishing.org/Downloaded from

7
rsos.royalsocietypublishing.orgR.Soc.opensci.3:160350
................................................
least-cost-path distance
0 2 × 10⁶ 4 × 10⁶ 6 × 10⁶
0 2 × 10⁶ 4 × 10⁶ 6 × 10⁶
Sumatra Sumatra
Malaysia Malaysia
Indochina Indochina
China
China
India
India
leas
t-co
st-p
ath
dist
ance
coat
col
our
freq
uenc
y di
stan
ce
coat
col
our
freq
uenc
y di
stan
ce
time (Myr)
fem
ale
effe
ctiv
epo
pula
tion
size
(N
e)104
0.025 0.050 0.075 0.1000
105
106
2
4
6
4
2
6
FST
/(1-
FST
)
(b)(a)
(c) (d )
Figure 2. Population demographic analysis, isolation-by-distance analysis using genetic data, coat colour frequency and least-cost-path(geographical distance) data for the Asian golden cat population; (a) Extended Bayesian Skyline Plot for the Asian golden cat population;x-axis displays times in million years, y-axis displays effective population size Ne in log scale where Ne /τ (τ = 6.5 years× 106).(b) Graph represents correlation between Slatkin’s distance (FST/1-FST) and least-cost-path distance among geographical populations;(c) dendrogram comparison between coat colour frequency and least-cost-path distance; (d) graph represents correlation between coatcolour and least-cost-path distance between geographical populations.
3. ResultsWe obtained mitogenomes (16 471 bp) for 3 bay cats and 40 Asian golden cats with a minimum coverageof 5×. Each position with coverage less than 5× was replaced with N (approx. 1–2% of all positionsper sample) before phylogenetic and phylogeographical analyses. These mitogenome sequences weretranslated into protein sequences to verify the alignment based on coding frames. We also compared oursequences with the complete mitogenome of the Asian golden cat stored in the NCBI database (AccessionID KP202267) to confirm their mitochondrial origin. All mitogenomes represented individual haplotypes,indicating maternal unrelatedness of all samples. In total 787 fixed mutations separated the bay cat andthe Asian golden cat mitogenomes, and among the 3 bay cat and 40 Asian golden cat mitogenomeswe found 33 and 224 variable positions, respectively. The MJ-haplotype network for mitogenomes(electronic supplementary material, figure S1) showed a minimum of 44 mutations between haplotypesfrom Indochina (haplotypes H16–H40) and Sumatra (H3–H14), a minimum of 27 mutations betweenIndochina and Peninsular Malaysia (H15) and a minimum of 19 mutations between haplotypes fromPeninsular Malaysia and Sumatra. It is also noteworthy that the two samples from Sikkim (H1, H2) wereseparated from all other haplotypes by at least 41 mutations. Nucleotide diversity among Asian goldencat mitogenomes was π = 0.003 (s.d. = 0.0023). We found a moderate, yet not significant, correlationbetween genetic distances among geographical subsets and their geographical distances (r2 = 0.70731,p = 0.1238; figure 2b).
3.1. PhylogeographyFor the Asian golden cat dataset, trees obtained by ML (maximum-likelihood) and BI (Bayesianinference) were concordant in their topologies (figure 3). Sumatran haplotypes (SU; figure 3) formeda monophyletic clade. Indian (Sikkim, SIK) haplotypes and Chinese haplotypes from Fukien (FU)also formed distinct monophyletic groups. The other samples from China (Yunnan, YUN; Tibet,TIB; Sichuan, SIC) as well as those from Thailand (TH) were paraphyletic; individuals fromthe same provinces were found in different clades. This indicates some recent gene flow within
on May 22, 2017http://rsos.royalsocietypublishing.org/Downloaded from

8
rsos.royalsocietypublishing.orgR.Soc.opensci.3:160350
................................................
0.05Catopuma badia
0.005
China (CH, TIB, YUN, SIC, FU)Indochina (TH, VI) Sikkim, India (SIK) Peninsular Malaysia (MA)Sumatra (SU)
92/1 CTE12_SU
CTE10_SUCTE8_SU
CTE9_SUCTE14_SU
CTE13_SUCTE11_SU
CTE5_SUCTE3_SU
CTE4_SUCTE15_MA
CTE30_FUCTE32_FU
CTE33_FUCTE31_FU
CTE23_TIB
CTE2_SIK
CTE20_SICCTE22_SIC
CTE26_TIB
CTE24_SICCTE36_THCTE27_TIB
CTE28_TIBCTE35_TH
CTE38_TH
CTE34_THCTE29_FU
CTE25_TIBCTE18_CH
CTE37_THCTE16_YUN
CTE39_ZOOCTE19_CH
CTE40_VI
CTE1_SIK
CTE21_SICCTE17_YUN
CTE7_SUCTE6_SU83/1
83/0.9985/0.99
92/1
87/187/1
92/0.97
97/0.9690/*
87/*
100/199/1
99/1
84/1
82/*
96/191/1
Figure 3. Maximum-likelihood phylogenetic tree derived from Asian golden cat mitogenomes using the bay cat (Catopuma badia)as outgroup. The Bayesian phylogenetic tree provided identical topologies. Support values for nodes were obtained from ML analysis(RaXML) and Bayesian inference (MrBayes). Only values greater than 80% (RaXML) and greater than 0.9 (posterior probability valuesfor Bayesian trees) are shown. Smaller values are denoted with asterisk. Haplotypes and their origins are listed separately (electronicsupplementary material, S1).
China but also between China and Indochina as Chinese samples were not clearly distinct fromIndochinese samples.
3.2. Molecular datingAs there were no Catopuma fossils available for age calibration, we used the divergence time of the familyFelidae [40] and calculated a molecular rate of 0.0133 substitutions per site per Myr (s.d. = 0.00288) using22 mitogenomes of felids (table 2; electronic supplementary material, figure S3). Based on this rate andthe number of differences, we estimated a divergence time between Asian golden cat and bay cat ofapproximately 3.16 Myr (CI95% = 2.05–4.54 Myr) (table 3 and figure 4). This is slightly more recent thanwhat we had used from Felidae mitogenomes (3.44 Myr (CI: 2.5–4.5 Myr)) though it still falls in theCI95% range of the splitting time reported in a previous study [15]. Based on this date, we estimated theintraspecific divergence time for the Asian golden cat clades to be approximately 112 kyr (CI95% = 77–151 kyr) (figure 4). The Bayesian skyline plot revealed a very recent population expansion for the Asiangolden cat (figure 2a).
3.3. Projection of Pleistocene Asian golden cat and bay cat distributionsHabitat distribution modelling (figure 5a–e) indicated that large parts of Southern China containedsuitable habitat for the Asian golden cat throughout the Late Pleistocene. In particular, during the LGM,most parts of the exposed Sunda Shelf were habitable, including Sumatra and Peninsular Malaysia.However, areas on Borneo, in particular in northeastern Borneo, were only marginally suitable as habitat.Although the area of suitable habitats in the Sunda Shelf receded with increasing temperatures and risingsea levels at the beginning of the Holocene, large areas in Peninsular Malaysia and Sumatra remainedsuitable for the Asian golden cat.
By contrast, projections for the bay cat (figure 5f–j) suggested that this species was probably confinedto Borneo throughout the Late Pleistocene. Its range was particularly restricted during the LGM, despitethe greater available Sunda land masses.
on May 22, 2017http://rsos.royalsocietypublishing.org/Downloaded from

9
rsos.royalsocietypublishing.orgR.Soc.opensci.3:160350
................................................
3.16
0.125
0.06
CTE
CBA
X
Y
Z
0 0.10 0.05 00.51.01.52.02.53.0
I
II
III
0.062
IV
V
0.11
0.078
0.079
0.062
H29-FU
H7-SU
H31-FUH33-FUH32-FU
H30-FUH1-SIKH2-SIK
H17-YUNH23-TIB
H21-SIC
H36-TIBH24-SICH27-TIBH28-TIB
H38-THH26-TIBH20-SIC
H22-SICH35-TH
H40-VIH37-THH16-YUNH18-CHH39-ZOO
H19-SICH15-MA
H4-SUH3-SUH5-SUH11-SU
H13-SUH14-SUH9-SU
H8-SUH10-SU
H6-SU
H12-SU
H25-TIB
H34-TH
China (CH, TIB, YUN, SIC, FU)Indochina (TH, VI)Sikkim, India (SIK)Peninsular Malaysia (MA)Sumatra (SU)
Figure 4. Divergence time estimates plotted onto a phylogenetic tree reconstructed using BEAST. Left: Catopuma genus-tree showingmolecular dating for the Asian golden cat and the bay cat (CBA: Catopuma badia, CTE: Catopuma temminckii). Right: CTE species treeshowing molecular datings within the Asian golden cat. Only nodes supported with posterior values= 1 are displayed with their age inmillion years (for the genus tree: nodes X, Y, Z; for the species tree nodes I–V). CI95% values for nodes X, Y and Z and nodes I–V are givenelsewhere (table 3).
Table 3. Estimated divergence date with 95% confidence interval (CI95%)and posterior values as a node support (figure 4).
node time in Myr CI95% in Myr posterior value
dating for Catopuma genus. . . . . . . . . . . . . . . . . . . . . . . . . . . . . . . . . . . . . . . . . . . . . . . . . . . . . . . . . . . . . . . . . . . . . . . . . . . . . . . . . . . . . . . . . . . . . . . . . . . . . . . . . . . . . . . . . . . . . . . . . . . . . . . . . . . . . . . . . . . . . . . . . . . . . . . . . . . . . . . . . . . . . . . . . . . . . . . . . . . . . . . . . . . . . . . . . . . . . . . . . . . . . . . . . . . . . . . . .
X 3.167 2.052–4.548 1. . . . . . . . . . . . . . . . . . . . . . . . . . . . . . . . . . . . . . . . . . . . . . . . . . . . . . . . . . . . . . . . . . . . . . . . . . . . . . . . . . . . . . . . . . . . . . . . . . . . . . . . . . . . . . . . . . . . . . . . . . . . . . . . . . . . . . . . . . . . . . . . . . . . . . . . . . . . . . . . . . . . . . . . . . . . . . . . . . . . . . . . . . . . . . . . . . . . . . . . . . . . . . . . . . . . . . . . .
Y 0.125 0.076–0.188 1. . . . . . . . . . . . . . . . . . . . . . . . . . . . . . . . . . . . . . . . . . . . . . . . . . . . . . . . . . . . . . . . . . . . . . . . . . . . . . . . . . . . . . . . . . . . . . . . . . . . . . . . . . . . . . . . . . . . . . . . . . . . . . . . . . . . . . . . . . . . . . . . . . . . . . . . . . . . . . . . . . . . . . . . . . . . . . . . . . . . . . . . . . . . . . . . . . . . . . . . . . . . . . . . . . . . . . . . .
Z 0.066 0.0367–0.104 1. . . . . . . . . . . . . . . . . . . . . . . . . . . . . . . . . . . . . . . . . . . . . . . . . . . . . . . . . . . . . . . . . . . . . . . . . . . . . . . . . . . . . . . . . . . . . . . . . . . . . . . . . . . . . . . . . . . . . . . . . . . . . . . . . . . . . . . . . . . . . . . . . . . . . . . . . . . . . . . . . . . . . . . . . . . . . . . . . . . . . . . . . . . . . . . . . . . . . . . . . . . . . . . . . . . . . . . . .
dating for the Asian golden cat internal nodes. . . . . . . . . . . . . . . . . . . . . . . . . . . . . . . . . . . . . . . . . . . . . . . . . . . . . . . . . . . . . . . . . . . . . . . . . . . . . . . . . . . . . . . . . . . . . . . . . . . . . . . . . . . . . . . . . . . . . . . . . . . . . . . . . . . . . . . . . . . . . . . . . . . . . . . . . . . . . . . . . . . . . . . . . . . . . . . . . . . . . . . . . . . . . . . . . . . . . . . . . . . . . . . . . . . . . . . . .
I 0.111 0.077–0.151 1. . . . . . . . . . . . . . . . . . . . . . . . . . . . . . . . . . . . . . . . . . . . . . . . . . . . . . . . . . . . . . . . . . . . . . . . . . . . . . . . . . . . . . . . . . . . . . . . . . . . . . . . . . . . . . . . . . . . . . . . . . . . . . . . . . . . . . . . . . . . . . . . . . . . . . . . . . . . . . . . . . . . . . . . . . . . . . . . . . . . . . . . . . . . . . . . . . . . . . . . . . . . . . . . . . . . . . . . .
II 0.079 0.054–0.112 1. . . . . . . . . . . . . . . . . . . . . . . . . . . . . . . . . . . . . . . . . . . . . . . . . . . . . . . . . . . . . . . . . . . . . . . . . . . . . . . . . . . . . . . . . . . . . . . . . . . . . . . . . . . . . . . . . . . . . . . . . . . . . . . . . . . . . . . . . . . . . . . . . . . . . . . . . . . . . . . . . . . . . . . . . . . . . . . . . . . . . . . . . . . . . . . . . . . . . . . . . . . . . . . . . . . . . . . . .
III 0.078 0.052–0.11 1. . . . . . . . . . . . . . . . . . . . . . . . . . . . . . . . . . . . . . . . . . . . . . . . . . . . . . . . . . . . . . . . . . . . . . . . . . . . . . . . . . . . . . . . . . . . . . . . . . . . . . . . . . . . . . . . . . . . . . . . . . . . . . . . . . . . . . . . . . . . . . . . . . . . . . . . . . . . . . . . . . . . . . . . . . . . . . . . . . . . . . . . . . . . . . . . . . . . . . . . . . . . . . . . . . . . . . . . .
IV 0.062 0.041–0.087 1. . . . . . . . . . . . . . . . . . . . . . . . . . . . . . . . . . . . . . . . . . . . . . . . . . . . . . . . . . . . . . . . . . . . . . . . . . . . . . . . . . . . . . . . . . . . . . . . . . . . . . . . . . . . . . . . . . . . . . . . . . . . . . . . . . . . . . . . . . . . . . . . . . . . . . . . . . . . . . . . . . . . . . . . . . . . . . . . . . . . . . . . . . . . . . . . . . . . . . . . . . . . . . . . . . . . . . . . .
V 0.062 0.04–0.08 1. . . . . . . . . . . . . . . . . . . . . . . . . . . . . . . . . . . . . . . . . . . . . . . . . . . . . . . . . . . . . . . . . . . . . . . . . . . . . . . . . . . . . . . . . . . . . . . . . . . . . . . . . . . . . . . . . . . . . . . . . . . . . . . . . . . . . . . . . . . . . . . . . . . . . . . . . . . . . . . . . . . . . . . . . . . . . . . . . . . . . . . . . . . . . . . . . . . . . . . . . . . . . . . . . . . . . . . . .
3.4. Pelage colorationThe bay cat displayed three different morphs—grey, red and brown (figure 1). Among Asian golden cats,the greatest diversity in coat coloration was observed in China, Tibet, Northeast India and Indochina,with the occurrence of all four recognized morphs: red, brown, spotted and black. By contrast, inPeninsular Malaysia and Sumatra only the red and the brown morphs were observed (figure 1). We founda moderate correlation between coat colour and our LCP distance matrix (r2 = 0.5604, p-value = 0.064;figure 2d). This correlation is supported by the similar topologies in the dendrograms of the two distancematrices (figure 2c).
on May 22, 2017http://rsos.royalsocietypublishing.org/Downloaded from

10
rsos.royalsocietypublishing.orgR.Soc.opensci.3:160350
................................................(a)
(b)
(c)
(d)
(e)
Catopuma temminckii80° E
30° N
20° N
10° N
10° S
80° E 90° E 100° E 110° E 120° E
80° E 90° E 100° E 110° E 120° E
80° E 90° E 100° E 110° E 120° E
80° E 90° E 100° E 110° E 120° E
80° E 90° E 100° E 110° E 120° E
80° E 90° E 100° E 110° E 120° E 80° E 90° E 100° E 110° E 120° E
80° E 90° E 100° E 110° E 120° E
80° E 90° E 100° E 110° E 120° E
80° E 90° E 100° E 110° E 120° E
80° E 90° E 100° E 110° E 120° E
0
30° N
20° N
10° N
10° S
0
30° N
20° N
10° N
10° S
0
30° N
20° N
10° N
10° S
0
30° N
20° N
10° N
10° S
0
30° N
20° N
10° N
10° S
0
30° N
20° N
10° N
10° S
0
30° N
20° N
10° N
10° S
0
30° N
20° N
10° N
10° S
0
30° N
20° N
10° N
10° S
0
0 500 1000 2000km
0 500 1000 2000km
30° N
20° N
10° N
10° S
0
30° N
20° N
10° N
10° S
0
30° N
20° N
10° N
10° S
0
30° N
20° N
10° N
10° S
0
30° N
20° N
10° N
10° S
0
30° N
20° N
10° N
10° S
0
30° N
20° N
10° N
10° S
0
30° N
20° N
10° N
10° S
0
30° N
20° N
10° N
10° S
0
30° N
20° N
10° N
10° S
0
90° E 100° E 110° E 120° E
IUCN distribution range
currently out of range
Mt. TobaYTT thickness (cm)
100
low
highhabitat suitability index
503020
105
10.5
32
low
highhabitat suitability index
Mt. TobaYTT thickness (cm)
10050
3020
105
10.5
32
( f )
(g)
(h)
(i)
( j)
Lat
e Pl
eist
ocen
e (~
120
kya)
To
ba v
olca
no e
rupt
ion
(~70
kya)
L
ast g
laci
al m
axim
um (~
22ky
a)
Mid
Hol
ocen
e (~
6ky
a)cu
rren
t IU
CN
dis
trib
utio
n
Catopuma badia
Figure 5. Projected distribution of the Asian golden cat (a–e) and the bay cat (f–j) along a time axis from 120 kya until present: (a,f ) forthe Late Pleistocene (approx. 120 kya) using the LGM projections; (b,g) the thickness of the Young Toba Tuffs (YTT) was superimposed onthe projection to indicate the severity of impact of the Toba super volcanic eruption approximately 74 kya; (c,h) the Last Glacial Maximum(approx. 22 kya); (d,i) the mid Holocene (approx. 6 kya) and (e,j) the current distribution according to the IUCN Red List of ThreatenedSpecies used for the modelling (hatched pattern), while areas outside of the current distribution were shaded in light blue.
on May 22, 2017http://rsos.royalsocietypublishing.org/Downloaded from

11
rsos.royalsocietypublishing.orgR.Soc.opensci.3:160350
................................................4. Discussion4.1. Evolution history of the bay cat and the Asian golden catThe Asian golden cat and the bay cat are allopatric species of the genus Catopuma. Based on ourmitogenome data, we estimated that Asian golden cat and the bay cat split during the late Plioceneapproximately 3.16 Ma, which is somewhat more recent than had been estimated before [15]. At this time,Borneo was still connected to other parts of the Sunda Shelf and Southeast Asia. During the Late Pliocene,however, the Isthmus of Kra was submerged by high sea levels for an extended period of time [47],geographically dividing mainland Southeast Asia and Sundaland. This Late Pliocene vicariance eventis considered to be one driver of speciation in Southeast Asia, because numerous other species splitduring this time, e.g. rodents [7], Macaca spp. [48,49], masked palm civet [5] and common palm civet [8].In the case of the two Catopuma species, it is conceivable that following the split into the northernIndochinese ( = temminckii) and the southern Sundaic ( = badia) populations, the latter specialized andbecame more adapted to tropical evergreen rainforests, whereas the northern population remaineda more generalistic species due to the higher habitat diversity in Indochina. Subsequently, the twoemerging species responded differently to the changing environmental conditions that prevailed duringthe Late Pliocene and Pleistocene.
During the glacials of the Pleistocene, Sunda Shelf evergreen rainforests became restricted to smallerareas due to a cooler and drier climate, particularly during the LGM [50]. Our species distributionprojections indicated that the bay cat had probably been constrained to the rainforest refugia incentral and northern Borneo (figure 5h) because the more open savannah-like habitats of western andsouthern Borneo [1,3,51] were unsuitable for this specialized forest dwelling species. This rainforestrefugium scenario was also proposed for other Bornean species, such as colobine monkeys [52] andtermites [53]. However, due to the very small sample size (N = 3) and the restricted distributioncoverage of the bay cat samples available for molecular analyses (all were from northeastern Borneo),we could not reconstruct the population history of the species and thus we do not have the molecularmeans to infer potential population size fluctuations, i.e. whether the species had experienced apopulation bottleneck (e.g. during the LGM) and/or underwent a subsequent population size expansion.Therefore, more extensive, ideally Borneo-wide sampling is required to test the hypothesis of an LGMrefugium in the rainforests of northeastern Borneo, as suggested by our species distribution model(figure 5f–j).
In contrast with its sister species, the Asian golden cat could have expanded its distribution rangesouthward to the Sunda Shelf using land bridges that were temporarily available during glacialperiods of the Pleistocene (figure 5a). Given the intraspecific clade split at approximately 112 kya,such a southward movement to Peninsular Malaysia and Sumatra probably took place during LatePleistocene (126–11 kya), and presence of Asian golden cats on Sumatra at that time is supported byLate Pleistocene/Early Holocene fossils from the Lida Ayer cave in West Sumatra [54]. Our moleculardata on population demography favoured a late Pleistocene (approx. 30–25 kya) population expansionof the Asian golden cat on Sumatra (figure 2a). We cannot exclude that Asian golden cats had reachedSumatra much earlier (shortly after the clade split), but the full colonization of Sumatra, evidenced bypopulation expansion, took place much later. This disparity can be explained by local extinction of these‘potential early arriving’ Asian golden cats on Sumatra and Peninsular Malaysia. Such extinction mayhave been the result of maladaption to rapidly changing environmental conditions during the successionof glacials and interglacials in the Late Pleistocene. However, such a scenario is not supported by thecurrent distribution of Asian golden cat, which lives in habitats with diverse environmental conditionsreflecting the large adaptive potential of this species. Instead, it is conceivable that the Toba supervolcanic eruption on Sumatra approximately 74 kya, which has also been linked to the local extinctionof other species (orangutans Pongo spp. [55], clouded leopards [9], tigers [6]), also impacted Asiangolden cat populations (figure 5b). A probable post-Toba expansion of Asian golden cats from southernChina and northern Indochina, areas which were less or not affected by Toba, is also supported by thesample from Peninsular Malaysia, which is the basal-most branch of the Sundaic clade and based onthe network (electronic supplementary material, figure S1) and phylogenetic tree (figure 3) geneticallypositioned between samples from Mainland Indochina and those from Sumatra. Such a scenario—post-Toba population expansion from south China to the Sunda Shelf, accompanied by low nucleotidediversity due to the short evolutionary time frame—has also been reported for tigers [6,56].
While samples from Sumatra formed a monophyletic cluster, samples from different provinces/regions in China and Indochina did not form respective regional clusters in our phylogenetic
on May 22, 2017http://rsos.royalsocietypublishing.org/Downloaded from

12
rsos.royalsocietypublishing.orgR.Soc.opensci.3:160350
................................................reconstructions (figure 3), suggesting past gene flow between these populations. By contrast, samplesfrom Sumatra, Peninsular Malaysia, Sikkim (India) and Fukien (China)—the most southern, mostwestern and most eastern parts of the distribution range—were separated from the other Indochineseand Chinese samples indicating spatial differentiation. The tree-like pattern of the Sumatran samplesin the haplotype network (electronic supplementary material, figure S1) indicated a directional north-to-south expansion of golden cats after a single colonization. However, multiple colonization events onSumatra from Peninsular Malaysia cannot be excluded. To test these scenarios additional samples fromPeninsular Malaysia and from Sumatra with precise locality information would be needed. A haplotyperadiation from a few founders in Central Sumatra would have resulted in a star-like pattern [57] and isthus rather unlikely.
The southward expansion of Asian golden cats is also supported by the pelage data. Southern Chinesepopulations showed the greatest diversity and an almost even proportion of all four colour morphs(figure 1). Frequencies of blotched and melanistic morphs decline towards the Sundaic population,which completely lacked these morphs and was characterized by red and brown golden cat individualsonly. The pronounced morphological diversity of Asian golden cats on the mainland relative to theirSundaic conspecifics may be the result of selection over a long time and can be interpreted as localadaptation to the more diverse habitats [58]: melanistic golden cats mostly occur in temperate subalpineand alpine habitats (elevation up to 5000 m.a.s.l.) in northeast India [13], while spotted golden morphsmostly occur in dry deciduous forests, tropical savannahs, grasslands and occasionally shrublands [16].As the southward population expansion of the Asian golden cats to the Sunda Shelf was accompaniedby an increased frequency of red and brown golden morphs (the subtropical habitats became morehomogeneous), the probability also increased that these high frequency morphs would be the onescolonizing the Sunda Shelf.
For the bay cat, three different coat colours (red, brown and greyish black) have been recordedintermixed from different regions of Borneo. In contrast with the Asiatic golden cat’s coat colour morphs,which are highly contrasting and distinctive, the bay cat’s polymorphism is tonally neutral. Closeexamination of the pelage of the greyish black morphs show an underlying reddish coloration (e.g.FMNH 8378) and we suspect that some individuals may change coloration during their lives as hasbeen recorded for the polymorphic African golden cat, Caracal aurata [59] Given that most of the baycat’s probably mammalian predators and prey have dichromatic vision, this means that these colourvariants are not visually distinct from each other, especially in the low light levels of closed-canopyforests. Therefore, this observation supports the species distribution projections, which suggested thatthe bay cat has probably been restricted to more homogeneous evergreen rainforests during the Plioceneand Pleistocene. By contrast, the brighter Asiatic golden cat morphs could be seen as an adaptation toopen deciduous forests.
4.2. Taxonomy of the Asian golden catSeveral different species and subspecies of Asian golden cat have been described based on differentcolour morphs [17], e.g. Felis tristis for the ocelot-like coat pattern. Thus, we expected the phylogeny(figure 3) to show clades consisting of particular colour morphs, reflecting their putative subspeciesassignments. Although there was a clear reduction of colour morphs towards Peninsular Malaysia andSumatra, the Asian golden cats cannot be assigned to any population based on their coloration (no colourmorph was specific to any particular population). Besides rejecting the colour-morph based classification,we also found an indication that modern Asian golden cats expanded only very recently. Therefore, sucha recent expansion provides poor support for recognizing any subspecies of Asian golden cat and insteadsuggests it should be regarded as being monotypic.
On the other hand, our molecular data showed that both the Indian and the PeninsularMalaysia/Sumatran populations were distinct from all others. We could, however, not distinguish theIndian population from Indochinese or Chinese ones based on occurrence of colour morphs, so that anIndian subspecies is likewise not supported.
As already pointed out, Asian golden cats from Sumatra and their conspecifics from the mainlandformed two well-separated clusters with the sample from Malaysian peninsula in between. A splitbetween the Asian golden cats from Peninsular Malaysia and those from Indochina had alreadybeen suggested in an earlier study [18], and also the absence of certain colour morphs in PeninsularMalaysia and Sumatra supports a distinction of these Asian golden cats from their mainlandrelatives. Considerable body size differences (ACK 2011, unpublished data) between Sunda and
on May 22, 2017http://rsos.royalsocietypublishing.org/Downloaded from

13
rsos.royalsocietypublishing.orgR.Soc.opensci.3:160350
................................................Indochinese/Chinese/Indian Asian golden cats further support the distinction of two subspecies, oneoccurring north of the Isthmus of Kra and the other one south of it:
(1) North of Isthmus of Kra: Catopuma temminckii moormensis, distributed in Indochina (Thailand,Cambodia, Lao and Myanmar), China, Tibet, Nepal and northeast India (Sikkim). Four differentcolour morphs: blotched, black, red and golden brown are recorded throughout the distributionrange.
(2) South of Isthmus of Kra: Catopuma temminckii temminckii, distributed in Peninsular Malaysia andSumatra. Two dominant colour morphs: red and golden brown. So far, no blotched morphs havebeen reported from Sumatra/Peninsular Malaysia. Melanistic black individuals were not in oursample collection but have been seen occasionally [11].
5. ConclusionPhylogenetic analyses of mitogenomes, habitat distribution models and analysis of pelage colour dataof the Asian golden cat and the bay cat presented here helped to elucidate the evolutionary historyof these sister species. We argue that the flooding of the Isthmus of Kra in the Pliocene and subsequentclimate and vegetation variations between Sundaland and Indochina have caused a species split betweenthe bay cat and the Asian golden cat lineages approximately 3.16 Ma. Our data suggest that the baycat became restricted to northern Borneo during the Pleistocene and particular in the LGM, whenevergreen rainforest habitats were confined to that region. As a habitat specialist for the closed evergreenrainforest, the bay cat is thus much more susceptible to extinction than its sister species, the Asian goldencat, a generalist species with a much larger distribution across different habitat types. Although itsrecent population expansion, its low intra-population nucleotide diversity and the cline of variationin pelage colour depict the Asian golden cat as being monotypic, we argue that a recognition oftwo subspecies is warranted based on the presence of two distinct mitogenomic clades, the absenceof certain colour morphs in the Asian golden cats from Peninsular Malaysia and Sumatra, and theconsiderable size differences between Sunda and Indochinese/Chinese/Indian Asian golden cats. Asa conservative approach, we recommend to collapse the 3–5 subspecies and to treat the Asian goldencat as a species with just two subspecies until further evidence (e.g. from Peninsula Malaysia) suggestsotherwise.
Data accessibility. Mitogenome sequences produced in this study are deposited in GenBank under the accessionnumbers for the Asian golden cat KX224490–KX224529 and for the bay cat KX265094–KX265096 (see electronicsupplementary material, S1). Also, mitogenome alignments are submitted at Dryad under: http://dx.doi.org/10.5061/dryad.472b9 [60].Authors’ contributions. R.P.P., J.F. and A.W. designed the study; A.W. and R.P. collected the archival samples; R.P. and L.W.performed the laboratory analysis; R.P., D.W.F. and D.L. analysed the molecular data; H.P., S.K.-S. and V.R. performedthe species distribution modelling; A.C.K., M.D.R., S.W.M. and A.W. collected the pelage data; R.P. analysed the pelagedata; R.P., A.W. and J.F. led the writing and all other authors gave final approval for publication.Competing interests. The authors declare no competing interests.Funding. This work was funded by the Leibniz-Association grant SAW-2013-IZW-2. WWF-Malaysia’s work wassupported by WWF-Netherlands, the U.S. Fish and Wildlife Service, Mohamed bin Zayed Species Conservation Fundand M.D.R. was supported by a WWF-U.S. Kathryn Fuller Science for Nature Fellowship.Acknowledgements. R.P., A.W. and J.F. thank all institutions and persons listed in additional file 1 that supplied thebiological specimens this work is based upon. R.P. thanks Fernando Penaloza and Jürgen Niedballa for help inR scripting and Alexandre Courtiol for statistical advice. John Mathai and Azlan Mohamed provided camera-trapphotos of bay cats.
References1. de Bruyn M et al. 2014 Borneo and Indochina are
major evolutionary hotspots for Southeast AsianBiodiversity. Syst. Biol. 63, 879–906. (doi:10.1093/sysbio/syu047)
2. Voris HK. 2000 Maps of Pleistocene sea levels inSoutheast Asia: Shorelines, river systems and timedurations. J. Biogeogr. 27, 1153–1167. (doi:10.1046/j.1365-2699.2000.00489.x)
3. Cannon CH, Morley RJ, Bush ABG. 2009 The currentrefugial rainforests of Sundaland areunrepresentative of their biogeographic past andhighly vulnerable to disturbance. Proc. Natl Acad.Sci. USA 106, 11 188–11 193. (doi:10.1073/pnas.0809865106)
4. Wurster CM, Bird MI, Bull ID, Creed F, Bryant C,Dungait JAJ, Paz V. 2010 Forest contraction in north
equatorial Southeast Asia during the Last GlacialPeriod. Proc. Natl Acad. Sci. USA 107, 15 508–15 511.(doi:10.1073/pnas.1005507107)
5. Patou ML, Chen J, Cosson L, Andersen DH, Cruaud C,Couloux A, Randi E, Zhang S, Veron G. 2009 Lowgenetic diversity in the masked palm civetPaguma larvata (Viverridae). J. Zool. 278, 218–230.(doi:10.1111/j.1469-7998.2009.00570.x)
on May 22, 2017http://rsos.royalsocietypublishing.org/Downloaded from

14
rsos.royalsocietypublishing.orgR.Soc.opensci.3:160350
................................................6. Wilting A et al. 2015 Planning tiger recovery:
understanding intraspecific variation for effectiveconservation. Sci. Adv. 1, e1400175. (doi:10.1126/sciadv.1400175)
7. Gorog AJ, Sinaga MH, EngstromMD. 2004Vicariance or dispersal? Historical biogeography ofthree Sunda Shelf marine rodents (Maxomys surifer,Leopoldamys sabanus andMaxomys whiteheadi).Biol. J. Linn. Soc. 81, 91–109. (doi:10.1111/j.1095-8312.2004.00281.x)
8. Patou ML, Wilting A, Gaubert P, Esselstyn JA,Cruaud C, Jennings AP, Fickel J, Veron G. 2010Evolutionary history of the Paradoxurus palmcivets—a newmodel for Asian biogeography.J. Biogeogr. 37, 2077–2097. (doi:10.1111/j.1365-2699.2010.02364.x)
9. Wilting A, Christiansen P, Kitchener AC, Kemp YJM,Ambu L, Fickel J. 2011 Geographical variation in andevolutionary history of the Sunda clouded leopard(Neofelis diardi) (Mammalia: Carnivora: Felidae)with the description of a new subspecies fromBorneo.Mol. Phylogenet. Evol. 58, 317–328.(doi:10.1016/j.ympev.2010.11.007)
10. Wilting A, Patel R, Pfestorf H, Kern C, Sultan K. 2016Evolutionary history and conservation significanceof the Javan leopard Panthera pardus melas. J. Zool.299, 239–250. (doi:10.1111/jzo.12348)
11. Martyr DF, team in S. 1997 Important findings by FFIteam in Kerinci Seblat, Sumatra, Indonesia. Oryx 31,80–82.
12. Banks E. 1931 A popular account of the mammals ofBorneo. J. Malayan Branch R. Asiat. Soc. 9, 1–139.
13. Bashir T, Bhattacharya T, Poudyal K, Sathyakumar S.2011 Notable observations on the melanistic Asiaticgolden cat (Pardofelis temminckii) of Sikkim, India.NeBIO 2, 1–4.
14. Pocock RI. 1932 The marbled cat (Pardofelismarmorata) and some other Oriental species, withthe definition of a new genus of the Felidae. Proc.Zool. Soc. Lond. 102, 741–766.(doi:10.1111/j.1096-3642.1932.tb01095.x)
15. Li G, Davis BW, Eizirik E, Murphy WJ. 2016 Pervasivesignals of ancient hybridization in the genomes ofliving cats (Felidae). Genome Res. 26, 1–11.(doi:10.1101/gr.186668.114.4)
16. Jutzeler E, Xie Y, Vogt K. 2010 Asiatic golden cat inChina. Cat News (Special Issue) 5, 40–41.
17. Wozencraft WC. 2005 Order Carnivora. InMammalSpecies of the World: A Taxonomic and GeographicReference, 3rd edn (eds DE Wilson, DM Reeder),p. 542. Baltimore, MD: Johns Hopkins UniversityPress.
18. Luo SJ, Zhang Y, Johnson WE, Miao L, Martelli P,Antunes A, Smith JLD, O’Brien SJ. 2014 SympatricAsian felid phylogeography reveals a majorIndochinese-Sundaic divergence.Mol. Ecol. 23,2072–2092. (doi:10.1111/mec.12716)
19. Fortes GG, Paijmans JL. 2015 Analysis of wholemitogenomes from ancient samples.(https://arxiv.org/abs/1503.05074VI).
20. Paijmans JLA, Fickel J, Courtiol A, Hofreiter M,Förster DW. 2015 Impact of enrichment conditionson cross-species capture of fresh and degradedDNA.Mol. Ecol. Resour. 26, 42–55. (doi:10.1111/1755-0998.12420)
21. Maricic T, Whitten M, Pääbo S. 2010 MultiplexedDNA sequence capture of mitochondrial genomesusing PCR products. PLoS ONE 5, 9–13.(doi:10.1371/journal.pone.0014004)
22. Meyer M, Kircher M. 2010 Illumina sequencinglibrary preparation for highly multiplexed targetcapture and sequencing. Cold Spring Harb. Protoc. 5,pprot25448. (doi:10.1101/pdb.prot5448)
23. Li C, Hofreiter M, Straube N, Corrigan S, Naylor GJP.2013 Capturing protein-coding genes across highlydivergent species. Biotechniques 54, 321–326.(doi:10.2144/000114039)
24. Martin M. 2011 Cutadapt removes adaptersequences from high-throughput sequencing reads.EMBnet. J. 17, 10. (doi:10.14806/ej.17.1.200)
25. Magoč T, Salzberg SL. 2011 FLASH: fast lengthadjustment of short reads to improve genomeassemblies. Bioinformatics 27, 2957–2963.(doi:10.1093/bioinformatics/btr507)
26. Hahn C, Bachmann L, Chevreux B. 2013Reconstructing mitochondrial genomes directlyfrom genomic next-generation sequencingreads—a baiting and iterative mapping approach.Nucleic Acids Res. 41, 1–9. (doi:10.1093/nar/gkt371)
27. Otto TD, Dillon GP, Degrave WS, Berriman M. 2011RATT: Rapid Annotation Transfer Tool. Nucleic AcidsRes. 39, 1–7. (doi:10.1093/nar/gkq1268)
28. Lanfear R, Calcott B, Ho SYW, Guindon S. 2012PartitionFinder: combined selection of partitioningschemes and substitution models for phylogeneticanalyses.Mol. Biol. Evol. 29, 1695–1701.(doi:10.1093/molbev/mss020)
29. Ronquist F, Huelsenbeck J, Teslenko M. 2011 DraftMrBayes version 3.2 manual: tutorials and modelsummaries.
30. Stamatakis A. 2014 RAxML version 8: a tool forphylogenetic analysis and post-analysis of largephylogenies. Bioinformatics 30, 1312–1313.(doi:10.1093/bioinformatics/btu033)
31. Bandelt H, Forster P, Röhl A. 1999 Median-joiningnetworks for inferring intraspecific phylogenies.Mol. Biol. Evol. 16, 37–48. (doi:10.1093/oxfordjournals.molbev.a026036)
32. Librado P, Rozas J. 2009 DnaSP v5: a software forcomprehensive analysis of DNA polymorphism data.Bioinformatics 25, 1451–1452. (doi:10.1093/bioinformatics/btp187)
33. Holt BG et al. 2013 An update of Wallace’sZoogeographic Regions of the World. Science 339,74–78. (doi:10.1126/science.1237471)
34. Excoffier L, Smouse PE, Quattro JM. 1992 Analysis ofmolecular variance inferred frommetric distancesamong DNA haplotypes: application to humanmitochondrial DNA restriction data. Genet. Soc. Am.491, 479–491.
35. Etten AJV. 2015 Package ‘ gdistance ’.36. R Core Development Team. 2015 R: a language and
environment for statistical computing.37. Dray S, Dufour AB. 2007 The ade4 package:
implementing the duality diagram for ecologists.J. Stat. Softw. 22, 1–20. (doi:10.1.1.177.8850)
38. Slatkin M. 1993 Montgomery Slatkin. Evolution 47,264–279. (doi:10.2307/2410134)
39. Wickham H. 2009 ggplot2: elegant graphics for dataanalysis. New York, NY: Springer-Verlag. (http://ggplot2.org)
40. Johnson WE, Eizirik E, Pecon-slattery J, Murphy WJ,Antunes A, Teeling E, Brien SJO. 2006 The LateMiocene radiation of modern Felidae: a geneticassessment. Science 311, 73–77.(doi:10.1126/science.1122277)
41. Bivand R, Lewin-Koh N. 2015 maptools: tools forreading and handling spatial objects.
42. Bivand R, Keitt T, Rowlingson B. 2015 rgdal:bindings for the Geospatial Data AbstractionLibrary.
43. Hijmans R, van Etten J. 2012 raster: geographicanalysis and modeling with raster data.
44. Meijaard E. 2005 Meijaard E, Prakoso BB, Azis A.2005. A new record for the Bornean bay cat. CatNews 43, 23–24.
45. Mohd-Azlan J, Sanderson J. 2007 Geographicdistribution and conservation status of the bay catCatopuma badia, a Bornean endemic. Oryx 41, 1–4.(doi:10.1017/S0030605307000516)
46. Galili T. 2015 dendextend: an R package forvisualizing, adjusting, and comparing trees ofhierarchical clustering. Bioinformatics 31, btv428.(doi:10.1093/bioinformatics/btv428)
47. Woodruff DS. 2003 Neogene marine transgressions,palaeogeography and biogeographic transitions onthe Thai-Malay Peninsula. J. Biogeogr. 30,551–567. (doi:10.1046/j.1365-2699.2003.00846.x)
48. Ziegler T, Abegg C, Meijaard E,Perwitasari-Farajallah D, Walter L, Hodges JK, RoosC. 2007 Molecular phylogeny and evolutionaryhistory of Southeast Asian macaques forming theM-silenus group.Mol. Phylogenet. Evol. 42,807–816. (doi:10.1016/j.ympev.2006.11.015)
49. Liedigk R et al. 2015 Mitogenomic phylogeny of thecommon long-tailed macaque (Macaca fascicularisfascicularis). BMC Genomics 16, 222. (doi:10.1186/s12864-015-1437-0)
50. Meijaard E. 2004 Solving mammalian riddles: areconstruction of the Tertiary and Quaternarydistribution of mammals and theirpalaeoenvironments in island South-East Asia. PhDthesis, Australian National University, Camberra,Australia.
51. Bird MI, Taylor D, Hunt C. 2005 Palaeoenvironmentsof insular Southeast Asia during the Last GlacialPeriod: a savanna corridor in Sundaland?. Quat. Sci.Rev. 24, 2228–2242. (doi:10.1016/j.quascirev.2005.04.004)
52. Brandon-Jones D. 1996 The Asian Colobinae(Mammalia: Cercopithecidae) as indicators ofQuaternary climatic change. Society 59, 327–350.(doi:10.1006/bijl.1996.0068)
53. Gathorne-Hardy FJ, Davies RG, Eggleton P, Jones DT.2002 Quaternary rainforest refugia in south-eastAsia: Using termites (Isoptera) as indicators. Biol. J.Linn. Soc. 75, 453–466. (doi:10.1046/j.1095-8312.2002.00031.x)
54. Vu The L, DeVos J, Ciochon RL. 1996 The fossilmammal fauna of the Lang Trang caves, Vietnam,compared with Southeast Asian fossil and recentmammal faunas: the geographical implications.Bull. Indo-Pacific Prehistory Assoc. 14, 101–109.
55. Nater A et al. 2011 Sex-biased dispersal and volcanicactivities shaped phylogeographic patterns ofextant orangutans (genus: Pongo).Mol. Biol.Evol. 28, 2275–2288. (doi:10.1093/molbev/msr042)
56. Luo S-J et al. 2004 Phylogeography and geneticancestry of tigers (Panthera tigris). PLoS Biol. 2,e442. (doi:10.1371/journal.pbio.0020442)
57. Fickel J, Hauffe HC, Pecchioli E, Soriguer R, Vapa L,Pitra C. 2008 Cladogenesis of the European brownhare (Lepus europaeus Pallas, 1778). Eur. J. Wildl.Res. 54, 495–510. (doi:10.1007/s10344-008-0175-x)
on May 22, 2017http://rsos.royalsocietypublishing.org/Downloaded from

15
rsos.royalsocietypublishing.orgR.Soc.opensci.3:160350
................................................58. Allen WL, Cuthill IC, Scott-Samuel NE, Baddeley R.
2011 Why the leopard got its spots: relating patterndevelopment to ecology in felids. Proc. R. Soc. B278, 1373–1380. (doi:10.1098/rspb.2010.1734)
59. Pocock RI. 1907 Notes upon some African species ofthe genus Felis, based upon specimens recentlyexhibited in the society’s garden. Proc. Zool. Soc.Lond. 77, 656–667. (doi:10.1111/j.1469-7998.1907.tb06950.x)
60. Patel RP et al.. 2016 Two species of Southeast Asiancats in the genus Catopumawith diverginghistories: an island endemic forest specialist and awidespread habitat generalist. Dryad DigitalRepository. (doi:10.5061/dryad.472b9)
on May 22, 2017http://rsos.royalsocietypublishing.org/Downloaded from