PASSION TO SUCCEED Al Hail ORIX Finance PSC (Al Hail) 2002 SK Leasing Kazakhstan (SKL) 2005...
120
ANNUAL REPORT 2015 PASSION TO SUCCEED
Transcript of PASSION TO SUCCEED Al Hail ORIX Finance PSC (Al Hail) 2002 SK Leasing Kazakhstan (SKL) 2005...

ANNUAL REPORT 2015PASSION TO SUCCEED

Over the last decade, ORIX Leasing Pakistan Limited has emerged as the largest leasing Company of Pakistan. This year, we manifest the indomitable spirit and unbridled enthusiasm of our organisation by using the image of a charging horse on the cover of our annual report. To us, this mighty creature underlines the valour and zeal through which we do our business, where no challenge is too unnerving, no goal is too far to reach. It is this progressive insight and solid dedication that has sustained our growth and fuelled our passion to succeed for all time to come.
PASSION TO SUCCEED

CONTENTS
08
32
02
30
49
14
44
10 ORIX Corporation11 Associated Companies12 Corporate Information
40 Statement of Compliance42 Notice of Annual General Meeting
03 Mission04 Strategic Objectives06 Code of Business Ethics
50 Shariah Advisor’s Report 51 Review Report to the Members on the Statement of Compliance 52 Auditors’ Report to the Members 53 Balance Sheet 54 Profit and Loss Account 55 Statement of Comprehensive Income 56 Cash Flow Statement 57 Statement of Changes in Equity 58 Notes to the Financial Statements 110 Pattern of Shareholding 112 Parent & Associated Companies 113 Offices in Pakistan114 Investors Awareness
Form of Proxy
16 Organogram18 Human Resources22 Products Portfolio24 ORIX Certificate of Deposit26 Directors Profile
46 Six Years Vertical Analysis47 Six Years Horizontal Analysis48 Statement of Value Addition
COMPANY PROFILE
REPORT OF THE DIRECTORS
VISION
CHIEF EXECUTIVE REVIEW
FINANCIAL REPORT
THE MANAGEMENT TEAM
SIX YEARS' FINANCIAL SUMMARY
01

ORIX aims to maximize shareholders’ value by drawing on its extensive array of specialized capabilities to continuously provide our customers with value added financial solutions.
VISION
ANNUAL REPORT 2015 / ORIX Leasing Pakistan Limited02

ORIX seeks to progress through its domestic and international presence by constantly anticipating emerging trends and offering innovative products that create real and lasting value for our customers.
ORIX pioneers, introduces and offers value-added products which are not only competitive in terms of desirability and price, but also fulfill the needs of our customers by consistently increasing our value to them as an efficient source of financial services.
ORIX makes every effort to enhance superior professional competencies by creating a culture that fosters openness and innovation, promotes individual growth and rewards performance.
ORIX contributes to society through participation in poverty alleviation programmes, provision of financial assistance at a grassroots level and assistance to charitable causes.
MISSION
03

ANNUAL REPORT 2015 / ORIX Leasing Pakistan Limited04

• To make OLP an iconic brand with strong brand loyalty and maintain its position as an industry leader.
• To develop highest standards of corporate governance, far exceeding those of the Code of Corporate Governance.
• To take on challenges and create opportunities that contribute to society and meet expectations of shareholders.
• To maintain highest credit ratings in the non-banking financial sector of the Country.
• To have the best possible standards of customer services and satisfaction through our well-trained and experienced human resources.
• To be the catalyst in propelling Small and Medium Enterprise (SME) growth and development across Pakistan and remain in close proximity of SME sector.
• To provide maximum security to retail depositors.
• To establish and adopt best practices in risk management, control and monitoring.
• To ensure proper and stringent compliance to all external and internal rules and regulations.
• To bring maximum transparency in all spheres of business by introducing well defined Corporate Governance policies.
• To invest in people and upgrade our staff’s capabilities by investing in their training and development.
• To maximize return to stakeholders consistently by steadily increasing ROE and ROA.
STRATEGIC OBJECTIVES
05

It is vital to the financial success of OLP that we conduct our business in compliance with the rules and regulations laid down by the Company. The code of conduct sets out the fundamental standards to be followed by employees in their everyday actions.
The Company has adopted the following code of conduct principles;
• Avoid any conflict of interest between the Directors / Employees of the Company or its associated undertakings.
• Adhere to the highest standards of ethical business conduct.
• Comply with applicable laws, rules and regulations in letter and spirit.
• Maintain the highest level of confidentiality within and outside OLP.
• Maintain proper and fair relationship with Government bodies, Stakeholders, Customers and Employees.
• Maintain transparent and sound management by providing full disclosure to the public.
• Encourage reporting of unethical conduct / violation.
• Treat employees with dignity and respect.
CODE OF BUSINESS ETHICS
ANNUAL REPORT 2015 / ORIX Leasing Pakistan Limited06

07

ANNUAL REPORT 2015 / ORIX Leasing Pakistan Limited08

OLP is headquartered in Karachi and has 31 branches situated in 30 towns and cities. OLP’s major shareholder is ORIX Corporation of Japan (ORIX) having 49.6% shareholding. Established in 1964, ORIX is one of Japan’s leading integrated financial services groups with operations in 35 countries worldwide. The group has experience of over 50 years of operations and had a total asset base of US$ 95 billion and equity of US$ 19 billion as at March 31, 2015.
OLP offers cost effective value-added financial products and innovative customized services to a wide array of customers throughout the Country. The blend of international experience and local expertise acquired over the last 29 years provides OLP a distinctive competitive edge. OLP takes pride in the fact that it has played a major role in the economic development of the Country by supporting the Small and Medium Enterprises (SME) Sector and in doing so, has created thousands of jobs both directly and indirectly. It has helped grow numerous small businesses into medium sized enterprises. Today, OLP is one of the most prominent Non-Banking Finance Companies in Pakistan with presence across the Country and a large network of individual and corporate customers.
OLP has strategic investments and board representations in five associated overseas joint venture leasing companies. In addition to management support and technical assistance provided by OLP to these associated companies, four overseas associates are headed by Chief Executives on secondment from OLP.
ORIX Leasing Pakistan Limited (“OLP”) was established in July 1986 as a joint venture between ORIX Corporation, Japan and local investors. OLP commenced commercial operations in January 1987 and is listed on all three stock exchanges in Pakistan.
COMPANY PROFILE
09

ORIX CORPORATION, JAPAN - FINANCIAL HIGHLIGHTS March 31, 2015 March 31, 2014
Total Revenues 18,047 13,340
Profit before Income Taxes and Discontinued Operations 2,855 2,777
Total Equity 19,240 20,335
Total Assets 94,982 87,950
ORIX Corporation is one of the largest non-bank financial services groups in Japan, providing innovative value added products and services to both corporate and retail customers. It is listed on both the Tokyo and New York Stock Exchanges, with operations in 35 countries across the world and diversified over a wide range of products.
ORIX has a recorded sustained growth over the last five decades by pursuing new profit earning opportunities through specialized capabilities and broadening operational scope. The Group’s fundamental strength lies in its ability to keep one step ahead of the competition by identifying and developing new business opportunities.
AMMOUNT IN MILLION US$
ORIX CORPORATION
Leasing
Expertise in Handling Tangible Assets
Credit Screening and Finance Capability
Lending
Banking
Investment
Life Insurance
Loan Servicing
Environment/Energy
Investment Banking
Asset Management
Ships/Aircraft
Automobiles
Real Estate
1964 2015
DIVERSE BUSINESS PORTFOLIOORIX, which started as a leasing company, has transcended the conventional boundaries of a leasing enterprise by flexibly expanding its business into neighboring fields. As a result, ORIX now is an incomparable corporate group with a diverse business portfolio.
ANNUAL REPORT 2015 / ORIX Leasing Pakistan Limited10

CompanyOLP’s
Holding %
LCY
Profit for the Year Dec 31, 2014
Total Assets as atDec 31, 2014
Profit for the Half YearJune 30, 2015
LCY in 000 Rs. in 000 LCY in 000 Rs. in 000 LCY in 000 Rs. in 000
OOLC 11.64% RO 4,539 1,193,602 141,906 37,071,382 2,577 680,881
OLE 23.00% LE 9,778 138,373 387,949 5,456,231 4,441 59,249
SOLC 2.50% SR 116,948 3,155,206 2,212,027 59,289,402 58,171 1,576,929
Al Hail 3.00% AED 31,023 856,357 1,025,554 28,083,463 12,863 356,201
SKL 10.00% KZT 175,328 95,507 2,300,890 1,244,183 13,564 7,294
Oman ORIX Leasing Company SAOG (OOLC) 1993
ORIX Leasing Egypt SAE (OLE) 1997
Saudi ORIX Leasing Company (SOLC) 2001
Al Hail ORIX Finance PSC (Al Hail) 2002
SK Leasing Kazakhstan (SKL) 2005
Associate Established
The Company’s international activities started in 1993 with the establishment of a leasing company in Oman. Since then, associates have been established in Egypt, Saudi Arabia, UAE and Kazakhstan. ORIX Leasing Pakistan Limited’s (OLP’s) overseas associates are:
OLP has equity investment and board representation in all its associates. It provides them technical assistance and management support. Overseas associates provide lease financing for equipment and vehicles, focusing mainly on small and medium sized entities (SMEs) spread across a wide range of industries as well as retail clients. Strong emphasis is placed on customer service, prudent operating policies and development of human resources.
OLP’s shareholding in the companies and their financial highlights are summarized below:
ASSOCIATED COMPANIES
11

ANNUAL REPORT 2015 / ORIX Leasing Pakistan Limited12

BOARD OF DIRECTORS
Mr. Kunwar Idris ChairmanMr. Harukazu Yamaguchi Non Executive DirectorMr. Humayun Murad SI Non Executive DirectorMs. Nargis Ghaloo Non Executive DirectorMr. Shahid Usman Independent Non Executive DirectorMr. Shaheen Amin Non Executive DirectorMr. Kazuhito Inoue Non Executive DirectorMr. Teizoon Kisat Executive Director
AUDIT COMMITTEE
Mr. Shahid UsmanChairmanMr. Harukazu YamaguchiMemberMr. Shaheen AminMemberMr. Kazuhito InoueMember
CREDIT COMMITTEE
Mr. Shaheen AminMemberMr. Teizoon KisatMemberMr. Ramon AlfreyMemberMr. Amjad IqbalMember
HUMAN RESOURCE AND REMUNERATION COMMITTEE
Mr. Shaheen AminChairmanMr. Harukazu YamaguchiMemberMr. Kazuhito InoueMemberMr. Teizoon KisatMember
CHIEF FINANCIAL OFFICER
Mr. Ramon Alfrey
COMPANY SECRETARY
Ms. Effat Assad
HEAD OF INTERNAL AUDIT & SECRETARY TO AUDIT COMMITTEE
Ms. Maryam Aziz SHARIAH ADVISOR
Mufti Ibrahim Essa
REGISTERED OFFICE
Islamic Chamber of Commerce Building, Ground Floor, ST-2/A, Block 9, KDA Scheme No.5, Clifton, Karachi-75600 HEAD OFFICE
ORIX Building, Plot No.16, Sector No.24, Korangi Industrial Area, Karachi-74900
CREDIT RATING BY THE PAKISTAN CREDIT RATING AGENCY
Long term entity rating AA+Short term entity rating A1+
BANKS AND LENDING INSTITUTIONS
AlBaraka Bank (Pakistan) Limited Allied Bank LimitedAskari Bank Limited Bank Alfalah Limited Bank Islami Pakistan LimitedECO Trade & Development Bank, Turkey Faysal Bank Limited Habib Bank Limited-Islamic Banking Habib Metropolitan Bank LimitedJS Bank LimitedNIB Bank LimitedPak-Brunei Investment Company LimitedPak China Investment Company LimitedPakistan Poverty Alleviation FundStandard Chartered Bank (Pakistan) Limited
The Bank of PunjabThe Bank of Tokyo - Mitsubishi UFJ, LimitedUnited Bank Limited
AUDITORS
A.F. Ferguson & Company Chartered Accountants State Life Building No. 1-C, I.I Chundrigar Road, P.O Box 4716, Karachi-74000, Pakistan
LEGAL ADVISORS
M/s Mansoor Ahmad Khan & Co. M/s Walker Martineau & Saleem REGISTRAR AND SHARE TRANSFER OFFICE
THK Associates (Private) Limited 2nd Floor, State Life Building No.3 Dr. Ziauddin Ahmed Road, Karachi - 75530
CORPORATE INFORMATION
13

MR. ARSHAD ABBAS Head - Commercial Vehicle Division
THE MANAGEMENTTEAM
MIAN FAISAL RIAZHead - Corporate Lease
MR. IRFAN AHMED General Manager & Branch Controller
MR. TEIZOON KISAT Chief Executive Officer
MR. RAMON ALFREY Chief Financial Officer
MR. AYUB KHAN Head - Special Assets Management
MR. HIRALAL BHARVANI Head - Treasury & Consumer Auto
MR. AMJAD IQBALHead - Credit Division
MS. ASEYA QASIM Head - Micro Finance / Agri Lease
ANNUAL REPORT 2015 / ORIX Leasing Pakistan Limited14

MR. M. ISMAIL KHAN Head - Business Control
MS. EFFAT ASSAD Company Secretary
MR. MOHSIN SIRAJHead - Law Division
MS. IFFAT HINA Head - Human Resource
MR. ASAD ALI SHEIKHHead - Compliance
MS. MARYAM AZIZ Head - Internal Audit & Secretary to Audit Committee
MR. SHAKIR VASI Head - Operating Lease
MR. ABID HAMID Senior Manager, e-Business
MR. M. MOIZUDDIN Head - Information Systems
15

ORGANOGRAM
Note: All the marketing and non-marketing departments are at par in reporting level. The mapping at different levels is due to space constraint and does not in any way, affect their reporting levels in the hierarchy of the Company.
BOARD OFDIRECTORS
CHIEFEXECUTIVE
OFFICER
AUDITCOMMITTEE
HR &REMUNERATIONCOMMITTEE
CREDITCOMMITTEE
INTERNALAUDIT
COMPLIANCE
MANAGEMENTCOMMITTEE
ASSETLIABILITY
COMMITTEERISK
MANAGEMENT
CREDITCONTROL
CORPORATESECRETARIAL
SERVICES
FINANCE &ACCOUNTS
FINANCIALREPORTING
SPECIALASSETS
RECORDING
INFORMATIONSYSTEMS
HUMANRESOURCES
CUSTOMERCARE
BUSINESSDIVISIONS
CORPORATELEASE
CONSUMERAUTO
COMMERCIALVEHCILE
e-BUSINESS
OPERATINGLEASE
BRANCHCONTROL
MICROFINANCE& AGRI LEASE
AGRI
MICROCREDIT
PATTOKICHUNIAN
BATAPUR
BHALWAL
SHADBAGH
KOTABDULMALIK
RENALAKHURDMANGA
MANDI
SAHIWAL
SILLANWALI
SHARAQPUR
TREASURY
SPECIAL ASSETSMANAGEMENT
LAW
BUSINESSCONTROL
ADMINISTRATION
LAHORE
KARACHI
HYDERABAD
SIALKOT
MULTAN
PESHAWAR
ISLAMABAD
FAISALABAD
GUJRANWALAGUJRAT
RAHIM YARKHAN
BAHAWALPUR
ABBOTABAD
RAWALPINDICHAKWAL
MIRPUR
SAHIWAL SARGODHA JHANG
ANNUAL REPORT 2015 / ORIX Leasing Pakistan Limited16

BOARD OFDIRECTORS
CHIEFEXECUTIVE
OFFICER
AUDITCOMMITTEE
HR &REMUNERATIONCOMMITTEE
CREDITCOMMITTEE
INTERNALAUDIT
COMPLIANCE
MANAGEMENTCOMMITTEE
ASSETLIABILITY
COMMITTEERISK
MANAGEMENT
CREDITCONTROL
CORPORATESECRETARIAL
SERVICES
FINANCE &ACCOUNTS
FINANCIALREPORTING
SPECIALASSETS
RECORDING
INFORMATIONSYSTEMS
HUMANRESOURCES
CUSTOMERCARE
BUSINESSDIVISIONS
CORPORATELEASE
CONSUMERAUTO
COMMERCIALVEHCILE
e-BUSINESS
OPERATINGLEASE
BRANCHCONTROL
MICROFINANCE& AGRI LEASE
AGRI
MICROCREDIT
PATTOKICHUNIAN
BATAPUR
BHALWAL
SHADBAGH
KOTABDULMALIK
RENALAKHURDMANGA
MANDI
SAHIWAL
SILLANWALI
SHARAQPUR
TREASURY
SPECIAL ASSETSMANAGEMENT
LAW
BUSINESSCONTROL
ADMINISTRATION
LAHORE
KARACHI
HYDERABAD
SIALKOT
MULTAN
PESHAWAR
ISLAMABAD
FAISALABAD
GUJRANWALAGUJRAT
RAHIM YARKHAN
BAHAWALPUR
ABBOTABAD
RAWALPINDICHAKWAL
MIRPUR
SAHIWAL SARGODHA JHANG
17

FOSTERING TALENT
At OLP, we strive to attract and retain the best talent – our most valuable resource that drives the Company towards enhancing and sustaining performance. OLP is committed towards strengthening its leadership pipeline through developing the capabilities of its existing talent and attracting young and dynamic minds for its future talent pool. To ensure that, OLP not only attracts but also retains the best talent, we aim to nurture people’s careers by making relevant opportunities accessible and help them develop skills, knowledge and experience in different functions or geographies.
BUILDING CAPABILITY In order to fuel best organizational culture OLP practices a philosophy of having a well trained workforce. Customized trainings are being offered to cater to various training needs in the Company by frequently conducting trainings internally as well as by sending employees to external training programs.
In addition, OLP offers extensive overseas opportunities to encourage and retain high potential individuals and enrich their job scope. These assignments help individuals to advance in their careers, explore new business trends, develop multiple skills and broaden their horizons.
PERFORMANCE RECOGNITION & REWARD OLP values its human capital and continuously strives to keep its employees motivated. In order to reward high performing individuals and business units/zones, an annual event is organized where these employees and business units are appropriately recognized for their contribution. This helps a great deal in making employees feel appreciated and also facilitates the achievement of their personal and professional goals.
HUMAN RESOURCES
DISCOVERING TALENTS, PROVIDING OPPORTUNITIES
ANNUAL REPORT 2015 / ORIX Leasing Pakistan Limited18

19
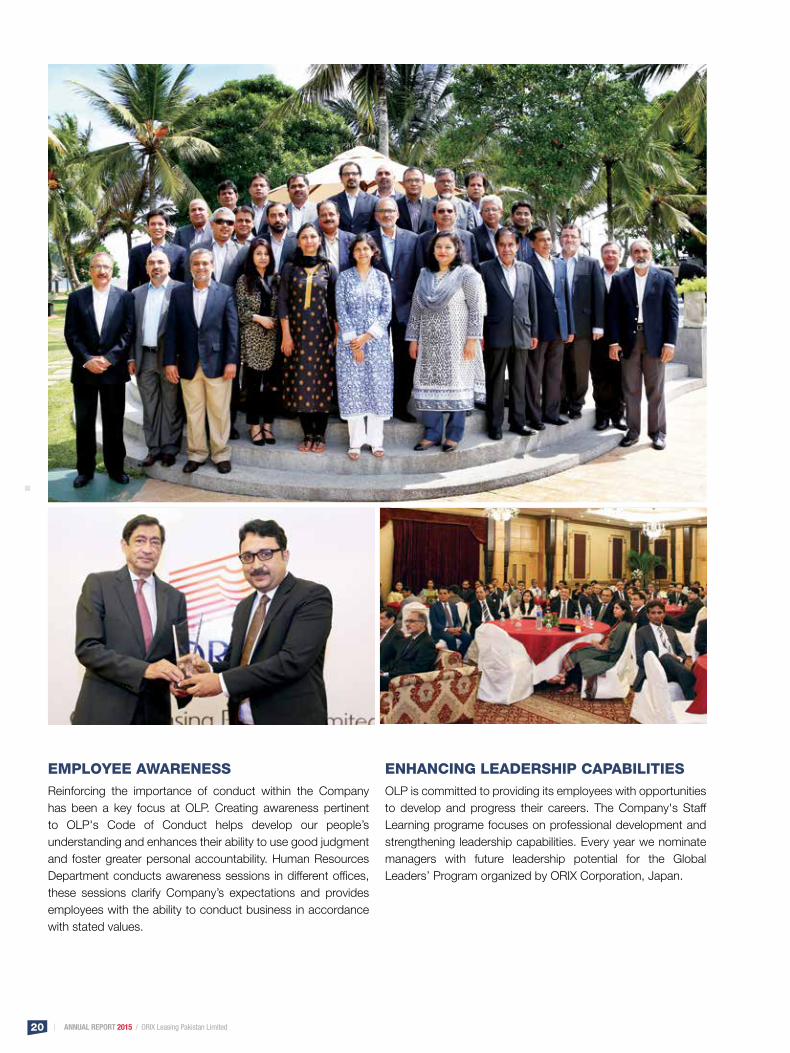
EMPLOYEE AWARENESSReinforcing the importance of conduct within the Company has been a key focus at OLP. Creating awareness pertinent to OLP's Code of Conduct helps develop our people’s understanding and enhances their ability to use good judgment and foster greater personal accountability. Human Resources Department conducts awareness sessions in different offices, these sessions clarify Company’s expectations and provides employees with the ability to conduct business in accordance with stated values.
ENHANCING LEADERSHIP CAPABILITIES OLP is committed to providing its employees with opportunities to develop and progress their careers. The Company's Staff Learning programe focuses on professional development and strengthening leadership capabilities. Every year we nominate managers with future leadership potential for the Global Leaders’ Program organized by ORIX Corporation, Japan.
ANNUAL REPORT 2015 / ORIX Leasing Pakistan Limited20

EXECUTIVE ORIENTATION PROGRAMBusiness Managers from various Zones and Branches are invited to attend orientation programs at the Head Office – Karachi and Regional Office - Lahore. These program are especially designed to provide unique and exclusive learning experience to our executives with the aim of engaging them in strategic networking, giving them an opportunity to learn in highly interactive sessions and gain first hand understanding of various functions performed at the Head Office and Regional Office.
EMPLOYEE ENGAGEMENT INITIATIVESTo keep employees motivated and to give them opportunities to experience activities beyond their daily job responsibilities, Human Resources Department conducts various engagement activities. Annual Award Distribution Ceremony, Annual Lunch, Sports Gala and Eid Get Together are a few of the initiatives that are organized at regular intervals during the year. Staff members are encouraged to support various social causes such as blood donation camps and helping in calamity situations when ever required.
21

OLP Auto Lease offers a flexible product range tailored to suit the specific requirements and financial need of individual customers. Our dedicated professional executives ensure that we not only respond positively to our customer requirements but also provide customized innovative structures to suit the cash flow requirements. Our team of specialists ensure that auto lease customers are provided full range of support services over the entire lease term. Our products are transparent and as easy to understand as road signs.
Walk in to drive your own car – simply and quickly.
A countless number of dreams and aspirations of people stuck at the weak end of prosperity fizzle out due to poverty. An unknown number of promising entrepreneurs lose their way to success and prosperity due to lack of financial resources. We have been endeavoring to change this. We have been helping our compatriots to break free from the shackles of poverty by extending them easy financing to initiate their very own small scale businesses or expand their existing ones. Our micro financing enables them to buy machines/ equipments ranging from sewing machines to rickshaws and/beyond, as well as raw material, live stock or miscellaneous supplies. We are particularly proved our efforts in assisting women entrepreneurs who usually find it more difficult to secure financing.
OLP Commercial Vehicle Division provides integrated financial services in the field of commercial vehicle leasing which include both small and large size commercial vehicles. We provide unique opportunities, innovative value added products and personalized professional services for the logistics and transport industry in Pakistan. We at OLP Commercial Vehicle Division have changed the mindset of customers in the unorganised sector and have worked together for our mutual growth. Our professional executives quickly absorbed the spirit of challenging market and customer behavior and have learned traits that contribute to our continuing leadership. We will continue to expand our ensemble of products and services, so that our loyal & new customers keep coming to OLP for their expanding financial needs.
CORPORATE LEASE
AUTO LEASE
MICRO CREDIT
COMMERCIAL VEHICLE LEASE
PRODUCT PORTFOLIO
Providing a lifeline to business entities in the small & medium enterprises sector and meeting financial requirements of large business corporations, OLP Corporate Lease Division has the ability and capacity to tailor financial products to suit your requirements. Having provided financial solutions to the highest number of customers in the country's leasing sector, Corporate Division still has the same level of commitment and enthusiasm to serve its customers as it had at the time of inception of the Company. Presence in most of the cities in Pakistan, a dedicated team, and customer friendly approach makes it convenient for our patrons to benefit from our financial products to the best of their interest.
ANNUAL REPORT 2015 / ORIX Leasing Pakistan Limited22

Life and business both need power to move on. Our specialized OPERATING LEASE DIVISION ensures your life and business receive uninterrupted power supply by providing the most competitive and reliable power generating packages with a wide range of equipment choices and complete maintenance and operation services. So enjoy and benefit from the comfort and advantage of uninterrupted power for your life and business to move on uninterrupted.
OPERATING LEASE
The e-Business Division brings yet another innovation to the payment services industry of Pakistan. In addition to the conventional POS Terminals that cater to the transaction processing needs of customers using debit, credit, loyalty, discount and prepaid cards of financial institutions, banks, retailers and corporate entities – the ORIX Network now includes NFC (Near Field Communication) enabled POS Terminals popularly known as “tap to pay” – where users can simply tap their NFC tag (card, cell phone, keychain, etc.). With the introduction of this technology, ORIX e-Business Division continues to provide innovative solutions to its clients in line with global trends – empowering them to meet their customer’s expectations.
e-BUSINESS
Our Islamic Finance Division offers Ijarah and Diminishing Musharakah as its core products to the rapidly growing clientele of Shariah compliant financial products. Carefully developed with the sensitivities of the relevant customer segment in mind our Shariah compliant products meet the Islamic financing requirements of our customers to the satisfaction of their heart and soul.
ISLAMIC FINANCE
23

ORIX Leasing Pakistan Limited (OLP) has built strong relationships with its depositors, which is ORIX Cerificate of Deposit (COD) key strength. Our trained team, offering professional advice, backed by strong operations results in an efficient and hassle free investment experience for our customers. OLP has been successful in developing a loyal and satisfied customer base, which is evident from a deposit base of close to Rs. 7.0 billion. Major success factors are the immaculate service standards and strong financial position of the Company.
Service, security and stability are the three pillars of
ORIX COD. Competitive returns, consistent service and
our dedicated team provides investors peace of mind
throughout their investment tenure with OLP.
Another value added service provided to our investors, is
complimentary accidental hospitalization and accidental
life insurance cover for our investors.
ACCIDENTAL HOSPITALIZATION
INSURANCE
ACCIDENTAL LIFE INSURANCE
ORIX CERTIFICATES OF DEPOSIT
• Tenure ranges from 30 days to one year with profit paid monthly or on maturity
• Keep the funds liquid yet get good returns• Encashable after 30 days of investment date without any penalty
• Tenure ranges from 2 to 10 years, profit and principal to be paid on maturity
• Get the benefit of compounding
• Tenure 5 years with profit rates increasing every year• Incremental monthly return to curtail impact of inflation
• Tenure ranges from 1 to 5 Years with semi-annual return• Market based return plus a spread based on tenure
• Tenure ranges from 1 year to 5 years • Get monthly returns to cover your monthly expenses
• Tenure 7 years with profit payments on monthly basis• Product specially designed for senior citizens and widows • Monthly return over a long period of time.
ORIX CODs offer flexible investment options with maturity terms ranging from 30 days to ten years and profit payments can be periodic or accumulated till maturity. Innovation and value addition are regularly made to our deposit schemes to provide our investors best value for their money.
ANNUAL REPORT 2015 / ORIX Leasing Pakistan Limited24

Our AA+ Long term entity rating and A1+ short term entity rating from PACRA is an endorsement of our financial stability
25

DIRECTORS PROFILE
Mr. Idris holds a masters degree in Political Science from the Punjab University and a Diploma in Public Administration from Cambridge University, UK. He joined the Civil Service of Pakistan in 1957 and served in various capacities for 37 years among others as District Magistrate of Karachi, Political Agent in the North-West tribal areas, Transport Secretary, Home Secretary and Chief Secretary of Sindh.
He retired as Secretary, Federal Ministry of Petroleum & Natural Resources. He also served as Chief Executive of Pakistan Automobile Corporation and Bankers Equity.
Mr. Yamaguchi graduated from Hosei University, Japan in 1987 and joined ORIX Corporation in 1990. Mr. Yamaguchi has served in various senior positions within ORIX Corporation, Japan and abroad. Currently he is serving as Executive Vice President, Global Business and Alternative Investment Headquarter in Japan. He also serves as Director on the Boards of other overseas ORIX Group Companies.
MR. KUNWAR IDRISChairman
MR. HARUKAZU YAMAGUCHI Non Executive Director
ANNUAL REPORT 2015 / ORIX Leasing Pakistan Limited26

Mr. Murad is an FCA from the Institute of Chartered Accountants in England and Wales. He carries professional experience of four decades in Pakistan, UK and Middle East, mainly in the financial sector. Mr. Murad joined OLP in 1986 as Deputy Managing Director and took over as Managing Director in 1989, a position he served until December 31, 2010. In 2007 he was awarded Sitara-e-Imtiaz by the Government of Pakistan for services to Pakistan's leasing industry. Mr. Murad is currently serving as CEO of ORIX Corporation's operations in Middle East, North Africa and CIS. He is serving as a Director on the Boards of ORIX Group companies: OLP, OPP (Pvt.) Ltd. and Al Hail ORIX Finance PSC, UAE.
He is also a Director on the Boards of Samba Bank Limited (Pakistan), Pak Oman Asset Management Company Limited and Index Exchange Co. LLC, UAE.
MR. HUMAYUN MURAD SINon Executive Director
Ms. Nargis Ghaloo is presently the Chairperson of State Life Insurance Corporation of Pakistan and is also on the Board of Public & Private Sector Companies as a shareholder's representative. She holds a Master’s Degree in English from University of Sindh in 1981; subsequently she cleared the competitive examination in the year 1982. During her service at leading position on various organizations she participated in prestige courses such as “Negotiation and Dispute Resolution Workshop” Singapore in 1992, “Executive Leadership Development Program” at John F. Kennedy School of Government, Harvard University in 2005, “National Management Course” at National Management College Lahore in 2009, “Public Sector Administration and Financial Management” at Singapore in 2014.
She is an officer of Federal Government in BPS 22, has formerly held positions of Additional Secretary Cabinet Division, Government of Pakistan, DG President Secretariat, Secretary Women Development, Executive Director State Life Insurance Corporation of Pakistan. In addition she had held various administrative assignments in Federal & Provincial Government.
MS. NARGIS GHALOONon Executive Director
27

DIRECTORS PROFILE
Mr. Amin joined OLP in December 1986 and after serving in various capacities was appointed Deputy Managing Director in January, 1992. Mr. Amin was appointed the founding General Manager of Oman ORIX Leasing Company SAOG in 1993 and was appointed the founding General Manager of Saudi ORIX Leasing Company in the year 2000. Mr. Amin has an MBA from Booth School of Business, University of Chicago and an Executive MS in Risk Management from Stern School, New York University.
Mr. Amin also serves on the Board of ORIX Group affiliated companies in MENA
MR. SHAHEEN AMINNon Executive Director
A fellow member of the Institute of Cost & Management Accountants of Pakistan, Mr. Usman has held senior management positions in Pakistan and abroad. He has previously served as Director Operating Information, Port Qasim Authority and SEVP/Deputy General Manager & CFO, Pakistan Kuwait Investment Company. Mr. Usman has held Directorships in a variety of companies i.e. QICT, General Tyre, Pak-Kuwait Takaful Co., Al- Mal Securities Limited. He is currently serving as independent Director on OLP’s Board.
MR. SHAHID USMANIndependent Non Executive Director
ANNUAL REPORT 2015 / ORIX Leasing Pakistan Limited28

A graduate of Waseda University, Mr. Inoue joined ORIX Corporation in 1989 and has served at various senior level positions in ORIX Group Companies in Japan, UK, USA and UAE. Mr. Inoue is currently serving as Deputy Representative, ORIX Corporation, Representative Office in Dubai, UAE. He also holds Directorships in ORIX Group Companies in the Middle East, North Africa and CIS.
Mr. Teizoon Kisat is a fellow member of the Institute of Chartered Accountants of Pakistan. After completing his education and professional training in 1983, he started his career in a premier accounting firm of Pakistan. Mr. Kisat was associated with professional firms of Chartered Accountants for 12 years and joined leasing industry in 1995. He served different leasing companies in Pakistan until 2000 when he joined ORIX Leasing Pakistan Limited (OLP). Mr. Kisat assumed the position of Deputy Managing Director in 2004 and took over as Managing Director and CEO on 1st January, 2011.
The Company under the leadership of Mr. Kisat has grown steadily over last five years. Mr. Kisat is representing OLP on the Board of Oman ORIX Leasing Company SAOG (OOLC), ORIX Leasing Egypt SAE (OLE) and OPP (Private) Limited. He is also member of Audit Committees OF OOLC and OLE.
MR. TEIZOON KISATChief Executive
MR. KAZUHITO INOUENon Executive Director
29

CHIEF EXECUTIVE'S REVIEW
Over the past few years, consistent growth in our business volumes and profits is attributable to the confidence of our stakeholders, support of our customers and an unparalleled understanding and experience in meeting customers’ needs. I am proud to lead a team of dedicated people who have contributed to the Company’s success by their hard work and professionalism.
Our core business of finance and operating lease has not changed and over the years we have accumulated considerable expertise in financing small and medium sized enterprises. We believe that small and medium enterprises have huge potential for contributing to growth of the Country’s economy. The Company is resolutely pursuing a strategy of accelerating business growth in relatively smaller cities. In line with this strategy, our wide network of branches contributed significantly to business volumes that increased by 21% to Rs. 13.4 billion (2014: 11.1billion).
Our investment in finance lease assets is well diversified by assets and sectors. We follow a strategy of balancing risks with rewards and focus on sectors that are more stable. A diversified and comprehensive portfolio enables the Company to earn steady income over the long term.
On the liability side, we have diversified our funding sources and have been careful not to rely on any one source. We maintain a balance between direct and indirect funding of close to 45:55. Our indirect funding sources include 23 banks and financial institutions. Retail deposits have shown a rising trend over the years and closed at Rs. 6.9 billion reflecting confidence of depositors in the Company. Overall, long term funding constitutes over 89% of total funding and mitigates the risk of any mismatch. The Company had a current ratio of 1.35 as at June 30, 2015.
Our business activities involve various elements of risk. We consider the principal risks of our business to be credit risk and market risk although our business is also subject to other risks such as liquidity risk and operational risk which are managed through prudent risk management measures. We follow a system of decentralization for approving credit risk with marketing executives empowered to approve specific credit limits, within stated policy guidelines, according to their seniority and experience. If exposure exceeds the assigned approval limit, it is forwarded to higher authority for approval.
The theme of our annual report this year is “Passion to Succeed”. This reflects our resilience to meet challenges as well as our persistent and focused approach towards meeting long term goals.
ANNUAL REPORT 2015 / ORIX Leasing Pakistan Limited30

In view of stringent risk management policies adopted by the Company, the non performing portfolio has decreased significantly over the years. Going forward, the non performing portfolio is expected to remain low due to high quality of asset portfolio. Further, the Company is well placed to absorb future losses on portfolio, if any, as the provision coverage ratio of overdues over 90 days, without forced sales value, is over 100%.
FINANCIAL STRENGTH
SHAREHOLDER’ EQUITYShareholders’ equity has increased to Rs. 3.4 billion due to steady growth in profits and a balanced policy of dividend distribution and profit retention.
RETURN ON EQUITY (ROE)The Company achieved ROE of 20.90% (2014: 18.53%) which reflects a healthy return on equity due to excellent results achieved during the year.
RETURN ON ASSETS (ROA)The Company’s return on assets of 3.35% (2014: 2.83%) is amongst the highest in the Country’s financial sector. This is due to improved margin on our core product of finance lease and superior quality of our asset portfolio.
LIQUIDITYThe Company’s liquidity position is very strong. In view of our recent performances, financial institutions have shown increasing confidence in the Company and have offered finance facilities at competitive rates. At the time of writing this report, approved credit facilities of over Rs. 4.5 billion were available for future business.
ASSETSThe Assets based increased by 16% due to growth in business. In context of new business disbursements of Rs. 13.4 billion, growth in asset base by Rs. 3.8 billion is measured due to strong recovery efforts and close follow up for timely receipt of installments.
ASSET / LIABILITY MANAGEMENTThe Company has essentially matched maturity of its borrowings and deposits with maturity of its leases. While average tenor of finance lease is for a period of 38 months, new fundings are for periods of 3-5 years.
GOING FORWARDWe will continue to challenge ourselves to achieve greater heights of success as we believe that significant opportunities exist for achieving continued and sustainable growth in future. The announcement of merger of Standard Chartered Leasing Limited with and into OLP and acquisition of 20% stakes in Standard Chartered Modaraba, subject to regulatory and corporate approvals, are part of our strategy to achieve sustainable growth through expansion of our asset base.
On behalf of OLP's team, I extend my heartiest gratitude to the Chairman and Board of Directors of the Company for their foresight and guidance in achieving the results of fiscal year 2015. I also thank Securities and Exchange Commission of Pakistan and other regulatory bodies for their continued support and our shareholders, creditors and customers for their trust and confidence. The people of this Company are our most important asset and I thank my colleagues for their dedicated efforts, hard work and passion to succeed.
TEIZOON KISATChief Executive
I am pleased to report that in fiscal year 2015, the Company achieved its highest ever profit before taxes of Rs. 860 million and highest ever profit after taxes of Rs. 671 million. Earnings per share increased to Rs. 8.18 from Rs. 6.29 last year. As a result, the Directors proposed a cash dividend of 45% compared to 35% in the previous financial year.
31

The Directors of ORIX Leasing Pakistan Limited (OLP / the Company) are pleased to present the Twenty-Ninth Annual Report together with the audited financial statements of the Company for the year ended June 30, 2015.
THE COMPANYOLP was established in 1986 as one of the pioneers of leasing business in Pakistan. The Company is licensed to carry out leasing business as a Non Banking Finance Company (NBFC) under the Non Banking Finance Companies (Establishment and Regulations) Rules 2003 issued by the Securities and Exchange Commission of Pakistan.
OLP’s major shareholder ORIX Corporation (ORIX) established in 1964 is one of Japan’s leading integrated financial services group with operations in 35 countries. The Group had a total asset base of US$ 95.0 billion as at March 31, 2015.
The Company’s core business continues to be leasing (both financial and operating leases) of vehicles, machinery and equipment. While this remains the core business, the Company has added several other products to meet the need of its growing customer base. On the liability side, the Company provides investment opportunities through certificates of deposit.
OLP has played a key role in establishing ORIX joint venture companies in MENA Region and has strategic investments in leasing companies in Oman, Egypt, Saudi Arabia and United Arab Emirates.
FINANCIAL INFORMATIONThe financial results of the Company are summarized below:
2015 2014
Rupees
Profit before taxation 859,903,539 640,100,513
Less: Taxation 189,000,000 123,987,252
Profit after taxation 670,903,539 516,113,261
Earnings per share - basic and diluted 8.18 6.29
Appropriations: Transfer to statutory reserve. 33,545,177 103,100,000
REPORT OF THE DIRECTORS
ANNUAL REPORT 2015 / ORIX Leasing Pakistan Limited32

DIVIDENDThe Directors are pleased to recommend a cash dividend of 45% for the year ended June 30, 2015 (2014: 35%).
OVERVIEW OF THE ECONOMYGDP growth in Fiscal year 2015 at 4.2% was slightly higher than 4.1% in the previous fiscal year. As in past years, the main increase in GDP growth came from the services sector followed by marginal improvement in agriculture sector. Large scale manufacturing recorded lower growth primarily due to electricity and gas shortages.
The balance of payment position continued to improve during fiscal year 2015 as a result of sharp drop in global oil prices and steady growth in overseas workers’ remittances which increased to US$ 18.5 billion from US$ 15.8 billion in previous year. The overall foreign exchange reserves increased to US $ 18.7 billion as of June 30, 2015 (US $ 14.1 billion: June 30, 2014).
Moreover, CPI inflation rate declined from 8.6% in July 2014 to 4.5% in June 2015 largely due to steady reduction in fuel prices.
In view of above positive developments and improvement in macroeconomic indicators, the State Bank of Pakistan (SBP) slashed its policy rate by a cumulative 350 bps during fiscal year 2015. In May 2015, the main policy rate of the SBP was reduced to 6.5%, the lowest in 42 years. Following a cut in policy rate, the benchmark rate for lending to corporate customers i.e. KIBOR has also declined.
Implementation of infrastructure projects planned under the China-Pakistan Economic Corridor and addressing structure issues especially related to energy and security is expected to create favourable economic environment and accelerate GDP growth.
BUSINESS REVIEWOur business activities comprises of various segments including finance lease of machinery, passenger and commercial vehicles to small and medium size companies, partnerships and sole proprietors, passenger cars for individuals, operating lease with maintenance for industries, micro credit based on group model for micro customers and
a point of sales network for processing credit, debit and loyalty cards.
All business segments of the Company performed well and contributed to profitability. Overall lease and loan disbursements recorded an impressive growth of 21% increasing to Rs. 13.4 billion from Rs. 11.1 billion recorded in 2014.
Passenger cars and commercial vehicles continued to be the main leased assets. Contribution of vehicles and machinery/equipment in overall disbursements stood at 74% and 21% respectively. In line with prudent risk management practices, the Company focused on sectoral diversification to minimise credit risk. Highest single sector exposure of 26% was in transport sector which includes oil, goods and passenger transport. This was followed by exposure of 12% in services sector.
Higher business volumes were achieved due to impressive growth in Corporate and Commercial vehicle leases with disbursements increasing by 22%. We have developed specialized skills and expertise in the transport sector resulting in growth and profitability. On the retail front, Consumer auto lease disbursements increased by 13% as we continued our cautious selection of customers despite increased competition from commercial banks.
OLP’s vehicle finance business, which caters to customers requiring luxury vehicles, increased disbursements by 26% while retaining its strong portfolio quality.
New equipment acquisition for operating lease mainly comprising of diesel generators and point of sale equipment amounted to Rs. 140 million (2014: Rs. 352 million). In view of higher cost of gas generators and low demand due to irregular gas supplies present inventory of gas generators was not increased.
The Company effectively leveraged its eleven micro credit branches to expand its business of group based micro credit for micro customers. Although the scale of our micro credit operations is small, this business segment recorded a growth of 30% and disbursed Rs. 651 million (2014: Rs. 503 million) to 21,821 micro customers. Our micro credit branches have been set up close to rural areas to give us easy access to the customer.
FINANCIAL STATEMENTS / REPORT OF THE DIRECTORS
33

Operations in Oman, Egypt, Saudi Arabia and UAE performed well and contributed significantly to the Company’s profit. During the year, the Company subscribed to a rights issue of Saudi ORIX Leasing Company amounting to Rs. 67.4 million and a rights issue of Al Hail ORIX Finance PSC, UAE amounting to Rs. 126.0 million.
In view of uncertainty on repatriation of capital, investment in SK Leasing, Kazakhstan was impaired last year and a dividend received from SK Leasing in the current year was used to reduce the value of the Company’s investment in SK leasing to Nil. Subsequent dividends will be recorded on receipt basis as Kazakhstan is facing challenging economic conditions and its currency has devalued sharply.
Negotiations to dispose of investment in OPP (Private) Limited are continuing as this business is not compatible with our core business.
REVENUESTotal revenues at Rs. 4.21 billion were 10.2% higher than Rs. 3.82 billion earned last year. Finance Lease remains the core business activity accounting for 53.7% of revenues.
Finance Lease Segment: Revenue from Corporate, Commercial vehicle and Consumer auto Leases at Rs. 2.26 billion (2014: Rs.1.97 billion) was 14.7% higher. A larger lease portfolio together with higher disbursements was instrumental in achieving good revenue growth.
Vehicle Finance / Loans / Micro Finance Segments:Mark up income on vehicle finance / loans and Micro Finance was marginally higher at Rs. 461.7 million compared to Rs. 445.5 million in the previous year. The Company concentrated on maintaining quality portfolio in view of increasing competition from banks.
Operating Lease Segment:Generator Rentals:Revenues from fully maintained generators lease segment at Rs 546.2 million (2014: Rs. 578.8 million) recorded marginal drop of 5.6% as the Company restricted its investment in gas generators segment in view of market conditions which saw increase in cost of generators and lower demand due to gas shortage which increased non- utilization of generators.
e-business: E-business segment also showed decline in its revenue by 11.5% to Rs. 236.0 million from Rs. 266.8 million in 2014. The Company’s investment in this segment has not kept pace with technology changes and major capital expenditure will be required in future to avail opportunities emanating from digital banking.
Other Income:Other operating income was recorded at Rs. 310.7 million compared to Rs. 224.2 million in 2014, an increase of 38.6% mainly due to unusual gain of Rs. 75.7 million arising from disposal of investments in closed end funds and shares. Prior year’s capital gains of Rs.68.9 million mainly represent gain on sale of treasury bills. In the current year, the Company held its treasury bills to maturity, hence return on treasury bills is included in interest income on government securities.
ASSOCIATED COMPANIESThe Company’s share in profit of associated companies increased by 23.4% to Rs. 275.1 million (2014: Rs. 223.0 million). Significant increase in earnings were reported by Oman ORIX Rs. 156.1 million (2014: Rs. 124.1 million) and ORIX Leasing Egypt Rs.34.6 million (2014: 19.6 million). Saudi ORIX’s contribution was steady at Rs. 60.8 million (2014: Rs. 58.5 million) whereas Al Hail ORIX was slightly lower at Rs. 23.6 million (2014: Rs. 25.5 million).
FINANCIAL EXPENSESFinancial expenses at Rs. 1.73 billion (2014: Rs. 1.66 billion) were 4.2% higher whereas borrowings increased by 17.3% to Rs. 16.3 billion (2014: Rs. 13.9 billion). The Company benefitted from lower borrowing rates in view of reduction in benchmark rates. Despite reduction in profit / mark up rates, the Company successfully retained customer deposits which increased to Rs. 6.9 billon (2014: 6.3 billion) and replaced its bank credit facilities with new borrowings at lower rates. This was possible due to strong trust and confidence of depositors and banks in the Company.
ADMINISTRATIVE & GENERAL EXPENSESAdministrative and general expenses increased by 10% from Rs. 755.2 million in 2014 to Rs. 831.9 million in 2015. Major increase was in salaries and allowances due to revision in staff salaries and performance bonuses. Increase
REPORT OF THE DIRECTORS (Continued)
ANNUAL REPORT 2015 / ORIX Leasing Pakistan Limited34

in legal and professional charges was mainly on account of fee for due diligence for proposed merger and acquisitions mentioned in Note 50.2.
DIRECT COSTS OF LEASEDirect costs of leases which mainly represent maintenance, insurance and depreciation on operating lease and ‘Ijara’ assets increased to Rs. 621.9 million compared to Rs. 582.3 million in 2014. Major increase was due to depreciation on generators which increased to Rs. 180.9 million compared to Rs. 142.6 million last year. As stated in Note 4.2.1, during the year, the Company revised useful life of gas generators in operating lease and consequently recorded additional depreciation charge of Rs. 15.19 million.
ALLOWANCE FOR POTENTIAL LOSSESThe Company follows a conservative policy of providing for possible future losses. The allowance for potential lease has shown a declining trend over the years in view of improvement in portfolio quality. Accordingly, an amount of Rs. 121.7 million (2014: Rs. 136.9) was provided to further strengthen the provisions. Total provisions at Rs. 1.22 billion (2014: Rs.1.24 billion) cover 100% of the Company’s non performing portfolio exceeding 90 days without accounting for forced sale value of nonperforming assets. All overdue accounts exceeding 90 days are not impaired.
RISK MANAGEMENTRisk is inherent in the borrowers activities but is managed through ongoing identification, measurement and monitoring, subject to risk limits and other controls. Business risks arising out of changes in the environment, technology, industry and political climate are monitored through the Company’s strategic planning process. Other risks are managed under the policy framework set by the Board of Directors which is supervised on an ongoing basis by the Audit and Management Committees. An Asset Liability Committee (ALCO) is in place to implement and monitor compliance with these policies and ensure that risk management techniques are being applied effectively.
The main risks facing the Company are summarized below:
Credit Risk Management:Credit risk refers to the failure of the borrower to fulfill its financial obligations as and when they fall due. The Company manages and controls credit risk by setting limits on the amount of risk it is willing to accept by individual
counterparties, industry concentrations and type of assets, and by monitoring exposures in relation to such limits. Staff members in the marketing function are authorized to approve individual credit transactions within specific limits based on the seniority and experience of the relevant staff member. If the exposure exceeds the specified individual / joint limits, it is approved by credit committee and Board of Directors as applicable.
Adherence to credit policies formulated and approved by the Board of Directors is monitored by a separate Credit Department, which is responsible for overseeing the Company’s credit risk and independently analyzing customers’ creditworthiness. Credit guidelines are continuously reviewed and amended in line with changing business and market dynamics. With its focus on small and medium sized business the Company’s credit risk is diversified over a large number of clients. No single party exposure represents more than 5% of the Company’s Equity.
Liquidity Risk Management:Liquidity risk is the risk that the Company will be unable to meet its financial obligations as they fall due or is unable to access sufficient funding to meet business commitments. Liquidity risk is managed by diversifying funding sources, establishing committed credit lines from financial institutions and maintaining balance between long and short lending and borrowings. A liquidity contingency plan is also in place to ensure the existence of alternative funding strategies. Appropriate levels of liquid securities are also held for compliance with statutory requirements and ensure availability of surplus funds when required. As part of asset-liability management future cash flows are used to measure and monitor liquidity risk.
Market Risk Management:Market risk comprises of interest rate risk and currency risk arising from changes in interest and exchange rates that would affect future cash flows or the fair values of financial instruments.
The Company limits interest rate risk by monitoring changes in market interest rates and by applying a profit margin over incremental costs, which is sufficient to cover rapid fluctuations in rates. As far as practicable, the Company also aims to substantially match the interest rate profile of receivables with financial obligations and keeps the mismatch within acceptable limits.
FINANCIAL STATEMENTS / REPORT OF THE DIRECTORS
35

In order to manage exchange rate risk, currency swaps are used to hedge against the risk of both interest rate and currency fluctuations. As a policy the Company carries no open currency risk.
Operational Risk:As our business has expanded in recent years, the importance of operational risk management has increased as a component of overall risk management. Operational risk refers generally to the risk of loss arising from systems failure, human error, fraud or external events, administrative procedures and day to day operational procedures and any breakdown in these procedures. When controls fail to perform, operational risks can cause damage to reputation, have legal or regulatory implications, or lead to financial loss. The Company cannot expect to eliminate all operational risks, but through a control framework and by monitoring and responding to potential risks, the Company is able to manage the risks and reduce these to an acceptable level. Internal controls have been strengthened considerably and include effective segregation of duties, access rights, authorization and reconciliation procedures and insurance against various risks. Anti-Fraud and Whistle-blowing policies have been put in place. Separate Risk Management and Compliance functions have also been set up to strengthen the process.
Internal Control and Compliance:The Management is responsible for maintaining a sound system of internal controls to ensure efficiency and effectiveness of operations, compliance with legal requirements and reliability of financial reporting. These controls encompass the policies and procedures approved by the Board of Directors. Their effectiveness is verified by an independent Internal Audit Department that reports directly to the Audit Committee. This ensures that existing procedures and policies are reviewed on a constant basis and improved from time to time wherever required. Due consideration is given to the observations made by internal audit, which are promptly reviewed and measures taken by the Board, Audit Committee and Management for rectification and strengthening of internal control system.
In addition, Inter departmental audit, post disbursement credit audit and compliance reviews are carried out to ensure compliance with relevant rules and regulations.
FUNDING AND LIQUIDITYOLP has continued to diversify funding sources over the years to maintain stable access to funding. Main funding sources include borrowings from financial institutions and direct deposits through issue of certificates of deposit.
As at June 30, 2015 the Company had borrowed Rs. 9.3 billion from 23 financial institutions. The certificates of deposit portfolio showed an increase of 9.5% from Rs. 6.3 billion in 2014 to Rs. 6.9 billion in 2015. The percentage of funds raised from financial institutions and retail deposits is adjusted to maintain an optimal funding structure.
The Company has built a sound financial base by matching its long term lending with long term funding and has adequate funding in place to meet its future business requirements.
MERGER AND ACQUISITIONThe Company has entered into an amalgamation agreement and share and certificate purchase agreement with Standard Chartered Bank Pakistan Limited (SCBPL) with respect to merger of Standard Chartered Leasing Limited (SCLL) with and into OLP and acquisition of SCBPL’s 100% stake in Standard Chartered Services of Pakistan Private Limited (SCS) and acquisition of SCBPL’s 20% stakes in Standard Chartered Modaraba (SCM). This stake is held 10% directly and 10% indirectly through SCS.
The proposed merger and acquisition is subject to satisfaction of various conditions including regulatory consents and corporate actions of OLP, SCBPL, SCLL and SCM. CORPORATE GOVERNANCETo develop highest standards of Corporate Governance that exceed the requirement of code of corporate governance, OLP has established sound and transparent corporate governance system. The Board is chaired by a Non-Executive Director and an independent Director is heading the Audit Committee. The Credit Committee appointed by the Board includes a Non Executive Director and three executives who have collective leasing expertise of over 100 years.
The Management Committee comprises of Divisional Heads with vast experience in their relevant fields. In addition, the Management Committee is also involved in making strategies, business planning, and development of new products. Important decisions relating to Investment, business process review, compensation and information technology are taken by Investment committee, Business process review committee, Human resource review panel and Information technology steering committee respectively.
CORPORATE SOCIAL RESPONSIBILITYOLP takes pride in being a responsible corporate which supports various social causes. The Company lends support
REPORT OF THE DIRECTORS (Continued)
ANNUAL REPORT 2015 / ORIX Leasing Pakistan Limited36

to many initiatives aimed at the welfare and betterment of the underprivileged as well as the physically disabled members of society. This year, the Company pledged to financially support a school in a backward area.
Our microfinance business is a key example of our efforts towards social development. With 11 branches located in rural areas, we are providing loans to thousands of low-income individuals on group lending basis using the Grameen Bank model. OLP gives collateral free loans averaging over Rs. 50 million per month to hundreds of customers under our various microfinance products. An innovative step of introducing e-collections for microfinance customers has been taken which will help to improve customer service, provide financial inclusion to the disadvantaged rural masses and help the Company in controlling its administrative costs.
Donations are made every year by the Company in the areas of health, education and poverty alleviation.
ENERGY CONSERVATION MEASURESAs a responsible corporate citizen, OLP is cognizant of the energy shortage that the Country is facing and has taken steps to conserve energy. These include use of energy savers and LED lights in the office building. Besides, the Company has also converted two branches to solar power. In addition, OLP is also providing leasing of solar equipment in the Punjab province where shortage of power is more acute.
PEOPLEThe Board recognizes human resource as its strongest and most valuable asset and places on record its appreciation for the contribution made by employees during the year under review. The Board acknowledges that dedication of staff has been instrumental in achieving the Company’s growth and high performance levels.
Our Human Resources Division helps in developing employees’ careers by arranging in-house as well as external training and development programmes covering both soft and technical skills for employees at all levels. To carry out in-house training sessions, we have established learning centers equipped with training tools.
During the year, staff spent over 4,160 hours in training and development activities. Senior executives also participated in exposure visits arranged by ORIX Corporation, Japan under their future leadership program.
BUSINESS ETHICSOLP’s Code of Conduct provides a clear framework within which employees of the Company are expected to conduct themselves. The Code is designed to ensure adherence to the highest standards of ethical business conduct and compliance with governmental laws, rules and regulations. It requires employees to work proficiently in all business activities, maintain the highest level of confidentiality within and outside OLP and exercise fairness, equity and courtesy in dealing with all customers, employees and other stakeholders.
OLP’s Code of Conduct provides guidance for dealing with ethical issues, and direction on how to report on unethical conduct. Every employee of the Company has a responsibility to understand and comply fully with the Code and all other policies of the Company. The employees must perform their duties according to the spirit of this Code.
CUSTOMER SERVICEService excellence is what gives OLP an edge over its competitors. A well established after sales system is the major reason given by our customers for maintaining their long standing relationship with the Company. Our excellent service standards based on rapid response and quick turnaround have been acknowledged by our customers whether in Finance Lease, Auto financing or retail deposits.
AWARDS AND RECOGNITIONThe Federation of Pakistan Chamber of Commerce & Industry (FPCCI) awarded FPCCI achievement award to the Company for its performance in the Banking, Leasing and Financial Services Sector for the year 2013.
The NBFI and Modaraba Association of Pakistan recognized the performance and contribution of the Company in NBFI sector by awarding the Company second prize in the Best Performance Award category for the year 2013-14.
FINANCIAL STATEMENTS / REPORT OF THE DIRECTORS
37

FUTURE OUTLOOKThe Company will continue to focus on providing credit to small and medium sized enterprises. Strong demand for leasing is expected in future in the backdrop of investment in infrastructure, power generation and capital expenditure in the private sector. The coverage for providing financial services will be extended to more cities and towns where access to credit is limited. With highly experienced team, OLP is fully geared to take advantage of new business opportunities.
As explained in this report, the Board of Directors has approved merger of Standard Chartered Leasing Limited with and into OLP and acquisition of Standard Chartered Bank Pakistan Limited’s 20% stake in Standard Chartered Modaraba. The completion of above transaction is subject to regulatory and corporate level approvals. Successful completion of above transaction will provide the Company an opportunity to enter new markets for accelerating its growth.
DIRECTORS’ DECLARATION1. The financial statements prepared by the management
of ORIX Leasing Pakistan Limited present fairly its state of affairs, the results of its operations, cash flows and changes in equity.
2. Proper books of accounts of the Company have been maintained.
3. Appropriate accounting policies have been consistently applied in preparation of financial statements and accounting estimates are based on reasonable and prudent judgment.
4. International Accounting Standards as applicable in Pakistan have been followed in preparation of financial statements and any departure has been adequately disclosed.
5. The system of internal control is sound in design and has been effectively implemented and monitored.
6. There are no significant doubts upon the Company’s ability to continue as a going concern.
7. Details of significant deviations in the Company’s operating results during the year ended June 30, 2015 are stated in the Directors’ Report.
8. Key operating and financial data for the last six years in summarized form is given at page No. 44.
9. The value of investments of the recognised provident fund as at June 30, 2015 was Rs. 367.7 million (un-audited) and as at June 30, 2014 was Rs. 297.0 million
BOARD OF DIRECTORS MEETING
Name of Director Meetings Attended
Mr. Kunwar Idris 2
Mr. Harukazu Yamaguchi (Non Resident) 1Mr. Humayun Murad (Non Resident) 4
* Ms. Nargis Ghaloo 1
Mr. Shahid Usman 4
Mr. Shaheen Amin (Non Resident) 4
Mr. Kazuhito Inoue (Non Resident) 3
Mr. Teizoon Kisat 4
** Mr. M. Raeesuddin Paracha 2
* Appointed on November 11, 2014** Resigned on November 11, 2014
Leave of absence was granted to Directors who could not attend the Board meetings
REPORT OF THE DIRECTORS (Continued)
(audited). The value of investments of the Company’s recognised gratuity fund as at June 30, 2015 was Rs. 160.2 million (un-audited) and as at June 30, 2014 was Rs. 131.3 million (audited).
10. No trading in shares of the Company was carried out by the Directors, Executives and their spouses and minor children during the year.
11. A Director acquired certification of Director Education awarded by the Pakistan Institute of Corporate Governance. At the close of the financial year, 5 out of 8 Directors meet the requirements of the Code of Corporate Governance with respect to Directors training and the remaining Directors will complete the required training in the time allowed by the Code.
12. During the year four meetings of the Board of Directors, five meetings of the Audit Committee and two meetings of Human Resource and Remuneration Committee were held. The Directors, who were unable to attend the meetings, constantly followed the progress of the Company and proceedings of the Board.
ANNUAL REPORT 2015 / ORIX Leasing Pakistan Limited38

AUDIT COMMITTEE MEETINGS
HUMAN RESOURCE AND REMUNERATION COMMITTEE MEETINGS
Name of Director Meetings Attended
Mr. Shaheen Amin (Non Resident) 2
Mr. Harukazu Yamaguchi (Non Resident) 1Mr. Kazuhito Inoue (Non Resident) 2Mr. Teizoon Kisat 2
Name of Director Meetings Attended
Mr. Shahid Usman 5
* Mr. Harukazu Yamaguchi (Non Resident) -
Mr. Shaheen Amin (Non Resident) 5
Mr. Kazuhito Inoue (Non Resident) 4
** Mr. Humayun Murad 3
* Appointed on February 23, 2015** Resigned on February 23, 2015
BOARD CHANGESMr. M. Raeesuddin Paracha, resigned as Director and Ms. Nargis Ghaloo was appointed to fill in the Casual vacancy on November 11, 2014. The Board of Directors places on record its appreciation for services rendered by Mr. Paracha and welcomes Ms. Ghaloo on Board.
CREDIT RATINGDuring the current financial year, The Pakistan Credit Rating Agency Limited (PACRA) maintained the Company’s long term rating of AA+ (Double A plus) and short term rating of A1plus (A One plus). These are among the highest ratings in the Non-Banking Financial Sector. As per PACRA standards, these ratings denote the lowest expectation of credit risk emanating from a strong capacity for timely repayment of financial commitments.
PARENT COMPANYORIX Corporation, Japan and its nominees hold 49.59% of the Company’s equity.
FINANCIAL STATEMENTS / REPORT OF THE DIRECTORS
AUDITORSM/s. A.F. Ferguson & Co., Chartered Accountants were appointed as auditors for the year ended June 30, 2015. The Board of Directors endorses the recommendation of the Audit Committee for the appointment of M/s. A.F. Ferguson & Co., Chartered Accountants, as the auditors of the Company for the year ending June 30, 2016.
PATTERN OF SHAREHOLDINGThe pattern of shareholding as at June 30, 2015 is attached at page no. 110. During the year, no trading in shares of the Company was carried out by Executives as defined by the Board of Directors under the Code of Corporate Governance.
REMUNERATION OF CHIEF EXECUTIVE OFFICERThe Board of Directors in their meeting held on September 16, 2015 has approved an annual salary of Rs. 26.3 million for the Chief Executive Officer with effect from October 01, 2015. In addition, the Chief Executive Officer will be entitled to performance bonus as may be determined from year to year by the Board and other perquisites and benefits as per Company policy.
ACKNOWLEDGEMENTThe Board greatly appreciates the support and cooperation of the regulatory authorities, bankers, business partners and all stake holders who are helping and contributing towards the continued growth of the Company and looks forward to their support and advice in the future. The Board also thanks our valued customers and depositors who have trust in the Company and continue to provide their support in ensuring its progress. The Company is also truly proud of its staff for their loyalty, commitment and dedication to their work.
On Behalf of the Board
September 16, 2015 Teizoon KisatChief Executive
39

The Company has applied the principles contained in the Code in the following manner:
1. The Company encourages representation of independent non-executive Directors and Directors representing minority interests on its Board of Directors. At present the Board includes:
Independent Directors 1. Mr. Shahid Usman
Non-Executive Directors 1. Mr. Kunwar Idris 2. Mr. Harukazu Yamaguchi 3. Mr Humayun Murad 4. Ms. Nargis Ghaloo 5. Mr. Shaheen Amin 6. Mr. Kazuhito Inoue Executive Director 1. Mr. Teizoon Kisat
The independent director meet the criteria of independence under clause i (b) of the CCG
2. The Directors have confirmed that none of them is serving as a Director on more than seven listed companies, including this Company (excluding the listed subsidiaries of listed holding companies where applicable).
3. All the resident Directors of the Company are registered
as taxpayers and none of them has defaulted in payment of any loan to a banking Company, a DFI or an NBFC or, being a member of a stock exchange, has been declared as a defaulter by that stock exchange.
4. During the year, a casual vacancy occurred on the board which was filled within the stipulated timeframe.
5. The Company has prepared a “Code of Conduct” and has ensured that appropriate steps have been taken to disseminate it throughout the Company along with its supporting policies and procedures.
6. The Board has developed a vision / mission statement, overall corporate strategy and significant policies of the Company. A complete record of particulars of significant policies along with the dates on which they were approved or amended has been maintained.
7. All the powers of the Board have been duly exercised and decisions on material transactions, including appointment and determination of remuneration and terms and conditions of employment of the CEO, other executives and non-executive directors, have been taken by the board.
8. The meetings of the board were presided over by the Chairman and, in his absence, by a Director elected by the board for this purpose and the board met at least once in every quarter. Written notices of the board meetings, along with agenda and working papers, were circulated at least seven days before the meetings. The minutes of the meetings were appropriately recorded and circulated.
9. A Director acquired certification of Director Education awarded by the Pakistan Institute of Corporate Governance.
10. A self evaluation of the Board and its Committees was carried out as required by the CCG.
This statement is being presented to comply with the Code of Corporate Governance (CCG) contained in Regulation No 35 of listing regulations of Karachi, Lahore and Islamabad Stock Exchanges for the purpose of establishing a framework of good governance, whereby a listed company is managed in compliance with the best practices of corporate governance.
STATEMENT OF COMPLIANCEwith the Code of Corporate Governance for the year ended June 30, 2015
ANNUAL REPORT 2015 / ORIX Leasing Pakistan Limited40

11. The appointment, remuneration and terms and conditions of employment of the CFO, Company Secretary and the Head of Internal Audit are approved by the Board of Directors however there were no new appointment of CFO, Company Secretary and the Head of Internal Audit during the year.
12. The Directors’ report for this year has been prepared in compliance with the requirements of the CCG and fully describes the salient matters required to be disclosed.
13. The financial statements of the Company were duly endorsed by CEO and CFO before approval of the Board.
14. The Directors, CEO and Executives do not hold any interest in the shares of the Company other than that disclosed in the pattern of shareholding.
15. The Company has complied with all the corporate and financial reporting requirements of the CCG.
16. The Board has formed an Audit Committee, it comprises of four members, of whom three are non-executive Directors and the Chairman of the committee is an independent director.
17. The meetings of the audit committee were held at least once every quarter prior to approval of interim and final results of the Company and as required by the CCG. The terms of reference of the committee have been formed and advised to the Committee for compliance.
18. The Board has formed a Human Resource and Remuneration Committee. It comprises of four Members, of whom three are non-executive directors and the chairman of the committee is a non-executive director.
19. The board has set up an effective internal audit function. The Head of Internal Control reports directly to the Audit Committee.
20. The statutory auditors of the Company have confirmed that they have been given a satisfactory rating under the quality control review program of the ICAP, that they or any of the partners of the firm, their spouses and minor children do not hold shares of the Company and that the firm and all its partner are in compliance with International Federation of Accountants (IFAC) guidelines on code of ethics as adopted by the ICAP.
21. The statutory auditors or the persons associated with them have not been appointed to provide other services except in accordance with the listing regulations and the auditors have confirmed that they have observed IFAC guidelines in this regard.
22. The ‘closed period’, prior to the announcement of
interim/final results, and business decisions, which may materially affect the market price of company’s securities, was determined and intimated to directors, employees and stock exchanges.
23. Material/price sensitive information has been
disseminated among all market participants at once through stock exchanges.
24. We confirm that all other material principles enshrined in the CCG have been compiled with.
FINANCIAL STATEMENTS / STATEMENT OF COMPLIANCE
41

Notice is hereby given that the Twenty-Ninth Annual General Meeting
of ORIX Leasing Pakistan Limited will be held on Tuesday, October
27, 2015 at 3.30 p.m. at The Institute of Chartered Accountants of
Pakistan, Chartered Accountants Avenue, Clifton, Karachi, to transact
the following business:
ORDINARY BUSINESS
1. To receive, consider and adopt the audited financial statements
together with the Directors’ and Auditors’ Report for the year
ended June 30, 2015.
2. To approve the payment of cash dividend to the shareholders at
the rate of Rs. 4.5 per share of Rs. 10 each for the year ended
June 30, 2015.
3. To appoint Auditors and fix their remuneration. The present
Auditors, Messrs A. F. Ferguson & Co., Chartered Accountants,
retire and being eligible, offer themselves for re-appointment.
4. To transact any other business, with permission of the Chair.
BY ORDER OF THE BOARD
EFFAT ASSAD
Karachi: September 16, 2015 Company Secretary
Notes:
1. The Register of Members of the Company shall remain closed
from October 20, 2015 to October 27, 2015 (both days inclusive).
Transfers received in order at our registrars, Messrs. THK
Associates (Private) Limited, 2nd Floor, State Life Building No.
3, Dr. Ziauddin Ahmed Road, Karachi at the close of business
on October 19, 2015, will be treated in time for the purpose of
attending the meeting and payment of dividend.
2. A Member entitled to attend and vote at the General Meeting of
Members is entitled to appoint a proxy to attend and vote on his/
her behalf. A proxy need not be a Member of the Company.
3. The instrument appointing a proxy and the power of attorney or
other authority under which it is signed or a notarially certified
copy of the power of attorney must be deposited at the
registered office of the Company at least 48 hours before the
time of the meeting. A form of proxy is enclosed. Shareholders
are requested to notify any change of address immediately.
4. CDC account holders will further have to follow the under
mentioned guidelines as laid down by the Securities and
Exchange Commission of Pakistan.
A. For attending the meeting:
(i) In case of individuals, the account holder or sub-account
holder and / or the person whose securities are in group
account and their registration details are uploaded as
per the regulations, shall authenticate his/her identity by
showing his/her original CNIC or original passport at the
time of attending the meeting.
(ii) In case of corporate entity, the Board of Directors resolution
/ power of attorney with specimen signature of the nominees
shall be produced (unless it has been provided earlier) at the
time of the meeting.
B. For appointing proxies:
(i) In case of individuals, the account holder or sub-account
holder and/or the person whose securities are in group
account and their registration details are uploaded as per
the Regulations, shall submit the proxy form accordingly.
(ii) The proxy form shall be witnessed by two persons whose
names, addresses and CNIC numbers shall be mentioned
on the form.
(iii) Attested copies of CNIC or the passport of the beneficial
owners and the proxy shall be furnished with the proxy
form.
(iv) The proxy shall produce his/her original CNIC or original
passport at the time of meeting.
(v) In case of corporate entity, the Board of Directors’
resolution/power of attorney with specimen signature shall
be submitted (unless it has been provided earlier) along with
proxy form to the Company.
NOTICE OF ANNUAL GENERAL MEETING
ANNUAL REPORT 2015 / ORIX Leasing Pakistan Limited42

CNIC / NTN
5. In accordance with the notification of the Securities and
Exchange Commission of Pakistan, SRO 779(I) 2011 dated
August 18, 2011 and SRO 831(1)/2012 dated July 5, 2012;
dividend warrants should bear CNIC numbers of the registered
member or the authorized person, except in case of minor(s) and
corporate members.
Accordingly, Members who have not yet submitted copy of their
valid CNIC / NTN (in case of corporate entities) are requested
to submit the same to the Share Registrar, with Members folio
no. mentioned thereon. It may kindly be noted that in case of
non-receipt of the copy of valid CNIC, the Company would be
constrained to withhold dispatch of dividend warrants.
e-Dividend
6. In order to make process of payment of cash dividend more
efficient, SECP vide circular No. 8(4) SM/CDC 2008 dated April
05, 2013 have issued instructions so that the shareholders can
get their dividend credited in their respective bank accounts
electronically without any delay. The shareholders may therefore
authorize the Company to credit the dividend directly to their
bank account for all future dividends declared by the Company.
Accordingly all non CDC shareholders are requested to send
their bank account details to the Company’s Share Registrar at
the address given above. Shareholders who hold shares with
Participant / Central Depository Company of Pakistan Limited
(CDC) accounts are advised to provide the mandate to the
concerned Stock Broker / CDC.
Circulation of Notice of Meeting and Annual
Accounts
7. With reference to SRO 787(I)/2014 dated September 8, 2014
issued by SECP, shareholders have option to receive Annual
Audited Financial Statements and Notices of General Meetings
through email. Shareholders of the Company are requested to
give their consent on prescribed format which is available on
Company's website to our Share Registrar at the address given
above to update our record if they wish to receive Annual Audited
Financial Statements and Notices of General Meetings through
email. However, if a shareholder, in addition, request for a hard
copy of Audited Financial Statements the same shall be provided
free of cost within seven days of receipt of such request.
Filer and Non-Filer Status
8. Through the Finance Act, 2015, enhanced rate of withholding
tax has been prescribed in the Income Tax Ordinance, 2001
(Ordinance) for certain provisions including withholding of tax
from dividend under section 150 of the Ordinance. These tax
rates are as under:
(a) For filers of income tax returns 12.5%
(b) For non-filers of income tax returns 17.5%
For this purpose, the terms ‘filer’ and ‘non-filer’ have been
defined. A ‘filer’ is a taxpayer, whose name appears in the Active
Taxpayers List (ATL) issued by Federal Board of Revenue (FBR),
from time to time whereas ‘non-filer’ is a person other than a
‘filer’. FBR has uploaded an ATL on its web-site, which can be
accessed at http://fbr.gov.pk.
At the time of dividend distribution, the Company, being a
withholding agent, would check each shareholder’s status on
the ATL and, if the shareholder’s name does not appear on
the ATL, the rate of withholding tax at seventeen and a half per
cent (17.5%) would be applied, in accordance with the law. In
the instance of a ‘filer’ as defined above, withholding tax rate of
twelve and a half per cent (12.5%) will be applicable.
In view of the above, all shareholders are advised to immediately
check their status on ATL and may, if required, take necessary
action for inclusion of their name in the ATL. The Company, as
per law, shall apply seventeen and a half per cent (17.5%) rate
of withholding tax if the shareholder’s name, with relevant details,
does not appear on the ATL available on the FBR website on the
first day of book closure.
FINANCIAL STATEMENTS / NOTICE OF ANNUAL GENERAL MEETING
43

Statement of Financial Position/Profit and Loss
2015 2014 2013 2012 2011 2010 Operating Results
Total Disbursement 13,408 11,097 9,056 7,844 8,058 8,428 Revenues 4,209 3,820 3,560 3,346 3,183 3,700 Lease revenue 3,161 2,927 2,750 2,731 2,758 2,699 Financial charges 1,728 1,658 1,654 1,868 1,796 2,064 Provisions and Impairments 168 184 257 199 213 523 Profit before tax 860 640 414 275 227 126 Profit after tax 671 516 338 202 145 104 Dividend 369* 287 181 123 82 - Balance Sheet
Gross lease receivables 23,871 20,611 18,233 18,368 19,802 20,906 Fixed assets 1,762 1,767 1,560 1,357 1,268 1,091 Investment in associated undertakings 2,176 1,701 1,711 1,567 1,283 1,221 Total Assets 28,318 24,449 23,127 22,028 21,802 23,779 Total Borrowing 16,280 13,940 13,807 13,178 12,957 14,812 Long term debts 9,825 7,074 8,578 6,484 6,563 8,827 Total Liabilities 24,769 21,385 20,456 19,580 19,555 21,763 Shareholders’ equity 3,437 2,983 2,589 2,363 2,161 2,016
* Proposed
PERFORMANCE INDICATORS
Profitabilty
Profit before tax over revenue 20.43% 16.76% 11.63% 8.21% 7.10% 3.35%Gross spread 26.94% 34.26% 30.94% 22.13% 22.55% 11.60%Return on equity 20.90% 18.53% 13.63% 8.93% 6.93% 5.10%Return on assets 3.35% 2.83% 1.95% 1.20% 0.80% 0.50%Income / expense ratio 1.32 1.28 1.23 1.17 1.16 1.23 Liquidity
Current ratio 1.35 1.18 1.47 1.15 1.15 1.37Cash to Current Liabilities 0.02 0.01 0.03 0.04 0.03 0.02 Investment / Market
Price to book ratio 1.47 0.93 0.58 0.38 0.21 0.21 Dividend yeild 7.29% 10.31% 12.05% 13.80% 17.90% - Dividend payout 55.04% 55.64% 53.63% 60.90% 56.70% - Earning per share (Rs.) 8.18 6.29 4.12 2.46 1.76 1.27 Price earning ratio 7.55 5.40 4.44 4.41 3.16 4.12 Market Value per Share (Rs.) 61.72 33.94 18.25 10.86 5.57 5.23 Proposed dividend 45.00% 35.00% 22.00% 15.00% 10.00% - Capital Structure
Debt / Equity ratio 4.59 4.55 5.12 5.30 5.76 7.35 Book Value per share (Rs.) 41.89 36.35 31.55 28.79 26.33 24.57 Interest Cover ratio 1.59 1.50 1.41 1.20 1.25 1.34
Rupees in million
SIX YEARS' FINANCIAL SUMMARY
ANNUAL REPORT 2015 / ORIX Leasing Pakistan Limited44

FINANCIAL STATEMENTS / SIX YEARS' FINANCIAL SUMMARY
Gross Lease ReceivableRs. in million
0
5,000
10,000
15,000
20,000
25,000
201520142013201220112010
20,9
06
19,8
02
18,3
68
18,2
33 20,6
11
23,8
71
DisbursementRs. in million
0
3,000
6,000
9,000
12,000
15,000
201520142013201220112010
8,428
8,058
7,844 9,056
11,097
13,408
DividendRs. in million
0
50
100
150
200
250
300
350
400
201520142013201220112010
0
82
123
181
287
369
Profit Before TaxRs. in million
0
200
400
600
800
1,000
201520142013201220112010
126
227 27
5
414
640
860
RevenueRs. in million
0
1,000
2,000
3,000
4,000
5,000
201520142013201220112010
3,700
3,183
3,346
3,560
3,820 4,209
Shareholders' EquityRs. in million
0
500
1,000
1,500
2,000
2,500
3,000
3,500
201520142013201220112010
2,01
6
2,16
1 2,36
3 2,58
9
2,98
3
3,43
7
45

Rupees in million
2015 2014 2013 2012 2011 2010STATEMENT OF FINANCIAL POSITION Rupees % Rupees % Rupees % Rupees % Rupees % Rupees % ASSETS Non-current assets Non-current assets Property, plant and equipment 1,762 6.22% 1,767 7.23% 1,560 6.75% 1,357 6.16% 1,268 5.82% 1,091 4.59%Intangible assets 9 0.03% 11 0.04% 34 0.15% 88 0.40% 79 0.36% 65 0.27%Net investment in finance leases 11,356 40.10% 9,336 38.18% 8,079 34.93% 7,871 35.73% 9,110 41.78% 9,130 38.40%Investment in associated undertakings 2,176 7.69% 1,701 6.96% 1,711 7.40% 1,568 7.12% 1,284 5.89% 1,221 5.13%Long term investments 14 0.05% 14 0.06% 14 0.06% 18 0.08% 200 0.92% 205 0.86%Long term finances and loans 879 3.10% 741 3.03% 844 3.65% 757 3.44% 284 1.30% 194 0.82%Long term deposits 10 0.04% 10 0.04% 14 0.06% 14 0.06% 14 0.07% 13 0.05% 16,206 57.23% 13,580 55.54% 12,255 52.99% 11,672 52.99% 12,238 56.13% 11,918 50.12%
Current assets Short term finances 407 1.44% 308 1.26% 243 1.05% 228 1.04% 244 1.12% 320 1.35%Accrued return on investments and term finances 75 0.26% 68 0.28% 35 0.15% 16 0.07% 4 0.02% 15 0.06%Current maturity of non-current assets 9,966 35.19% 8,910 36.44% 8,299 35.88% 8,378 38.03% 7,800 35.78% 9,011 37.90%Short term investments 1,106 3.91% 1,088 4.45% 1,600 6.92% 738 3.35% 358 1.64% 1,216 5.12%Advances and prepayments 47 0.17% 48 0.20% 52 0.22% 103 0.47% 67 0.31% 66 0.28%Other receivables 75 0.26% 132 0.54% 313 1.35% 495 2.25% 800 3.67% 1,072 4.51%Cash and bank balances 173 0.61% 100 0.41% 231 1.00% 336 1.53% 242 1.11% 131 0.55%Taxation - net 171 0.60% 126 0.52% 87 0.38% 49 0.22% 33 0.15% 5 0.02%Assets classified as held for sale 91 0.32% 89 0.36% 13 0.06% 13 0.06% 15 0.07% 25 0.10% 12,111 42.77% 10,869 44.46% 10,872 47.01% 10,356 47.01% 9,564 43.87% 11,861 49.88%Total assets 28,318 100.00% 24,449 100.00% 23,127 100.00% 22,028 100.00% 21,802 100.00% 23,779 100.00% EQUITY AND LIABILITIES Share capital and reserves Share capital and reserves 3,437 12.14% 2,983 12.20% 2,589 11.19% 2,363 10.73% 2,160 9.91% 2,016 8.48%Surplus on revaluation of leasehold landand office building 112 0.40% 81 0.33% 83 0.36% 85 0.39% 87 0.40% - 0.00% Non-current liabilities Long term finances 4,708 16.62% 3,147 12.87% 3,323 14.37% 2,274 10.32% 3,165 14.52% 4,543 19.11%Long term loans - 0.00% 280 1.15% 914 3.95% 1,938 8.80% 2,173 9.96% 3,186 13.40%Long term certificates of deposit 5,117 18.07% 3,647 14.92% 4,341 18.77% 2,273 10.32% 1,226 5.62% 1,098 4.62%Long term deposits 5,239 18.50% 4,484 18.34% 3,824 16.53% 3,586 16.28% 4,308 19.76% 4,016 16.89%Deferred taxation 454 1.60% 395 1.62% 353 1.53% 284 1.29% 222 1.02% 120 0.50%Other long term liabilities 268 0.95% 248 1.01% 296 1.28% 218 0.99% 162 0.74% 137 0.58%Post-employment benefits 1 0.00% 4 0.02% 29 0.13% 19 0.09% - 0.00% - 0.00% 15,786 55.75% 12,205 49.92% 13,080 56.56% 10,591 48.08% 11,256 51.63% 13,100 55.09%
Current liabilities Trade and other payables 641 2.26% 480 1.96% 411 1.78% 317 1.44% 255 1.17% 255 1.07%Accrued interest on loans,term finances and CODs 319 1.13% 454 1.86% 297 1.28% 325 1.48% 447 2.05% 580 2.44%Short term borrowings 884 3.12% 695 2.84% 936 4.05% 947 4.30% 1,109 5.09% 623 2.62%Short term certificates of deposit 944 3.33% 1,019 4.17% 1,070 4.63% 957 4.34% 738 3.38% 756 3.18%Current maturity of non-current liabilities 6,194 21.87% 6,532 26.72% 4,662 20.16% 6,444 29.25% 5,751 26.38% 6,449 27.12% 8,983 31.72% 9,179 37.55% 7,376 31.89% 8,989 40.81% 8,299 38.06% 8,662 36.43%Total equity and liabilities 28,318 100.00% 24,449 100.00% 23,127 100.00% 22,028 100.00% 21,802 100.00% 23,779 100.00%
2015 2014 2013 2012 2011 2010PROFIT AND LOSS Rupees % Rupees % Rupees % Rupees % Rupees % Rupees %
INCOME Income from operations Finance lease 2,261 53.73% 1,974 51.69% 1,900 53.37% 2,013 60.11% 2,110 66.13% 2,073 55.18%Operating lease 900 21.38% 953 24.94% 850 23.88% 717 21.41% 649 20.34% 626 16.66%Mark-up on term / factoring finance 462 10.97% 446 11.66% 396 11.13% 234 6.98% 139 4.35% 143 3.82% 3,623 86.08% 3,373 88.29% 3,146 88.38% 2,964 88.51% 2,897 90.82% 2,843 75.66%
Income from other operating activities Other income - net 311 7.38% 224 5.87% 249 6.98% 261 7.80% 189 5.92% 395 10.52%Share of profit of equity accounted undertakings 275 6.54% 223 5.84% 165 4.64% 124 3.69% 104 3.26% 143 3.80%Gain on sales of investment in associated undertaking. - 0.00% - 0.00% - 0.00% - 0.00% - 0.00% 376 10.02% 586 13.92% 447 11.71% 414 11.62% 385 11.49% 293 9.18% 915 24.34%Total Income 4,209 100.00% 3,820 100.00% 3,560 100.00% 3,349 100% 3,190 100% 3,757 100%
EXPENSES Finance costs 1,728 41.05% 1,658 43.41% 1,654 46.46% 1,868 55.77% 1,796 56.29% 2,064 54.94%Administrative and general expenses 832 19.76% 755 19.77% 730 20.51% 585 17.48% 549 17.20% 600 15.96%Direct cost of leases 622 14.78% 582 15.24% 504 14.17% 419 12.52% 400 12.53% 387 10.30% 3,182 75.59% 2,996 78.43% 2,889 81.14% 2,873 85.77% 2,744 86.01% 3,051 81.21% Profit before Provisions, & Taxes 1,027 24.41% 824 21.57% 672 18.86% 477 14.23% 446 13.99% 706 18.79%Provisions and impairment Allowance for potential lease and loan losses 122 2.89% 137 3.58% 208 5.83% 188 5.62% 205 6.43% 510 13.57%Other provisions 46 1.09% 47 1.23% 49 1.39% 10 0.31% 8 0.24% 14 0.36%Impairment on available for sale securities - 0.00% - 0.00% - 0.00% 3 0.09% 7 0.22% 57 1.51% 168 3.98% 184 4.81% 257 7.22% 202 6.03% 220 6.89% 580 15.44% Profit before tax 860 20.43% 640 16.76% 414 11.64% 275 8.21% 227 7.10% 126 3.35% Taxation 189 4.49% 124 3.25% 77 2.15% 73 2.18% 82 2.57% 21 0.57%Profit for the year 671 15.94% 516 13.51% 338 9.49% 202 6.03% 145 4.54% 104 2.78%
SIX YEARS' VERTICAL ANALYSISStatement of Financial Position/Profit and Loss
ANNUAL REPORT 2015 / ORIX Leasing Pakistan Limited46

Rupees in million
15 vs 14 14 vs 13 13 vs 12 12 vs 11 11 vs 10 10 vs 09STATEMENT OF FINANCIAL POSITION 2015 % 2014 % 2013 % 2012 % 2011 % 2010 % ASSETS Non-current assets Property, plant and equipment 1,762 -0.28% 1,767 13.25% 1,560 14.96% 1,357 6.99% 1,268 16.24% 1,091 -4.09%Intangible assets 9 -20.77% 11 -67.66% 34 -61.59% 88 10.93% 79 22.10% 65 0.00%Net investment in finance leases 11,356 21.64% 9,336 15.56% 8,079 2.64% 7,871 -13.60% 9,110 -0.23% 9,130 -7.10%Investment in associated undertakings 2,176 27.93% 1,701 -0.56% 1,711 9.10% 1,568 22.14% 1,284 5.16% 1,221 -25.76%Long term investments 14 3.58% 14 1.61% 14 -22.40% 18 -91.16% 200 -2.66% 205 5.70%Long term finances and loans 879 18.63% 741 -12.16% 844 11.45% 757 166.76% 284 46.29% 194 -66.64%Long term deposits 10 -0.99% 10 -29.37% 14 4.38% 14 -2.90% 14 12.40% 13 -17.75% 16,206 19.34% 13,580 10.81% 12,255 4.99% 11,672 -4.63% 12,238 2.68% 11,918 -11.49%
Current assets Short term finances 407 32.40% 308 26.37% 243 6.59% 228 -6.38% 244 -23.81% 320 -30.39%Accrued return on investments and term finances 75 9.87% 68 95.07% 35 124.68% 16 287.80% 4 -72.67% 15 -72.69%Current maturity of non-current assets 9,966 11.86% 8,910 7.37% 8,299 -0.94% 8,378 7.41% 7,800 -13.44% 9,011 -7.96%Short term investments 1,106 1.66% 1,088 -31.98% 1,600 116.85% 738 105.89% 358 -70.55% 1,216 -17.10%Advances and prepayments 47 -1.62% 48 -8.09% 52 -49.60% 103 54.15% 67 2.03% 66 -10.05%Other receivables 75 -43.52% 132 -57.90% 313 -36.70% 495 -38.12% 800 -25.39% 1,072 -11.94%Cash and bank balances 173 72.45% 100 -56.43% 231 -31.44% 336 38.84% 242 85.05% 131 -79.18%Taxation - net 171 35.39% 126 45.42% 87 76.80% 49 48.35% 33 611.49% 5 -95.66%Assets classified as held for sale 91 2.59% 89 582.78% 13 -0.47% 13 -15.32% 15 -37.07% 25 -58.70% 12,111 11.43% 10,869 -0.03% 10,872 4.99% 10,356 8.28% 9,564 -19.36% 11,861 -14.41%Total assets 28,318 15.82% 24,449 5.71% 23,127 4.99% 22,028 1.04% 21,802 -8.31% 23,779 -12.97% EQUITY AND LIABILITIES Share capital and reserves Share capital and reserves 3,437 15.23% 2,983 15.23% 2,589 9.57% 2,363 9.35% 2,161 7.16% 2,016 -2.96%Surplus on revaluation of leasehold land and office building 112 38.10% 81 -2.37% 83 -2.31% 85 -2.26% 87 100.00% - - Non-current liabilities Long term finances 4,708 49.61% 3,147 -5.30% 3,323 46.15% 2,274 -28.17% 3,165 -30.33% 4,543 -43.92%Long term loans - -100.00% 280 -69.33% 914 -52.85% 1,938 -10.79% 2,173 -31.81% 3,186 -17.56%Long term certificates of deposit 5,117 40.29% 3,647 -15.99% 4,341 91.04% 2,273 85.39% 1,226 11.67% 1,098 7.04%Long term deposits 5,239 16.82% 4,484 17.27% 3,824 6.64% 3,586 -16.77% 4,308 7.27% 4,016 -12.66%Deferred taxation 454 14.82% 395 12.00% 353 24.10% 284 28.14% 222 84.87% 120 -44.82%Other long term liabilities 268 8.34% 248 -16.34% 296 35.88% 218 34.14% 162 18.57% 137 30.35%Post-employment benefits 1 -78.33% 4 -86.52% 29 53.15% 19 100.00% - 0.00% - 0.00% 15,786 29.34% 12,205 -6.69% 13,080 23.50% 10,591 -5.91% 11,256 -14.08% 13,100 -26.86%Current liabilities Trade and other payables 641 33.51% 480 16.97% 411 29.47% 317 24.57% 255 -0.20% 255 -0.88%Accrued interest on loans,term finances and CODs 319 -29.70% 454 52.82% 297 -8.65% 325 -27.23% 447 -22.95% 580 -25.38%Short term borrowings 884 27.30% 695 -25.78% 936 -1.14% 947 -14.61% 1,109 78.04% 623 -12.65%Short term certificates of deposit 944 -7.35% 1,019 -4.76% 1,070 11.85% 957 29.68% 738 -2.36% 756 29.44%Current maturity of non-current liabilities 6,194 -5.17% 6,532 40.10% 4,662 -27.65% 6,444 12.05% 5,751 -10.83% 6,449 28.93% 8,983 -2.15% 9,179 24.46% 7,376 -17.95% 8,989 8.32% 8,299 -4.20% 8,662 18.13%Total equity and liabilities 28,318 15.82% 24,449 5.71% 23,127 4.99% 22,028 1.04% 21,802 -8.31% 23,779 -12.97%
15 vs 14 14 vs 13 13 vs 12 12 vs 11 11 vs 10 10 vs 09PROFIT AND LOSS 2015 % 2014 % 2013 % 2012 % 2011 % 2010 % INCOME Income from operations Finance lease 2,261 14.53% 1,974 3.91% 1,900 -5.62% 2,013 -4.56% 2,110 1.74% 2,073 -13.38%Operating lease 900 -5.53% 953 12.07% 850 18.51% 717 10.55% 649 3.67% 626 6.14%Mark-up on term / factoring finance 462 3.65% 446 12.42% 396 69.40% 234 68.46% 139 -3.22% 143 -26.13% 3,623 7.43% 3,373 7.19% 3,146 6.14% 2,964 2.32% 2,897 1.92% 2,843 -10.53%
Income from other operating activities Other income - net 311 38.56% 224 -9.82% 249 -4.84% 261 38.41% 189 -52.25% 395 55.75%Share of profit of equity accounted undertakings 275 23.37% 223 35.03% 165 33.60% 124 18.88% 104 -27.13% 143 54.76%Gain on sale of investment in associated undertaking - 0.00% 0 0.00% 0 0.00% - - - -100.00% 376 100.00% 586 30.99% 447 8.08% 414 7.51% 385 31.47% 293 -67.98% 915 164.28% Total Income 4,209 10.19% 3,820 7.29% 3,560 6.30% 3,349 5.00% 3,190 -15.10% 3,757 6.64% EXPENSES Finance costs 1,728 4.18% 1,658 0.25% 1,654 -11.45% 1,868 4.04% 1,796 -13.02% 2,064 -19.67%Administrative and general expenses 832 10.15% 755 3.44% 730 24.71% 585 6.71% 549 -8.52% 600 -7.95%Direct cost of leases 622 6.80% 582 15.44% 504 20.33% 419 4.92% 400 3.25% 387 3.37% 3,182 6.19% 2,996 3.71% 2,889 0.56% 2,873 4.70% 2,744 -10.08% 3,051 -15.15% Profit before provision and taxes 1,027 24.71% 824 22.69% 672 40.88% 477 6.82% 446 -36.80% 706 1075.50% Provisions and impairment Allowance for potential lease and loan losses 122 -11.11% 137 -34.08% 208 10.22% 188 -8.19% 205 -59.75% 510 59.33%Other provisions 46 -2.22% 47 -5.05% 49 374.34% 10 37.12% 8 -44.02% 14 238.38%Impairment on available for sale securities - 0.00% 0 0.00% 0 -100.00% 3 -56.45% 7 -87.92% 57 75.56%Total Provision & Impairment 168 -8.84% 184 -28.50% 257 27.39% 202 -8.13% 220 -62.14% 580 62.82%Profit before tax 860 34.34% 640 54.45% 414 50.78% 275 21.31% 227 79.89% 126 129.38%Taxation 189 52.44% 124 62.07% 77 4.79% 73 -10.88% 82 281.48% 21 -44.06%Profit for the year 671 29.99% 516 52.72% 338 67.42% 202 39.53% 145 38.46% 104 122.37%
SIX YEARS' HORIZONTAL ANALYSISStatement of Financial Position/Profit and Loss
FINANCIAL STATEMENTS / SIX YEARS' FINANCIAL SUMMARY
47

Rupees
2015 2014
Revenues from operations 3,455,536,077 3,188,790,839Other income 310,724,363 224,245,569 Share of profit of associates 275,148,114 223,019,793 4,041,408,554 3,636,056,201 Financial cost 911,045,605 873,975,799Direct cost of leases and services 618,160,637 609,509,224 1,529,206,242 1,483,485,023
Value Added 2,512,202,312 2,152,571,178
Distribution of Value Addition 2015 % 2014 %
Distributed as follows: Remuneration 511,052,688 20% 451,221,610 21%Profit on Certificates of Deposit 816,643,147 33% 784,403,341 36%Depreciation 324,602,938 13% 276,845,714 13%Taxes 189,000,000 7% 123,987,252 6%Cash dividend 369,238,185 15% 287,185,255 13%Profit retained 268,120,177 11% 125,828,006 6%Statutory reserves 33,545,177 1% 103,100,000 5% 2,512,202,312 100% 2,152,571,178 100%
STATEMENT OF VALUE ADDITION
Distribution of Value Addition – 2014
Profit on Certificates of Deposit Depreciation
Taxes Cash Dividend
Capital Reserves and Retained Profits Statutory Reserves
Remuneration
36%
13%
6%
13%
6%
5%
21%
Distribution of Value Addition – 2015
Profit on Certificates of Deposit Depreciation
Taxes Cash Dividend
Capital Reserves and Retained Profits Statutory Reserves
Remuneration
33%
13%
7%
15%
11%
1%
20%
ANNUAL REPORT 2015 / ORIX Leasing Pakistan Limited48

49
Financial PerformanceFor the year ended June 30, 2015

ANNUAL REPORT 2015 / ORIX Leasing Pakistan Limited50
ORIX Leasing Pakistan Limited (OLP) established Islamic Finance Division (IFD) in April 1st, 2011. OLP-IFD, with the consultation of undersigned, developed and executed initially the following two Shariah Complaint products:
• Ijarah, and • Diminishing Musharakah
By the grace of Allah, the year under review, was the fourth year of Islamic financing at ORIX Leasing Pakistan Limited. During the last year concluded, OLP executed the transactions of Ijarah and Diminishing Musharakah amounting to Rupees 160.98 Million.
In the capacity of Shariah Advisor I have to report on the Shariah compliance of the affairs of the Islamic Finance of OLP as well as related factors which contribute to the operations of Islamic Finance like staff training, product development, etc.
Shariah Compliance:
The two wings of OLP are funding arrangements and investments of these funds. Shariah compliance needs to be ensured at both ends i.e. sources of funds and their applications. Based on my review of both the aspects, I report that the Ijarah and Diminishing Musharakah have been carried out in accordance with the rules and principles of Shariah. I hereby certify that the treasury function and accounting treatment of the products conform to Shariah requirements. I further report that OLP got the approval of undersigned before disbursement and execution of each and every Islamic Financing transaction.
Islamic Finance Training:
Human resource is the key determinant in success or failure of any product. By training and educating the employees, risk of non-compliance can be mitigated to a large extent. At OLP undersigned conducted various training sessions on the products in which the relevant staff of OLP participated. Alhamdulillah OLP has been working sincerely and enthusiastically on the development, and refinement of its Islamic products to make them more attractive and competitive in terms of processing time and pricing with conventional finance.
May Allah accept our efforts and grant us success in this regard. We also pray to Allah Almighty and seek His Guidance and Blessings for further progress, development, and prosperity of ORIX LEASING PAKISTAN LIMITED and ISLAMIC FINANCE.
Mufti Ibrahim EssaShariah AdvisorDated: September 14, 2015
Shariah Advisor’s ReportFor the year ended June 30, 2015

51
We have reviewed the enclosed Statement of Compliance with the best practices contained in the Code of Corporate Governance (the code) prepared by the Board of Directors of ORIX Leasing Pakistan Limited for the year ended June 30, 2015 to comply with the requirements of Listing Regulation No. 35 (Chapter XI) of the Karachi, Lahore and Islamabad Stock Exchanges where the Company is listed. The responsibility for compliance with the Code is that of the Board of Directors of the Company. Our responsibility is to review, to the extent where such compliance can be objectively verified, whether the Statement of Compliance reflects the status of the Company’s compliance with the provisions of the Code and report if it does not and to highlight any non-compliance with the requirements of the Code. A review is limited primarily to inquiries of the Company’s personnel and review of various documents prepared by the Company to comply with the Code.
As part of our audit of the financial statements we are required to obtain an understanding of the accounting and internal control systems sufficient to plan the audit and develop an effective audit approach. We are not required to consider whether the Board of Directors’ statement on internal control covers all risks and controls or to form an opinion on the effectiveness of such internal controls, the Company’s corporate governance procedures and risks.
The Code requires the Company to place before the Audit Committee, and upon recommendation of the Audit Committee, place before the Board of Directors for their review and approval its related party transactions distinguishing between transactions carried out on terms equivalent to those that prevail in arm’s length transactions and transactions which are not executed at arm’s length prices recording proper justification for using such alternate pricing mechanism. We are only required and have ensured compliance of this requirement to the extent of approval of related party transactions by the Board of Directors upon recommendation of the Audit Committee. We have not carried out any procedures to determine whether the related party transactions were undertaken at arm’s length prices or not.
Based on our review, nothing has come to our attention, which causes us to believe that the Statement of Compliance does not appropriately reflect the Company’s compliance, in all material respects, with the best practices contained in the Code as applicable to the Company for the year ended June 30, 2015.
Chartered AccountantsDated: September 18, 2015Karachi
A. F. FERGUSON & CO.
Review Report to the Members on the Statement of Compliance with the Best Practices of the Code of Corporate Governance

ANNUAL REPORT 2015 / ORIX Leasing Pakistan Limited52
Auditors’ Report to the MembersFor the year ended June 30, 2015
We have audited the annexed balance sheet of ORIX Leasing Pakistan Limited (the Company) as at June 30, 2015 and the related profit and loss account, statement of comprehensive income, cash flow statement and statement of changes in equity together with the notes forming part thereof, for the year then ended and we state that we have obtained all the information and explanations which, to the best of our knowledge and belief, were necessary for the purposes of our audit. It is the responsibility of the Company’s management to establish and maintain a system of internal control, and prepare and present the above said statements in conformity with the approved accounting standards and the requirements of the Companies Ordinance, 1984. Our responsibility is to express an opinion on these statements based on our audit.
We conducted our audit in accordance with the International Standards on Auditing as applicable in Pakistan. These standards require that we plan and perform the audit to obtain reasonable assurance about whether the above said statements are free of any material misstatement. An audit includes examining, on a test basis, evidence supporting the amounts and disclosures in the above said statements. An audit also includes assessing the accounting policies and significant estimates made by management, as well as, evaluating the overall presentation of the above said statements. We believe that our audit provides a reasonable basis for our opinion and, after due verification, we report that:
(a) in our opinion, proper books of accounts have been kept by the Company as required by the Companies Ordinance, 1984;
(b) in our opinion:
(i) the balance sheet and profit and loss account together with the notes thereon have been drawn up in conformity with the Companies Ordinance, 1984, and are in agreement with the books of accounts and are further in accordance with accounting policies consistently applied.
(ii) the expenditure incurred during the year was for the purpose of the Company’s business; and
(iii) the business conducted, investments made and the expenditure incurred during the year were in accordance with the objects of the Company;
(c) in our opinion and to the best of our information and according to the explanations given to us, the balance sheet, profit and loss account, statement of comprehensive income, cash flow statement and statement of changes in equity together with the notes forming part thereof conform with approved accounting standards as applicable in Pakistan and give the information required by the Companies Ordinance, 1984, in the manner so required and respectively give a true and fair view of the state of the Company’s affairs as at June 30, 2015 and of the profit, its comprehensive income, its cash flows and changes in equity for the year then ended; and
(d) in our opinion, Zakat deductible at source under the Zakat and Ushr Ordinance, 1980, was deducted by the Company and deposited in the Central Zakat Fund established under Section 7 of that Ordinance.
Chartered AccountantsEngagement Partner: Rashid A. JaferDated: September 18, 2015Karachi
A. F. FERGUSON & CO.

53
Balance SheetAs at June 30, 2015
Note 2015 2014 Rupees
ASSETSNon-current assets Property, plant and equipment 4 1,761,811,476 1,766,703,090 Intangible assets 5 8,631,456 10,894,523 Net investment in finance lease 6 20,823,948,377 17,774,664,986 Current maturity 12 (8,746,722,525) (7,679,925,643)Allowance for potential lease losses 38 (721,375,996) (759,020,567) (9,468,098,521) (8,438,946,210) 11,355,849,856 9,335,718,776 Investment in associated undertakings 7 2,176,352,899 1,701,150,417 Long term investments 8 14,404,648 13,906,241 Long term finances and loans 9 879,256,372 741,206,025 Long term deposits 10,048,864 10,149,703 16,206,355,571 13,579,728,775 Current assets Short term finances 10 407,365,321 307,676,931 Accrued return on investments and term finance 11 74,783,699 68,066,629 Current maturity of non-current assets 12 9,966,101,697 8,909,826,715 Short term investments 13 1,105,942,382 1,087,935,861 Advances and prepayments 14 46,986,270 47,758,782 Other receivables 15 74,513,043 131,926,872 Cash and bank balances 16 173,286,352 100,483,822 Taxation - net 171,010,858 126,314,272 Assets classified as held for sale 17 91,302,209 88,995,488 12,111,291,831 10,868,985,372 Total assets 28,317,647,402 24,448,714,147 EQUITY AND LIABILITIES Share capital and reserves Authorised share capital 350,000,000 (2014: 350,000,000) Ordinary shares of Rs. 10 each 3,500,000,000 3,500,000,000 Issued, subscribed and paid-up capital 18 820,529,300 820,529,300 Reserves 2,616,491,028 2,162,290,834 3,437,020,328 2,982,820,134
Surplus on revaluation of leasehold land and office building 19 112,009,008 81,109,116 Non-current liabilities Long term finances 20 4,707,563,110 3,146,602,029 Long term loans 21 - 280,306,798 Long term certificates of deposit 22 5,116,943,351 3,647,417,555 Long term deposits 23 5,238,768,218 4,484,318,085 Deferred taxation 24 453,715,266 395,139,051 Other long term liabilities 25 268,234,514 247,588,070 Post-employment benefits 36.2.2 849,197 3,919,447 15,786,073,656 12,205,291,035
Current liabilities Trade and other payables 26 641,102,036 480,190,971 Accrued interest / mark-up on loans, finances and certificates of deposit 27 318,976,673 453,729,354 Short term borrowings 28 884,301,394 694,635,094 Short term certificates of deposit 29 944,348,226 1,019,234,608 Current maturity of non-current liabilities 30 6,193,816,081 6,531,703,835 8,982,544,410 9,179,493,862 Total equity and liabilities 28,317,647,402 24,448,714,147 Contingencies and commitments 31
The annexed notes 1 to 52 form an integral part of these financial statements.
Teizoon Kisat Humayun MuradChief Executive Director

ANNUAL REPORT 2015 / ORIX Leasing Pakistan Limited54
Note 2015 2014 Rupees
INCOME
Income from operations
Finance leases 2,261,355,111 1,974,465,857 Operating leases 32 899,996,716 952,631,523 Mark-up on term finance 461,745,792 445,502,751
3,623,097,619 3,372,600,131 Income from other activities
Other income - net 33 310,724,363 224,245,569 Share of profit of equity accounted undertakings 34 275,148,114 223,019,793
585,872,477 447,265,362
4,208,970,096 3,819,865,493 EXPENSES
Finance cost 35 1,727,688,752 1,658,379,140 Administrative and general expenses 36 831,862,873 755,240,976 Direct cost of lease 37 621,953,390 582,335,572 3,181,505,015 2,995,955,688
Profit before provision and taxation 1,027,465,081 823,909,805 Allowance for potential lease and other loan losses - net 38 121,674,976 136,880,218 Other provisions - net 39 45,886,566 46,929,074 167,561,542 183,809,292
Profit before tax 859,903,539 640,100,513
Taxation 43 189,000,000 123,987,252
Profit for the year 670,903,539 516,113,261 Earnings per share - basic and diluted 49 8.18 6.29
The annexed notes 1 to 52 form an integral part of these financial statements.
Profit and Loss AccountFor the year ended June 30, 2015
Teizoon Kisat Humayun MuradChief Executive Director

55
Note 2015 2014 Rupees
Profit for the year 670,903,539 516,113,261
Other comprehensive income
Items that may be reclassified subsequently to profit and loss
Exchange difference arising on translation of foreign associates - net of deferred tax 26,702,650 (25,571,167)Unrealised gain due to change in fair value of available for sale securities - net 25,088,542 2,081,805 Unrealised gain due to sale of available for sale securities transferred to profit and loss account (10,375,284) -
Net unrealised loss on revaluation of investments classified as available for sale transferred to profit and loss account as impairment loss 3,114,225 - 17,827,483 2,081,805 Net gain on cash flow hedging instruments 23,058,707 83,779,535 67,588,840 60,290,173 Items that will not be reclassified to profit and loss
Remeasurements of post employment benefit 36.2.4 (134,314) (4,753,683)Total comprehensive income for the year 738,358,065 571,649,751
The annexed notes 1 to 52 form an integral part of these financial statements.
Statement of Comprehensive IncomeFor the year ended June 30, 2015
Teizoon Kisat Humayun MuradChief Executive Director

ANNUAL REPORT 2015 / ORIX Leasing Pakistan Limited56
Cash Flow StatementFor the year ended June 30, 2015
Note 2015 2014 Rupees
CASH FLOWS FROM OPERATING ACTIVITIES
Operating profit before working capital changes 44 2,603,334,328 2,420,818,677
(Increase) / decrease in operating assets
Investment in finance lease - net (3,190,671,815) (1,891,026,053)Long term finances and loans - net (151,358,154) 2,738,651 Short term finances (93,789,806) (78,211,478)Long term deposits 100,839 4,221,211 Advances and prepayments 772,512 4,202,483 Other receivables (14,664,806) (4,071,380) (3,449,611,230) (1,962,146,566)Increase / (decrease) in operating liabilities Deposits from lessees - net 941,014,855 601,053,803 Mark-up paid (891,267,782) (924,561,368)Payment against staff retirement benefits (15,204,085) (42,459,161)Profit paid on certificates of deposit (932,099,617) (597,574,676)Trade and other payables 132,139,098 55,316,611 (765,417,531) (908,224,791)
Net cash (used in) / generated from operating activities before income tax (1,611,694,433) (449,552,680)Income tax paid (158,976,234) (110,948,172)
Net cash used in operating activities (1,770,670,667) (560,500,852)
CASH FLOWS FROM INVESTING ACTIVITIES
Capital expenditure incurred - own use and intangible assets (68,262,583) (43,158,509)Proceeds from disposal of assets - own use 19,097,931 16,663,022 Capital expenditure incurred - operating lease assets (140,464,106) (373,171,487)Capital expenditure incurred - Ijarah finance (134,260,800) (123,172,000)Proceeds from sale of operating lease assets 21,906,400 30,849,978 Proceeds from sale of Ijarah finance assets 4,452,765 32,552,632 Investments - net 90,611,308 536,379,207 Purchase of right shares of equity accounted undertaking (193,330,000) - Dividend received 30,052,040 95,041,620 Interest received 99,982,222 86,472,669
Net cash (used in) / generated from investing activities (270,214,823) 258,457,132
CASH FLOWS FROM FINANCING ACTIVITIES
Proceeds from long term loans 5,701,010,000 2,778,367,080 Short term borrowings - net - (650,000,000)Certificates of deposit issued - net 671,090,206 728,177,953 Repayment of long term loans and finances (4,162,587,456) (2,913,642,906)Dividend paid (285,491,030) (179,667,725)Net cash generated from / (used in) financing activities 1,924,021,720 (236,765,598)
Net decrease in cash and cash equivalents (116,863,770) (538,809,318)Cash and cash equivalents at beginning of the year (594,151,272) (55,341,954)
Cash and cash equivalents at end of the year 45 (711,015,042) (594,151,272) The annexed notes 1 to 52 form an integral part of these financial statements.
Teizoon Kisat Humayun MuradChief Executive Director

57
Statement of Changes in EquityFor the year ended June 30, 2015
Rupees
Balance as at July 1, 2013 820,529,300 448,603,499 762,900,000 377,761,296 7,656,936 (141,870,088) 313,078,500 2,588,659,443
Total comprehensive income for the year ended June 30, 2014 Profit for the year – – – 516,113,261 – – – 516,113,261 Other comprehensive income Exchange difference arising on translation of foreign associates - net of deferred tax – – – – – – (25,571,167) (25,571,167)Unrealised gain due to change in fair value of available for sale securities - net – – – – 2,081,805 – – 2,081,805 Net gain on hedging instruments – – – – – 83,779,535 – 83,779,535 Re-measurement of post employment benefit – – – (4,753,683) – – – (4,753,683) – – – (4,753,683) 2,081,805 83,779,535 (25,571,167) 55,536,490 Transactions with owner recorded directly in equity-distribution Cash dividend @ Rs.2.20 per ordinary share of Rs. 10.00 each for the year ended June 30, 2013 – – – (180,516,446) – – – (180,516,446)Transferred from surplus on revaluation of fixed assets on account of incremental depreciation – – – 3,027,386 – – – 3,027,386 Transfer to statutory reserve – – 103,100,000 (103,100,000) – – – – Balance as at June 30, 2014 820,529,300 448,603,499 866,000,000 608,531,814 9,738,741 (58,090,553) 287,507,333 2,982,820,134 Total comprehensive income for the year ended June 30, 2015 Profit for the year – – – 670,903,539 – – – 670,903,539 Other comprehensive income Exchange difference arising on translation of foreign associates - net of deferred tax – – – – – – 26,702,650 26,702,650 Unrealised gain due to change in fair value of available for sale securities - net – – – – 25,088,542 – – 25,088,542 Unrealised gain due to sale of available for sale securities transferred to profit and loss account – – – – (10,375,284) – – (10,375,284)Net unrealised loss on revaluation of investments classified as available for sale transferred to profit and loss account as impairment loss – – – – 3,114,225 – – 3,114,225 Net gain on hedging instruments – – – – – 23,058,707 – 23,058,707 Re-measurement of post employment benefit – – – (134,314) – – – (134,314) – – – (134,314) 17,827,483 23,058,707 26,702,650 67,454,526 Transactions with owner recorded directly in equity-distribution Cash dividend @ Rs.3.50 per ordinary share of Rs. 10.00 each for the year ended June 30, 2014 – – – (287,185,255) – – – (287,185,255)Transferred from surplus on revaluation of fixed assets on account of incremental depreciation – – – 3,027,384 – – – 3,027,384 Transfer to statutory reserve – – 33,545,177 (33,545,177) – – – – Balance as at June 30, 2015 820,529,300 448,603,499 899,545,177 961,597,991 27,566,224 (35,031,846) 314,209,983 3,437,020,328
The annexed notes 1 to 52 form an integral part of these financial statements.
Capital Reserves Revenue ReservesTotal
shareholders equity
Foreign currency
translation reserves
Hedging reserve
Unrealised (losses) / gains on investment
Unappropriated profit
Statutory reserve
Share premium
Issued, subscribed and paid-up capital
Teizoon Kisat Humayun MuradChief Executive Director
ANNUAL REPORT 2015 / ORIX Leasing Pakistan Limited58
Notes to the Financial StatementsFor the year ended June 30, 2015
1 LEGAL STATUS AND OPERATIONS
ORIX Leasing Pakistan Limited (“the Company”) was incorporated in Pakistan as a private limited company on July 1,1986 under the Companies Ordinance, 1984 and was converted into a public limited company on December 23, 1987. The Company is listed on the Karachi, Lahore and Islamabad Stock Exchanges. The registered office of the Company is situated at Islamic Chamber of Commerce Building, Clifton, Karachi. The Company is licensed to carry out leasing business as a Non-Banking Finance Company (NBFC) under the Non-Banking Finance Companies (Establishment and Regulations) Rules, 2003 (NBFC Rules) issued by the Securities and Exchange Commission of Pakistan (SECP).
1.1 Pakistan Credit Rating Agency Limited (PACRA) has assigned a long term credit rating of AA+ and a short term
credit rating of A1+ to the Company on January 15, 2015. 2 BASIS OF PREPARATION
2.1 Statement of compliance
These financial statements have been prepared in accordance with the approved accounting standards as applicable in Pakistan. The approved accounting standards comprise of such International Financial Reporting Standards (IFRS) issued by the International Accounting Standards Board and Islamic Financial Accounting Standards (IFAS) issued by the Institute of Chartered Accountants of Pakistan (ICAP) as are notified under the Companies Ordinance, 1984, the Non-Banking Finance Companies (Establishment and Regulations) Rules, 2003 (the NBFC Rules), the Non-Banking Finance and Notified Entities Regulations, 2008 (the NBFC Regulations) and the directives issued by the Securities and Exchange Commission of Pakistan (SECP). In case the requirements differ, the provisions of and directives issued under the NBFC Rules, the NBFC Regulations, the Companies Ordinance and the directives issued by the SECP prevail.
2.2 Basis of measurement
These financial statements have been prepared under the historical cost convention except for the following:
– Leasehold land and office building are stated at revalued amounts. – Derivative financial instruments are stated at fair value. – Financial instruments at fair value through profit or loss are measured at fair value. – Available for sale financial assets are valued at fair value. – Obligation in respect of gratuity schemes are measured at present value. – Financial assets classified as held to maturity are carried at amortised cost. – Non current assets classified as held for sale are valued at lower of cost and fair value. 2.3 Functional and presentation currency
Items included in these financial statements are measured using the currency of the primary economic environment in which the Company operates. These financial statements are presented in Pakistani Rupees which is the Company’s functional and presentation currency. All financial information presented in Pakistani Rupees has been rounded to the nearest rupee.
2.4 Critical accounting estimates and judgments
The preparation of financial statements in conformity with approved accounting standards, requires management to make judgments, estimates and assumptions that affect the application of policies and the reported amounts of assets, liabilities, income and expenses. The estimates and associated assumptions are based on historical experience and various other factors that are believed to be reasonable under the circumstances, the result of which form the basis of making the judgments about the carrying values of assets and liabilities that are not readily apparent from other sources. Actual results may differ from these estimates.
The estimates and underlying assumptions are reviewed on an on going basis. Revision to accounting estimates
are recognised in the period in which the estimates are revised if the revision affects only that period, or in the period of the revision and future periods if the revision affects both current and future periods.

59
Notes to the Financial StatementsFor the year ended June 30, 2015
In the process of applying the Company’s accounting policies, management has made the following estimates and judgments which are significant to the financial statements:
(a) determining the residual values and useful lives of property, plant and equipment (Note 3.1); (b) allowance for potential lease and other loan losses (Note 3.4); (c) classification of financial assets (Note 3.6); (d) valuation of derivatives (Note 3.11); (e) provisions (Note 3.15); (f) recognition of taxation and deferred tax (Note 3.17); (g) accounting for post employment benefits (Note 3.20); (h) employees compensated absences (Note 3.21); and (i) impairment (Note 3.22). 2.5 Standards, interpretations and amendments to published approved accounting standards that are
effective in the current year
There are certain amendments to the standards and new interpretations that are mandatory for the Company’s accounting periods beginning on or after July 1, 2014 but are considered not be to relevant or do not have any significant effect on the Company’s financial statements and are, therefore, not disclosed.
2.6 Standards, interpretations and amendments to published approved accounting standards that are not
yet effective
The Securities and Exchange Commission of Pakistan has, through its circular 633 (I) / 2014, adopted IFRS 10 effective January 1, 2015. This standard has introduced a new approach to determining which investees should be consolidated. The single model to be applied in the control analysis requires that an investor controls an investee when the investor is exposed, or has rights, to variable returns from its involvement with the investee and has the ability to affect those returns through its power over the investee. IFRS 10 has made consequential changes to IAS 27 which is now called ‘Separate Financial Statements’ and will deal with only separate financial statements.
There are other new and amended standards and interpretations that are mandatory for the Company’s
accounting periods beginning on or after July 1, 2015 but are considered not to be relevant or will not have any material effect on the Company’s financial statements and are, therefore, not disclosed.
3 SUMMARY OF SIGNIFICANT ACCOUNTING POLICIES
Significant accounting policies applied in the preparation of these financial statements are set forth below. These accounting policies have been applied consistently to all the years presented, unless otherwise specified.
3.1 Property, plant and equipment
Property, plant and equipment (except leasehold land and office buildings) are stated at cost less accumulated depreciation and impairment losses, if any. Leasehold land and office buildings are carried at revalued amounts less accumulated depreciation and subsequent impairment losses, if any. Cost includes expenditure that is directly attributable to the acquisition of the asset.
Subsequent costs are included in the asset’s carrying amount or recognised as a separate asset, as appropriate,
only when it is probable that future economic benefits associated with the item will flow to the entity and the cost of the item can be measured reliably. Cost incurred to replace a component of an item of property, plant and equipment is capitalised and the asset so replaced is retired from use. Cost incurred on overhaul of generators is depreciated over the enhanced useful lives of these generators. All other repairs and maintenance expenditure are charged to the profit and loss account during the period in which they are incurred.
Depreciation is charged using the straight line method over its estimated useful life, at the rates specified in
notes 4.1, 4.2 and 4.3 to the financial statements, after taking into account residual value, except for generators under operating lease assets which are depreciated on hourly usage basis. The carrying value of leasehold

ANNUAL REPORT 2015 / ORIX Leasing Pakistan Limited60
land is amortised over its lease term. Depreciation on additions is charged from the month the assets are available for use. No depreciation is charged in the month of disposal.
During the year, the Company has revised its estimate of the useful life of gas generators under the category of
operating lease assets. The effect of this change in accounting estimate is disclosed in note 4.2.1 Surplus arising on revaluation is credited to the surplus on revaluation of fixed assets account. Deficit arising on
subsequent revaluation of fixed assets is adjusted against the balance in the above mentioned surplus account as allowed under the provisions of the Companies Ordinance, 1984. The surplus on revaluation of fixed assets to the extent of incremental depreciation charged on the related assets is transferred to unappropriated profit.
An asset’s carrying amount is written down immediately to its recoverable amount if the asset’s carrying amount
is greater than its estimated recoverable amount. Gains / losses on disposal of fixed assets, if any, are taken to the profit and loss account in the period in which
they arise except that the related surplus on revaluation of fixed assets (net of deferred taxation) is transferred directly to unappropriated profit.
Assets having an indefinite useful life are stated at acquisition cost less accumulated impairment losses, if
any. The asset’s residual values, useful lives and methods are reviewed and adjusted, if appropriate, at each balance
sheet date. Ijarah assets
Rental from Ijarah arrangements are recognised in the profit and loss account on an accrual basis as and when rentals become due. Costs including depreciation, incurred in earning the Ijarah income are recognised as expense. Initial direct costs incurred specifically to earn revenues from Ijarah are recognised as an expense in the period in which they are incurred. The Ijarah assets are depreciated over the period of Ijarah on a straight line basis at the rates specified in note 4.3.
3.2 Intangible assets
Intangible assets having definite useful lives are stated at cost less accumulated amortisation and accumulated impairment losses, if any. Amortisation is charged as disclosed in note 5.3 applying the straight-line method over the useful lives of the assets. Amortisation is charged from the month in which the asset is available for use, while no amortisation is charged for the month in which the asset is disposed off. The useful lives are reviewed and adjusted, if appropriate, at each balance sheet date.
Subsequent costs are included in the asset’s carrying amounts or recognised as a separate asset, as
appropriate, only when it is probable that future economic benefits associated with the item will flow to the Company and the cost of the item can be measured reliably.
Gains and losses on disposals, if any, are taken to the profit and loss account in the period in which they
arise. 3.3 Net investment in finance lease
Leases in which the Company transfers substantially all the risks and rewards incidental to the ownership of an asset to the lessees are classified as finance leases. A receivable is recognised at an amount equal to the present value of the minimum lease payments, including any guaranteed residual value which are included in the financial statements as “net investment in finance leases”.
3.4 Allowance for potential lease and other loan losses
The allowance for potential lease and other loan losses is maintained at a level which, in the judgment of management, is adequate to provide for potential losses on lease and other loan portfolio which can be
Notes to the Financial StatementsFor the year ended June 30, 2015

61
reasonably anticipated. The allowance is increased by provisions charged to income and is decreased by charge offs, net of recoveries.
Calculating the allowance for potential lease and other loan losses is subject to numerous judgments and
estimates. In evaluating the adequacy of allowance, management considers various factors, including the requirements of the NBFC Regulations, the nature and characteristics of the obligor, current economic conditions, credit concentrations or deterioration in pledged collateral, historical loss experience and delinquencies. Lease and other loan receivables are charged off when, in the opinion of management, the likelihood of any future collection is believed to be minimal.
3.5 Assets classified as held for sale
The Company classifies a non-current asset as held for sale if its carrying amount will be recovered principally through a sale transaction rather than through continuing use.
A non-current asset held for sale is carried at the lower of its carrying amount and the fair value less costs to
sell. Impairment losses are recognised though the profit and loss account for any initial or subsequent write down of the non-current asset to fair value less costs to sell. Subsequent gains in fair value less costs to sell are recognised to the extent they do not exceed the cumulative impairment losses previously recorded. A non-current asset is not depreciated while classified as held for sale.
3.6 Financial assets
The Company classifies its financial assets into the following categories:
– at fair value through profit and loss – loans and receivables – held-to-maturity – available-for-sale
The classification depends on the purpose for which the financial assets were acquired. Management determines the classification of the financial asset at the time of initial recognition.
a) Financial assets at ‘fair value through profit and loss’
Investments are designated at ‘fair value through profit and loss’ if the Company manages such investments and makes purchase and sale decisions based on their fair values. These are initially recognised at fair value and transaction costs associated with these investments are taken directly to the profit and loss account. Investments at ‘fair value through profit and loss’ are marked to market using the closing market rates and are carried on the balance sheet at fair values. Net gains and losses arising on changes in the fair value of these investments are taken to the profit and loss account.
b) Loans and receivables
Loans and receivables are non-derivative financial assets with fixed or determinable payments that are not quoted in an active market. They are included in current assets, except for maturities greater than 12 months after the balance sheet date which are classified as non-current assets. Loans and receivables comprise of loans, advances, deposits, other receivables and cash and cash equivalents.
c) Held-to-maturity
Held to maturity investments are non-derivative financial instruments with fixed or determinable payments and fixed maturity that the Company has the positive intent and ability to hold to maturity. Investments intended to be held for an undefined period are not included in this classification. Investments that are intended to be held to maturity are recognised initially at cost plus attributable transaction costs. Subsequently, these are measured at amortised cost.
Gains and losses are recognised in income when the investments are derecognised or impaired. Premiums and discounts on held-to-maturity investments are amortised using the effective interest rate method and taken to profit and loss from investments.
Notes to the Financial StatementsFor the year ended June 30, 2015

ANNUAL REPORT 2015 / ORIX Leasing Pakistan Limited62
d) Available-for-sale Other financial assets not covered in any of the above categories are classified as being available for sale. All financial assets classified as ‘available-for-sale’ are initially recognised at cost, being the fair value of the
consideration given including acquisition charges. After initial recognition, financial assets which are classified as ‘available-for-sale’ are remeasured at fair value.
Gains or losses on ‘available-for-sale’ investments are recognised directly in equity through other comprehensive income until the investment is sold, derecognised or is determined to be impaired, at which time the cumulative gain or loss previously reported in other comprehensive income is included in the profit and loss account.
For financial assets that are actively traded in organised financial markets, fair value is determined by reference
to stock exchange quoted market bids at the close of business on the balance sheet date. Unquoted financial assets, where the fair value cannot be reliably determined, are recognised at cost less
impairment, if any. Provision for impairment in value, if any, is taken to income currently. 3.6.1 Impairment The Company assesses at the end of each reporting period whether there is any objective evidence that its
financial assets are impaired. When there is an objective evidence that an impairment loss has been incurred, the amount of loss is measured as follows:
a) Held-to-maturity
The amount of the loss is measured as the difference between the asset’s carrying amount and the present value of estimated future cash flows (excluding future credit losses that have not been incurred) discounted at the investment’s original effective interest rate. The carrying amount of the asset is reduced and the amount of the loss is recognised in the profit and loss account.
If, in a subsequent period, the amount of the impairment loss decreases and the decrease can be related
objectively to an event occurring after the impairment was recognised (such as an improvement in the debtor’s credit rating) the reversal of the previously recognised impairment loss is recognised in the profit and loss account.
b) Available-for-sale
Impairment loss in respect of investments classified as available for sale is recognised based on management’s assessment of objective evidence of impairment as a result of one or more events that may have an impact on the estimated future cash flows of the investments. A significant or prolonged decline in the fair value of a listed equity investment below its cost is also considered an objective evidence of impairment. In case of impairment of available for sale securities, the cumulative loss that has been recognised directly in surplus / deficit on revaluation of securities on the statement of financial position is removed therefrom and recognised in the profit and loss account.
3.7 Financial instruments
All financial assets and financial liabilities are recognised at the time when the Company becomes a party to the contractual provisions of the instrument. Financial assets are derecognised when the Company loses control of the contractual rights that comprise the financial assets. Financial liabilities are derecognised when they are extinguished, that is, when the obligation specified in the contract is discharged, cancelled, or expires. Any gain or loss on derecognition of the financial assets and financial liabilities is taken to income currently.
3.8 Offsetting of financial assets and financial liabilities
Financial assets and financial liabilities are set off and the net amount is reported in the financial statements only when the Company has a legally enforceable right to set off and the Company intends to either settle on a net basis, or to realise the assets and to settle the liabilities simultaneously. Income and expense items of such assets and liabilities are also offset and the net amount is reported in the financial statements only when permitted by the approved accounting standards as applicable in Pakistan.
Notes to the Financial StatementsFor the year ended June 30, 2015

63
3.9 Regular way Contracts
All “regular way” purchases and sales of financial assets are recognised on settlement date, i.e. the date on which the asset is delivered to or by the Company.
3.10 Investment in associates - equity method
The Company’s investment in its associates is accounted for under the equity method of accounting where an associate is an entity in which the Company has significant influence and which is neither a subsidiary nor a joint venture.
Under the equity method, the investment in the associate is carried in the balance sheet at cost plus post- acquisition changes in the Company’s share of net assets of the associate. Goodwill relating to an associate is included in the carrying amount of the investment and is not amortised. After application of the equity method, the Company determines whether it is necessary to recognise any additional impairment loss with respect to the Company’s net investment in the associate. The income statement reflects the share of the results of operations of the associate. Where there has been a change recognised directly in the equity of the associate, the Company recognises its share of any changes and discloses this, when applicable, in the statement of changes in equity.
Associates’ accounting policies conform to those used by the Company for like transactions and events in
similar circumstances. 3.11 Derivative financial instruments and hedging activities
The Company uses derivative financial instruments to hedge its risks associated with interest rate and foreign currency fluctuations. Derivatives are initially recognised at fair value on the date a derivative contract is entered into and the attributable transaction costs are recognised in the profit and loss account when incurred. Subsequent to initial recognition, derivatives are remeasured at fair value. Derivatives are carried as assets when the fair value is positive and as liabilities when the fair value is negative.
The method of recognising the resulting gain or loss depends on whether the derivative is designated as a
hedging instrument, and if so, the nature of the item being hedged. Any gains or losses arising from changes in fair values on derivatives during the year that do not qualify for
hedge accounting are taken directly to profit and loss account. The fair value of unquoted derivatives, if any, is determined by discounted cash flows using appropriate interest
rates applicable to the underlying asset. The Company designates certain derivatives as either:
(a) hedges of the fair value of recognised assets or liabilities or a firm commitment (fair value hedge); or
(b) hedges of a particular risk associated with a recognised asset or liability or a highly probable forecast
transaction (cash flow hedge) The Company documents at the inception of the transaction the relationship between hedging instruments
and hedged items, as well as its risk management objectives and strategy for undertaking various hedge transactions. The Company also documents its assessment, both at hedge inception and on an ongoing basis, of whether the derivatives that are used in hedging transactions are highly effective in offsetting changes in fair values or cash flows of hedged items.
(a) Fair value hedge
Changes in the fair value of derivatives that are designated and qualify as fair value hedges are recognised in profit and loss, together with any changes in the fair value of the hedged asset or liability
Notes to the Financial StatementsFor the year ended June 30, 2015

ANNUAL REPORT 2015 / ORIX Leasing Pakistan Limited64
that are attributable to the hedged risk. The gain or loss attributable to the hedged risk is recognised in profit and loss and adjust the carrying amount of the hedged item.
If the hedge no longer meets the criteria for hedge accounting, the adjustment to the carrying amount
of a hedged item for which the effective interest method is used is amortised to profit and loss over the period to maturity.
(b) Cash flow hedge
The effective portion of changes in the fair value of derivatives that are designated and qualify as cash flow hedge is recognised in equity through other comprehensive income. The gain or loss relating to the ineffective portion is recognised immediately in the profit and loss account.
When a hedging instrument expires or is sold, or when a hedge no longer meets the criteria for
hedge accounting, any cumulative gain or loss existing in equity at that time remains in equity and is recognised when the forecast transaction is ultimately recognised in the profit and loss account. When a forecast transaction is no longer expected to occur, the cumulative gain or loss that is reported in equity is immediately transferred to the profit and loss account.
3.12 Long term finances and loans
Long term finances and loans are initially recognised at cost being the fair value of consideration received together with the associated transaction costs. Subsequently, these are carried at amortised cost using the effective interest rate method.
Transaction costs relating to long term finance are being amortised over the period of agreement using the effective interest rate method.
3.13 Foreign currency transactions
Foreign currency transactions are translated into Pakistan rupees at exchange rates prevailing at the date of transaction. Monetary assets and liabilities in foreign currencies are translated at the rates of exchange which approximate those prevailing on the balance sheet date. Gains and losses on translation are taken to income currently except for difference arising on translation of equity accounted undertakings which are recognised directly in equity through other comprehensive income. Non-monetary items that are measured in terms of historical cost in a foreign currency are translated using the exchange rate as at the date of the initial transaction. Non-monetary items measured at fair value in a foreign currency are translated using the exchange rate at the date when the fair value was determined.
3.14 Certificates of Deposit
Return on Certificates of Deposits (CODs) issued by the Company is recognised on a time proportionate basis taking into account the relevant CODs issue date and final maturity date.
3.15 Provisions
Provisions are recognised when the Company has a present legal or constructive obligation as a result of past events and it is probable that an outflow of resources embodying economic benefits will be required to settle the obligation and a reliable estimate can be made of the amount of the obligation. Provisions are reviewed at each balance sheet date and are adjusted to reflect the current best estimates.
3.16 Proposed dividend and transfer between reserves
Dividends and appropriations to reserves, except appropriations which are required by law, made subsequent to the balance sheet date are considered as non-adjusting events and are recorded in the financial statements
Notes to the Financial StatementsFor the year ended June 30, 2015

65
in accordance with the requirements of International Accounting Standard (IAS) 10, ‘Events after the Balance Sheet Date’ in the year in which they are approved / transfers are made.
3.17 Taxation
Income tax expense comprises current and deferred tax. Income tax expense is recognised in the profit and loss account except to the extent that it relates to items recognised directly in equity, in which case it is recognised in equity through other comprehensive income.
Current
Provision for current taxation is based on taxable income for the year. Tax charge for the current year is determined in accordance with the prevailing laws for taxation. The charge for the current tax is calculated using tax rates enacted or substantively enacted at the balance sheet date. The charge for the current tax also includes adjustments relating to prior years, if necessary, arising from assessments finalised during the year.
Deferred
Deferred tax is recognised using the balance sheet liability method on all temporary differences between the carrying amounts of assets and liabilities used for financial reporting purposes and amounts used for taxation purposes. In addition, the Company also records deferred tax asset on available tax losses. Deferred tax is calculated using the rates that are expected to apply to the period when the differences reverse based on tax rates that have been enacted or substantively enacted by the balance sheet date.
A deferred tax asset is recognised only to the extent that it is probable that future taxable profits will be available
against which the asset can be utilised. Deferred tax asset is reduced to the extent that it is no longer probable that the related tax benefits will be realised.
The Company also recognises deferred tax asset / liability on deficit / surplus on revaluation of securities /
fixed assets which is adjusted against the related deficit / surplus in accordance with the requirements of International Accounting Standard (IAS-12) Income Taxes.
3.18 Revenue recognition
Finance leases
The Company follows the ‘financing method’ in accounting for recognition of finance lease. The total unearned finance income i.e. the excess of aggregate installment contract receivables plus residual value over the cost of the leased asset is deferred and then amortised over the term of the lease, so as to produce a systematic return on the net investment in finance leases.
Revenue from finance leases is not accrued when rent is past due by ninety days or more. Front end fee and other lease related income is recognised as income on receipt basis. Operating lease income
Rental income from assets classified as operating lease is recognised on an accrual basis. Ijarah lease income
Rental from Ijarah arrangements are recognised in profit and loss on accrual basis as and when rentals become due.
Notes to the Financial StatementsFor the year ended June 30, 2015

ANNUAL REPORT 2015 / ORIX Leasing Pakistan Limited66
Return on investments
Return on debt securities is recognised using the effective interest rate method. Dividend income from investments is recognised when the Company’s right to receive the dividend is
established. Gain / loss on sale of investments is taken to income in the period in which it arises. Loans and finances
Income on term loans and finances are recognised on a time proportion basis taking into account the principal / net investment outstanding and applicable rates of profit thereon except in case of loans classified under the NBFC Regulations on which income is recognised on receipt basis.
Interest / mark-up on rescheduled / restructured advances and investments is recognised in accordance with
the NBFC Regulations. Others
Income from reverse repurchase transactions is recognised on a time proportion basis. 3.19 Cash and cash equivalents
Cash and cash equivalents comprise cash balances and call deposits. Bank overdrafts that are repayable on demand and form an integral part of the Company’s cash management are included as a component of cash and cash equivalents for the purpose of the statement of cash flows.
3.20 Staff retirement benefits
(a) Defined contribution plan
The Company operates a recognised contributory Provident Fund Scheme (the Fund) for all its permanent employees who have completed the minimum qualifying period of six months service. The Fund is administered by a Board of Trustees. Equal monthly contributions to the Fund are made both by the Company and by the employees, at the rate of 10% of basic salary.
(b) Defined benefit plan
The Company operates an approved funded Gratuity Scheme covering all permanent employees who have completed the qualifying period under the scheme. The scheme is administered by a Board of Trustees and contributions therein are made in accordance with the actuarial recommendations. The valuation in this regard is carried out at each balance sheet date, using the Projected Unit Credit Method for the valuation of the scheme.
Remeasurement gains and losses arising from experience adjustments and changes in actuarial
assumptions are recognised in other comprehensive income when they occur with no subsequent recycling through the profit and loss account.
3.21 Employees compensated absences
The Company provides for unavailed compensated absences for all its permanent employees on the basis of actuarial advice under the Projected Unit Credit Method. Remeasurement gains and losses pertaining to long term compensated absences are recognised in profit and loss account immediately.
Notes to the Financial StatementsFor the year ended June 30, 2015

67
3.22 Impairment
The carrying amount of assets is reviewed at each balance sheet date for impairment whenever events or changes in circumstances indicate that the carrying amounts of the assets may not be recoverable. If such indication exists, and where the carrying value exceeds the estimated recoverable amount, assets are written down to their recoverable amount. The resulting impairment loss is taken to the profit and loss account.
3.23 Segment reporting
Operating segments are reported in a manner consistent with the internal reporting structure. Management monitors the operating results of its business units separately for the purpose of making decisions regarding resource allocation and performance assessment. Segment results, assets and liabilities includes items directly attributable to segment as well as those that can be allocated on a reasonable basis.
4 PROPERTY, PLANT AND EQUIPMENT Note 2015 2014 Rupees
Fixed assets - own use 4.1 392,126,268 388,821,912 Fixed assets - on operating lease 4.2 1,184,613,802 1,231,865,683 Fixed assets - Ijarah finance 4.3 185,071,406 146,015,495
1,761,811,476 1,766,703,090
4.1 Fixed assets - own use 2015
Cost / Revalued Amount Accumulated depreciation /
Net book value amortisation As at As at As at Charge for As at As at July 1, June 30, July 1, the year / (on June 30, June 30, 2014 2015 2014 disposals) 2015 2015 Rupees
Leasehold land 152,412,237 – 152,412,237 8,440,717 1,640,160 10,080,877 142,331,360 77 & 99 years Office building 112,634,044 – 112,634,044 24,888,161 5,884,224 30,772,385 81,861,659 5% Stock Exchange rooms 15,700,000 – 10,500,000 7,700,000 – 5,000,000 5,500,000 Indefinite life (5,200,000) (2,700,000) Leasehold improvements 84,893,755 5,551,116 76,536,880 60,717,890 10,213,581 58,414,279 18,122,601 15% (13,907,991) (12,517,192) Furniture, fittings and office equipment 76,764,387 20,306,287 94,860,885 53,553,836 7,494,565 59,245,662 35,615,223 15% - 25% (2,209,789) (1,802,739) Vehicles 145,371,425 36,345,600 157,130,374 50,788,214 17,942,110 53,955,824 103,174,550 20% - 25% 1,250,000 * – (25,836,651) (14,774,500) Computers and accessories 32,677,356 2,838,120 34,576,478 25,542,474 4,441,325 29,055,603 5,520,875 33% (938,998) (928,196) 620,453,204 65,041,123 638,650,898 231,631,292 47,615,965 246,524,630 392,126,268 1,250,000 * – (48,093,429) (32,722,627)
* Represents assets transferred to own used assets from finance lease.
Description
Notes to the Financial StatementsFor the year ended June 30, 2015
Additions / (disposals) Rate / years

ANNUAL REPORT 2015 / ORIX Leasing Pakistan Limited68
2014
Cost / Revalued Amount Accumulated depreciation /
Net book value amortisation As at Additions/ As at As at Charge for the As at As at Rate / July 1, (disposals)/ June 30, July 1, year/(on disposals) June 30, June 30, years 2013 (write-off) 2014 2013 / (writeoff) 2014 2014 Rupees
Leasehold land 152,412,237 – 152,412,237 6,800,557 1,640,160 8,440,717 143,971,520 77 & 99 years
Office building 112,148,494 485,550 112,634,044 19,003,937 5,884,224 24,888,161 87,745,883 5%
Stock Exchange rooms 15,700,000 – 15,700,000 7,700,000 – 7,700,000 8,000,000 Indefinite life
Leasehold improvements 115,515,859 221,872 84,893,755 79,924,359 11,637,507 60,717,890 24,175,865 15%
(30,843,976) (30,843,976)
Furniture, fittings and office equipment 69,234,558 12,351,794 76,764,387 50,190,048 7,178,574 53,553,836 23,210,551 15% - 25%
(4,821,965) (3,814,786)
Vehicles 144,962,755 24,054,621 145,371,425 46,349,682 18,426,600 50,788,214 94,583,211 20% - 25%
(23,645,951) (13,988,068)
Computers and accessories 30,206,367 4,564,872 32,677,356 24,135,196 3,501,161 25,542,474 7,134,882 33%
(2,093,883) (2,093,883)
640,180,270 41,678,709 620,453,204 234,103,779 48,268,226 231,631,292 388,821,912
(30,561,799) (19,896,737)
(30,843,976) (30,843,976)
Description
4.1.1 The latest revaluation of leasehold land and office building was carried out under market value basis by an independent professional valuer on June 30, 2011. The revaluation was carried out by M/s. SURVAL, resulting in a surplus of Rs. 133.86 million over their book values. This has been carried to surplus on revaluation of leasehold land and office building.
Had the revaluation not been carried out, costs, accumulated depreciation and written down value of leasehold land and office building thereon would have been as follows:
2015
Cost
Accumulated Book depreciation value
Rupees Leasehold land 54,399,300 5,975,628 48,423,672 Office building 76,781,580 22,768,101 54,013,479
131,180,880 28,743,729 102,437,151 2014
Cost
Accumulated Book depreciation value
Rupees Leasehold land 54,399,300 5,361,780 49,037,520 Office building 76,781,580 18,884,949 57,896,631
131,180,880 24,246,729 106,934,151 4.1.2 Included in cost of fixed assets - own use are fully depreciated items which are still in use aggregating to Rs.
104.85 million (2014: Rs. 67.14 million).
Notes to the Financial StatementsFor the year ended June 30, 2015

69
4.1.3 Details of fixed assets - own use, disposed during the year are as follows:
Accumulated Book Sale Mode of
Description Cost depreciation
value proceeds disposal Particulars of buyers
/ impairment
Rupees
Stock Exchange rooms 5,200,000 2,700,000 2,500,000 1,825,000 Negotiation Mr. Naeem Rafi 5,200,000 2,700,000 2,500,000 1,825,000
Leasehold improvements 13,907,991 12,517,192 1,390,799 1,000,000 Negotiation Iceberg Industries 13,907,991 12,517,192 1,390,799 1,000,000
Furniture, fittings and office equipment Book value not exceeding Rs. 50,000 each 2,209,789 1,802,739 407,050 573,033 Various Various 2,209,789 1,802,739 407,050 573,033
Vehicles 1,800,000 1,170,000 630,000 890,474 Company policy Mr. Amjad Iqbal, Employee 1,477,500 487,575 989,925 1,192,978 Company policy Mr. Tahir Ali Shah, Employee 1,419,000 425,700 993,300 1,188,390 Company policy Mr. Khawar Sultan, Employee 1,323,000 716,625 606,375 1,032,100 Company policy Mr. Jawaid Akhtar, Employee 990,000 346,500 643,500 784,698 Company policy Mr. M. Naveed Siddiqui, Employee 970,000 375,875 594,125 805,263 Company policy Mr. Asrar ul Hassan Alvi, Employee 938,000 593,578 344,422 689,453 Company policy Mr. Shujaat Ali Shah, Employee 916,000 553,894 362,106 719,805 Company policy Mr. Latafat Anwar, Employee 868,000 585,900 282,100 497,939 Company policy Mr. Nadeem Amir Ali, Employee 868,000 585,900 282,100 449,300 Company policy Mr. Shahzad Rana Younus, Employee 819,000 518,700 300,300 407,962 Company policy Mr. Adnan Ishaq, Employee 819,000 627,900 191,100 413,962 Company policy Mr. Sameer Mir, Employee 801,000 643,825 157,175 157,175 Company policy Ms. Nosheen Iqbal, Employee 715,000 482,625 232,375 366,500 Company policy Mr. Muhammad Tahir Abdullah, Employee 709,000 567,200 141,800 146,790 Company policy Mr. Sajid Pervaiz Cheema, Employee 707,000 483,075 223,925 377,100 Company policy Mr. Syed Amjad Ali, Employee 612,000 237,150 374,850 504,989 Company policy Mr. Muhammad Anwar, Employee 625,000 211,979 413,021 565,000 Insurance claim EFU Insurance Company Limited 379,000 208,450 170,550 245,000 Insurance claim New Jubilee Insurance Company 1,494,500 463,295 1,031,205 1,100,000 Negotiation Mr. Ahmed Khan Joyea 970,000 424,375 545,625 755,000 Negotiation Mr. Ali Hassan Malik 965,000 422,188 542,812 790,000 Negotiation Mr. Zaheer Abbas Malik 880,500 484,275 396,225 855,000 Negotiation Mr. Humayun Habib 658,000 264,942 393,058 540,006 Negotiation Mr. Abdul Sattar Book value not exceeding Rs. 50,000 each 3,113,151 2,892,974 220,177 173,512 Various Various 25,836,651 14,774,500 11,062,151 15,648,396
Computers and accessories Book value not exceeding Rs. 50,000 each 938,998 928,196 10,802 51,502 Various Various 938,998 928,196 10,802 51,502
48,093,429 32,722,627 15,370,802 19,097,931
Notes to the Financial StatementsFor the year ended June 30, 2015

ANNUAL REPORT 2015 / ORIX Leasing Pakistan Limited70
4.2 Fixed assets - on operating lease 2015 Cost Accumulated depreciation Net book value As at As at As at Charge for As at As at July 1, June 30, July 1, the year/ June 30 June 30 (on disposal) , , Rate
2014 2015 2014 2015 2015 Rupees
Generators 1,596,827,532 121,080,472 1,679,628,212 473,602,148 147,570,650 588,792,289 1,090,835,923 number (38,279,792) (32,380,509) of hours Generator Accessories 123,081,558 200,000 122,993,994 67,489,455 13,514,323 80,716,214 42,277,780 10% - 50% (287,564) (287,564) Communication equipment 391,589,921 18,683,834 410,273,755 344,204,999 18,239,173 362,444,172 47,829,583 15% - 33% Vehicles 8,283,000 – 7,587,500 2,619,726 1,633,416 3,916,984 3,670,516 33% (695,500) (336,158) 2,119,782,011 139,964,306 2,220,483,461 887,916,328 180,957,562 1,035,869,659 1,184,613,802 (39,262,856) (33,004,231)
2014 Cost Accumulated depreciation Net book value As at Additions/ As at As at As at As at July 1, (disposals)/ June 30, July 1, June 30 June 30 , , Rate
2013 transfer 2014 2013 2014 2014 Rupees
Generators 1,360,649,903 280,400,000 1,596,827,532 405,684,735 111,708,728 473,602,148 1,123,225,384 number
21,000,000* – of hours
(65,222,371) (43,791,315)
Generator Accessories 87,641,191 37,932,257 123,081,558 58,117,814 11,261,902 67,489,455 55,592,103 10% - 50%
(2,491,890) (1,890,261)
Communication equipment 444,690,694 32,399,230 391,589,921 411,750,961 17,844,791 344,204,999 47,384,922 15% - 33%
(85,500,003) (85,390,753)
Vehicles 6,843,000 1,440,000 8,283,000 856,874 1,762,852 2,619,726 5,663,274 33%
1,899,824,788 352,171,487 2,119,782,011 876,410,384 142,578,273 887,916,328 1,231,865,683
21,000,000* –
(153,214,264) (131,072,329)
* Represents assets transferred to operating lease assets from finance lease.
4.2.1 During the year the management of the Company has revised its estimate of the useful life of gas generators and pattern of recording depreciation for generators on operating lease. The initial life of gas generators has been reduced from 37,500 hours to 35,000 hours and depreciation on gas generators is being calculated on actual hours instead of fixed hours. The revisions in estimates have been made after taking into account the occurrences of top overhaul of the gas generators and pattern of usage of gas generators. The revision has been accounted for as a change in accounting estimates as defined in International Accounting Standard 8, ‘Accounting Policies, Changes in Accounting Estimates and Errors’. Had these revisions not been made, depreciation expense included in ‘Direct cost of lease’ would have been lower by Rs. 15.19 million and consequently profit before tax would have been higher by the same amount.
Description
Description
Notes to the Financial StatementsFor the year ended June 30, 2015
Additions / (disposals)
Charge for the year /
(on disposal)

71
4.2.2 Details of fixed assets - on operating lease, disposed during the year are as follows:
Cost
Accumulated Book Sale Mode of Particulars of depreciation value proceeds disposal buyers
Rupees
Generators 22,597,267 18,092,726 4,504,541 11,000,000 Negotiation Orient Textile Mills Limited
8,059,361 8,059,361 - 3,481,323 Negotiation G & Co industrial engineering and
services (Pvt) Ltd
6,825,728 5,617,167 1,208,561 6,400,000 Negotiation Procter & Gamble
Pakistan Limited
1,085,000 898,819 186,181 468,677 Negotiation G & Co industrial engineering and
services (Pvt) Ltd
38,567,356 32,668,073 5,899,283 21,350,000
Vehicles 695,500 336,158 359,342 556,400 Insurance EFU Insurance
Claim
695,500 336,158 359,342 556,400 39,262,856 33,004,231 6,258,625 21,906,400
Description
Description
4.2.3 Included in cost of fixed assets - operating lease are fully depreciated items which are still in use aggregating to Rs. 400.67 million (2014: Rs. 356.65 million).
4.3 Fixed assets - Ijarah finance 2015 Cost Accumulated depreciation Net book value As at As at As at Charge for As at As at July 1, June 30, July 1, the year/ June 30, June 30, Rate 2014 2014 2014 (on disposals) 2015 2015 Rupees
Machinery & Generators 122,252,000 99,094,000 204,508,000 34,882,567 50,462,994 68,507,561 136,000,439 Underlying (16,838,000) (16,838,000) lease term Vehicles 128,422,580 35,166,800 113,887,640 69,776,518 40,832,090 64,816,673 49,070,967 Underlying (49,701,740) (45,791,935) lease term 250,674,580 134,260,800 318,395,640 104,659,085 91,295,084 133,324,234 185,071,406 (66,539,740) (62,629,935)
2014 Cost Accumulated depreciation Net book value As at As at As at Charge for As at As at July 1, June 30, July 1, the year/ June 30, June 30, Rate 2013 2014 2013 (on disposals) 2014 2014 Rupees
Machinery & Generators 63,622,000 89,015,000 122,252,000 12,744,685 34,396,771 34,882,567 87,369,433 Underlying
(30,385,000) (12,258,889) lease term
Vehicles 112,545,580 34,157,000 128,422,580 32,928,613 43,564,572 69,776,518 58,646,062 Underlying
(18,280,000) (6,716,667) lease term
176,167,580 123,172,000 250,674,580 45,673,298 77,961,343 104,659,085 146,015,495
(48,665,000) (18,975,556)
Notes to the Financial StatementsFor the year ended June 30, 2015
Description
Additions / (disposals)
Additions / (disposals)

ANNUAL REPORT 2015 / ORIX Leasing Pakistan Limited72
Description
Description
5 INTANGIBLE ASSETS Note 2015 2014 Rupees
Trading Right Entitlement Certificate (TREC) - KSEL 5.1 – 15,000,000 Trading Right Entitlement Certificate (TREC) - LSEL 5.2 – 1,236,430
– 16,236,430 Less: Impairment of TREC – 16,236,430 Computer software and license 5.3 8,631,456 10,894,523
8,631,456 10,894,523 5.1 During the current period, the Company has disposed off the Trading Rights Entitlement Certificate (TREC) - KSEL and
4,007,350 shares of Karachi Stock Exchange for an aggregate amount of Rs 43.5 million (refer note 13).
5.2 Lahore Stock Exchange (LSE) Trading right entitlement certificate (TREC) stands lapsed after expiry of two years from demutualisation of LSE as notified by LSE vide its notice no. 709 dated February 1, 2013. Accordingly, the balance has been written off against provision thereof in the current year.
5.3 Computer software and license 2015 Cost Accumulated amortization Net book value As at As at As at As at As at July 1, Additions June 30, July 1, June 30, June 30, Rate 2014 2015 2014 2015 2015 Rupees
Computer software and license 83,830,580 2,471,260 86,301,840 72,936,057 4,734,327 77,670,384 8,631,456 36-80 months
83,830,580 2,471,260 86,301,840 72,936,057 4,734,327 77,670,384 8,631,456
2014 Cost Accumulated amortization Net book value As at As at As at As at As at July 1, Additions June 30, July 1, June 30, June 30, Rate 2013 2014 2013 2014 2014 Rupees
Computer software and license 82,350,780 1,479,800 83,830,580 64,898,185 8,037,872 72,936,057 10,894,523 36-80 months
82,350,780 1,479,800 83,830,580 64,898,185 8,037,872 72,936,057 10,894,523
5.4 The amortisation expense for the year has been allocated as follows:
Note 2015 2014 Rupees
Administrative and general expenses 36 1,427,300 4,273,192 Direct cost of leases 37 3,307,027 3,764,680
4,734,327 8,037,872
Notes to the Financial StatementsFor the year ended June 30, 2015
Charge for the year
Charge for the year

73
6 NET INVESTMENT IN FINANCE LEASE
Note 2015 2014 Rupees
Installment contract receivables 17,062,648,835 14,737,639,373 Residual value 6,808,120,022 5,871,678,313 Initial direct costs – 2,170,847
6.1 23,870,768,857 20,611,488,533 Less: Unearned finance income 3,046,820,480 2,836,823,547
20,823,948,377 17,774,664,986
6.1 Details of investment in finance lease
Gross investments in Present value of investment finance lease in finance lease
2015 2014 2015 2014
Rupees
Less than one year 9,228,479,570 9,228,479,570 8,746,722,525 7,679,925,643 One to five years 14,642,289,287 11,331,049,556 12,077,225,852 10,052,156,127 Over five years – 51,959,407 – 42,583,216
23,870,768,857 20,611,488,533 20,823,948,377 17,774,664,986
6.2 The Company’s implicit rate of return on leases ranges between 11.25% and 25.00% (2014: 14.50% and 26.00%) per annum. These are secured against leased assets and security deposits generally upto 23.00% (2014: upto 23.00%) of the cost of leased assets.
6.3 Based on the NBFC Regulations, the aggregate net exposures in finance leases against which income
suspension is required amounted to Rs. 673 million (2014: Rs. 759 million). 6.4 Lease rentals received during the year aggregate to Rs. 8,536 million (2014: Rs. 7,576 million).
7 INVESTMENT IN ASSOCIATED UNDERTAKINGS
Note 2015 2014 Rupees
Related parties Investment in equity accounted undertakings 7.1 2,176,352,899 1,701,150,417
Notes to the Financial StatementsFor the year ended June 30, 2015

ANNUAL REPORT 2015 / ORIX Leasing Pakistan Limited74
7.1 The breakup of carrying value of investments in equity accounted undertakings is as follows: 2015 2014 Note 2015 2014 Number of shares Rupees
Quoted
Oman ORIX Leasing 28,099,946 27,281,501 Company SAOG 7.1.2 1,077,858,593 892,968,834 1,077,858,593 892,968,834 Unquoted
1,375,000 850,000 Saudi ORIX Leasing Company 516,256,056 376,243,669 90,000 45,000 Al Hail ORIX Finance PSC 300,191,268 166,184,980 920,000 920,000 ORIX Leasing Egypt SAE 282,046,982 257,152,943 8,750 8,750 SK Leasing JSC 7.1.6 16,443,654 25,043,645 Less: Impairment 16,443,654 16,443,654 – 8,599,991 1,098,494,306 808,181,583 2,176,352,899 1,701,150,417
7.1.1 Oman ORIX Leasing Company SAOG, Saudi ORIX Leasing Company, Al Hail ORIX Finance PSC and ORIX Leasing Egypt SAE are accounted for as equity accounted undertakings due to the significant influence of the Company.
7.1.2 Market value of quoted investment in equity accounted undertaking is as follows: 2015 2014 Rupees
Oman ORIX Leasing Company SAOG 1,114,541,211 1,027,765,026
7.1.3 Includes 1,374 shares at Riyal Omani (R.O) 0.1/- each (2014: 1,333 shares at (R.O) 0.1/- each) held in the name of a Director in the investee Company. The aggregate carrying value of these shares is Rs. 0.053 million (2014: Rs. 0.044 million).
7.1.4 Summarised un-audited financial statements of equity accounted undertakings are as follows:
Date As at June For the period July 1, of 30, 2015 2014 to June 30, 2015 Interest financial Total Total Revenues Profit/ held year end assets liabilities (loss) 2015 Rupees Quoted
Oman ORIX Leasing Company SAOG 31 December 40,130,525,041 31,492,870,273 3,987,784,015 1,340,752,555 11.64%
Unquoted
Saudi ORIX Leasing Company 31 December 60,883,891,714 39,972,094,757 6,931,796,948 3,160,819,805 2.50% Al Hail ORIX Finance PSC 31 December 33,565,970,531 23,631,148,871 3,005,421,538 785,801,133 3.00% ORIX Leasing Egypt SAE 31 December 8,387,175,455 7,160,837,868 1,016,328,968 150,616,994 23.00%
Name
Notes to the Financial StatementsFor the year ended June 30, 2015

75
Name
Date As at June For the period July 1, of 30, 2014 2013 to June 30, 2014 Interest financial Total Total Revenues Profit/ held year end assets liabilities (loss) 2014 Rupees Quoted
Oman ORIX Leasing Company SAOG 31 December 33,542,565,549 25,873,622,120 3,309,412,451 1,066,460,160 11.64%
Unquoted
Saudi ORIX Leasing Company 31 December 54,012,527,205 38,719,324,534 6,396,620,228 3,037,213,007 2.50%
Al Hail ORIX Finance PSC 31 December 22,478,048,704 16,941,327,253 2,181,629,046 850,728,472 3.00%
ORIX Leasing Egypt SAE 31 December 7,634,541,937 6,516,680,737 974,432,528 85,103,829 23.00%
7.1.5 The Company has board representation in all associated companies. It also provides them technical assistance.
7.1.6 The Company has suspended recognising share of profit on their investment in SK Leasing JSC under equity
accounting and has recognised impairment loss due to significant impediments in repatriation of capital / investment.
8 LONG TERM INVESTMENTS
Note 2015 2014 Rupees
Held-to-maturity investments Pakistan investment bonds (PIBs) 8.1 14,404,648 13,906,241 Term finance certificates (TFCs) - Unlisted 8.2 3,265,627 3,265,627 17,670,275 17,171,868 Less: Provision for potential losses on investments 38.2 3,265,627 3,265,627
14,404,648 13,906,241 8.1 This investment has been made as required under Regulation 14(4)(i) of the Non Banking Finance Companies
and Notified Entities Regulations, 2008 to maintain liquidity against certificates of deposit. This is redeemable within a period of 3 years (2014: 4 years) from the balance sheet date, carrying coupon rate of 9.60% (2014: 9.60%) per annum due half yearly from the date of issue.
8.2 This represents investment made by the Company in unlisted Term Finance Certificates (TFCs). The exposure
against these TFCs has been fully provided.
Notes to the Financial StatementsFor the year ended June 30, 2015

ANNUAL REPORT 2015 / ORIX Leasing Pakistan Limited76
9 LONG TERM FINANCES AND LOANS
Note 2015 2014 Rupees
Considered good
Related parties - secured
Executives 9.1 & 9.3 56,639,852 60,297,919 Others Agri finance - secured 9.2 17,065,065 26,105,139 Employees - secured 9.3 42,859,039 39,408,537 Micro finance 9.4 20,791,813 13,806,662 Musharakah finance - secured 9.5 50,935,714 53,633,223 Term finance - secured 9.6 26,250,003 25,059,101 Vehicle finance - secured 9.7 1,884,094,058 1,752,796,516 2,041,995,692 1,910,809,178 2,098,635,544 1,971,107,097 Considered doubtful
Others
Agri finance - secured 9.2 16,218,817 13,786,368 Micro finance 9.4 395,283 473,357 Term finance - secured 9.6 195,008,867 200,722,729 Vehicle finance - secured 9.7 38,641,500 11,452,306 250,264,467 226,434,760 Less: Allowance for potential loan losses 38.1 250,264,467 226,434,760 – – Less: Current maturity Related parties 22,082,909 21,958,183 Others 1,197,296,263 1,207,942,889 12 1,219,379,172 1,229,901,072 879,256,372 741,206,025
9.1 Reconciliation of outstanding amount of loans to Executives Opening balance 60,297,919 59,996,481 Disbursements 7,093,360 11,352,982 Repayments (10,751,427) (11,051,544) 56,639,852 60,297,919
9.2 This represents long term finance offered to farmers on mark-up basis. The rate of return on these loans ranges between 15.00% and 28.00% (2014: 15.00% and 28.00%) per annum. These loans are repayable within a period of 1 year to 3 years (2014: 1 year to 3 years) and are secured against title documents of immovable property and hypothecation of personal assets.
9.3 This includes housing loans given in accordance with the terms of the Company’s employment policy and are
repayable within a period of 20 years or retirement date whichever is the earlier. Housing loans are secured against equitable mortgage on the property by deposit of title documents of the property with the Company and carry mark-up at 5.00% (2014: 5.00%) per annum. Loans to Executives and other employees (other than housing loan) carry mark-up rates upto 15.00% (2014: upto 15.00%) per annum, secured against their retirement benefits and are repayable within a period of five years.
Maximum amount outstanding at the end of any month during the year against loans to Executives was Rs.
66.90 million (2014: Rs. 66.38 million).
Notes to the Financial StatementsFor the year ended June 30, 2015

77
9.4 This represents long term micro loans offered to individuals and women entrepreneurs on mark-up basis. The rate of return on these loans ranges between 28.00% and 36.00% (2014: 32.00% and 36.00%) per annum. These are secured against personal guarantees of community organisations and are repayable within a period of 1.5 years (2014: 1.5 years).
9.5 This represents musharakah facilities provided to customers. The rate of return on these finances ranges
between 12.20% and 21.00% (2014: 14.60% and 22.00%) per annum. The facilities have a repayment term of 3 to 4 years (2014: 3 to 4 years) and are secured by assets subject to musharakah agreement.
9.6 This represents term finance facility provided to customers on mark-up basis. The mark-up on these finances
ranges between 15.00% and 20.00% (2014: 15.00% and 20.00%) per annum. These finances are repayable within a period of 2 years to 5 years (2014: 2 years to 5 years) and are secured against charge over fixed assets, trade receivables, lien on certificates of investment, personal guarantees of directors and hypothecation of stocks.
9.7 This represents vehicle financing facility provided to customers on markup basis. The mark-up on these
finances ranges between 11.38% and 25.00% (2014: 14.70% and 25.00%) per annum. These finances are repayable within a period of 2 years to 5 years (2014: 2 years to 5 years) and are secured against charge over vehicles and personal guarantees of individuals.
10 SHORT TERM FINANCES Note 2015 2014 Rupees
Considered good
Agri finance - secured 10.1 4,956,966 1,177,330 Micro finance 10.2 365,578,117 286,671,503 Term finance - secured 10.3 36,830,238 19,828,098
407,365,321 307,676,931
Considered doubtful
Agri finance - secured 9,116,074 13,809,974 Factoring finance – 9,925,107 Micro finance 3,988,639 3,868,392 Term finance - secured 123,707,326 125,032,257 136,812,039 152,635,730 Less: Allowance for potential losses 38.1 136,812,039 152,635,730 – –
407,365,321 307,676,931 10.1 This represents short term finance offered to farmers on mark-up basis. The mark-up on these loans ranges
between 17.00% and 28.00% (2014: 13.00% and 28.00%) per annum. These are secured against title documents of immovable property and hypothecation of personal assets and are recoverable within twelve months.
10.2 This represents short term micro loans offered to individuals and women entrepreneurs on mark-up basis.
The mark-up on these loans ranges between 20.00% and 38.00% (2014: 21.00% and 38.00%) per annum. These are secured against personal guarantees of community organisations and are recoverable within twelve months.
10.3 This represents term finance facilities provided to customers on mark-up basis in the normal course of business.
The mark-up on these finances ranges between 10.50% and 18.00% (2014: 13.50% and 18.00%) per annum. These finances are recoverable between one and twelve months and are secured against charge over fixed assets, trade receivables, hypothecation of stocks and lien over certificates of deposit.
Notes to the Financial StatementsFor the year ended June 30, 2015

ANNUAL REPORT 2015 / ORIX Leasing Pakistan Limited78
11 ACCRUED RETURN ON INVESTMENTS AND TERM FINANCE
Note 2015 2014 Rupees
Investments 30,280,365 28,584,109 Term finance and loans 44,503,334 39,482,520
74,783,699 68,066,629
12 CURRENT MATURITY OF NON-CURRENT ASSETS
Current maturity of: Net investment in finance lease 6.1 8,746,722,525 7,679,925,643 Long term finances and loans 9 1,219,379,172 1,229,901,072
9,966,101,697 8,909,826,715
13 SHORT TERM INVESTMENTS
Held-to-maturity investments
Certificates of deposit 13.1 708,602 2,135,606
At fair value through profit and loss
Treasury bills 13.2 463,531,798 392,145,186 Term finance certificates (TFCs) 13.3 18,992,047 29,150,837 Units of open ended mutual funds – 22,951,280 Units of closed end mutual funds – 31,481,769 482,523,845 475,729,072 Available-for-sale
Pakistan investment bonds (PIBs) 13.4 616,133,538 546,092,416 Ordinary shares 5.1 & 13.5 & 13.6 15,285,526 56,661,084 Units of open ended mutual funds – 16,248,870 Units of closed end mutual funds – 704,419 631,419,064 619,706,789
Loans and receivables
Fund placements 13.7 334,183 1,007,179 Less: Allowance for potential losses 38.2 9,043,312 10,642,785
1,105,942,382 1,087,935,861
13.1 These represent investments in short term certificates of deposit for a period of 1 year (2014: 1 year). Full provision has been made against these investments.
13.2 These represent investments made as required under Regulation 14(4)(i) of the NBFC Regulations to maintain
liquidity against certificates of deposit. These are redeemable within a period of 12 months (2014: 12 months) from the balance sheet date. These carry yields ranging from 6.73% to 8.33% (2014: 9.99%)
13.3 These represent investments made by the Company in Term Finance Certificates (TFCs). These investments
carry mark-up upto 6 months KIBOR + 2.4% (2014: upto 6 month KIBOR + 2.4%). 13.4 This represent investments made as required under Regulation 14(4)(i) of the NBFC Regulations to maintain
liquidity against certificates of deposit. These are highly liquid and can be sold in the secondary market at any time. These carry yield ranging from 8.90% to 11.97% (2014: 11.80% to 11.96%).
Notes to the Financial StatementsFor the year ended June 30, 2015

79
13.5 These include shares of Lahore Stock Exchange Limited (LSEL) received by the Company in pursuance of Stock Exchanges (Corporatisation, Demutualisation and Integration) Act, 2012 (The Act). The total number of shares received by the Company are 843,975 with a face value of Rs. 10 each. These include 506,385 (60% shares) which are required to be held in separate Central Depository Company (CDC) blocked account to restrict the sale of these shares by the members, whereas, stock exchanges will dispose of these shares under the Act. However, the proceeds of these shares and right to dividend / bonus is vested with members while the voting rights attached to these shares are suspended.
In the absence of an active market, these shares have been carried at their face value of Rs. 10 each.
13.6 This includes shares of Burj Bank Limited against which impairment loss of Rs 3.1 million (2014: Nil) has been recognised.
13.7 This represents placements of Rs. 0.3 million (2014: Rs. 1.0 million) against which full provision has been made. 14 ADVANCES AND PREPAYMENTS
Note 2015 2014 Rupees
Advances - unsecured 20,199,538 28,667,408 Prepayments Insurance - leased assets 2,561,808 3,063,007 - own assets 266,944 1,100,026 Rent 10,431,361 6,554,299 Others 13,526,619 8,374,042 26,786,732 19,091,374
46,986,270 47,758,782 15 OTHER RECEIVABLES
Considered good Operating lease rentals receivable 56,189,345 73,701,268 Fair value of hedging instrument 15,539,862 51,722,892 Others 2,783,836 2,219,064
74,513,043 127,643,224 Considered doubtful Operating lease rentals receivable 33,824,885 7,574,294 Receivable from equity brokerage customers 39,438,514 47,142,607 Others 4,041,668 – 77,305,067 54,716,901
Less: Allowance for potential losses 38.2 77,305,067 50,433,253
74,513,043 131,926,872 16 CASH AND BANK BALANCES
Cash in hand 1,321,720 1,356,482 With banks on: - Current accounts 124,759,908 40,690,330 - Deposit accounts 16.1 47,204,724 58,437,010 171,964,632 99,127,340
173,286,352 100,483,822
16.1 These carry markup rates ranging from 3.00 % to 5.50 %. (2014: 6.25% to 8.00%).
Notes to the Financial StatementsFor the year ended June 30, 2015

ANNUAL REPORT 2015 / ORIX Leasing Pakistan Limited80
17 ASSETS CLASSIFIED AS HELD FOR SALE
Note 2015 2014 Rupees
Repossessed assets 17.1 3,547,810 1,241,089 Investment in associated undertaking 17.2 87,754,399 87,754,399
91,302,209 88,995,488 17.1 This represents repossessed leased assets consisting of vehicles, machinery and other equipment, previously
leased out to customers. The Company intends to dispose of these assets to recover the balance amount outstanding against such leases.
17.2 The management intends to divest the Company’s investment in OPP (Private) Limited, subject to necessary
regulatory approvals. 18 ISSUED, SUBSCRIBED AND PAID-UP CAPITAL
2015 2014 2015 2014 Number of shares Rupees Ordinary shares of Rs. 10/- each 49,355,892 49,355,892 Fully paid in cash 493,558,920 493,558,920 30,544,364 30,544,364 Fully paid bonus shares 305,443,640 305,443,640 Fully paid shares against 2,152,674 2,152,674 amalgamation 21,526,740 21,526,740
82,052,930 82,052,930 820,529,300 820,529,300
18.1 As at June 30, 2015, ORIX Corporation, Japan and its nominees held 40,693,564 (2014: 40,693,564) ordinary shares equivalent to 49.59% (2014 : 49.59%) of the total shareholding.
19 SURPLUS ON REVALUATION OF LEASEHOLD LANDAND OFFICE BUILDING
Note 2015 2014 Rupees Opening balance 124,783,252 127,810,638 Adjustment in respect of incremental depreciation transferred to retained earnings (3,027,384) (3,027,386)
121,755,868 124,783,252
Opening balance of deferred tax liability (43,674,136) (44,733,721) Adjustment on transfer of incremental depreciation to retained earnings 1,059,587 1,059,585 Adjustment for reversal of deferred tax liability on surplus on revaluation of leasehold land 19.1 32,867,689 – 24 (9,746,860) (43,674,136)
112,009,008 81,109,116 19.1 The Company had recognised deferred tax liability on surplus arising on revaluation of land based on the view
that gain arising on ultimate sale of land will be a taxable event. During the current year, based on professional tax advice, the management has concluded that sale of land by the Company will not attract tax consequences under the local laws. Accordingly, the related deferred tax liability has been reversed.
Notes to the Financial StatementsFor the year ended June 30, 2015

81
20 LONG TERM FINANCES - secured Note 2015 2014 Rupees
Long term finances utilised under mark-up arrangements - financial institutions 20.1 & 20.2 8,033,455,235 5,788,433,398
8,033,455,235 5,788,433,398 Less: Unamortised transaction cost 31,503,031 11,853,207 Less: Current maturity 30 3,294,389,094 2,629,978,162 3,325,892,125 2,641,831,369
4,707,563,110 3,146,602,029 20.1 These finances have been obtained for financing of lease operations and are secured by hypothecation of
leased assets, related lease receivables and operating lease assets. The mark-up rate thereon ranges between 7.91% to 12.23% (2014: 11.15% to 14.10%) per annum. These finances are repayable within a period of 18 to 60 months (2014: 18 to 60 months).
20.2 This includes an amount of Rs.1,000 million outstanding from a bank which has been hedged by an interest rate swap under a cash flow hedge accounting model.
21 LONG TERM LOANS
Commencement
Name of lending institution Note of repayment 2015 2014 Rupees
Secured
Citibank Japan Limited, Jan 31, 2008 14 equal semi annual US$ six month – 352,678,586
Syndicated loan instalments LIBOR+0.675%
Pakistan Poverty Alleviation 21.1 Jun 28, 2013 11 quarterly instalments KIBOR+1.50% 120,299,248 241,363,500
Fund (PPAF)
Unsecured
ECO Trade & Development Bank 21.2 Jan 7, 2013 7 equal semi annual US$ six month 290,571,518 564,285,800
instalments LIBOR+1.50%
Total long term loans 410,870,766 1,158,327,886
Less: Unamortised transaction cost – 1,836,122
Less: Current maturity 30 410,870,766 876,184,966
– 280,306,798
21.1 Loans from PPAF have been obtained to finance small scale and micro enterprises. These loans are secured
against hypothecation of book debts and receivables created out of PPAF financing.
21.2 This is a foreign currency facility of US$ 10 million and is hedged by a cross currency swap and interest rate swap with a financial institution.
Notes to the Financial StatementsFor the year ended June 30, 2015
Mode of loan Repayment Rate %

ANNUAL REPORT 2015 / ORIX Leasing Pakistan Limited82
22 LONG TERM CERTIFICATES OF DEPOSIT - unsecured Note 2015 2014 Rupees
Certificates of deposit 22.1 6,038,910,491 5,292,933,903 Less: Current maturity 30 921,967,140 1,645,516,348
5,116,943,351 3,647,417,555 22.1 These represent long term certificates of deposit, issued at expected rates of profit ranging between 7.13%
and 15.50% (2014: 10.00% and 15.50%) per annum. These certificates of deposit have been issued for terms ranging between 2 years and 10 years (2014: 2 years and 10 years).
23 LONG TERM DEPOSITS Note 2015 2014 Rupees
Security deposit on finance lease 23.1 6,804,332,299 5,863,317,444 Less: Repayable / adjustable within 12 months 30 1,566,589,081 1,380,024,359 5,237,743,218 4,483,293,085 Others 1,025,000 1,025,000
5,238,768,218 4,484,318,085 23.1 These represent deposits received from lessees under finance lease contracts, adjustable at the expiry of the
lease periods.
24 DEFERRED TAXATION Note 2015 2014 Rupees
The deferred tax liability is attributable to the following items: - Accelerated tax depreciation 948,250,235 1,111,784,038 - Surplus on revaluation of office building 19 9,746,860 43,674,136 - Unamortised transaction costs relating to long term finances and loans 11,026,049 4,791,265 - Unrealised gain on investment 11,418,181 158,389 - Share of profit of associates 355,782,300 258,755,243 - Allowance for potential loan losses (173,686,925) (149,690,844) - Tax losses (708,821,434) (838,231,082) - Capital loss - (36,102,094)
453,715,266 395,139,051
25 OTHER LONG TERM LIABILITIES Note 2015 2014 Rupees
Profit on certificates of deposit 25.1 268,234,514 247,588,070 25.1 This represent profit on Certificates of Deposit payable on maturity.
Notes to the Financial StatementsFor the year ended June 30, 2015

83
26 TRADE AND OTHER PAYABLES Note 2015 2014 Rupees
Creditors 374,980,738 276,352,506 Accrued liabilities 97,121,041 76,621,845 Other liabilities Advances from customers against finance lease and Ijarah finance 42,286,202 36,214,766 Insurance payable 49,836,268 40,437,540 Unclaimed dividend 7,241,495 5,547,270 Grant from donors 26.1 - 1,295,498 Worker’s Welfare Fund 42,720,352 33,500,000 Others 9,058,551 10,221,546 Fair value of hedging instrument 17,857,389 -
169,000,257 127,216,620
641,102,036 480,190,971 26.1 This grant was received from Pakistan Poverty Alleviation Fund (PPAF) as assistance towards expenses
incurred in developing and sustaining the micro finance program. 2015 2014 Rupees
Opening balance 1,295,498 1,295,498 Amount charged during the year (1,295,498) -
Closing balance - 1,295,498
27 ACCRUED INTEREST / MARK-UP ON LOANS, FINANCES AND CERTIFICATES OF DEPOSIT 2015 2014 Rupees
Interest / mark-up / profit on Long term finances 152,380,390 141,967,047 Long term loans 19,973,394 49,400,083 Short term borrowings 13,959,012 14,241,877 Certificates of deposit 132,663,877 248,120,347
318,976,673 453,729,354
28 SHORT TERM BORROWINGS Note 2015 2014 Rupees
From Banking Companies Running finance arrangements - secured 28.1 884,301,394 694,635,094 Short term loans - secured 28.2 - -
884,301,394 694,635,094 28.1 The short term running finance facilities available from commercial banks amounted to Rs. 1,825 million at June 30,
2015 (2014: Rs. 1,625 million). The rate of mark-up ranges between 7.56% and 9.50% (2014: 11.14% and 11.67%) on a daily product basis. These are secured by hypothecation of leased assets and related lease receivables.
Notes to the Financial StatementsFor the year ended June 30, 2015

ANNUAL REPORT 2015 / ORIX Leasing Pakistan Limited84
28.2 Short term loan facilities totalling Rs. 1,750 million (2014: Rs. 1,000 million) from financial institutions are also available to the Company for the period of 3 months on roll-over basis upto one year and carry mark-up rates ranging between KIBOR + 0.5% to KIBOR + 1.25% (2014: KIBOR + 1.25%). Out of the above, facilities amounting to Rs. 1,250 million are secured by hypothecation of specific lease-assets and related receivables.
29 SHORT TERM CERTIFICATES OF DEPOSIT - unsecured
Note 2015 2014 Rupees
Unsecured 29.1 944,348,226 1,019,234,608
29.1 These represent short term certificates of deposit issued at expected rates of profit, ranging between 6.78%
and 9.63% (2014: 8.5% and 11.39%) per annum for terms of 1 to 12 months (2014: 1 to 12 months).
30 CURRENT MATURITY OF NON-CURRENT LIABILITIES
Note 2015 2014 Rupees
Current maturity of: Long term finances 20 3,294,389,094 2,629,978,162 Long term loans 21 410,870,766 876,184,966 Long term certificates of deposit 22 921,967,140 1,645,516,348 Long term deposits 23 1,566,589,081 1,380,024,359
6,193,816,081 6,531,703,835
31 CONTINGENCIES AND COMMITMENTS 31.1 In November 2011, the Company received a show cause notice from the Large Taxpayers Unit of the
Federal Board of Revenue (FBR) Karachi as to why Federal Excise Duty (FED) on mark-up and other income for the years ended June 30, 2008, 2009 and 2010 amounting to Rs. 1,126 million along with applicable penalty and default surcharge should not be recovered from the Company. The Company’s legal advisor is of the opinion that charging of FED on mark-up based income is unlawful and the Company has filed a suit before the Honorable High Court of Sindh challenging levy of FED on mark-up income. The Honorable High Court of Sindh has passed an order suspending the operation of the said notice until the next hearing and no hearing has taken place since then. Management, based on the merit of the case,
consider that decision will be in the Company’s favor hence no provision has been made in this regard.
31.2 The Additional Commissioner Inland Revenue (ACIR) passed an amended assessment order under section
122(5A) of the Income Tax Ordinance 2001(the Ordinance), dated July 25, 2013 for the tax year 2010 and created a demand of Rs. 313 million. The said Order has been subject to appeal process, rectification and revision. The Commissioner Inland Revenue (Appeals) (CIR-A) has decided most of the issues in favour of the Company. After taking the effects of decisions by (CIR-A) on the appeals the initial demand of Rs.313 million has been reduced to Rs.167 million.
The Company has filed an appeal before the Appellate Tribunal Inland Revenue (ATIR) on the issues which
were decided against the Company by the CIR-A which is pending for adjudication.
Notes to the Financial StatementsFor the year ended June 30, 2015

85
The Company has paid minimum tax of Rs. 45.48 million and Rs. 50.78 million for the tax years 2007 and 2008 respectively under section 113 of the Ordinance. These amounts have been recognised as current tax expense for the respective financial years. In the opinion of the Company it is entitled to carry forward the sum of the above minimum tax adjustment against the income tax demand for the tax year 2010.
Based on the merit of the case, management is confident that the decision will be in the Company’s favor
therefore no provision has been made in these financial statements. 31.3 Leasing and ijarah contracts committed but not executed at the balance sheet date amounted to Rs. 28 million
(2014: Rs. 11 million).
32 INCOME FROM OPERATING LEASE 2015 2014 Rupees
Communication Equipments 235,995,043 266,787,890 Generators and Vehicles 546,238,148 578,841,036 Islamic Finance 117,763,525 107,002,597
899,996,716 952,631,523 33 OTHER INCOME - NET Note 2015 2014 Rupees
From financial assets Return on investments and deposits 4,911,906 13,493,052 Interest income on government securities 106,874,788 20,352,219 Dividend income 566,639 3,044,898 Capital gain on sale of investment 75,690,780 68,937,032 Unrealised gain on remeasurement of financial assets at fair value through profit and loss 5,424,860 5,770,291 Gain on fair value hedging instruments 33.1 10,904,427 22,238,542 Exchange (loss) on long term borrowings 33.2 (10,904,427) (22,238,542) 193,468,973 111,597,492 From assets other than financial assets Other fees and income 40,246,285 40,711,789 Exchange gain / (loss) on dividend received 3,622 (1,672,802) Documentation fee 34,853,353 29,733,641 Gain on disposal of fixed assets 19,917,864 17,569,191 Gain on sale of leased assets 22,350,875 25,964,794 Other exchange (loss) / gain - net (116,609) 341,464
117,255,390 112,648,077
310,724,363 224,245,569 33.1 This represents unrealised gains on cross currency swap transactions entered into with a commercial bank
(note 21.2). 33.2 This represents loss on account of revaluation of long term foreign currency loans (note 21.2) which have been
hedged by the Company through cross currency swaps.
Notes to the Financial StatementsFor the year ended June 30, 2015

ANNUAL REPORT 2015 / ORIX Leasing Pakistan Limited86
34 SHARE OF PROFIT OF EQUITY ACCOUNTED UNDERTAKINGS
2015 2014 Associates Share of Associates Share of Note profit associates profit /(loss) associates after tax profit after tax profit/(loss) after tax after tax Rupees
Quoted
Oman ORIX Leasing Company SAOG 1,340,752,555 156,086,391 1,066,460,160 124,154,092
Un-Quoted
Saudi ORIX Leasing Company 3,160,819,805 60,845,782 3,037,213,007 58,466,350
Al Hail ORIX Finance PSC 785,801,133 23,574,034 850,728,472 25,521,854
ORIX Leasing Egypt SAE 150,616,994 34,641,907 85,103,829 19,573,881
OPP (Private) Limited 17.2 – – (10,436,409) (4,696,384)
4,097,237,932 119,061,723 3,962,608,899 98,865,701
5,437,990,487 275,148,114 5,029,069,059 223,019,793
35 FINANCE COST 2015 2014 Rupees
Interest / mark-up on
- Long term finances 706,887,984 616,604,346
- Long term loans 55,131,461 144,186,940
- Short term borrowings 106,348,750 64,099,866
- Certificates of deposit 816,643,147 784,403,341
Amortisation of transaction costs 18,427,591 27,766,243
Bank charges and commission 24,249,819 21,318,404
1,727,688,752 1,658,379,140
Name of associates
Notes to the Financial StatementsFor the year ended June 30, 2015

87
36 ADMINISTRATIVE AND GENERAL EXPENSES
Note 2015 2014 Rupees
Salaries, allowances, welfare and training 36.1 511,052,688 451,221,610
Rent and utilities 84,940,601 85,470,739
Travelling 14,672,043 11,258,432
Vehicle running and maintenance 40,909,538 42,630,135
Insurance on operating assets 9,217,057 8,283,105
Legal and professional charges 36,042,123 19,921,035
Communication 24,036,522 22,838,720
Subscriptions 2,344,208 1,994,505
Auditors’ remuneration 36.3 2,010,250 1,836,000
Advertising 7,429,020 7,531,917
Printing and stationery 8,509,524 8,034,162
Depreciation 4.1 47,615,965 48,268,226
Amortisation 5.4 1,427,300 4,273,192
Office repairs and maintenance of equipment 28,354,007 30,626,229
Donations 36.4 5,041,300 4,134,870
Office general expenses 8,260,727 6,918,099
831,862,873 755,240,976
36.1 Includes following employee benefits
Defined benefit plan - gratuity fund 36.2.5 11,999,521 12,539,156
Defined contributory plan - provident fund 20,724,772 18,580,821
Compensated absences 7,334,193 6,400,014
40,058,486 37,519,991
36.2 DEFINED BENEFIT PLAN - STAFF RETIREMENT GRATUITY
36.2.1 General description
The Company operates a funded gratuity scheme which was established under the provisions of the trust deed
dated July 1, 2004 for its permanent staff who have completed the qualifying period under the scheme. The
funded scheme is administered by the Board of Trustees in accordance with the provisions of the Trust Deed.
Contributions therein are made in accordance with actuarial recommendations. The most recent valuation in
this regard was carried out as at June 30, 2015, using the Projected Unit Credit Method for valuation of the
scheme.
The disclosures made in notes 36.2.2 to 36.2.11 are based on the information included in the actuarial report
of the Company as of June 30, 2015.
Notes to the Financial StatementsFor the year ended June 30, 2015

ANNUAL REPORT 2015 / ORIX Leasing Pakistan Limited88
36.2.2 The amounts recognised in the balance sheet are as follows: Note 2015 2014 Rupees
Present value of defined benefit obligation 36.2.4 161,024,331 135,189,600 Fair value of plan assets 36.2.4 (160,175,134) (131,270,153)
849,197 3,919,447 36.2.3 Plan assets consist of the following:
2015 2014 Rupees % Rupees %
Government Securities 157,043,534 98.04% 116,187,388 88.51% Debt Securities - Listed - 0.00% 6,799,886 5.18% Mutual Funds - 0.00% 1,996,150 1.52% Shares of listed companies 250,000 0.16% 250,000 0.19% Term deposits and cash and bank balances 2,881,600 1.80% 6,036,729 4.60%
160,175,134 100.00% 131,270,153 100.00%
36.2.4 The movement in the defined benefit obligation over the year is as follows: 2015
Present value Fair value of Total of obligation plan assets
Rupees
At July 1 135,189,600 (131,270,153) 3,919,447 Current service cost 12,478,258 - 12,478,258 Interest expense / (income) 17,273,209 (17,751,946) (478,737)
164,941,067 (149,022,099) 15,918,968 Remeasurements: - Interest on plan assets, excluding amounts included in interest expense / (income) - (586,481) (586,481) - Experience losses 720,795 - 720,795 720,795 (586,481) 134,314 165,661,862 (149,608,580) 16,053,282 Contribution - (15,204,085) (15,204,085) Benefit payments (4,637,531) 4,637,531 -
At June 30 161,024,331 (160,175,134) 849,197
Notes to the Financial StatementsFor the year ended June 30, 2015

89
2014
Present value Fair value of Total of obligation plan assets
Rupees
At July 1 (Restated) 119,719,825 (90,634,056) 29,085,769 Current service cost 11,596,414 - 11,596,414 Interest expense / (income) 13,744,382 (12,801,640) 942,742
145,060,621 (103,435,696) 41,624,925 Remeasurements: - Interest on plan assets, excluding amounts included in interest expense / (income) - 4,258,092 4,258,092 - Experience losses 495,591 - 495,591
495,591 4,258,092 4,753,683
145,556,212 (99,177,604) 46,378,608 Contribution - (42,459,161) (42,459,161) Benefit payments (10,366,612) 10,366,612 -
At June 30 (Restated) 135,189,600 (131,270,153) 3,919,447
36.2.5 Charge for defined benefit plan 2015 2014 Rupees
Current service cost 12,478,258 11,596,414 Net return cost (478,737) 942,742
11,999,521 12,539,156 The plan assets and defined benefit obligations are based in Pakistan.
2015 2014
36.2.6 Principal actuarial assumptions
- Discount rate 10.5% 13%
- Expected rate of increase in salary 10.5% 13%
- Expected rate of return on plan assets 10.5% 13%
- Average working life of employees 36.5 years 36 years
36.2.7 Assumptions regarding future mortality are set based on actuarial advice in accordance with published statistics and experience in Pakistan. The rates assumed are based on the SLIC 2001 - 2005 ultimate mortality tables.
Notes to the Financial StatementsFor the year ended June 30, 2015

ANNUAL REPORT 2015 / ORIX Leasing Pakistan Limited90
36.2.8 The sensitivity of the defined benefit obligation to changes in the weighted principal assumptions is:
Impact on defined benefit obligation
Change in Increase in Decrease in assumption assumption assumption
Rupees
Discount rate 1.0% 143,691,753 180,065,372 Salary growth rate 1.0% 178,261,540 144,860,933
Increase by 1 Decrease by 1 year in year in assumption assumption
Rupees
Life expectancy 160,974,518 160,675,992 Increase by 10% Decrease by 10% in assumption in assumption Rupees
Withdrawal rate 159,844,989 160,860,348 The above sensitivity analyses are based on a change in an assumption while holding all other assumptions
constant. When calculating the sensitivity of the defined benefit obligation to significant actuarial assumptions the same method (present value of the defined benefit obligation calculated with the projected unit credit method at the end of the reporting period) has been applied as when calculating the gratuity liability recognised within the Balance Sheet.
36.2.9 The weighted average duration of the defined benefit obligation is 12.61 years.
36.2.10 Historical results
2015 2014 2013 2012 2011 Rupees
Present value of defined benefit obligation 161,024,331 135,189,600 119,719,825 107,274,477 93,040,813 Fair value of plan assets (160,175,134) (131,270,153) (90,634,056) (88,283,364) (98,896,827)
Deficit / (Surplus) 849,197 3,919,447 29,085,769 18,991,113 (5,856,014)
Remeasurements of plan liabilities 720,795 495,591 3,097,965 (2,629,553) 2,663,731
Remeasurements of plan assets 586,481 (4,258,092) (7,467,483) (24,560,759) 15,653,129
36.2.11 Funding levels are monitored on an annual basis and are based on actuarial recommendations. Contribution for the next year works out to Rs.12,488,958 as per the actuarial valuation report of the Company as of June 30, 2015.
Notes to the Financial StatementsFor the year ended June 30, 2015

91
36.2.12 Through its defined benefit gratuity plan, the Fund is exposed to a number of risks, the most significant of which
are detailed below:
The plan liabilities are calculated using a discount rate set with reference to corporate bond yields; if plan assets underperform this yield, this will create a deficit. The Fund believes that due to long-term nature of the plan liabilities and the strength of the Company’s support, the current investment strategy manages this risk adequately.
A decrease in corporate bond yields will increase plan liabilities.
The majority of the plans’ benefit obligations are linked to inflation, and higher
inflation will lead to higher liabilities. However, the Fund manages plan assets to off set inflationary impacts.
The majority of the plans’ obligations are to provide benefits on severance with the
Company or on achieving retirement. Any change in life expectancy / withdrawal
rate would impact plan liabilities.
36.3 Auditors’ remuneration
2015 2014 Rupees
Annual audit fee 1,200,000 910,000 Fee for special certification including half yearly review fee 500,000 490,000 Tax and other services 110,250 286,000 Out of pocket expenses 200,000 150,000
2,010,250 1,836,000
36.4 Directors or their spouse have no interest in any of the donees other than Marie Adelaide Leprosy Centre where
a Director of the Company, Mr. Humayun Murad, is acting as a board member. The amount of donation made to the Centre is Rs. Nil (2014: Rs. 250,000).
37 DIRECT COST OF LEASE Note 2015 2014 Rupees
Court fee, stamp duty and others 11,134,318 8,102,541 Operating lease
Maintenance and insurance 335,259,399 349,928,735 Depreciation - operating lease assets 4.2 180,957,562 142,578,273 Depreciation - ijarah finance 4.3 91,295,084 77,961,343 Amortisation of intangible assets 5.4 3,307,027 3,764,680
610,819,072 574,233,031 621,953,390 582,335,572
Life expeciancy /Withdrawal rate
Inflation risk
Changes in bondyields
Asset volatility
Notes to the Financial StatementsFor the year ended June 30, 2015

ANNUAL REPORT 2015 / ORIX Leasing Pakistan Limited92
38 ALLOWANCE FOR POTENTIAL LEASE AND OTHER LOAN LOSSES 2015
Finance Finance Sub Operating lease,
leases and loans total
investments and Total other receivables
Rupees Balance at beginning of the year 759,020,567 379,070,490 1,138,091,057 97,021,749 1,235,112,806 Provision made during the year - net 103,743,853 17,931,123 121,674,976 25,272,341 146,947,317 Write offs (141,388,424) (9,925,107) (151,313,531) (16,236,430) (167,549,961)
721,375,996 387,076,506 1,108,452,502 106,057,660 1,214,510,162
2014
Finance Finance Sub Operating lease,
leases and loans total
investments and Total other receivables
Rupees Balance at beginning of the year 766,942,528 428,803,193 1,195,745,721 63,592,675 1,259,338,396 Provision made during the year - net 112,802,621 24,077,597 136,880,218 33,429,074 170,309,292 Write offs (120,724,582) (73,810,300) (194,534,882) - (194,534,882)
759,020,567 379,070,490 1,138,091,057 97,021,749 1,235,112,806
38.1 Provision against finances and loans
Note 2015 2014 Rupees
Long term finances and loans 9 250,264,467 226,434,760 Short term finances and loans 10 136,812,039 152,635,730
387,076,506 379,070,490
38.2 Provision against other receivables, investments and intangible Note 2015 2014 Rupees
Trading Right Entitlement Certificate (TREC) 5 - 16,236,430 Impairment on equity accounted undertaking 7.1 16,443,654 16,443,654 Long term investments 8 3,265,627 3,265,627 Short term investments 13 9,043,312 10,642,785 Other receivables 15 77,305,067 50,433,253
106,057,660 97,021,749
Notes to the Financial StatementsFor the year ended June 30, 2015

93
39 OTHER PROVISIONS - NET 2015 2014 Rupees
Operating lease, investments, other receivables and intangibles Provision for diminution in value of TREC - 16,236,430 Provision for other receivables 26,871,814 1,253,363 (Reversal) for potential losses on investments - net (1,599,473) (504,373) Impairment on equity accounted undertaking - 16,443,654 25,272,341 33,429,074 Impairment Impairment on available for sale securities 3,114,225 - Others Provision for workers welfare fund 17,500,000 13,500,000
45,886,566 46,929,074
40 REMUNERATION OF CHIEF EXECUTIVE, DIRECTORS AND EXECUTIVES
The aggregate amount charged in the financial statements for the year in respect of the remuneration and benefits to the Chief Executive, Directors and Executives are as follows:
2015 Chief Executive Executive Total Rupees
Managerial remuneration and allowances 21,814,650 166,380,847 188,195,497 House rent and utilities 6,237,600 50,945,139 57,182,739 Retirement benefits 3,471,471 20,041,534 23,513,005 31,523,721 237,367,520 268,891,241 Number of persons 1 95 96
2014 Chief Executive Executive Total Rupees
Managerial remuneration and allowances 18,237,000 136,849,267 155,086,267 House rent and utilities 5,268,000 43,474,680 48,742,680 Retirement benefits 2,383,981 17,972,841 20,356,822
25,888,981 198,296,788 224,185,769 Number of persons 1 83 84
40.1 Executives mean employees, other than the Chief executive and Directors, whose basic salary exceeds five hundred thousand rupees in a financial year.
40.2 The Chief Executive and certain Executives are also provided with Company owned and maintained cars and
other benefits in accordance with their entitlement as per Company policy. 40.3 Aggregate amount charged in these financial statements includes meeting fees paid to 4 non-executive
directors amounting to Rs. 910,000 (2014: 3 non-executive Directors Rs. 425,000). 40.4 Aggregate amount charged in these financial statements includes fee paid to Chairman of the Board of Directors
amounting to Rs. 1,200,000 (2014: Rs.1,200,000). The Chairman is also provided with a Company owned car.
Notes to the Financial StatementsFor the year ended June 30, 2015

ANNUAL REPORT 2015 / ORIX Leasing Pakistan Limited94
41 SEGMENT INFORMATION
The Company has two primary reporting segments namely, ‘Finance lease’ and ‘Operating lease’, based on the nature of business and the related risks and returns associated with these segments. The finance lease operations are primarily for long term leases of movable assets to corporate entities and individuals, while under operating lease, the Company provides assets on short term rentals. Investment Financial Services represents ORIX Investment Bank Limited’s assets and liabilities and related profit and loss expenses after amalgamation with ORIX Leasing Pakistan Limited. Segment results for the Company’s Micro Finance operation are also disclosed separately. Other operations, which are not deemed by management to be sufficiently significant to disclose as separate items and do not fall into the above segment categories, are reported under “Investment in associates, loans and others”.
Segment analysis for the year ended June 30, 2015 Investment Leasing Investment Finance Operating in associates, business Micro financial Total lease lease loans and total finance services others
Rupees Segment revenues 2,261,355,111 899,996,716 584,105,209 3,745,457,036 126,263,718 62,101,228 3,933,821,982 Share of profit of equity accounted undertakings - - 275,148,114 275,148,114 - - 275,148,114
Total segment revenue 2,261,355,111 899,996,716 859,253,323 4,020,605,150 126,263,718 62,101,228 4,208,970,096 Administrative and general expenses 273,273,275 75,457,934 1,817,966 350,549,175 50,899,751 2,506,839 403,955,765
Direct cost of leases 11,134,318 610,819,072 - 621,953,390 - - 621,953,390
Allowance for potential lease, installment and
other loan losses - net 103,743,853 - 20,744,339 124,488,192 42,173 (2,855,389) 121,674,976 Other Provisions - net - 34,575,907 (1,427,004) 33,148,903 - (7,876,562) 25,272,341 Impairment on available for sale securities - - - - - 3,114,225 3,114,225
Segment result 1,873,203,665 179,143,803 838,118,022 2,890,465,490 75,321,794 67,212,115 3,032,999,399
Provision for workers welfare fund (17,500,000) - - (17,500,000) Unallocated expenses (427,907,108) - - (427,907,108)
Result from operating activities 2,445,058,382 75,321,794 67,212,115 2,587,592,291 Finance cost (1,685,127,877) (35,235,639) (7,325,236) (1,727,688,752) Provision for taxation (189,000,000) - - (189,000,000)
Profit for the year 570,930,505 40,086,155 59,886,879 670,903,539
Other information
Segment assets 20,102,572,381 1,375,712,515 3,202,785,328 24,681,070,224 386,369,930 37,192,637 25,104,632,791
Investment in equity accounted undertakings - - 2,176,352,899 2,176,352,899 - - 2,176,352,899
Assets classified as held for sale 3,547,810 - 87,754,399 91,302,209 - - 91,302,209
Unallocated assets 945,359,503 - - 945,359,503
Total assets 27,894,084,835 386,369,930 37,192,637 28,317,647,402
Segment liabilities 6,804,332,299 - - 6,804,332,299 120,299,248 37,192,637 6,961,824,184
Unallocated liabilities 17,806,793,882 - - 17,806,793,882
Total liabilities 24,611,126,181 120,299,248 37,192,637 24,768,618,066
Capital expenditure - 274,225,106 - 274,225,106 1,266,290 - 275,491,396
Depreciation - 275,559,673 - 275,559,673 1,482,201 - 277,041,874
Unallocated Capital expenditure - - - 63,774,833 - - 63,774,833
Unallocated depreciation - - - 47,561,064 - - 47,561,064
Notes to the Financial StatementsFor the year ended June 30, 2015

95
Segment analysis for the year ended June 30, 2014 Investment Leasing Investment Finance Operating in associates, business Micro financial Total lease lease loans and total finance services others
Rupees Segment revenues 1,974,465,857 952,631,523 563,364,774 3,490,462,154 94,894,019 11,489,527 3,596,845,700
Share of profit of equity accounted undertakings - - 223,019,793 223,019,793 - - 223,019,793
Total segment revenue 1,974,465,857 952,631,523 786,384,567 3,713,481,947 94,894,019 11,489,527 3,819,865,493
Administrative and general expenses 255,407,208 72,957,147 1,534,898 329,899,253 43,327,984 4,403,460 377,630,697
Direct cost of leases 8,102,541 574,233,031 - 582,335,572 - - 582,335,572
Allowance for potential lease, installment and
other loan losses - net 112,802,621 - 27,151,153 139,953,774 441,444 (3,515,000) 136,880,218
Other Provisions - net - - 15,312,065 15,312,065 - 18,117,009 33,429,074
Segment result 1,598,153,487 305,441,345 742,386,451 2,645,981,283 51,124,591 (7,515,942) 2,689,589,932
Provision for workers welfare fund (13,500,000) - - (13,500,000)
Unallocated expenses (377,610,279) - - (377,610,279)
Result from operating activities 2,254,871,004 51,124,591 (7,515,942) 2,298,479,653
Finance cost (1,609,807,039) (29,160,655) (19,411,446) (1,658,379,140)
Provision for taxation (123,987,252) - - (123,987,252)
Profit for the year 521,076,713 21,963,936 (26,927,388) 516,113,261
Other information
Segment assets 17,015,644,419 1,386,715,716 2,944,578,283 21,346,938,418 300,478,165 139,469,682 21,786,886,265
Investment in equity accounted undertakings - - 1,701,150,417 1,701,150,417 - - 1,701,150,417
Assets classified as held for sale 1,241,089 - 87,754,399 88,995,488 - - 88,995,488
Unallocated assets 871,681,977 - - 871,681,977
Total assets 24,008,766,300 300,478,165 139,469,682 24,448,714,147
Segment liabilities 5,863,317,444 - - 5,863,317,444 241,363,500 139,469,682 6,244,150,626
Unallocated liabilities 15,140,634,271 - - 15,140,634,271
Total liabilities 21,003,951,715 241,363,500 139,469,682 21,384,784,897
Capital expenditure - 496,343,487 - 496,343,487 1,864,154 - 498,207,641
Depreciation - 224,304,296 - 224,304,296 1,606,746 - 225,911,042
Unallocated Capital expenditure - - - 41,294,355 - - 41,294,355
Unallocated depreciation - - - 50,934,672 - - 50,934,672
Notes to the Financial StatementsFor the year ended June 30, 2015

ANNUAL REPORT 2015 / ORIX Leasing Pakistan Limited96
42 TRANSACTIONS WITH RELATED PARTIES
The Company has related party relationships with its parent Company, related group companies, associated companies, staff provident fund, staff gratuity fund, directors and key management personnel and entities over
which the directors or key management personnel are able to exercise significant influence.
The Company in the normal course of business carries out transactions with various related parties. Amounts
due from and to related parties are disclosed in the relevant notes.
42.1 Terms and conditions of transactions with related parties
The transactions with the related parties are executed substantially on the same terms, as those prevailing at the time of comparable transactions with unrelated parties and do not involve more than a normal risk. Outstanding balances, if any, are disclosed in the respective notes. Other material transactions with related parties are given below:
2015 2014 Rupees
ORIX Corporation, Japan
Parent Company Dividend paid 142,421,437 89,522,046
Oman ORIX Leasing Company SAOG
Associate / common directorship Dividend received - 51,703,852 Received 818,445 bonus shares - - Consultancy fee received 1,284,395 12,122,720
BOD attendance fee 5,803,534 3,204,351 Al Hail ORIX Finance PSC Associate / common directorship
Purchase of right shares 125,955,000 - Dividend received 20,691,764 34,460,969 Saudi ORIX Leasing Company
Associate / common directorship Purchase of right shares 67,375,000 - Received 275,000 bonus shares - - Dividend received 190,023 1,360,290 Consultancy fee received 491,137 641,095 BOD attendance fee 5,143,795 3,706,476 OPP (Private) Limited
Associate / common directorship Rent paid for serviced apartment 66,700 87,695
Notes to the Financial StatementsFor the year ended June 30, 2015

97
2015 2014 Rupees
SK Leasing JSC Associate / common directorship Dividend received 8,603,614 4,471,611 State life Insurance Corporation of Pakistan Common directorship Rent and premium payment 13,064,064 8,752,501 Sui Northern Gas Company Limited
Common directorship Utilities bills payment 43,030 46,590 Related Parties
Issuance of certificates of deposit 73,303,408 34,246,632** Redemption of certificates of deposit 39,271,443 24,702,110** Amount of profit paid 4,678,768 3,364,808** ** Key Management personnel include the Chief Executive Officer, Chief Financial Officer, Company Secretary
and departmental, divisional, zonal and functional heads. Previously, the Company had considered the Chief Executive Officer and the Chief Financial Officer as Key Management personnel. The comparative information has been restated accordingly.
2015 2014 Rupees
ORIX Leasing Pakistan Limited - Employees Provident Fund (OLP-EPF) TFC principal repayment - 6,480,000 TFC interest paid - 474,173 Contribution made 20,831,889 18,584,154 ORIX Leasing Pakistan Limited - Staff Gratuity Fund (OLP-SGF) TFC principal repayment - 3,280,000 TFC interest paid - 240,013 Contribution made 15,204,085 42,459,161
Balances Certificates of deposit held - Related parties 71,978,619 37,946,654** Accrued profit on certificates of deposit - Related parties 3,668,637 2,802,483** Loan to key management personnel outstanding 37,469,419 33,187,833** Defined benefit payable to ORIX Leasing Pakistan Limited - Staff Gratuity Fund 849,197 3,919,447
Notes to the Financial StatementsFor the year ended June 30, 2015

ANNUAL REPORT 2015 / ORIX Leasing Pakistan Limited98
42.2 The Company is a party to Technical Assistance Agreements with its foreign associates, under which the Company renders certain technical services to these foreign associates.
42.3 Internal Audit also provides certain Internal Audit Advisory services to the ORIX Group Companies.
42.4 Compensation of key management personnel
2015 2014 Rupees
Short term employee benefits 120,148,590 99,947,749 Retirement benefits 12,617,166 10,608,256
Total compensation to key management personnel 132,765,756 110,556,005 Loan disbursement to key management personnel 9,774,286 7,764,919**
Interest paid by key management personnel 2,294,031 1,658,958**
Principal repaid by key management personnel 5,492,702 3,583,566**
** Key Management personnel include the Chief Executive Officer, Chief Financial Officer, Company Secretary and departmental, divisional, zonal and functional heads. Previously, the Company had considered the Chief Executive Officer and the Chief Financial Officer as Key Management personnel. The comparative information has been restated accordingly.
43 TAXATION 2015 2014 Rupees
Current tax charge for the year 97,603,913 71,494,165 Prior year taxation 8,396,087 -
Deferred 83,000,000 52,493,087
189,000,000 123,987,252
43.1 Effective tax rate reconciliation Numerical reconciliation between the average tax rate and the applicable tax rate has not been presented as
provision for the current year income tax has been made under the provisions of Alternate Corporate Tax under Section 113C of the Income Tax Ordinance, 2001.
43.2 Current status of pending tax assessments
Tax Year 1999 to 2000
In the assessment year 1999-2000 the Officer Inland Revenue (O.I.R) had revised the income tax assessment order of the Company under Section 221 of the Ordinance. The Company had preferred an appeal against the order of the O.I.R before the Commissioner Inland Revenue [CIR(A)] who confirmed the treatment of the O.I.R. The Company then filed an appeal before the Appellate Tribunal Inland Revenue (ATIR). The ATIR while deciding the appeal filed by the Company, has remanded back the appellate order dated December 12, 2005 to the CIR(A) to pass speaking order after considering all the relevant facts of the case. The case is still pending for adjudication. However, as a matter of prudence, the Company has made adequate provision in respect of the disallowances.
Tax Year 2008 to 2014 Under Section 114 of the Income Tax Ordinance 2001, the Company has filed the returns of income for tax
years 2008 to 2014. These returns were taken to be assessment orders passed by the Commissioner Inland Revenue on the day the returns were filed other than tax year 2010.
Notes to the Financial StatementsFor the year ended June 30, 2015

99
Tax Year 2009-2010
Details of the assessment made by the Additional Commissioner Inland Revenue are provided in note 31.2.
43.3 The Finance Act, 2015 introduced income tax at the rate of 10% on undistributed reserves where such reserves of the Company are in excess of its paid up capital and the Company derives profits for a tax year but does not distribute requisite cash dividend within six months of the end of the said tax year. Liability in respect of such income tax, if any, is recognised when the prescribed time period for distribution of dividend expires. The Company intends to distribute cash dividend in excess of forty percent of its after tax profits (refer note 50.1) and accordingly no provision for tax on undistributed reserves have been made in these financial statements.
44 OPERATING PROFIT BEFORE WORKING CAPITAL CHANGES
Note 2015 2014 Rupees
Profit before taxation 859,903,539 640,100,513
Adjustments for
Depreciation 4.1, 4.2 & 4.3 319,868,611 268,807,842 Amortisation 5.3 4,734,327 8,037,872 Amortisation of transaction cost 35 18,427,591 27,766,243 Provision for potential lease and other loan losses - net 38 121,674,976 136,880,218 (Reversal) / for potential losses on investments - net 39 (1,599,473) (504,373) Provision for workers welfare fund 39 17,500,000 13,500,000 Provision for other receivable 39 26,871,814 1,253,363 Provision for diminution in value of TREC 39 - 16,236,430 Impairment on available for sale securities 39 3,114,225 - Impairment on equity accounted undertaking 39 - 16,443,654 Share of profit of equity accounted undertakings 34 (275,148,114) (223,019,793) (Gain) on hedging instruments 33 (10,904,427) (22,238,542) Exchange loss on long term borrowings 33 10,904,427 22,238,542 Other exchange (loss) / gain - net 33 116,609 (341,464) Provision for staff retirement benefits 36.1 11,999,521 12,539,156 Unrealised gain on remeasurement of financial assets at fair value through profit and loss 33 (5,424,860) (5,770,291) Finance cost 35 892,618,014 846,209,556 Profit on certificates of deposit 35 816,643,147 784,403,341 Dividend income 33 (566,639) (3,044,898) Exchange loss / (gain) on dividend received 33 (3,622) 1,672,802 Capital (gain) on sale of investments 33 (75,690,780) (68,937,032) Return on investments and deposits 33 (4,911,906) (13,493,052) Interest income on government securities 33 (106,874,788) (20,352,219) (Gain) on disposal of fixed assets 33 (19,917,864) (17,569,191) 1,743,430,789 1,780,718,164 2,603,334,328 2,420,818,677
Notes to the Financial StatementsFor the year ended June 30, 2015

ANNUAL REPORT 2015 / ORIX Leasing Pakistan Limited100
45 CASH AND CASH EQUIVALENTS
Note 2015 2014 Rupees
Cash at bank 16 171,964,632 99,127,340 Cash in hand 16 1,321,720 1,356,482 Short - term running finance facilities 28 (884,301,394) (694,635,094)
(711,015,042) (594,151,272)
46 STAFF STRENGTH 2015 2014 Number of Staff
Company’s staff strength at the end of the year 458 442
Average number of employees* 454 444
* Represents average number of employees at the end of each month in the year.
47 PROVIDENT FUND RELATED DISCLOSURES
The Company operates a Staff Provident Fund for its employees. The following information is based on the financial statements of the Fund as at June 30, 2015 (unaudited) and 2014 (audited):
2015 2014 Un-audited Audited Rupees
Size of the Fund - Total assets 380,573,447 309,909,645
Fair value of investments 367,715,453 296,999,895
Percentage
Percentage of investments made 97% 96%
The cost of the above investments amounted to Rs. 348.09 million (2014: Rs 289.82 million).
Notes to the Financial StatementsFor the year ended June 30, 2015

101
The break-up of fair value of investments is as follows:
Un-audited Audited Un-audited Audited 2015 2014 2015 2014 Percentage Rupees
Cash and Bank deposits 1.12% 2.38% 4,110,275 7,059,969 Government securities - Treasury Bills 10.93% 10.03% 40,199,774 29,781,196 - National Savings Certificate 23.52% 43.27% 86,500,000 128,500,000 - Pakistan Investment Bonds 63.84% 40.67% 234,757,739 120,814,182 Debt securities - listed 0.00% 1.61% - 4,790,060 Mutual funds - listed 0.59% 2.04% 2,147,665 6,054,488
100.00% 100.00% 367,715,453 296,999,895 The investments of the provident fund have been made in accordance with the provisions of Section 227 of the
Companies Ordinance, 1984 and the rules formulated for this purpose.
48 FINANCIAL RISK MANAGEMENT
The Company’s activities are exposed to a variety of financial risks which mainly include market risk, credit risk and liquidity risk. The Board of Directors of the Company has overall responsibility for the establishment and oversight of the Company’s risk management framework. The Board is also responsible for developing and monitoring the Company’s risk management policies.
48.1 Market Risk
Market risk is the risk that the fair value or the future cash flows of a financial instrument may fluctuate as a result of changes in market profit rates or the market prices of securities due to change in credit rating of the issuer or the instrument, change in market sentiments, speculative activities, supply and demand of securities and liquidity in the market.
Market risk comprises of three types of risk: currency risk, interest rate risk and other price risk.
Notes to the Financial StatementsFor the year ended June 30, 2015

ANNUAL REPORT 2015 / ORIX Leasing Pakistan Limited102
48.1.1 Currency risk
Currency risk is the risk that the fair value or future cash flows of a financial instrument will fluctuate because of changes in foreign exchange rates. The Company incurs currency risk on borrowing in foreign currency and investment in overseas associates that are entered in a currency other than Pakistan Rupees. The Company uses cross currency swaps to hedge its currency risk on its foreign currency borrowings. The Company’s exposure to foreign currency transactions are as follows:
2015 2014 Rupees
Long term loans 290,571,518 916,964,386 Foreign currency bank account 2,859,017 2,975,626 Investment in associated undertakings 2,176,352,899 1,701,150,417 Accrued interest on long term financing 16,079,833 44,613,434
The Company has hedged interest rate risk and foreign currency risk on long term loans with financial
institutions. Had there been no hedge arrangements, profit for the year would have been lower by Rs. 11 million (2014: lower by Rs. 22 million).
Sensitivity analysis
The Company has major currency risk in US Dollar, at the reporting date, if the PKR had strengthened / weakened by 10% against the US Dollar with all other variables held constant, pre-tax profit for the year, in the absence of an effective hedge on its foreign currency assets and liabilities, would have been higher / lower by an amount of Rs. 187 million (2014: Rs. 74 million) mainly as a result of net foreign exchange gain / loss on translation of foreign currency bank account, investment in associated undertakings and foreign creditors.
The sensitivity analysis prepared is not necessarily indicative of the effects on profit for the year and assets /
liabilities of the Company.
48.1.2 Interest rate risk
Interest rate risk is the risk that the fair value of future cash flows of a financial instrument will fluctuate because of changes in market interest rates. The Company’s exposure to the risk of changes in market interest rates relates primarily to the Company’s debt obligations with floating interest rates and financial assets with variable interest rates. Financial assets and financial liabilities include balances of Rs.7,269 million (2014: Rs.5,490 million) and Rs. 8,207 million (2014: Rs. 5,338 million) respectively, which are subject to interest rate risks. Applicable interest rates for the same have been disclosed in their respective notes.
Sensitivity analysis for variable rate financial instruments
The Company does not account for any fixed rate financial assets and liabilities at fair value through profit or loss. But the Company does designate derivatives (cross currency interest rate swap) as a hedging instrument under a fair value hedge accounting model. Therefore a change in interest rates at the reporting date would affect profit and loss account.
An increase / decrease of 100 basis points in interest rate would have increased or decreased profit by Rs. 9.38 million (2014: Rs.1.5 million).
The sensitivity analysis prepared is not necessarily indicative of the effects on profit for the year and financial assets / liabilities of the Company.
Notes to the Financial StatementsFor the year ended June 30, 2015

103
48.1.3 Other Price Risk
Other price risk is the risk that the fair value or future cash flows of a financial instrument will fluctuate because of changes in market prices (other than those arising from interest rate risk or currency risk) whether those changes are caused by factors specific to the individual financial instruments or it’s issuer, or factors affecting all similar financial instruments traded in the market.
Other price risk arises from the Company’s investment in units of mutual funds and ordinary shares of listed companies. To manage its price risk arising from the aforesaid investments, the Company diversifies its portfolio and continuously monitors developments in equity markets. In addition, the Company actively monitors the key factors that affect stock price movement. As at June 30, 2015, the Company no longer has investments in ordinary shares of listed companies or investments in mutual funds.
Sensitivity analysis
A 10% increase / decrease in redemption and share prices at year end would have increased / decreased the Company’s profit in case of investments classified as ‘at fair value through profit or loss’ and increased / decreased surplus / (deficit) on re-measurement of investments in case of ‘available for sale’ investments as
follows:
2015 2014 Rupees
Effect on profit - 5,443,305
Effect on equity - 1,741,996
Effect on investments - 7,185,301
The sensitivity analysis prepared is not necessarily indicative of the effects on profit / equity and assets of the Company.
48.2 Credit risk
Credit risk is the risk that one party to a financial instrument will fail to discharge an obligation and cause the other party to incur a financial loss. The risk is generally limited to principal amounts and accrued profit thereon, if any. The Company has established procedures to manage credit exposure including credit approvals, credit limits, collateral and guarantee requirements. These procedures incorporate both internal guidelines and requirements of the NBFC Rules and the NBFC Regulations. The Company also manages risk through an independent credit department which evaluates customers’ credit worthiness and obtains adequate securities where applicable.
All investing transactions are settled / paid for upon delivery. The Company’s policy is to enter into financial
instrument contract by following internal guidelines such as approving counterparties and approving credits.
Concentration of credit risk arises when a number of counterparties are engaged in similar business activities,
or activities in the same geographical region, or have similar economic features that would cause their ability to meet contractual obligations to be similarly affected by changes in economic, political or other conditions. Concentration of credit risk indicates the relative sensitivity of the Company’s performance to developments affecting a particular industry or geographic location. Out of the total assets of Rs. 28,318 million (2014: Rs. 24,449 million) the assets which were subject to credit risk amounted to Rs. 24,167 million (2014: Rs. 20,956 million). Significant concentrations of the Company’s risk assets by industry sector and geographical region are set out in notes 48.2.1 to 48.2.3.
Notes to the Financial StatementsFor the year ended June 30, 2015

ANNUAL REPORT 2015 / ORIX Leasing Pakistan Limited104
The maximum exposure to credit risk at the reporting date is: 2015 2014 Rupees
Net investment in finance lease 20,823,948,377 17,774,664,986 Long term finances and loans 2,348,900,011 2,197,541,857 Short term finances 544,177,360 460,312,661 Long term investments 3,265,627 3,265,627 Accrued return on investments and term finance 74,783,699 68,066,629 Short term investments 35,320,358 160,341,044 Other receivables 151,818,110 182,360,125 Long term deposits 10,048,864 10,149,703 Bank balances 171,964,632 99,127,340
24,164,227,038 20,955,829,972
The Company monitors the credit quality of receivables through diversification of activities to avoid undue concentration of risks with individuals, groups or specific industry segments. For such purpose, the Company has established exposure limits for single lessees and industrial sectors. The Company has an effective rental monitoring system which allows it to evaluate customers’ credit worthiness and identify potential problem accounts. An allowance for potential lease, installment and other loan losses is maintained at a level which, in the judgment of management, is adequate to provide for potential losses on lease, installment and other loan portfolio that can be reasonably anticipated. The credit quality of receivables can be assessed with reference to their historical performance with no or some defaults in recent history.
The carrying value of receivables which are past due are as under:
2015 Finance lease Investments & (net of security Finance & loan other Total Deposit) receivables Rupees
90 - 180 days 74,714,000 24,548,688 17,321,720 116,584,408 181-365 days 17,462,000 514,272 18,594,730 36,571,002 Over 1 Year 581,241,758 352,790,740 70,141,210 1,004,173,708
673,417,758 377,853,700 106,057,660 1,157,329,118 Watch list clients 47,958,238 9,222,806 - 57,181,044
Less: Provision 721,375,996 387,076,506 106,057,660 1,214,510,162
Net of Provision - - - -
Coverage Ratio 100.0% 100.0% 100.0% 100.0%
Notes to the Financial StatementsFor the year ended June 30, 2015

105
2014 Finance lease Investments & (net of security Finance & loan other Total Deposit) receivables Rupees
90 - 180 days 49,018,000 2,410,353 3,246,329 54,674,682 181-365 days 25,371,000 2,475,066 3,134,729 30,980,795 Over 1 Year 684,631,567 374,185,071 94,924,339 1,153,740,977
759,020,567 379,070,490 101,305,397 1,239,396,454 Less: Provision 759,020,567 379,070,490 97,021,749 1,235,112,806
Net of Provision - - 4,283,648 4,283,648
Coverage Ratio 100.0% 100.0% 95.8% 99.7%
The Company has made appropriate provisions in respect of these past dues. The provisions have been made keeping in view the time based criteria of the NBFC Regulations.
The Company has adequate provision of Rs. 1,215 million (2014: Rs. 1,235 million) against these past dues. The credit quality of the Company’s bank balances and investments portfolio are assessed with reference to
external credit ratings which, in all cases, are above investment grade rating. The analysis below summaries the credit rating quality of the Company’s net financial assets as at June 30,
2015: 2015 2014 Rupees
Bank balances AAA 50,623,182 39,429,319 AA+ 101,376,976 48,876,473 AA 108,592 126,630 AA- 323,435 385,671 A+ 18,360,397 300,949 A 64,535 8,789,407 A- 341,609 341,610 A2 234,094 316,437 A3 266,221 - State Bank of Pakistan 265,591 560,844
171,964,632 99,127,340 Term Finance Certificates - listed AA+ 10,991,520 18,651,788 AA - 2,498,522 Unrated - 500,527 Mutual Funds AM2 - 21,844,186 AM2- - 17,355,964 AM3- - 32,186,188
Notes to the Financial StatementsFor the year ended June 30, 2015

ANNUAL REPORT 2015 / ORIX Leasing Pakistan Limited106
48.2.1 Segment by class of business
An analysis by class of business of the Company’s net investment in finance leases and other advances is given below:
2015 2014 Rupees % Rupees % Transport and communication 6,102,043,483 25.83% 4,441,616,044 21.84%
Individuals (Auto lease) 4,771,283,302 20.20% 4,462,280,959 21.95%
Services 2,876,674,575 12.18% 2,250,585,061 11.07%
Miscellaneous 1,779,018,185 7.53% 1,717,500,790 8.45%
Textile and allied 1,622,582,150 6.87% 1,534,466,020 7.55%
Fuel and energy 1,251,279,232 5.30% 964,578,173 4.74%
Trading 1,190,471,436 5.04% 1,031,707,862 5.07%
Steel and engineering 958,370,556 4.06% 875,777,314 4.31%
Food and allied 863,706,741 3.66% 859,618,701 4.23%
Paper, board and printing 542,686,323 2.30% 540,760,815 2.66%
Construction 526,274,923 2.23% 477,843,669 2.35%
Chemical and pharmaceutical 485,419,681 2.06% 480,567,011 2.36%
Sugar 335,979,550 1.42% 468,814,668 2.31%
Cement 175,737,610 0.74% 128,576,902 0.63%
Manufacturers of consumer goods 135,999,110 0.58% 98,119,059 0.48%
23,617,526,857 100.00% 20,332,813,048 100.00%
2015 2014 Rupees
Net investment in finance leases 20,823,948,377 17,774,664,986 Other advances 2,793,578,480 2,558,148,062
23,617,526,857 20,332,813,048
48.2.2 Segment by sector
The Company’s net investment in finance leases includes exposure to Government / Public sector amounting to Rs. 5.27 million (2014: Rs. 45.74 million) and the balance Rs. 20,819 million (2014: Rs. 17,728 million) represents exposure to private sector.
48.2.3 Geographical segment analysis
The Company’s operations are restricted to Pakistan only.
48.3 Liquidity Risk
Liquidity risk is the risk that the Company will encounter difficulty in meeting its financial obligations as they fall due. Liquidity risk arises because of the possibility that the Company will be required to pay its liabilities earlier than expected or will face difficulty in raising funds to meet commitments associated with financial liabilities as they fall due. The Company’s approach to managing liquidity is to ensure, as far as possible, that it will always have sufficient liquidity to meet its liabilities when due, under both normal and stressed conditions, without incurring unacceptable losses or risking damage to the Company’s reputation.
The table below summarises the Company’s financial liabilities into relevant maturity groupings based on the
Sector
Notes to the Financial StatementsFor the year ended June 30, 2015

107
remaining period at the balance sheet date to contractual maturity date. The amounts in the table are the
contractual undiscounted cash flows. 2015 More than Carrying Contractual Upto three three months More than amount cash flows months and up to one year one year Rupees
Long term finances 8,033,455,235 8,602,074,576 765,512,637 2,240,839,593 5,595,722,346 Long term loans 410,870,766 432,949,068 261,772,821 171,176,247 - Certificates of deposit 6,983,258,717 9,292,808,545 602,299,240 1,320,921,759 7,369,587,546 Trade and other payables 548,853,987 530,996,598 530,996,598 - - Accrued interest / mark-up /profit on loans,
finances and certificates of deposit 587,211,187 587,211,187 234,215,955 84,760,718 268,234,514
Short term borrowings 884,301,394 884,301,394 884,301,394 - -
17,447,951,286 20,330,341,368 3,279,098,645 3,817,698,317 13,233,544,406
2014 More than Carrying Contractual Upto three three months More than amount cash flows months and up to one year one year Rupees
Long term finances 5,788,433,398 6,516,099,297 924,024,913 2,201,452,765 3,390,621,619
Long term loans 1,158,327,886 1,209,491,322 649,353,281 269,695,299 290,442,742
Certificates of deposit 6,312,168,511 8,170,631,378 298,566,822 2,546,315,171 5,325,749,385
Trade and other payables 403,633,437 403,633,437 403,633,437 - -
Accrued interest / mark-up /profit on loans,
finances and certificates of deposit 701,317,424 701,317,424 325,807,377 127,921,977 247,588,070
Short term borrowings 694,635,094 696,775,423 696,775,423 - -
15,058,515,750 17,697,948,281 3,298,161,253 5,145,385,212 9,254,401,816
48.4 Fair values of financial assets and liabilities
The table below analyses financial instruments carried at fair value, by valuation method. The different levels (methods) have been defined as follows:
- Level 1: quoted prices (unadjusted) in active markets for identical assets or liabilities. - Level 2: inputs other than quoted prices included within Level 1 that are observable for the asset or liability,
either directly (i.e. as prices) or indirectly (i.e. derived from prices). - Level 3: inputs for the asset or liability that are not based on observable market data (unobservable
inputs).
Notes to the Financial StatementsFor the year ended June 30, 2015

ANNUAL REPORT 2015 / ORIX Leasing Pakistan Limited108
Level - 1 Level - 2 Level - 3 Total Rupees
At fair value through profit or loss 482,523,845 - - 482,523,845 Available for sale investments 616,133,538 - 15,285,526 631,419,064
Total 1,098,657,383 - 15,285,526 1,113,942,909
2015 Rupees
The reconciliation of items classified in Level 3 is as follows:
Opening balance as at 1 July 56,194,411 Disposal (40,073,820) Revaluation loss (835,065)
Closing balance as at 30 June 15,285,526 The carrying amounts of all other financial assets and liabilities reflected in the financial statements approximate
their fair values.
48.5 Capital risk management
The objective of the Company when managing capital is to safeguard its ability to continue as a going concern so that it can continue to provide returns for shareholders and benefits for other stakeholders, and to maintain a strong capital base to support the sustained development of its business.
The Company manages its capital structure by monitoring return on net assets and makes adjustments to it in
the light of changes in economic conditions. In order to maintain or adjust the capital structure, the Company may adjust the amount of dividend paid to its shareholders or issue new shares.
As required under the NBFC Regulations, every leasing company shall maintain minimum equity requirement of Rs. 700 million at all times. The Company has maintained and complied with the minimum equity requirement during the current year.
49 EARNINGS PER SHARE - basic and diluted
2015 2014 Rupees
Profit for the year 670,903,539 516,113,261 Weighted average number of ordinary shares 82,052,930 82,052,930
Earnings per share - basic and diluted 8.18 6.29
49.1 Diluted earnings per share has not been presented separately as the Company does not have any convertible instruments in issue at June 30, 2015 and June 30, 2014 which would have any effect on the earnings per share if the option to convert is exercised.
Notes to the Financial StatementsFor the year ended June 30, 2015

109
50 NON-ADJUSTING EVENTS AFTER THE BALANCE SHEET DATE
50.1 The Board of Directors in its meeting held on Sep 16, 2015 proposed a final dividend of Rs. 4.5 per share (2014: Rs. 3.5 per share) for the year ended June 30, 2015, amounting to Rs. 369,238,185 (2014: Rs. 287,185,255) for approval of members at the Annual General Meeting to be held on Oct 27, 2015. The financial statements for the year ended June 30, 2015 do not include the effect of the proposed dividend which will be accounted for in the financial statements for the year ending June 30, 2016.
50.2 ORIX Leasing Pakistan Limited (“OLPL”) has entered into an Amalgamation Agreement and Share and Certificate Purchase Agreement (the “Agreements”) with Standard Chartered Bank (Pakistan) Limited (“SCBPL”) with respect to the proposed, (i) merger / amalgamation of Standard Chartered Leasing Limited (a subsidiary of SCBPL) with and into OLPL; (ii) acquisition of SCBPL’s 100% stake in Standard Chartered Services of Pakistan (Private) Limited; and (iii) acquisition of SCBPL’s 20% stake in Standard Chartered Modaraba.
The proposed transactions and their implementation would be subject to satisfaction of various conditions
including regulatory approvals contained in the Agreements. The consideration for the value of the shares of Standard Chartered Leasing Limited and Standard Chartered Services of Pakistan (Private) Limited and certificates of Standard Chartered Modaraba will be finalized at the time of completion of the transactions, which consideration will be subject to post-completion adjustment.
51 CORRESPONDING FIGURES
51.1 Following corresponding figures have been rearranged and reclassified for the purpose of better presentation and comparsion.
Teizoon Kisat Humayun MuradChief Executive Director
Notes to the Financial StatementsFor the year ended June 30, 2015
Description Reclassified from Classified to Amount in RsIjarah Finance Rent Accured return on
investment & term finances
Other receivable 1,958,355
52 DATE OF AUTHORISATION FOR ISSUE
These financial statements were authorised for issue on September 16, 2015 by the Board of Directors of the Company.
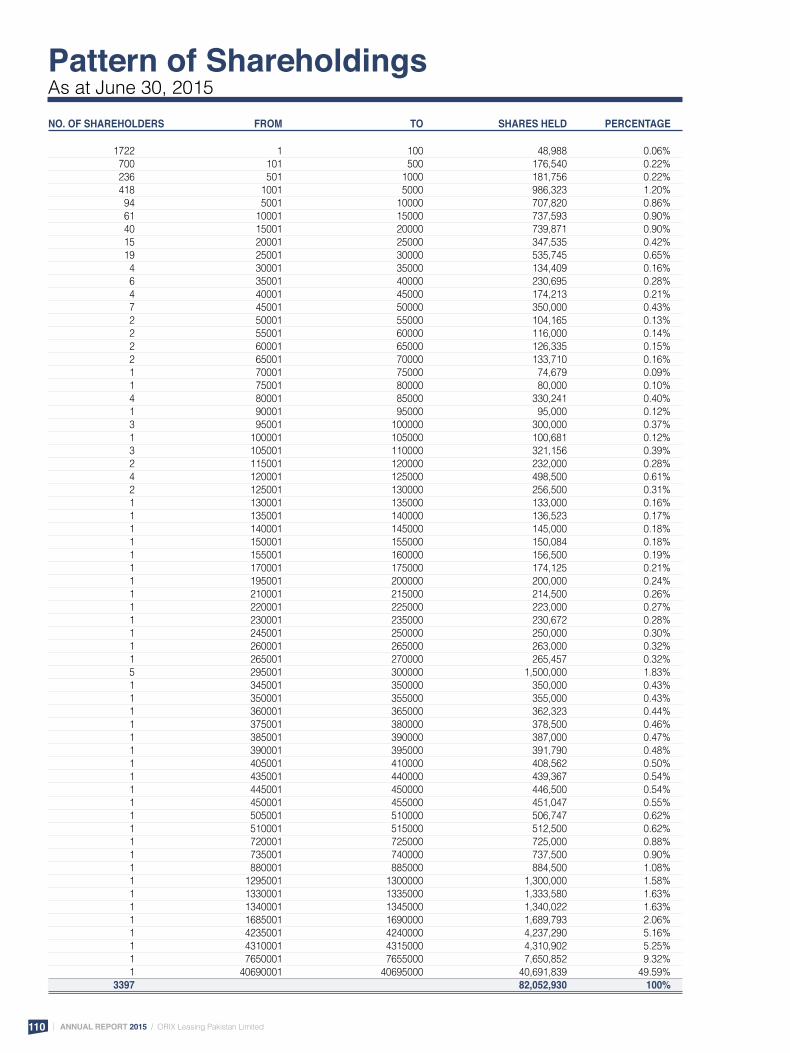
ANNUAL REPORT 2015 / ORIX Leasing Pakistan Limited110
NO. OF SHAREHOLDERS FROM TO SHARES HELD PERCENTAGE
1722 1 100 48,988 0.06% 700 101 500 176,540 0.22% 236 501 1000 181,756 0.22% 418 1001 5000 986,323 1.20% 94 5001 10000 707,820 0.86% 61 10001 15000 737,593 0.90% 40 15001 20000 739,871 0.90% 15 20001 25000 347,535 0.42% 19 25001 30000 535,745 0.65% 4 30001 35000 134,409 0.16% 6 35001 40000 230,695 0.28% 4 40001 45000 174,213 0.21% 7 45001 50000 350,000 0.43% 2 50001 55000 104,165 0.13% 2 55001 60000 116,000 0.14% 2 60001 65000 126,335 0.15% 2 65001 70000 133,710 0.16% 1 70001 75000 74,679 0.09% 1 75001 80000 80,000 0.10% 4 80001 85000 330,241 0.40% 1 90001 95000 95,000 0.12% 3 95001 100000 300,000 0.37% 1 100001 105000 100,681 0.12% 3 105001 110000 321,156 0.39% 2 115001 120000 232,000 0.28% 4 120001 125000 498,500 0.61% 2 125001 130000 256,500 0.31% 1 130001 135000 133,000 0.16% 1 135001 140000 136,523 0.17% 1 140001 145000 145,000 0.18% 1 150001 155000 150,084 0.18% 1 155001 160000 156,500 0.19% 1 170001 175000 174,125 0.21% 1 195001 200000 200,000 0.24% 1 210001 215000 214,500 0.26% 1 220001 225000 223,000 0.27% 1 230001 235000 230,672 0.28% 1 245001 250000 250,000 0.30% 1 260001 265000 263,000 0.32% 1 265001 270000 265,457 0.32% 5 295001 300000 1,500,000 1.83% 1 345001 350000 350,000 0.43% 1 350001 355000 355,000 0.43% 1 360001 365000 362,323 0.44% 1 375001 380000 378,500 0.46% 1 385001 390000 387,000 0.47% 1 390001 395000 391,790 0.48% 1 405001 410000 408,562 0.50% 1 435001 440000 439,367 0.54% 1 445001 450000 446,500 0.54% 1 450001 455000 451,047 0.55% 1 505001 510000 506,747 0.62% 1 510001 515000 512,500 0.62% 1 720001 725000 725,000 0.88% 1 735001 740000 737,500 0.90% 1 880001 885000 884,500 1.08% 1 1295001 1300000 1,300,000 1.58% 1 1330001 1335000 1,333,580 1.63% 1 1340001 1345000 1,340,022 1.63% 1 1685001 1690000 1,689,793 2.06% 1 4235001 4240000 4,237,290 5.16% 1 4310001 4315000 4,310,902 5.25% 1 7650001 7655000 7,650,852 9.32% 1 40690001 40695000 40,691,839 49.59% 3397 82,052,930 100%
Pattern of ShareholdingsAs at June 30, 2015

111
Number of Category Category Percentage Shares Held wise Number wise Shares of Shareholders held
Individuals - 3,241 13,085,490 15.95%Investment Companies - 5 83,392 0.10%Joint Stock Companies - 30 1,230,517 1.50% Directors, Chief Executive Officer and their Spouse and Minor ChildrenMr. Kunwar Idris 2,771 Mr. Harukazu Yamaguchi 575 Mr. Humayun Murad 155,109 Mr. Shahid Usman 20,500 Mr. Shaheen Amin 575 Mr. Kazuhito Inoue 575 Mr. Teizoon Kisat 66,210 Mrs. Khalida Idris w/o Mr. Kunwar Idris 8,302 8 254,617 0.31%Executives 35 131,839 0.16%Associated Companies, Undertakings and Related Parties ORIX Corporation 1 40,691,839 49.59%Public Sector Companies and Corporations 2 6,277,097 7.65%Banks, DFIs, NBFCs, Insurance Companies Takaful, Modarabas, Pension Funds and Mutual Funds 12 5,186,956 6.32%Foreign Investors 46 14,351,122 17.49%Others 17 760,061 0.93%Total 3,397 82,052,930 100.00% Additional Information Shareholders holding five percent or more voting rights Aberdeen Asian Smaller Companies Investment Trust PLC 4,237,290 5.16%State Life Insurance Corporation of Pakistan 4,310,902 5.25%Majid Al Futtaim Trust LLC 7,650,852 9.32%ORIX Corporation 40,691,839 49.59%Total 56,890,883 69.33%
Pattern of ShareholdingsAs at June 30, 2015
Categories of Shareholders
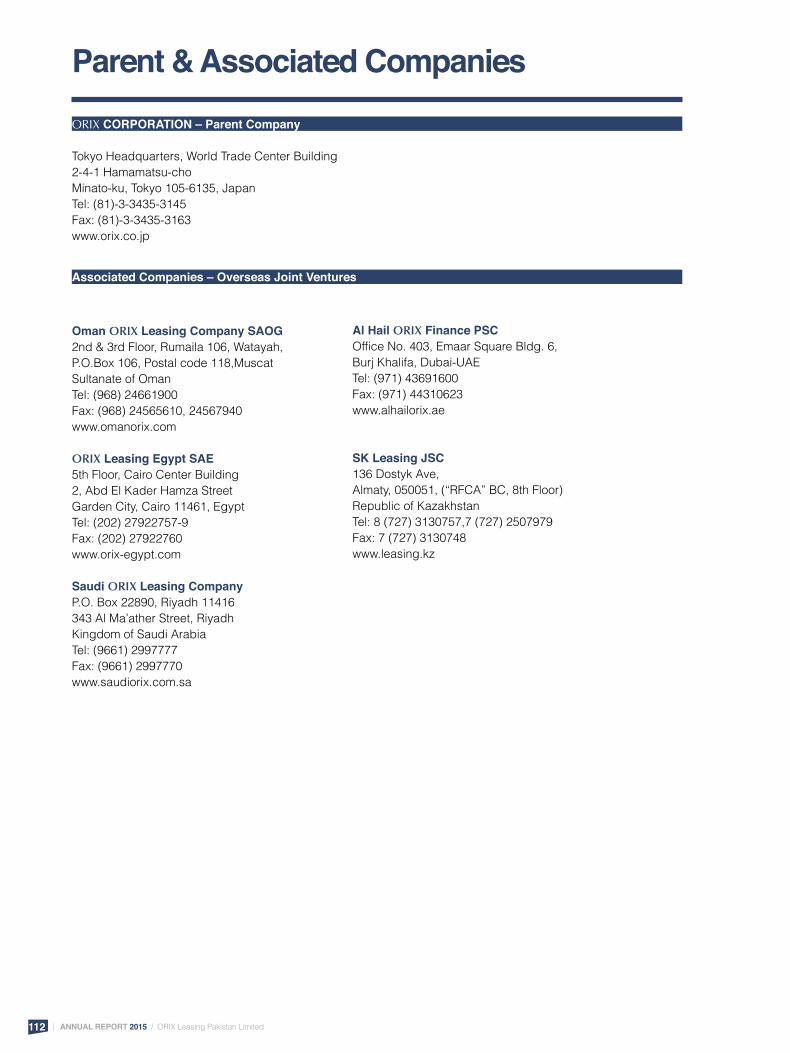
ANNUAL REPORT 2015 / ORIX Leasing Pakistan Limited112
ORIX CORPORATION – Parent Company
Tokyo Headquarters, World Trade Center Building2-4-1 Hamamatsu-choMinato-ku, Tokyo 105-6135, JapanTel: (81)-3-3435-3145Fax: (81)-3-3435-3163www.orix.co.jp
Associated Companies – Overseas Joint Ventures
Oman ORIX Leasing Company SAOG2nd & 3rd Floor, Rumaila 106, Watayah,P.O.Box 106, Postal code 118,MuscatSultanate of OmanTel: (968) 24661900Fax: (968) 24565610, 24567940www.omanorix.com
ORIX Leasing Egypt SAE5th Floor, Cairo Center Building2, Abd El Kader Hamza StreetGarden City, Cairo 11461, EgyptTel: (202) 27922757-9Fax: (202) 27922760www.orix-egypt.com
Saudi ORIX Leasing CompanyP.O. Box 22890, Riyadh 11416343 Al Ma’ather Street, RiyadhKingdom of Saudi ArabiaTel: (9661) 2997777Fax: (9661) 2997770www.saudiorix.com.sa
Al Hail ORIX Finance PSCOffice No. 403, Emaar Square Bldg. 6,Burj Khalifa, Dubai-UAETel: (971) 43691600Fax: (971) 44310623www.alhailorix.ae
SK Leasing JSC136 Dostyk Ave,Almaty, 050051, (“RFCA” BC, 8th Floor)Republic of KazakhstanTel: 8 (727) 3130757,7 (727) 2507979Fax: 7 (727) 3130748www.leasing.kz
Parent & Associated Companies

113
Offices in Pakistan
Korangi OfficeHead OfficeORIX Building, Plot No.16, Sector No.24,Korangi Industrial Area, KarachiTel: 021- 3514 4029-40Fax: 021- 3514 4002, 3514 4020UAN: 111 24 24 24E-mail: [email protected]: www.orixpakistan.com
Registered OfficeIslamic Chamber of Commerce Building, Ground Floor, ST-2/A, Block-9, KDA Scheme No.5, Clifton, KarachiTel :021-3530 3560-64Fax: 021-3530 3571
e-Business DivisionBahria Complex IV, 6th Floor Block-B,Choudary Khalique-uz-Zaman Road, Clifton, KarachiUAN: 111-767-657Tel:021-35147861-66
HyderabadFirst Floor, State Life Building,Thandi Sarak, Hyderabad.Tel: 022-2784143, 2720397Fax: 022-2785388
Lahore Zone4-J, Gulberg-III, Near Firdous Market, LahoreTel: 042-35842560-1, 35842171, 35842964Fax: 042-35845974, 35845975
Shad BaghHouse No. 3, Street # 2, Main Street Dilshad Park, Opposite Wasa Colony, Shad Bagh, Lahore.Tel: 042-37613511
Batapur/Jallo MoreOpposite Sooter Mill Stop, Kot Dhoni Chand, G.T Road, Lahore.Tel: 042-36522931
Kot Abdul Malik11-K.M. Lahore, Main Sheikhupura Road,Near Punjab Bank, Kot Abdul Malik, Distt. SheikhupuraTel: 042-37340711
Manga MandiMain Multan Road, Madina Market, Kalma Chowk, Manga MandiTel: 042-35383864
SharaqpurMain Lahore Jaranwala Road,Opposite Government Pilot High SchoolSharaqpur Sharif, District SheikhupuraTell: 056-2590021
ChunianW-1-370/26, Shop RH, Cantt Road, Chunian.Tel: 049-4311132
Faisalabad Zone3rd Floor, Sitara Towers,Bilal Chowk, Civil Lines, FaisalabadTel:041-2633926, 2633811-3Fax 041-2633927
SargodhaA.R. Tower, Adjacent Q s International HotelUniversity Road, Sargodha.Tel:048-3729521, 3740091Fax: 048-3729522
SahiwalStadium Road Branch, Five Ways Chowk,Stadium Road, SahiwalTel:040-4227613-4Fax: 040-4227615
JhangChurch Road, Near Government Girls Collage Chowk, JhangTel:047-7650421-2Fax: 047-7650423
BhalwalFirst Floor, Rehmat Plaza, Mandir Road,Block No. 3, Bhalwal. District SargodhaTel: 048-6644448
SillanwaliChaudhary Akhter Market, 46 ADA Road,Sillanwali, District SargodhaTel: 048-6532666
Sahiwal Micro FinanceMain Circular Road, Opposite Kashmiri Gate,Tehsil Sahiwal District, Sargodha.Tel: 048-6785505
Sialkot Zone1st Floor, Ghoolam Kadir Arcade,Aziz Shaheed Road, Sialkot Cantt.Tel:052-4260616, 4260877Fax: 052-4269548
GujratOffice No.1, First Floor, Empire Centre,Opp. Small Industrial Estate Gate No. 1,G.T. Road, GujratTel: 053-3515282, 3536953Fax: 053-3536854
Gujranwala76-ABC, Block - P, Trust Plaza,G.T. Road, Gujranwala.Tel: 055-3731021-22Fax: 055-3250599
Islamabad ZoneGround Floor,State Life Building No. 5,Nizamuddin Road, Blue Area, Islamabad.Tel:051-2822800-2, 2821706, 2821748, 2821960Fax: 051-2821917
Rawalpindi146-B Satellite Town,Chandni Chowk, Murree Road,Rawalpindi.Tel:051-4571431-3, 4571442-3, Fax:051-4571445
Mirpur A.K.1st Floor, Jarral Plaza,63/F, Sector F-1,Kotli Road, Mirpur, A.K.Tel:05827- 434368, 451219Fax:05827-432216
ChakwalGround Floor, Opposite Saddar Police StationTalagang Road, Chakwal.Tel: 0543-543523-4, 602049Fax: 0543-602048
Multan ZoneGround Floor, Trust Plaza, LMQ Road, Multan.Tel:061- 4518431-3, 4518435-6Fax: 061-4580321
Rahim Yar Khan20-21, Ground Floor, City Centre Plaza,Shahi Road, Rahim Yar Khan.Tel:068- 588565, 5887617-8Fax: 068-5887610
BahawalpurGround Floor, near Cantonment Office Board,Ahmed Pur East Road, BahawalpurTel: 062-9255382, 9255494Fax: 062-2886273
Renala KhurdGhalla Mandi, Opp. Zaka Hospital,Renala Khurd, Distt. OkaraTel: 044-2635185
PattokiFaisal Colony Road,Near Post Office PattokiTel:049-4422064
Peshawar ZoneGround Floor, State Life BuildingThe Mall, Peshawar.Tel: 091- 5278647, 5279789, 5285541, 5285520Fax: 091-5273389
AbbottabadYousaf Jamal Plaza, Near HBLMansehra Road, Abbottabad.Tel: 0992-343888, 343188Fax: 0992-405856
MingoraShop No. 7. Ground Floor, Shahzad PlazaSaidu Road, Makan Bagh, Mingora SawatCell: 0300-5749249

ANNUAL REPORT 2015 / ORIX Leasing Pakistan Limited114
INVESTORS AWARENESSIn pursuance of SRO 924(1)/2015 dated September 9th, 2015 issued by the Securities and Exchange
Commission of Pakistan (SECP), the following informational message has been reproduced to educate investors:

Form of ProxyI/We
of (full address)
being a Member of ORIX Leasing Pakistan Limited hereby appoint
of (full address)
or failing him / her
of (full address)
as my/our Proxy to attend and vote for me and on my behalf at the Twenty Ninth Annual General Meeting of the Company to be held on October 27, 2015 and at any adjournment thereof.
Signature this Year 2015 (day) (date, month)
Signature of Member :
Folio Number :
Number of shares held :
Signatures and addresses of witnesses
1.
2.
1. A Member entitled to attend and vote at the General Meeting is entitled to appoint a Proxy to attend and vote instead of him / her. A Proxy need not be a Member of the Company.
2. The instrument appointing a Proxy shall be in writing under the hand of the appointer or of his / her attorney duly authorized in writing, if the appointer is a corporation, under its common seal or the hand of an officer or attorney duly authorized.
3. The instrument appointing a Proxy and the power of attorney or other authority under which it is signed or a notarially certified copy of the power of attorney must be deposited at the registered office of the Company at least 48 hours before the time of the meeting.
4. An individual Beneficial Owner of the Central Depository Company, entitled to attend and vote at this meeting must bring his / her original Computerised National Identity Card (CNIC) or Passport with him / her to prove his / her identity, and in case of Proxy, must enclose an attested copy of his / her CNIC or Passport. The representative of corporate entity, shall submit Board of Directors’ resolution / power of attorney with specimen signature (unless it has been provided earlier) alongwith proxy form to the Company.
Please affix revenue stamp
Signature and Company Seal


GEOGRAPHICAL PRESENCE
KARACHI HYDERABAD
ISLAMABADRAWALPINDI
PESHAWARABBOTTABAD
MINGORA
MIRPUR
CHAKWAL
SARGODHA
BHALWAL
SILLANWALI
SAHIWAL
RENALA KHURD
LAHORE
FAISALABAD CHUNIAN
GUJRANWALA
SIALKOT
GUJRAT
SHAD BAGH
MANGA MAUDI
PATTOKI
SHEIKUPURA
SAHIWALJHANG
KOT ABDUL MALIK
MULTAN
RAHIM YAR KHAN
BHAWALPUR

ORIX Building, Plot No. 16, Sector No. 24,Korangi Industrial Area, Karachi - 74900Phone: (021) 35144028-40
ORIXPAKISTAN.COM