Passing the Bucks: The Congressional Contribution Network 1985 ...
22
Passing the Bucks: The Congressional contribution network 1985–2006 Brendan Nyhan Duke University [email protected] Michael Tofias UW-Milwaukee tofi[email protected] August 23, 2008 Abstract Many members of Congress now play an active role in financing the elections of their colleagues, but scholars of Congress have not kept up. To understand the flow of campaign funds between members of Congress, we must consider the structure of the contribution network. Building on recent studies of cosponsorship and committee net- works in Congress, we conduct the first network analysis of campaign and leadership PAC contributions between Congressional candidates and members. Using FEC data from 1985 to 2006, we show that the density of these networks has increased over time, identify the most central members within each Congress, and demonstrate that leaders in the House have become more central relative to the rank-and-file over this period. Our analysis provides a foundation for research into how members of Congress use contributions as a mechanism for institutional advancement. Prepared for the annual meeting of the American Political Science Association, Boston, MA, August 28–31, 2008. The authors thank the Dirksen Congressional Research Center for generous funding support and Clay- ton Clouse and Kimberly Johnson for excellent research assistance. Please do not quote or cite without per- mission. For the latest version of this paper, please see www.duke.edu/ ∼ bjn3 or www.uwm.edu/ ∼ tofias.
Transcript of Passing the Bucks: The Congressional Contribution Network 1985 ...
Passing the Bucks:The Congressional contribution network 1985–2006
Brendan NyhanDuke [email protected]
Michael [email protected]
August 23, 2008
Abstract
Many members of Congress now play an active role in financing the elections oftheir colleagues, but scholars of Congress have not kept up. To understand the flow ofcampaign funds between members of Congress, we must consider the structure of thecontribution network. Building on recent studies of cosponsorship and committee net-works in Congress, we conduct the first network analysis of campaign and leadershipPAC contributions between Congressional candidates and members. Using FEC datafrom 1985 to 2006, we show that the density of these networks has increased over time,identify the most central members within each Congress, and demonstrate that leadersin the House have become more central relative to the rank-and-file over this period.Our analysis provides a foundation for research into how members of Congress usecontributions as a mechanism for institutional advancement.
Prepared for the annual meeting of the American Political Science Association, Boston, MA, August 28–31,
2008. The authors thank the Dirksen Congressional Research Center for generous funding support and Clay-
ton Clouse and Kimberly Johnson for excellent research assistance. Please do not quote or cite without per-
mission. For the latest version of this paper, please see www.duke.edu/∼bjn3 or www.uwm.edu/∼tofias.
1 Introduction
Humans are social beings who create, maintain, and abandon relationships with
each other. These relationships tie us together, structuring information flow and
influencing behavior. Together, they constitute what are called social networks.
Recent advances in the methodology of network analysis have led to increased
interest in social networks of many kinds (Newman 2001; Watts 2004), including
Congressional cosponsorship and committee networks (Porter et al. 2005; Fowler
2006a,b; Porter et al. 2007; Zhang et al. 2008; Cho and Fowler 2006).
This approach holds a great deal of promise for understanding the internal dy-
namics of Congressional influence and prestige that has not yet been realized. In
particular, contributions between the campaign committees and leadership PACs
of members of Congress have increased dramatically in recent years. We analyze
the network formed by these campaign contributions, which provides a way of
looking at congressional parties and partisanship that is not related to roll call vot-
ing. It is also distinct from previous research on cosponsorship and committee
networks, which largely measure members’ legislative connections and stature.
The position of members of Congress within this contribution network may be
especially consequential. We hypothesize that members’ campaign contributions
are motivated by a desire to gain stature and influence within one’s party. As such,
we analyze each member’s position within the network, characterizing the rela-
tive importance of members according to several measure of network centrality
and suggesting how this approach could help predict institutional advancement
within Congress. We also investigate changes in the structure of the contribution
network and the relationship between network centrality and relevant covariates
over time.
1
2 Previous research
Campaign finance has received a good deal of attention from political scientists,
but this research has largely focused on who receives contributions from political
action committees (e.g. Grier and Munger 1993) and the effect of campaign con-
tributions on both electoral outcomes (e.g. Jacobson 2004) and voting in Congress
(e.g. Witko 2006). Until quite recently, very few have scholars have studied the
contributions that members of Congress make to each other.
Several studies that have been conducted thus far focus on predictors of con-
tribution recipients. For instance, analysts have considered whether members of
Congress give to other candidates based on gender (Kanthak 2007), ideological
proximity (Currinder 2003), or the competitiveness of the potential recipient’s cam-
paign (Potoski, Lowry, and Talbert 2003). Currinder (2003) also examines leader-
ship PAC contribution choices, finding that House members change their contri-
bution strategies when their party holds majority control of the chamber.
Others consider the relationship between intra-candidate giving and institu-
tional stature. Heberlig and Larson (2005) shows that House members in lead-
ership posts contribute relatively more money to House candidates and congres-
sional campaign committees than other members, especially during closely fought
battles for majority control, while Heberlig, Hetherington, and Larson (2006) find
that ideologically extreme members can win party leadership battles if they con-
tribute more funds to other members than their less extreme rivals. In addition,
Heberlig (2003) and Cann (2005) conclude that contributions to other members are
positively associated with securing desired committee assignments.
However, these individual- and dyad-level analyses ignore the wealth of infor-
mation contained in the structure of the contribution network, which has aggregate
properties that are not captured by previous studies. In addition, previous studies
do not capture members’ relative positions within the network, which could be
2
consequential within Congress as a measure of their power and prestige.
3 Theoretical approach
Parties are both the organizing forces of Congress and electoral teams competing
for seats and majority power. Members of Congress are asked to help their co-
partisans through votes on key issues, campaign endorsements, and fundraising.
One important aspect of a member’s relationship with her party is the efforts made
on behalf of other members and candidates, including campaign contributions.
These contributions not only support the electoral efforts of the party but help to
create or strengthen personal relationships that may be useful to the member.
It is clear that ambitious members of Congress approach this task in a strategic
fashion. Rather than simply giving randomly to other candidates, many members
appear to make contributions to fellow partisans as a mechanism to increase their
prestige and influence. The pattern of these contributions is consequential. In
particular, members who give generously to candidates who are popular targets
of their co-partisans will be more centrally located within their party’s contribu-
tion network than members whose donations are more irregular or idiosyncratic.
(Future work will consider whether centrally located members are more likely to
ascend into leadership and other prestigious positions than those who are not.)
4 Data
To construct our data, we identified all contributions between candidate commit-
tees and leadership PACs for the 1986–2006 electoral cycles using the Federal Elec-
tion Commission’s “Any Transaction from One Committee to Another” data files
(www.fec.gov/finance/disclosure/ftpdet.shtml). We then extracted all contri-
butions from each cycle in which the givers and receivers served in the subsequent
3
session of Congress (i.e. the 1986 electoral cycle was matched to the 100th Congress
of 1987–1988), a procedure that allows us to link contribution behavior to subse-
quent institutional influence.1 Members of Congress were identified using Poole
and Rosenthal’s DW-NOMINATE dataset (www.voteview.com). A corresponding
list of leadership PACs associated with members of Congress were coded from
biennial editions of the Almanac of Federal PACs.2
From these data, we construct eleven election cycles of social networks that
were partitioned by party.3 In these networks, members of Congress and candi-
dates who will serve in the subsequent Congress are nodes that are connected by
arcs representing campaign contributions. These arcs are directed, since contribu-
tions flow from a giver to a receiver, and valued since the contribution amount
may vary. The value of the arc represents the sum of all contributions between two
members’ committees during an electoral cycle. However, we do not utilize edge
value data in the analyses presented below due to difficulties posed by changes
in campaign finance law, inflation, and limitations in the available methodological
tools for analyzing directed, valued edge data.
Finally, we coded which members served in House and Senate leadership po-
sitions from annual editions of the Congressional Directory and the Congressional Bi-
ographical Directory (http://bioguide.congress.gov). We also employ Common
Space DW-NOMINATE scores as a measure of partisan voting behavior that is
comparable across chambers (www.voteview.com).1To guard against endogeneity, it is crucial that we link contributions at time t to institutional influence
(such as selection of leadership positions and committee chairs) at time t + 1.2In our coding, we considered a gift from a leadership PAC to be the same as a gift from a MC’s own
campaign committee. For leadership PACs associated with several members, we coded the gifts as havingcome from (and/or having been received by) each member separately, but divided the total value of thecontribution between the associated members.
3Nearly all contributions are partisan. The bulk of the donations that are coded as cross-party can beexplained by party switchers who are moving across the aisle mid-cycle. In the analysis below, all cross-partisan donations were discarded.
4
5 Results
In this section,we analyze the aggregate properties of the contribution networks;
present a simple graphic illustration of our data; identify the most central members
by party and Congress using three measures of centrality; and then describe how
centrality varies by leadership, seniority status, and roll-call voting behavior.
5.1 Aggregate contribution patterns
The plots in Figure 1 display four measures of the volume of contributions in
the Congressional contribution networks from 1985 and 2006 by party. Each one
shows a general trend toward increasing contribution activity from the early 1990s
to 2004 and then a dramatic decline in GOP giving in 2006 (possibly the result of
unfavorable electoral conditions).
[Figure 1 about here.]
Figure 1(a) plots the percentage of members who gave or received contributions
from their colleagues by election cycle (it thus represents the proportion who ap-
pear as nodes in our network data). Net participation in the contribution network
has increased substantially over the last two decades, particularly among Repub-
licans, though GOP participation declined somewhat in 2006. Figure 1(b) summa-
rizes the rapid growth in the number of arcs in the network (representing one or
more contributions from one member to another in a given election cycle), which
roughly tripled between 1992 and 2004. A more sophisticated network statistic
is presented in Figure 1(c), which combines the information in the previous two
plots into a single graph illustrating growth in the density of the network. This
measure is defined as the number of arcs between members in the network di-
vided by the total number of possible arcs.4 Despite the seemingly large numbers
4Formally, the density of a directed graph with L arcs and p nodes is Lp(p−1) .
5
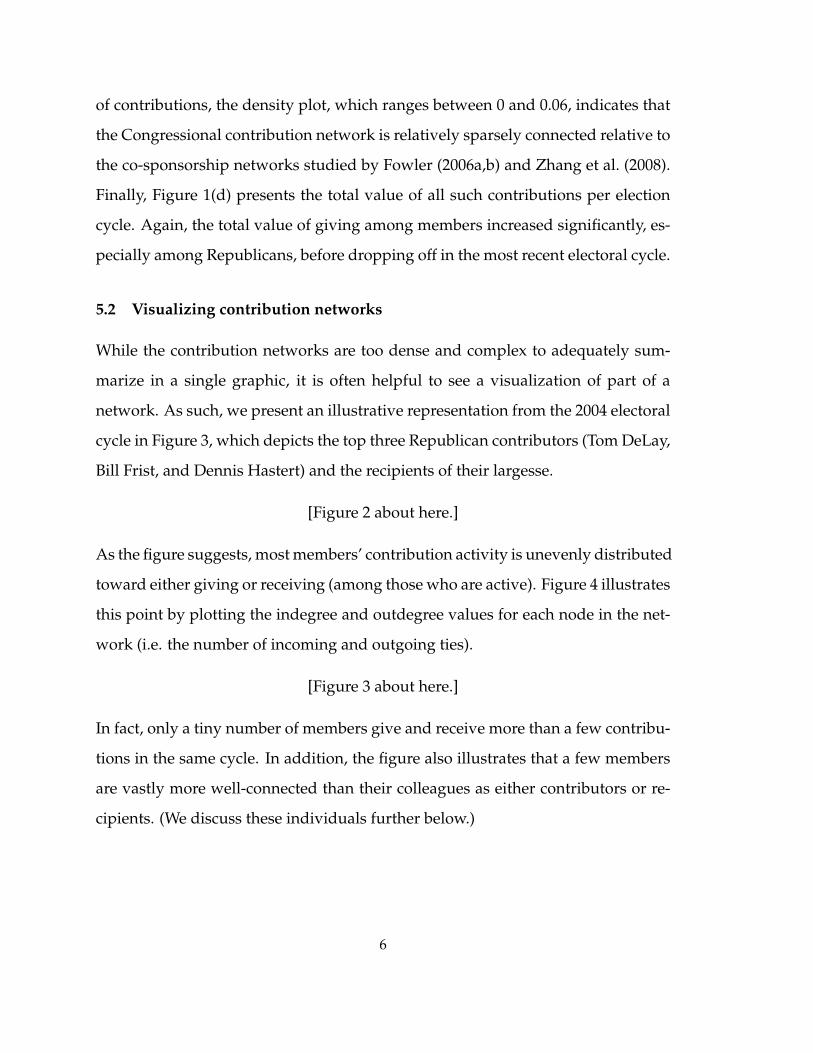
of contributions, the density plot, which ranges between 0 and 0.06, indicates that
the Congressional contribution network is relatively sparsely connected relative to
the co-sponsorship networks studied by Fowler (2006a,b) and Zhang et al. (2008).
Finally, Figure 1(d) presents the total value of all such contributions per election
cycle. Again, the total value of giving among members increased significantly, es-
pecially among Republicans, before dropping off in the most recent electoral cycle.
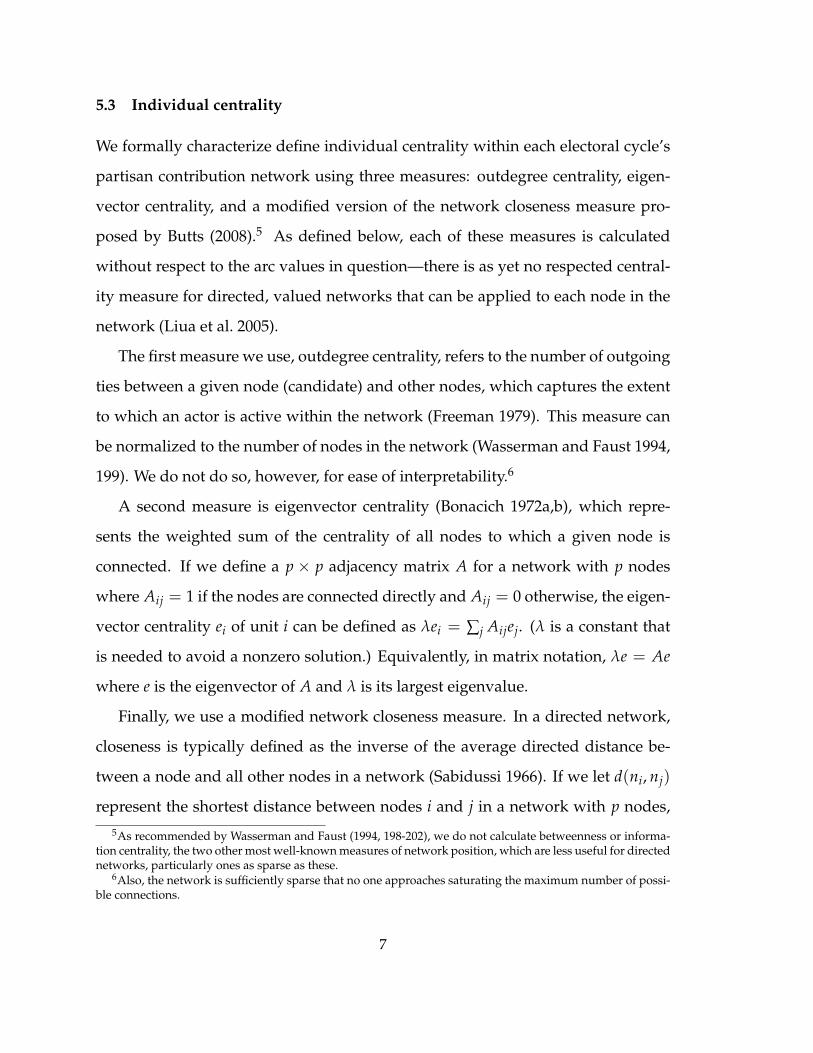
5.2 Visualizing contribution networks
While the contribution networks are too dense and complex to adequately sum-
marize in a single graphic, it is often helpful to see a visualization of part of a
network. As such, we present an illustrative representation from the 2004 electoral
cycle in Figure 3, which depicts the top three Republican contributors (Tom DeLay,
Bill Frist, and Dennis Hastert) and the recipients of their largesse.
[Figure 2 about here.]
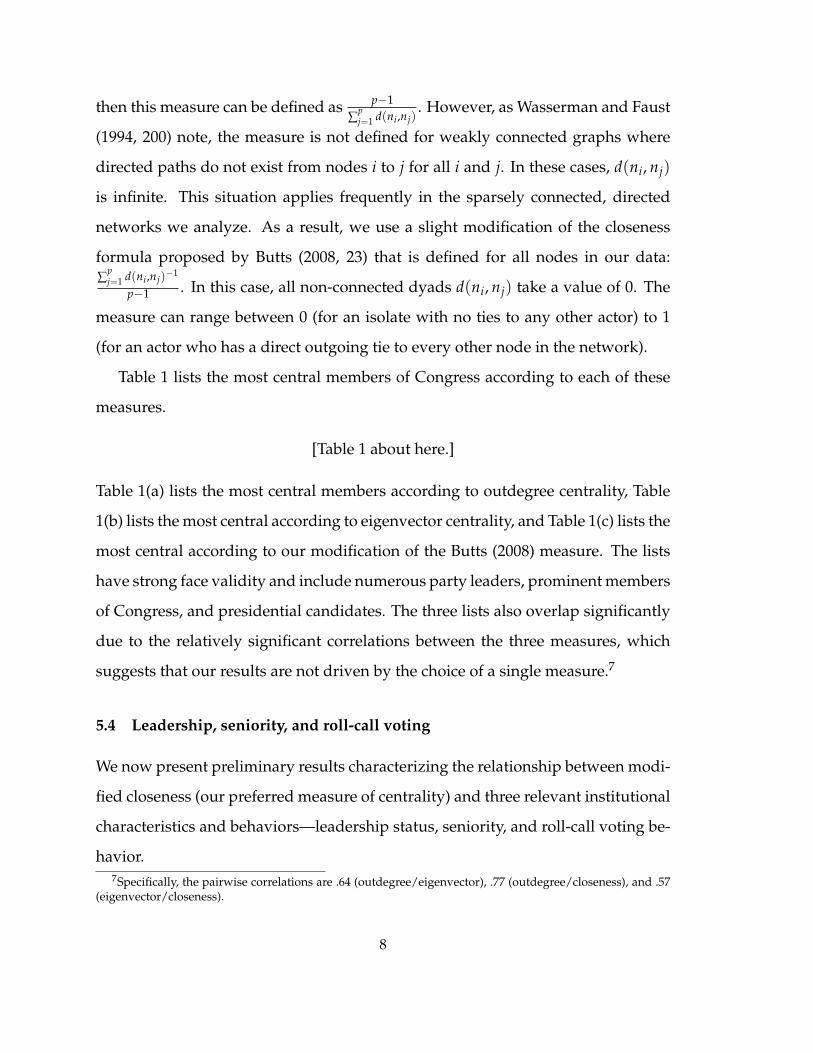
As the figure suggests, most members’ contribution activity is unevenly distributed
toward either giving or receiving (among those who are active). Figure 4 illustrates
this point by plotting the indegree and outdegree values for each node in the net-
work (i.e. the number of incoming and outgoing ties).
[Figure 3 about here.]
In fact, only a tiny number of members give and receive more than a few contribu-
tions in the same cycle. In addition, the figure also illustrates that a few members
are vastly more well-connected than their colleagues as either contributors or re-
cipients. (We discuss these individuals further below.)
6
5.3 Individual centrality
We formally characterize define individual centrality within each electoral cycle’s
partisan contribution network using three measures: outdegree centrality, eigen-
vector centrality, and a modified version of the network closeness measure pro-
posed by Butts (2008).5 As defined below, each of these measures is calculated
without respect to the arc values in question—there is as yet no respected central-
ity measure for directed, valued networks that can be applied to each node in the
network (Liua et al. 2005).
The first measure we use, outdegree centrality, refers to the number of outgoing
ties between a given node (candidate) and other nodes, which captures the extent
to which an actor is active within the network (Freeman 1979). This measure can
be normalized to the number of nodes in the network (Wasserman and Faust 1994,
199). We do not do so, however, for ease of interpretability.6
A second measure is eigenvector centrality (Bonacich 1972a,b), which repre-
sents the weighted sum of the centrality of all nodes to which a given node is
connected. If we define a p × p adjacency matrix A for a network with p nodes
where Aij = 1 if the nodes are connected directly and Aij = 0 otherwise, the eigen-
vector centrality ei of unit i can be defined as λei = ∑j Aijej. (λ is a constant that
is needed to avoid a nonzero solution.) Equivalently, in matrix notation, λe = Ae
where e is the eigenvector of A and λ is its largest eigenvalue.
Finally, we use a modified network closeness measure. In a directed network,
closeness is typically defined as the inverse of the average directed distance be-
tween a node and all other nodes in a network (Sabidussi 1966). If we let d(ni, nj)
represent the shortest distance between nodes i and j in a network with p nodes,5As recommended by Wasserman and Faust (1994, 198-202), we do not calculate betweenness or informa-
tion centrality, the two other most well-known measures of network position, which are less useful for directednetworks, particularly ones as sparse as these.
6Also, the network is sufficiently sparse that no one approaches saturating the maximum number of possi-ble connections.
7
then this measure can be defined as p−1∑
pj=1 d(ni,nj)
. However, as Wasserman and Faust
(1994, 200) note, the measure is not defined for weakly connected graphs where
directed paths do not exist from nodes i to j for all i and j. In these cases, d(ni, nj)
is infinite. This situation applies frequently in the sparsely connected, directed
networks we analyze. As a result, we use a slight modification of the closeness
formula proposed by Butts (2008, 23) that is defined for all nodes in our data:∑
pj=1 d(ni,nj)−1
p−1 . In this case, all non-connected dyads d(ni, nj) take a value of 0. The
measure can range between 0 (for an isolate with no ties to any other actor) to 1
(for an actor who has a direct outgoing tie to every other node in the network).
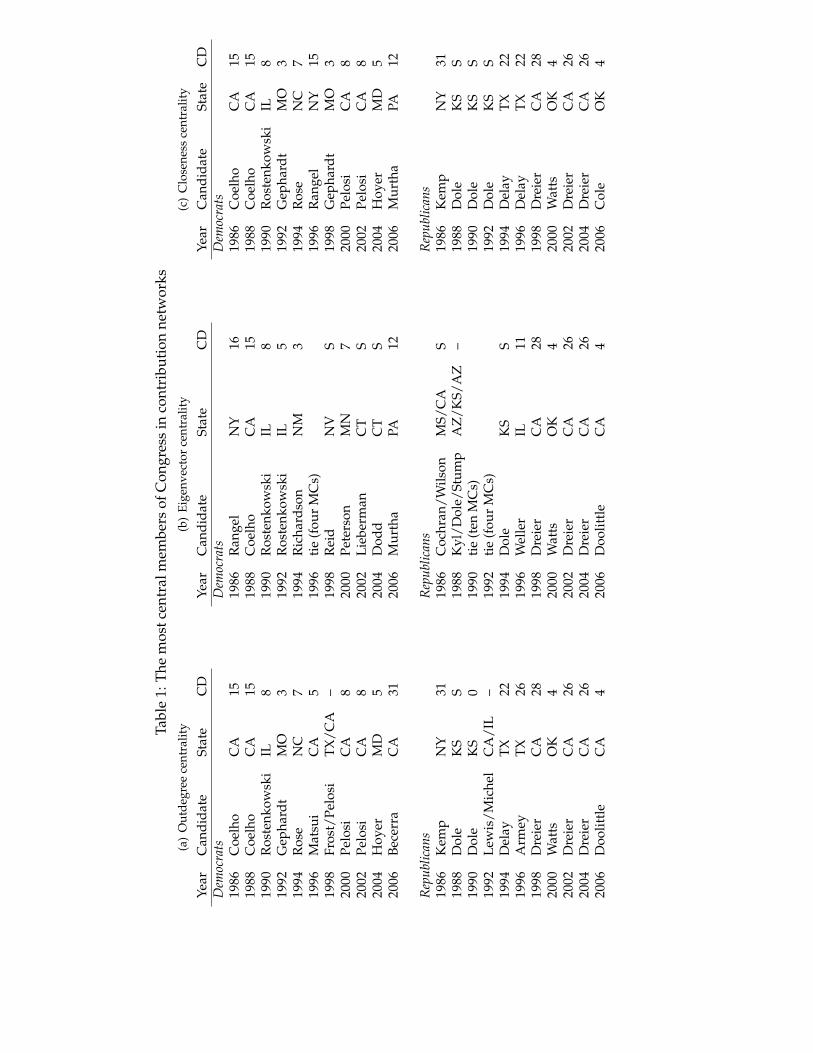
Table 1 lists the most central members of Congress according to each of these
measures.
[Table 1 about here.]
Table 1(a) lists the most central members according to outdegree centrality, Table
1(b) lists the most central according to eigenvector centrality, and Table 1(c) lists the
most central according to our modification of the Butts (2008) measure. The lists
have strong face validity and include numerous party leaders, prominent members
of Congress, and presidential candidates. The three lists also overlap significantly
due to the relatively significant correlations between the three measures, which
suggests that our results are not driven by the choice of a single measure.7
5.4 Leadership, seniority, and roll-call voting
We now present preliminary results characterizing the relationship between modi-
fied closeness (our preferred measure of centrality) and three relevant institutional
characteristics and behaviors—leadership status, seniority, and roll-call voting be-
havior.7Specifically, the pairwise correlations are .64 (outdegree/eigenvector), .77 (outdegree/closeness), and .57
(eigenvector/closeness).
8
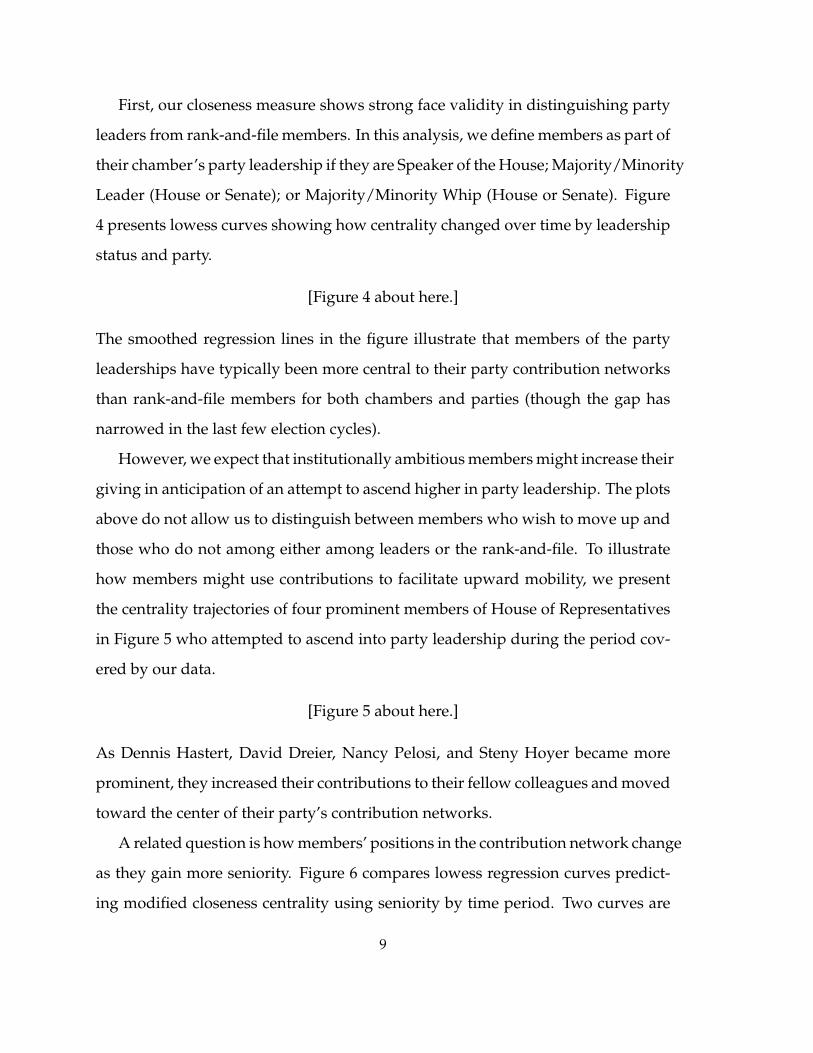
First, our closeness measure shows strong face validity in distinguishing party
leaders from rank-and-file members. In this analysis, we define members as part of
their chamber’s party leadership if they are Speaker of the House; Majority/Minority
Leader (House or Senate); or Majority/Minority Whip (House or Senate). Figure
4 presents lowess curves showing how centrality changed over time by leadership
status and party.
[Figure 4 about here.]
The smoothed regression lines in the figure illustrate that members of the party
leaderships have typically been more central to their party contribution networks
than rank-and-file members for both chambers and parties (though the gap has
narrowed in the last few election cycles).
However, we expect that institutionally ambitious members might increase their
giving in anticipation of an attempt to ascend higher in party leadership. The plots
above do not allow us to distinguish between members who wish to move up and
those who do not among either among leaders or the rank-and-file. To illustrate
how members might use contributions to facilitate upward mobility, we present
the centrality trajectories of four prominent members of House of Representatives
in Figure 5 who attempted to ascend into party leadership during the period cov-
ered by our data.
[Figure 5 about here.]
As Dennis Hastert, David Dreier, Nancy Pelosi, and Steny Hoyer became more
prominent, they increased their contributions to their fellow colleagues and moved
toward the center of their party’s contribution networks.
A related question is how members’ positions in the contribution network change
as they gain more seniority. Figure 6 compares lowess regression curves predict-
ing modified closeness centrality using seniority by time period. Two curves are
9

presented for each party—one for the era largely dominated by Democratic Con-
gressional majorities (1985–1994) and one for the more recent period consisting
almost entirely of Republican majorities (1995–2006).
[Figure 6 about here.]
In the more recent period, members appear to increase in centrality more rapidly
as their seniority increases in the more recent period. One interpretation of this
finding is that ambitious members are using contributions to other members to try
to gain stature and bypass the seniority hierarchy.
Finally, given previous research examining the relationship between ideological
position and contributions to other members, Figure 7 examines the relationship
between members’ ideological position on the first dimension of Common Space
DW-NOMINATE and our modified closeness measure of network centrality.
[Figure 7 about here.]
The graphic, which uses a locally weighted regression fit, shows that the most cen-
tral MCs in the contribution networks are located near the median member of their
parties by chamber.8 Moreover, average closeness declines as members become
more extreme relative to their party median except for centrist Senate Democrats,
whose centrality shows a non-monotonic increase near the Common Space DW-
NOMINATE midpoint.
6 Conclusion
In this paper, we describe the Congressional contribution network for each elec-
toral cycle of the 1985–2006 period, show that contribution activity in these net-
works has generally increased over time, characterize the positions of members8To avoid extrapolating into sparsely populated regions of the data, the lowess fits in the figure are censored
above 0 for Democrats and below 0 for Republicans.
10
within them according to three measures of network centrality, and examine the
relationship between member centrality and leadership status, seniority, and roll-
call voting behavior.
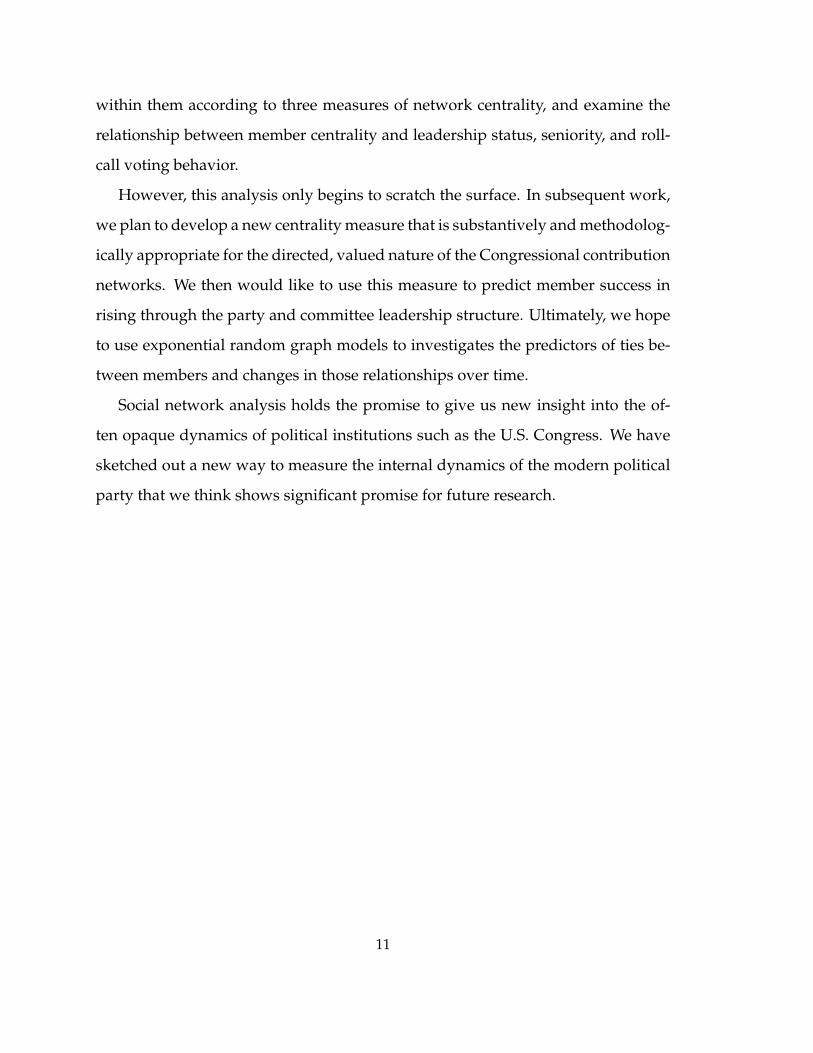
However, this analysis only begins to scratch the surface. In subsequent work,
we plan to develop a new centrality measure that is substantively and methodolog-
ically appropriate for the directed, valued nature of the Congressional contribution
networks. We then would like to use this measure to predict member success in
rising through the party and committee leadership structure. Ultimately, we hope
to use exponential random graph models to investigates the predictors of ties be-
tween members and changes in those relationships over time.
Social network analysis holds the promise to give us new insight into the of-
ten opaque dynamics of political institutions such as the U.S. Congress. We have
sketched out a new way to measure the internal dynamics of the modern political
party that we think shows significant promise for future research.
11
References
Bonacich, Phillip. 1972a. “Factoring and weighting approaches to status scores andclique identification.” Journal of Mathematical Sociology 2 (1): 113–120.
Bonacich, Phillip. 1972b. “Technique for Analyzing Overlapping Memberships.”Sociological Methodology 4: 176–185.
Butts, Carter T. 2008. “Social Network Analysis with sna.” Journal of StatisticalSoftware 24 (6).
Cann, Damon M. 2005. “The Decline of the Seniority System in the U.S. House ofRepresentatives.” Paper presented at the annual meeting of the Southern Politi-cal Science Association.
Cho, Wendy K. Tam, and James H. Fowler. 2006. “Legislative Success In A SmallWorld: Social network analysis and the dynamics of Congressional legislation.”Unpublished manuscript.
Currinder, Marian L. 2003. “Leadership PAC Contribution Strategies and HouseMember Ambitions.” Legislative Studies Quarterly 28 (4): 551–577.
Fowler, James H. 2006a. “Connecting the Congress: A Study of CosponsorshipNetworks.” Political Analysis 14 (4): 456.
Fowler, James H. 2006b. “Legislative cosponsorship networks in the US House andSenate.” Social Networks 28 (4): 454–465.
Freeman, Linton C. 1979. “Centrality in social networks: Conceptual clarification.”Social Networks 1 (3): 215–239.
Grier, Kevin B., and Michael C. Munger. 1993. “Comparing Interest Group PACContributions to House and Senate Incumbents, 1980-1986.” Journal of Politics55: 615-643.
Heberlig, Eric. 2003. “Congressional Parties, Fundraising, and Committee Ambi-tion.” Political Research Quarterly 56 (2): 151–161.
Heberlig, Eric, and Bruce Larson. 2005. “Redistributing Campaign Funds by USHouse Members: The Spiraling Costs of the Permanent Campaign.” LegislativeStudies Quarterly 30 (4): 597–624.
Heberlig, Eric, Marc Hetherington, and Bruce Larson. 2006. “The Price of Leader-ship: Campaign Money and the Polarization of Congressional Parties.” Journalof Politics 68 (4): 992–1005.
Jacobson, Gary C. 2004. Politics of Congressional Elections. New York: Longman.

Kanthak, Kristin A. 2007. “Crystal Elephants and Committee Chairs: CampaignContributions and Leadership Races in the US House of Representatives.” Amer-ican Politics Research 35 (3): 389–406.
Liua, Xiaoming, Johan Bollen, Michael L. Nelson, and Herbert Van de Sompela.2005. “Co-authorship networks in the digital library research community.” In-formation Processing and Management 41 (6): 1462–1480.
Newman, M.E.J. 2001. “The structure of scientific collaboration networks.” ProcNatl Acad Sci US A 98 (2): 404–409.
Poole, Keith T. 1998. “Estimating a Basic Space From A Set of Issue Scales.” Amer-ican Journal of Political Science 42: 954-993.
Porter, Mason A., Peter J. Mucha, M.E.J. Newman, and A.J. Friend. 2007. “Com-munity structure in the United States House of Representatives.” Physica A: Sta-tistical Mechanics and its Applications 386 (1): 414–438.
Porter, Mason A., Peter J. Mucha, M.E.J. Newman, and Casey M. Warmbrand. 2005.“A network analysis of committees in the US House of Representatives.” ProcNatl Acad Sci US A 102 (20): 7057–7062.
Potoski, Matthew, Robert C. Lowry, and Jeffrey Talbert. 2003. “Leadership PACs,Campaign Finance and Congressional Elections.” Presented at the annual meet-ing of the Midwest Political Science Association.
Sabidussi, Gert. 1966. “The centrality index of a graph.” Psychometrika 31 (4): 581–603.
Wasserman, Stanley, and Katherine Faust. 1994. Social Network Analysis: Methodsand Applications. Cambridge University Press.
Watts, Duncan J. 2004. “The ‘new’ science of networks.” Annual Review of Sociology30: 243–270.
Witko, Christopher. 2006. “PACs, Issue Context, and Congressional Decisionmak-ing.” Political Research Quarterly 59 (2): 283–295.
Zhang, Yan, A.J. Friend, Amanda L. Traud, Mason A. Porter, James H. Fowler, andPeter J. Mucha. 2008. “Community Structure in Congressional CosponsorshipNetworks.” Physica A: Statistical Mechanics and its Applications 387 (7): 1705–1712.
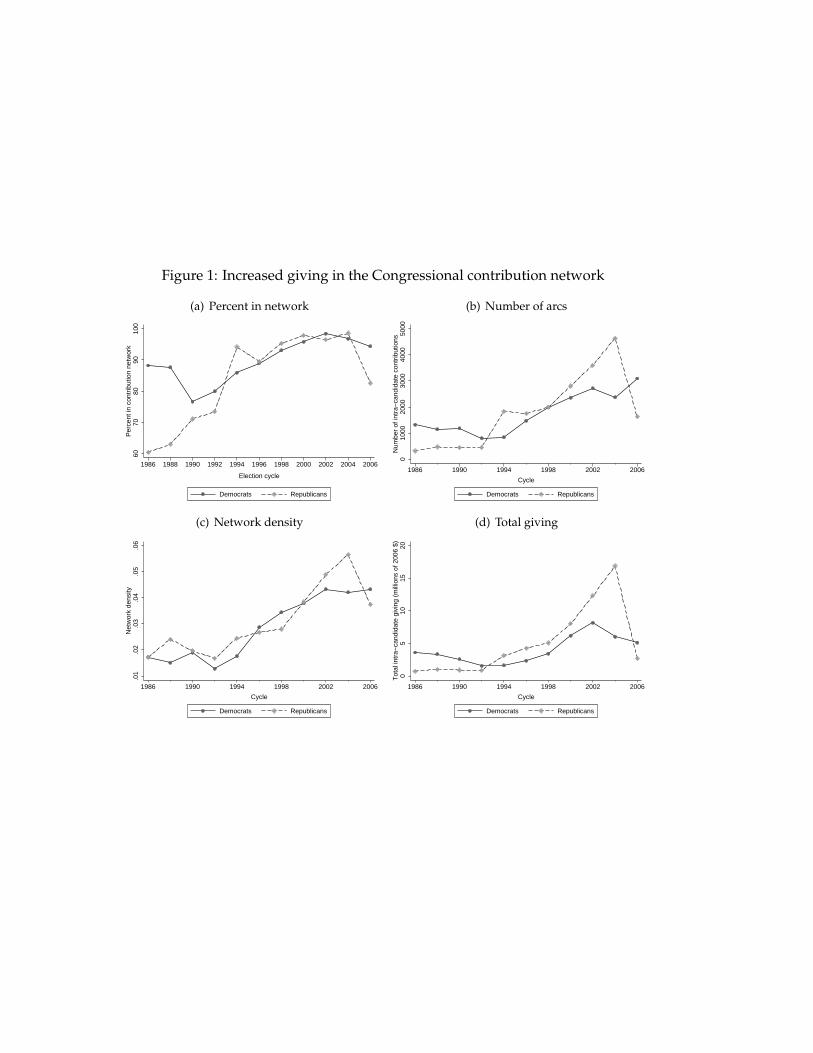
Figure 1: Increased giving in the Congressional contribution network
(a) Percent in network
6070
8090
100
Per
cent
in c
ontr
ibut
ion
netw
ork
1986 1988 1990 1992 1994 1996 1998 2000 2002 2004 2006
Election cycle
Democrats Republicans
(b) Number of arcs
010
0020
0030
0040
0050
00N
umbe
r of
intr
a−ca
ndid
ate
cont
ribut
ions
1986 1990 1994 1998 2002 2006
Cycle
Democrats Republicans
(c) Network density
.01
.02
.03
.04
.05
.06
Net
wor
k de
nsity
1986 1990 1994 1998 2002 2006
Cycle
Democrats Republicans
(d) Total giving
05
1015
20T
otal
intr
a−ca
ndid
ate
givi
ng (
mill
ions
of 2
006
$)
1986 1990 1994 1998 2002 2006
Cycle
Democrats Republicans
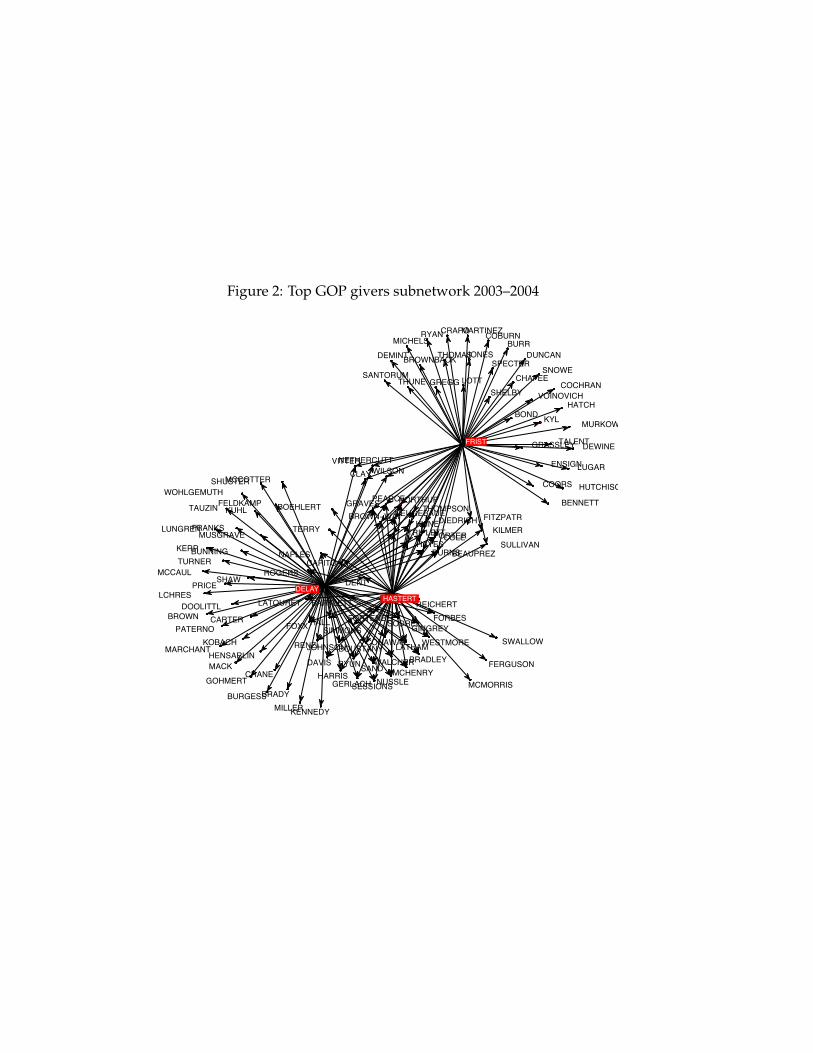
Figure 2: Top GOP givers subnetwork 2003–2004
BARTLETT
BEAUPREZ
BENNETTBOEHLERT
BOND
BOUSTANY
BRADLEY
BRADY
BROWN
BROWN!WAI
BROWNBACK
BUNNING
BURGESS
BURNS
BURR
CAPITO
CARTER
CHAFEE
CLAY
COBURN
COCHRAN
COLE
CONAWAY
COORS
CRANE
CRAPO
DAVIS
DELAY
DEMINT
DENT
DEWINE
DIEDRICH
DOOLITTL
DUNCAN
ENSIGN
FELDKAMP
FERGUSON
FITZPATR
FORBESFORTENBE
FOXX
FRANKS
FRIST
GERLACH
GILCHRES
GINGREY
GOHMERT
GRASSLEY
GRAVES
GREGG
HALL
HARRIS
HASTERT
HATCH
HAYES
HENSARLIN
HUTCHISON
JOHNSON
JONES
KENNEDY
KERR
KILMERKLINE
KOBACH
KUHL
KYL
LATHAM
LATOURET
LOTT
LUGAR
LUNGREN
MACK
MARCHANT
MARTINEZ
MCCAUL
MCCOTTER
MCHENRY
MCMORRIS
MICHELS
MILLER
MURKOWSKI
MUSGRAVE
NAPLES
NETHERCUTT
NEUGEBAUE
NORTHUP
NUSSLE
PATERNO
PEARCE
PORTER
PRICE
REICHERT
RENZI
ROGERS
RYAN
RYUNSAND
SANTORUM
SESSIONS
SHAW
SHELBY
SHUSTER
SIMMONS
SNOWE
SODREL
SPECTER
SULLIVAN
SWALLOW
TALENT
TAUZIN
TERRY
THOMAS
THOMPSON
THUNE
TRIPLETT
TURNER
VITTER
VOINOVICH
WALCHER
WESTMORE
WILSON
WOHLGEMUTH
Republicans Top Giver Sub!Network 2003 ! 2004
DELAY
HASTERT
FRIST

Figure 3: Indegree and outdegree centrality 1985–2006
050
100
150
Inde
gree
cen
tral
ity
0 50 100 150 200 250Outdegree centrality

Figure 4: Leader vs. rank-and-file centrality by chamber 1985–2006
(a) House0
.1.2
.3.4
.5
1986 1992 1998 2004 1986 1992 1998 2004
Democrats Republicans
Leaders in the House Rank and file
Mod
ified
clo
sene
ss
Election cycle
Locally weighted regression fit
(b) Senate
0.1
.2.3
1986 1992 1998 2004 1986 1992 1998 2004
Democrats Republicans
Leaders in the Senate Rank and file
Mod
ified
clo
sene
ss
Election cycle
Locally weighted regression fit

Figure 5: Prominent career trajectories within the partisan networks
(a) Hastert
0.1
.2.3
.4.5
Mod
ified
clo
sene
ss
1986 1990 1994 1998 2002 2006
Election cycle
(b) Dreier
0.2
.4.6
.8M
odifi
ed c
lose
ness
1986 1990 1994 1998 2002 2006
Election cycle
(c) Pelosi
0.1
.2.3
.4.5
Mod
ified
clo
sene
ss
1986 1990 1994 1998 2002 2006
Election cycle
(d) Hoyer
0.1
.2.3
.4.5
Mod
ified
clo
sene
ss
1986 1990 1994 1998 2002 2006
Election cycle
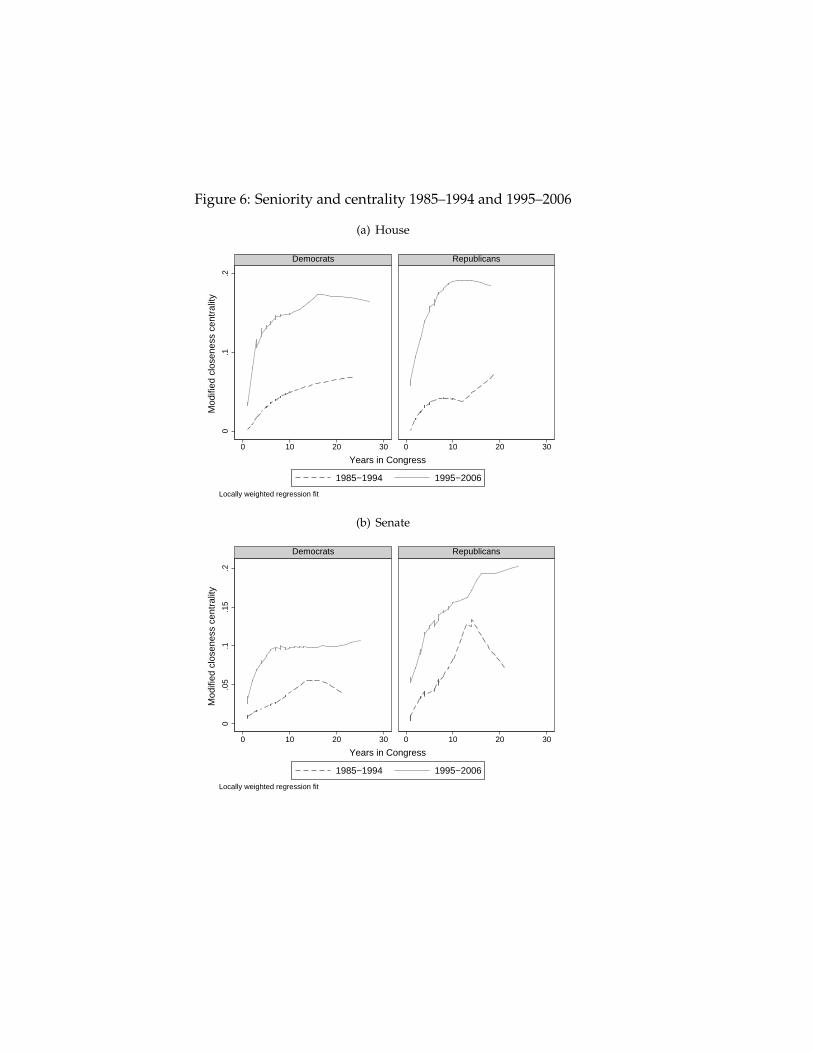
Figure 6: Seniority and centrality 1985–1994 and 1995–2006
(a) House0
.1.2
0 10 20 30 0 10 20 30
Democrats Republicans
1985−1994 1995−2006
Mod
ified
clo
sene
ss c
entr
ality
Years in Congress
Locally weighted regression fit
(b) Senate
0.0
5.1
.15
.2
0 10 20 30 0 10 20 30
Democrats Republicans
1985−1994 1995−2006
Mod
ified
clo
sene
ss c
entr
ality
Years in Congress
Locally weighted regression fit
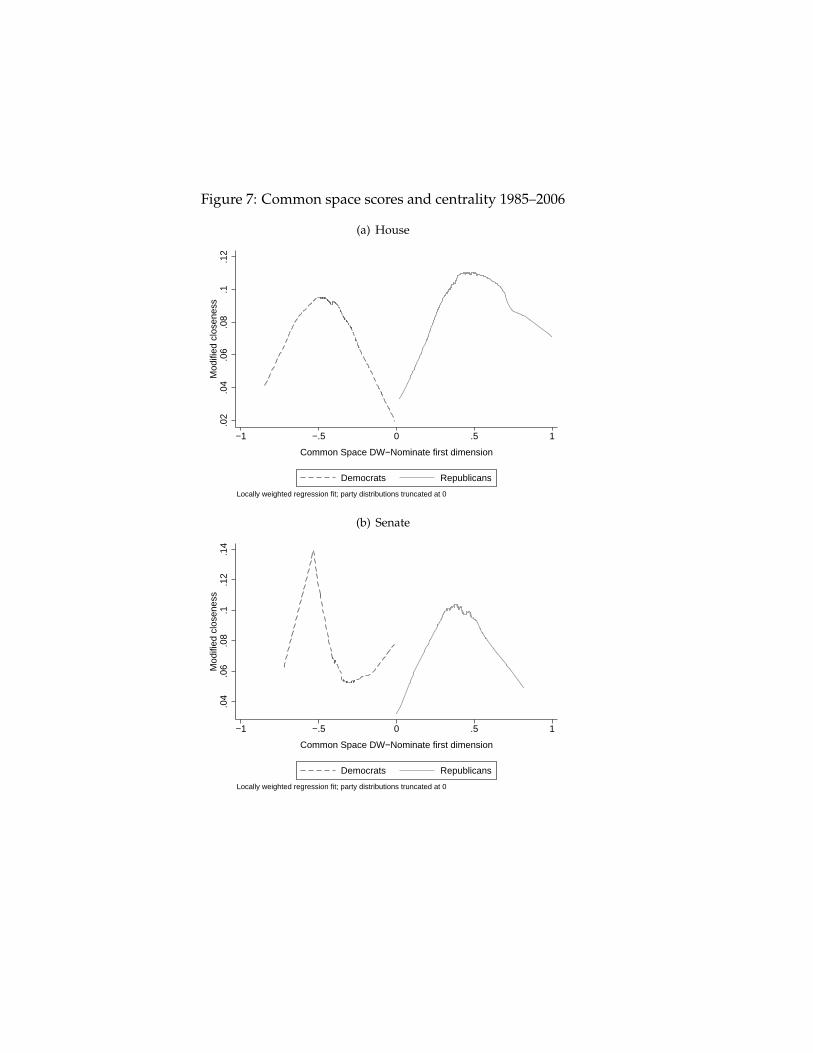
Figure 7: Common space scores and centrality 1985–2006
(a) House.0
2.0
4.0
6.0
8.1
.12
Mod
ified
clo
sene
ss
−1 −.5 0 .5 1
Common Space DW−Nominate first dimension
Democrats Republicans
Locally weighted regression fit; party distributions truncated at 0
(b) Senate
.04
.06
.08
.1.1
2.1
4M
odifi
ed c
lose
ness
−1 −.5 0 .5 1
Common Space DW−Nominate first dimension
Democrats Republicans
Locally weighted regression fit; party distributions truncated at 0
Tabl
e1:
The
mos
tcen
tral
mem
bers
ofC
ongr
ess
inco
ntri
buti
onne
twor
ks(a
)O
utde
gree
cent
ralit
y
Year
Can
dida
teSt
ate
CD
Dem
ocra
ts19
86C
oelh
oC
A15
1988
Coe
lho
CA
1519
90R
oste
nkow
ski
IL8
1992
Gep
hard
tM
O3
1994
Ros
eN
C7
1996
Mat
sui
CA
519
98Fr
ost/
Pelo
siTX
/CA
–20
00Pe
losi
CA
820
02Pe
losi
CA
820
04H
oyer
MD
520
06Be
cerr
aC
A31
Rep
ublic
ans
1986
Kem
pN
Y31
1988
Dol
eK
SS
1990
Dol
eK
S0
1992
Lew
is/M
iche
lC
A/I
L–
1994
Del
ayT
X22
1996
Arm
eyT
X26
1998
Dre
ier
CA
2820
00W
atts
OK
420
02D
reie
rC
A26
2004
Dre
ier
CA
2620
06D
oolit
tle
CA
4
(b)
Eige
nvec
tor
cent
ralit
y
Year
Can
dida
teSt
ate
CD
Dem
ocra
ts19
86R
ange
lN
Y16
1988
Coe
lho
CA
1519
90R
oste
nkow
ski
IL8
1992
Ros
tenk
owsk
iIL
519
94R
icha
rdso
nN
M3
1996
tie
(fou
rM
Cs)
1998
Rei
dN
VS
2000
Pete
rson
MN
720
02Li
eber
man
CT
S20
04D
odd
CT
S20
06M
urth
aPA
12
Rep
ublic
ans
1986
Coc
hran
/Wils
onM
S/C
AS
1988
Kyl
/Dol
e/St
ump
AZ
/KS/
AZ
–19
90ti
e(t
enM
Cs)
1992
tie
(fou
rM
Cs)
1994
Dol
eK
SS
1996
Wel
ler
IL11
1998
Dre
ier
CA
2820
00W
atts
OK
420
02D
reie
rC
A26
2004
Dre
ier
CA
2620
06D
oolit
tle
CA
4
(c)
Clo
sene
ssce
ntra
lity
Year
Can
dida
teSt
ate
CD
Dem
ocra
ts19
86C
oelh
oC
A15
1988
Coe
lho
CA
1519
90R
oste
nkow
ski
IL8
1992
Gep
hard
tM
O3
1994
Ros
eN
C7
1996
Ran
gel
NY
1519
98G
epha
rdt
MO
320
00Pe
losi
CA
820
02Pe
losi
CA
820
04H
oyer
MD
520
06M
urth
aPA
12
Rep
ublic
ans
1986
Kem
pN
Y31
1988
Dol
eK
SS
1990
Dol
eK
SS
1992
Dol
eK
SS
1994
Del
ayTX
2219
96D
elay
TX22
1998
Dre
ier
CA
2820
00W
atts
OK
420
02D
reie
rC
A26
2004
Dre
ier
CA
2620
06C
ole
OK
4