
Passenger Four-Wheeler Vehicles - Dhanlaxmi Bank · Passenger Four-Wheeler Vehicles: ... Lower...
14
September 28, 2011 September 28, 2011 Highlights Exports Led Volume Growth Top Players Losing Market Share Structural Shift Expected In Market Shares Passenger Four-Wheeler Vehicles
Transcript of Passenger Four-Wheeler Vehicles - Dhanlaxmi Bank · Passenger Four-Wheeler Vehicles: ... Lower...
September 28, 2011
September 28, 2011
Highlights
Exports Led Volume Growth
Top Players Losing Market Share
Structural Shift Expected In Market Shares
Passenger Four-Wheeler Vehicles
September 28, 2011
Passenger Four-Wheeler Vehicles: Structural Shift On The Cards
Since the beginning of the current financial year the passenger four wheeler (PV-4w) industry has been witnessing a marked slowdown
in demand, largely due to high inflation, successive rise in interest rates and surging fuel prices, cumulatively impacting consumer sen-
timent. The total volumes for the PV-4w has increased by only 5% Y-o-Y basis from April-August 2011 (YTDFY12). The growth rate
has significantly declined from last year when the industry grew at a 28% during the same period in FY11.
The ripple effects of high inflation and cost of ownership (direct as well as indirect) have taken a toll on domestic demand as volumes
have been severely impacted in the current year. Domestic sales of PV-4w last year had grown more than the industry average at
29.2%, which has now tumbled down to 1.7% on a Y-o-Y basis in YTDFY12. The only saving grace in the current year has been the
surge in export volumes for the industry as companies get more aggressive in finding new markets to support volume growth.
Exports
The growth in export volumes has happened despite the slowdown in Europe, one of the major destinations for ―Made In India‖ cars, as
automobile makers have been aggressively scouting for newer markets. For instance, Ford recently added Mexico to its list of export
markets after South Africa and Nepal, while Maruti has explored destinations like Australia, Hong Kong, Taiwan Brunei and South
Africa.
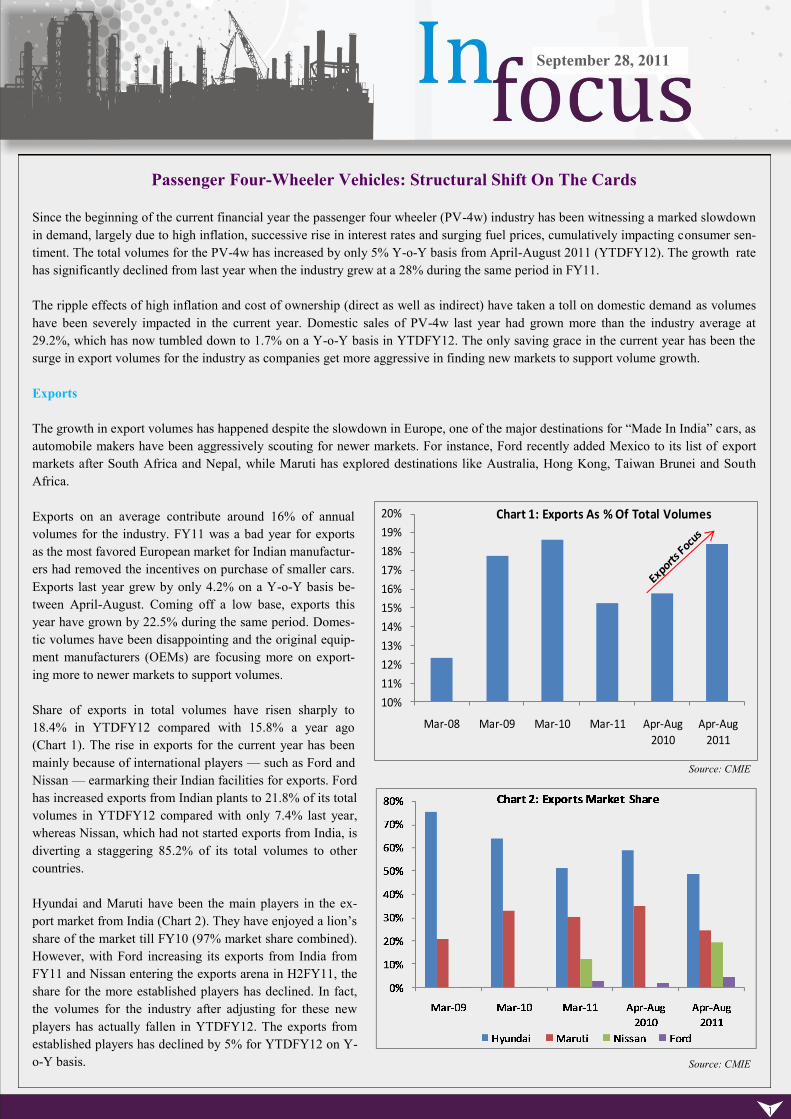
Exports on an average contribute around 16% of annual
volumes for the industry. FY11 was a bad year for exports
as the most favored European market for Indian manufactur-
ers had removed the incentives on purchase of smaller cars.
Exports last year grew by only 4.2% on a Y-o-Y basis be-
tween April-August. Coming off a low base, exports this
year have grown by 22.5% during the same period. Domes-
tic volumes have been disappointing and the original equip-
ment manufacturers (OEMs) are focusing more on export-
ing more to newer markets to support volumes.
Share of exports in total volumes have risen sharply to
18.4% in YTDFY12 compared with 15.8% a year ago
(Chart 1). The rise in exports for the current year has been
mainly because of international players — such as Ford and
Nissan — earmarking their Indian facilities for exports. Ford
has increased exports from Indian plants to 21.8% of its total
volumes in YTDFY12 compared with only 7.4% last year,
whereas Nissan, which had not started exports from India, is
diverting a staggering 85.2% of its total volumes to other
countries.
Hyundai and Maruti have been the main players in the ex-
port market from India (Chart 2). They have enjoyed a lion‘s
share of the market till FY10 (97% market share combined).
However, with Ford increasing its exports from India from
FY11 and Nissan entering the exports arena in H2FY11, the
share for the more established players has declined. In fact,
the volumes for the industry after adjusting for these new
players has actually fallen in YTDFY12. The exports from
established players has declined by 5% for YTDFY12 on Y-
o-Y basis.
Source: CMIE
Source: CMIE
10%
11%
12%
13%
14%
15%
16%
17%
18%
19%
20%
Mar-08 Mar-09 Mar-10 Mar-11 Apr-Aug
2010
Apr-Aug
2011
Chart 1: Exports As % Of Total Volumes
September 28, 2011
Market Share
The entry of new players in the Indian market with their international designs has changed the
face of the industry. Newer incumbents have made inroads with their aggressive strategies and
a flurry of launches specifically catering to Indian consumers.
The Top Three car manufacturers (Maruti, Hyundai & Tata Motors) have all lost their market
share to the newer players (Table 1). The market share of Maruti has been severely hit because
of frequent strikes and the resultant production stoppage. However, the decline in market share
has also been due to the market getting increasingly competitive.
Companies like M&M, Toyota, Nissan and Volkswagen have taken advantage of the low pro-
duction from Maruti to garner a fair share in the total volumes. Hyundai, in spite of being in
the best position to take advantage of the current situation in Maruti, has failed to increase its
market share. Tata Motors has also lost ground in the absence of any successful launches.
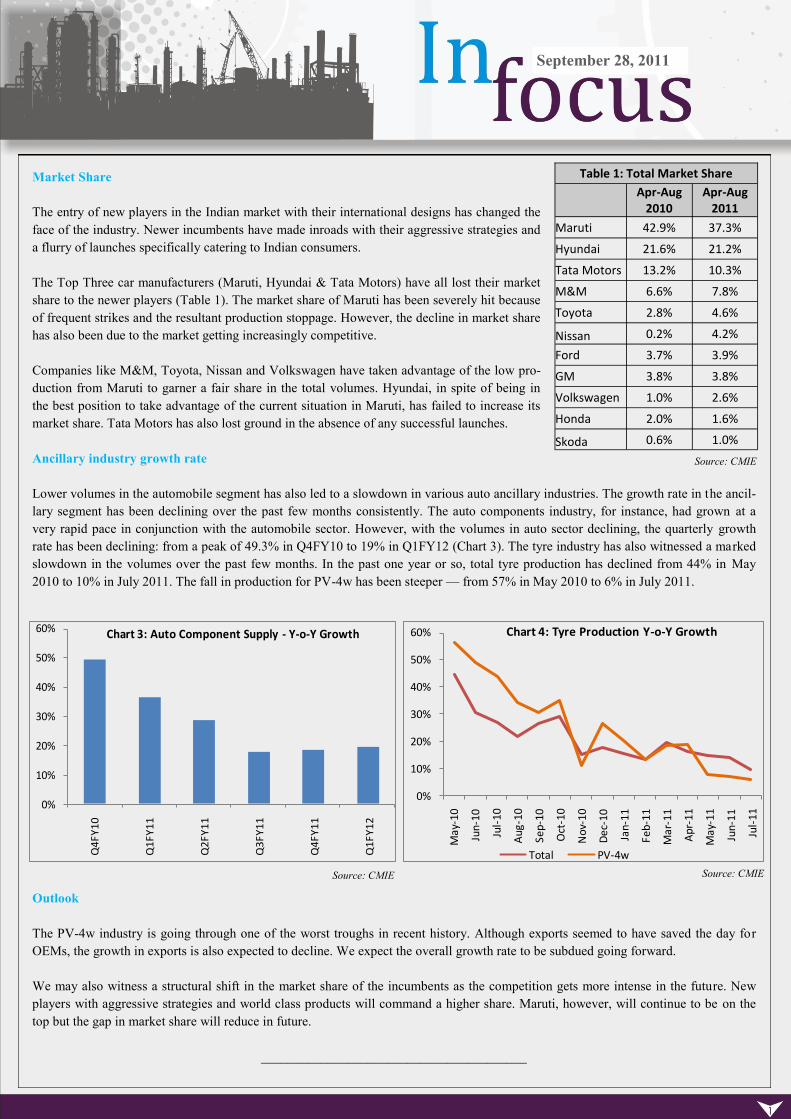
Ancillary industry growth rate
Lower volumes in the automobile segment has also led to a slowdown in various auto ancillary industries. The growth rate in the ancil-
lary segment has been declining over the past few months consistently. The auto components industry, for instance, had grown at a
very rapid pace in conjunction with the automobile sector. However, with the volumes in auto sector declining, the quarterly growth
rate has been declining: from a peak of 49.3% in Q4FY10 to 19% in Q1FY12 (Chart 3). The tyre industry has also witnessed a marked
slowdown in the volumes over the past few months. In the past one year or so, total tyre production has declined from 44% in May
2010 to 10% in July 2011. The fall in production for PV-4w has been steeper — from 57% in May 2010 to 6% in July 2011.
Outlook
The PV-4w industry is going through one of the worst troughs in recent history. Although exports seemed to have saved the day for
OEMs, the growth in exports is also expected to decline. We expect the overall growth rate to be subdued going forward.
We may also witness a structural shift in the market share of the incumbents as the competition gets more intense in the future. New
players with aggressive strategies and world class products will command a higher share. Maruti, however, will continue to be on the
top but the gap in market share will reduce in future.
________________________________________
0%
10%
20%
30%
40%
50%
60%
Q4
FY
10
Q1
FY
11
Q2
FY
11
Q3
FY
11
Q4
FY
11
Q1
FY
12
Chart 3: Auto Component Supply - Y-o-Y Growth
0%
10%
20%
30%
40%
50%
60%
May
-10
Jun
-10
Jul-
10
Aug
-10
Sep
-10
Oct
-10
No
v-1
0
De
c-1
0
Jan
-11
Feb
-11
Ma
r-1
1
Ap
r-1
1
May
-11
Jun
-11
Jul-
11
Chart 4: Tyre Production Y-o-Y Growth
Total PV-4w
Table 1: Total Market Share
Apr-Aug
2010 Apr-Aug
2011
Maruti 42.9% 37.3%
Hyundai 21.6% 21.2%
Tata Motors 13.2% 10.3%
M&M 6.6% 7.8%
Toyota 2.8% 4.6%
Nissan 0.2% 4.2%
Ford 3.7% 3.9%
GM 3.8% 3.8%
Volkswagen 1.0% 2.6%
Honda 2.0% 1.6%
Skoda 0.6% 1.0%
Source: CMIE
Source: CMIE Source: CMIE
September 28, 2011
Better Monsoon Boosts Prospects For Farm Output
Monsoons 29% above normal in week till Sept 21: Monsoons were 29% above normal in the week to September 21, strengthening
from 1% above average in the previous week, the weather office said on Thursday. (Reuters, September 23, 2011)
PRU Analysis
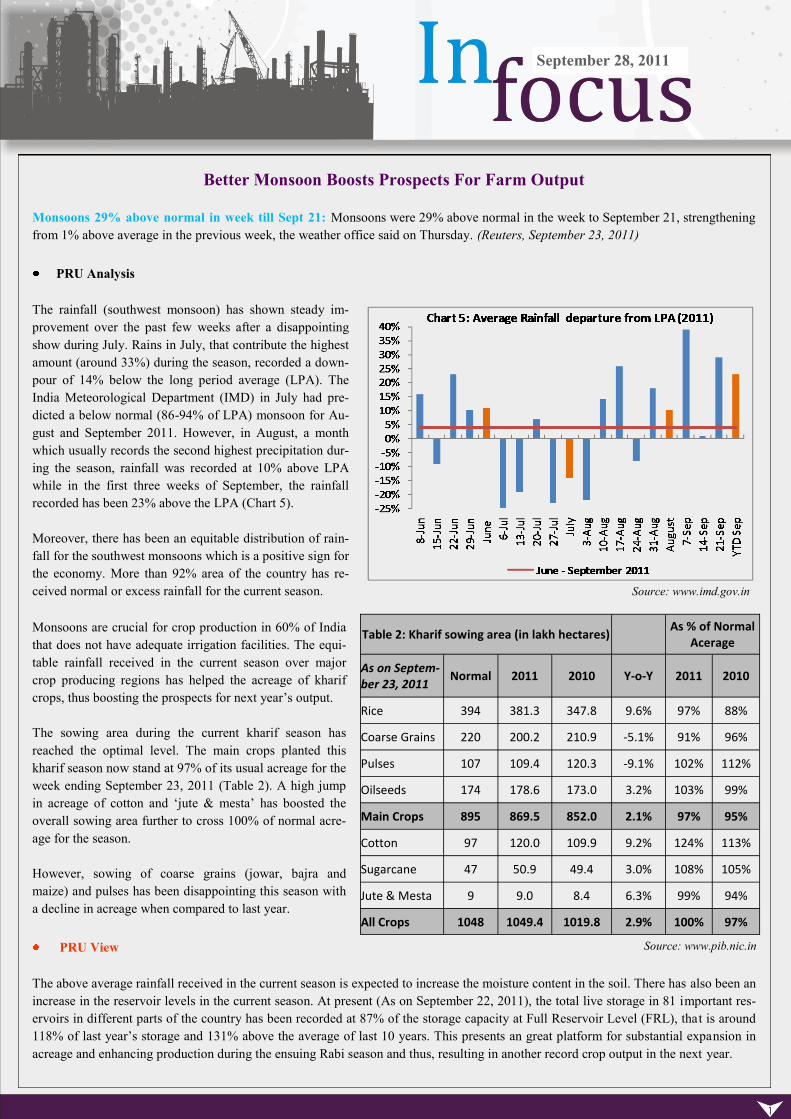
The rainfall (southwest monsoon) has shown steady im-
provement over the past few weeks after a disappointing
show during July. Rains in July, that contribute the highest
amount (around 33%) during the season, recorded a down-
pour of 14% below the long period average (LPA). The
India Meteorological Department (IMD) in July had pre-
dicted a below normal (86-94% of LPA) monsoon for Au-
gust and September 2011. However, in August, a month
which usually records the second highest precipitation dur-
ing the season, rainfall was recorded at 10% above LPA
while in the first three weeks of September, the rainfall
recorded has been 23% above the LPA (Chart 5).
Moreover, there has been an equitable distribution of rain-
fall for the southwest monsoons which is a positive sign for
the economy. More than 92% area of the country has re-
ceived normal or excess rainfall for the current season.
Monsoons are crucial for crop production in 60% of India
that does not have adequate irrigation facilities. The equi-
table rainfall received in the current season over major
crop producing regions has helped the acreage of kharif
crops, thus boosting the prospects for next year‘s output.
The sowing area during the current kharif season has
reached the optimal level. The main crops planted this
kharif season now stand at 97% of its usual acreage for the
week ending September 23, 2011 (Table 2). A high jump
in acreage of cotton and ‗jute & mesta‘ has boosted the
overall sowing area further to cross 100% of normal acre-
age for the season.
However, sowing of coarse grains (jowar, bajra and
maize) and pulses has been disappointing this season with
a decline in acreage when compared to last year.
PRU View
The above average rainfall received in the current season is expected to increase the moisture content in the soil. There has also been an
increase in the reservoir levels in the current season. At present (As on September 22, 2011), the total live storage in 81 important res-
ervoirs in different parts of the country has been recorded at 87% of the storage capacity at Full Reservoir Level (FRL), that is around
118% of last year‘s storage and 131% above the average of last 10 years. This presents an great platform for substantial expansion in
acreage and enhancing production during the ensuing Rabi season and thus, resulting in another record crop output in the next year.
Table 2: Kharif sowing area (in lakh hectares)
As % of Normal Acerage
As on Septem-ber 23, 2011
Normal 2011 2010 Y-o-Y 2011 2010
Rice 394 381.3 347.8 9.6% 97% 88%
Coarse Grains 220 200.2 210.9 -5.1% 91% 96%
Pulses 107 109.4 120.3 -9.1% 102% 112%
Oilseeds 174 178.6 173.0 3.2% 103% 99%
Main Crops 895 869.5 852.0 2.1% 97% 95%
Cotton 97 120.0 109.9 9.2% 124% 113%
Sugarcane 47 50.9 49.4 3.0% 108% 105%
Jute & Mesta 9 9.0 8.4 6.3% 99% 94%
All Crops 1048 1049.4 1019.8 2.9% 100% 97%
Source: www.pib.nic.in
Source: www.imd.gov.in
September 28, 2011
Moreover, the increase in the minimum support prices (MSP) announced earlier for the kharif season (http://www.dhanbank.com/pdf/
reports/IF_15June2011.pdf) along with a rise in the acreage is expected to leave higher disposable incomes in the hands of the farmers
which will bring cheer to the auto (especially 2-wheelers), FMCG, consumer durables and apparel industry ahead of the festival season
as we may witness a surge in the volumes during this time period. While the larger crop volume coming to the markets is expected to
keep food inflation under control, higher disposable incomes in the rural economy are also expected to lead to some increase in indus-
trial production, albeit on a selective basis.
Additional Duty On Soda Ash Imports
Detergent prices likely to rise along with import duties on soda ash: Detergent prices look set to rise as the government is planning
to impose additional duties on the import of soda ash, a key input in its production. (The Economic Times, September 22, 2011)
PRU Analysis
Global soda ash production capacity in 2010 increased by approximately 3% to 63 million tonnes with China controlling around 40%
of the total capacity. Around 70% of the total capacity in the world is based on the synthetic route since most of the natural soda ash
deposits are mainly available in USA (96%). Synthetic soda ash can be manufactured through standard solvay, modified solvay and dry
liming processes. The key raw materials involved in the synthetic process are salt, limestone, coal (for electricity), coke and ammonia
(used as intermediate carrier).
The soda ash is mainly made in three main grades — light (LSA), intermediate and dense (DSA). These differ only in physical charac-
teristics, such as bulk density and particle size and shape. Soda ash is a high volume, low value product and finds application in produc-
tion of detergents (42%, LSA), glass (23%, DSA), chemicals (17%, mainly LSA), sodium silicate, pulp & paper and water treatment.
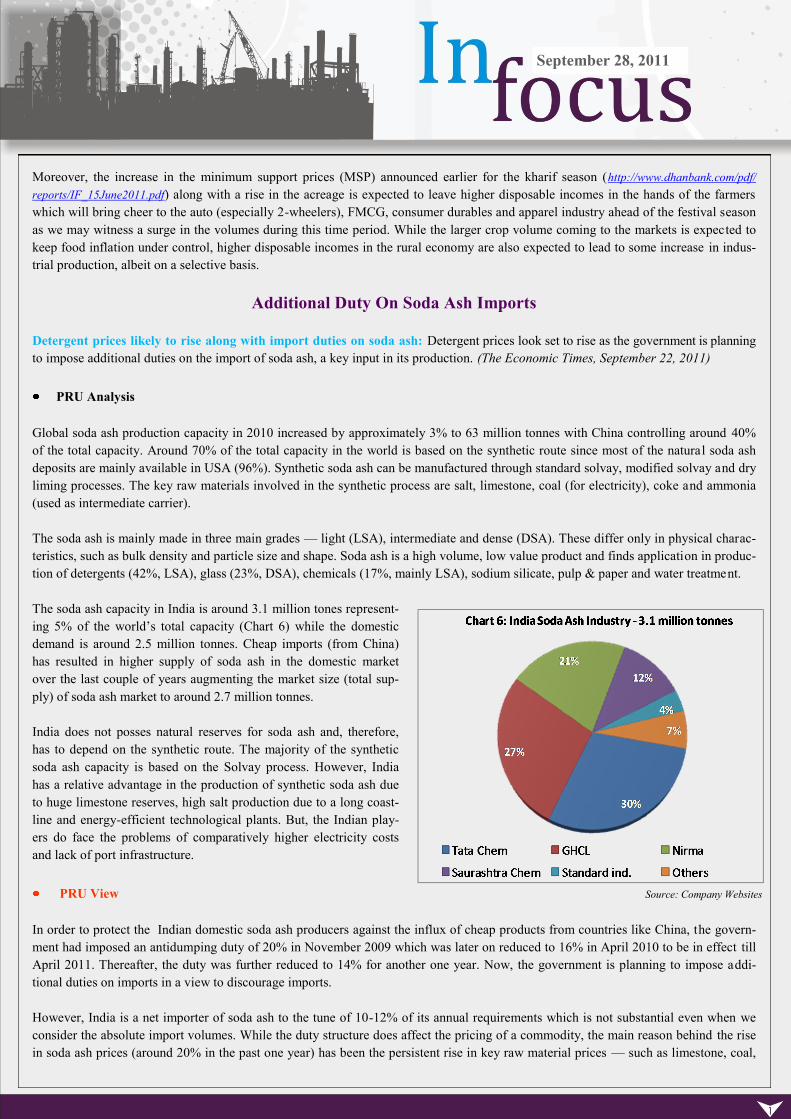
The soda ash capacity in India is around 3.1 million tones represent-
ing 5% of the world‘s total capacity (Chart 6) while the domestic
demand is around 2.5 million tonnes. Cheap imports (from China)
has resulted in higher supply of soda ash in the domestic market
over the last couple of years augmenting the market size (total sup-
ply) of soda ash market to around 2.7 million tonnes.
India does not posses natural reserves for soda ash and, therefore,
has to depend on the synthetic route. The majority of the synthetic
soda ash capacity is based on the Solvay process. However, India
has a relative advantage in the production of synthetic soda ash due
to huge limestone reserves, high salt production due to a long coast-
line and energy-efficient technological plants. But, the Indian play-
ers do face the problems of comparatively higher electricity costs
and lack of port infrastructure.
PRU View
In order to protect the Indian domestic soda ash producers against the influx of cheap products from countries like China, the govern-
ment had imposed an antidumping duty of 20% in November 2009 which was later on reduced to 16% in April 2010 to be in effect till
April 2011. Thereafter, the duty was further reduced to 14% for another one year. Now, the government is planning to impose addi-
tional duties on imports in a view to discourage imports.
However, India is a net importer of soda ash to the tune of 10-12% of its annual requirements which is not substantial even when we
consider the absolute import volumes. While the duty structure does affect the pricing of a commodity, the main reason behind the rise
in soda ash prices (around 20% in the past one year) has been the persistent rise in key raw material prices — such as limestone, coal,
Source: Company Websites
September 28, 2011
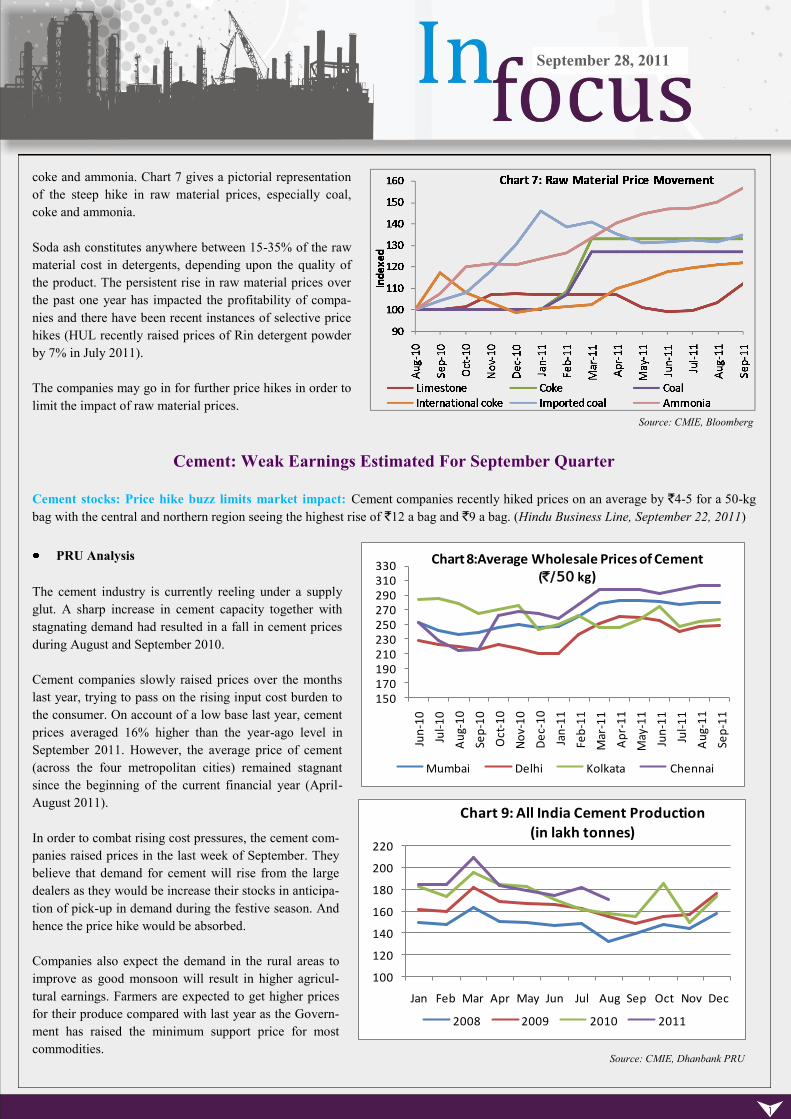
coke and ammonia. Chart 7 gives a pictorial representation
of the steep hike in raw material prices, especially coal,
coke and ammonia.
Soda ash constitutes anywhere between 15-35% of the raw
material cost in detergents, depending upon the quality of
the product. The persistent rise in raw material prices over
the past one year has impacted the profitability of compa-
nies and there have been recent instances of selective price
hikes (HUL recently raised prices of Rin detergent powder
by 7% in July 2011).
The companies may go in for further price hikes in order to
limit the impact of raw material prices.
Cement: Weak Earnings Estimated For September Quarter
Cement stocks: Price hike buzz limits market impact: Cement companies recently hiked prices on an average by `4-5 for a 50-kg
bag with the central and northern region seeing the highest rise of `12 a bag and `9 a bag. (Hindu Business Line, September 22, 2011)
PRU Analysis
The cement industry is currently reeling under a supply
glut. A sharp increase in cement capacity together with
stagnating demand had resulted in a fall in cement prices
during August and September 2010.
Cement companies slowly raised prices over the months
last year, trying to pass on the rising input cost burden to
the consumer. On account of a low base last year, cement
prices averaged 16% higher than the year-ago level in
September 2011. However, the average price of cement
(across the four metropolitan cities) remained stagnant
since the beginning of the current financial year (April-
August 2011).
In order to combat rising cost pressures, the cement com-
panies raised prices in the last week of September. They
believe that demand for cement will rise from the large
dealers as they would be increase their stocks in anticipa-
tion of pick-up in demand during the festive season. And
hence the price hike would be absorbed.
Companies also expect the demand in the rural areas to
improve as good monsoon will result in higher agricul-
tural earnings. Farmers are expected to get higher prices
for their produce compared with last year as the Govern-
ment has raised the minimum support price for most
commodities.
150170190210230250270290310330
Jun
-10
Jul-
10
Au
g-1
0
Sep
-10
Oct
-10
No
v-1
0
De
c-1
0
Jan
-11
Feb
-11
Mar
-11
Ap
r-1
1
May
-11
Jun
-11
Jul-
11
Au
g-1
1
Sep
-11
Chart 8:Average Wholesale Prices of Cement (`/50 kg)
Mumbai Delhi Kolkata Chennai
100
120
140
160
180
200
220
Jan Feb Mar Apr May Jun Jul Aug Sep Oct Nov Dec
Chart 9: All India Cement Production
(in lakh tonnes)
2008 2009 2010 2011
Source: CMIE, Dhanbank PRU
Source: CMIE, Bloomberg
September 28, 2011
PRU View
Cement is a seasonal industry and the September quarter is usually marked by low demand. This is because the south-west monsoon
spans across the Indian subcontinent during June-August each year. This results in slower construction activity and a consequent slow-
down in demand for cement.
However, the September quarter this year witnessed stagnation in construction activity and weak demand from the real estate sector
compared to year-ago period. Consequently, cement prices are estimated to have declined sharply by 6.7% in September 2011 quarter
compared to the June quarter.
We believe that until demand rises substantially, revenues of the cement industry may continue to remain under pressure, in spite of a
price rise. This is because the companies may not be able to pass on the entire rise in costs (mainly coal and power) until there is a sub-
stantial revival of demand.
How Would Indian Companies’ Financials Pan Out In Q2?
Indian companies Q2 margins to contract 100 bps–Crisil: Slower volume growth, higher raw material costs and wages would com-
press Indian companies' margins in the second quarter, Crisil Research. (Reuters, September 26, 2011)
PRU Analysis
Corporate India bore the brunt of rising interest rates and high commodity prices in the June 2011 quarter. Its net profits rose by a mea-
gre 3.5% despite a robust 27.8% growth in sales.
It is expected that the sharp rise in commodity prices and high interest rates will restrict the growth in corporate profits in the Septem-
ber 2011 quarter as well.
Automobiles, real estate, textiles, and retail are some of the sectors which are likely to get affected due to high interest rates and infla-
tion. Slower growth in infrastructure linked sectors is likely to have affected demand for cement and capital goods.
Economists are scaling down India‘s growth projections for the rest of the year amid interest rate increases to rein in inflation. The
Asian Development Bank lowered India‘s growth estimate to 7.9% from 8.2% earlier. IMF has cut India‘s economic growth forecast to
7.8%.
Rating agency Crisil expects Corporate India to report a significant moderation in revenue growth and lower operating margins in the
quarter ended July-September 2011. This will be primarily due to decline in consumer confidence, on account of stubbornly high infla-
tion and rising interest rates, and slowdown in investment growth. It expects year-on-year revenue growth of around 15%, as compared
with 19% in the preceding quarter and 22% in Q2FY11.
Business newspaper The Mint reported on September 17, 2011, that the advance tax payments made by the Top 100 companies based
in the country‘s financial capital, Mumbai, rose 18% for the quarter ending September 2011, indicating a likely slowdown in profit
growth at Indian companies. This is well short of the 31% increase in direct tax projected by the government for the whole year.
Advance tax paid by the companies is a reflection of earnings as the companies pay tax based on projected income for the quarter.
Another factor that has raised an alert is the lower amount of fresh order intake and slowing of order book position of construction
companies. This, together with slow pace of project execution is becoming a cause of concern.
The growth in the Index of Industrial Production slowing to 3.3% in July and the economy growing by 7.7% in the first quarter versus
8.8% a year ago has also been worrisome. While prices of products have risen, profitability of companies is expected to get affected on
September 28, 2011
account of slower growth in sales volume, together with a sharp rise in costs.
Gloomy economic situation across the global, particularly deepening financial crisis in the Eurozone and the renewed fears of a double
dip recession in the US has also impacted investor confidence in India. The stock markets in India have been volatile. To improve in-
vestor confidence, the government plans to slash securities transaction tax (STT) levied in India. It believes that this move will make
India a cheaper place for trading in stock markets. However, we think that will only be a temporary phenomenon and this move is nei-
ther expected to have a lasting effect nor will it affect government tax collections much. This is because STT accounts for a very small
portion of total tax collected. For the April-August 2011 period, STT collections stood at `2,021 crore while gross direct tax collected
was `1,54,360 crore.
Rising Rupee To Aggravate Losses of OMCs
Falling prices help oil marketers survive mayhem, tumbling rupee may hurt: State-run oil marketing companies, Indian Oil and
Hindustan Petroleum, held strong due to falling crude oil prices on a day when stocks all around collapsed in a global sell-off, but the
good fortunes may not last as a tumbling rupee would more than hurt earnings (The Economic Times, September 23, 2011).
PRU Analysis
The public sector oil marketing companies (OMCs) hiked petrol price by `3.14-3.32 per litre in order to combat the decline in rupee's
exchange value as the cost of buying crude oil rose and losses from fuel sales widened.
Petrol is the only deregulated petroleum product which is considered sensitive. Price of other fuels — diesel, kerosene (under public
distribution system) and LPG sold for domestic use — continues to be regulated. This is resulting in large under-recoveries for the oil
marketing companies.
While the recent petrol hike is a positive for oil marketing companies, a further depreciation in Indian rupee vis-à-vis the dollar is likely
to reduce the impact of price hike. This is because a major chunk of crude oil is imported.
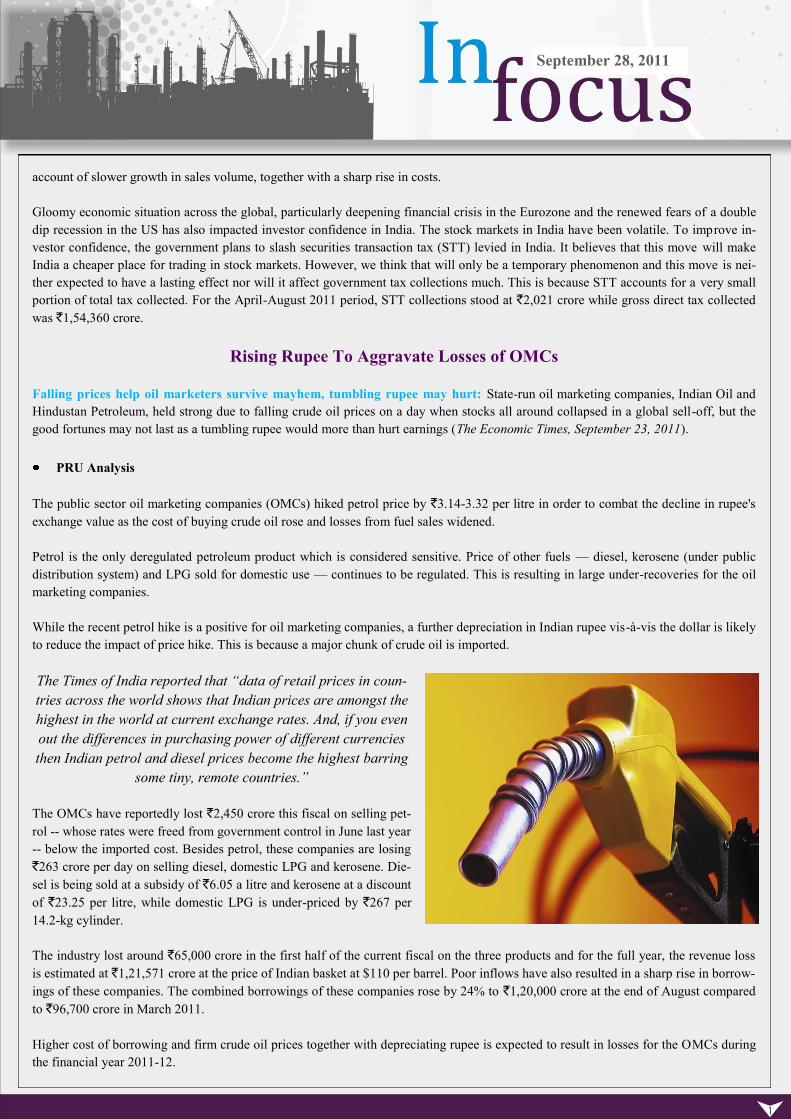
The Times of India reported that “data of retail prices in coun-
tries across the world shows that Indian prices are amongst the
highest in the world at current exchange rates. And, if you even
out the differences in purchasing power of different currencies
then Indian petrol and diesel prices become the highest barring
some tiny, remote countries.”
The OMCs have reportedly lost `2,450 crore this fiscal on selling pet-
rol -- whose rates were freed from government control in June last year
-- below the imported cost. Besides petrol, these companies are losing
`263 crore per day on selling diesel, domestic LPG and kerosene. Die-
sel is being sold at a subsidy of `6.05 a litre and kerosene at a discount
of `23.25 per litre, while domestic LPG is under-priced by `267 per
14.2-kg cylinder.
The industry lost around `65,000 crore in the first half of the current fiscal on the three products and for the full year, the revenue loss
is estimated at `1,21,571 crore at the price of Indian basket at $110 per barrel. Poor inflows have also resulted in a sharp rise in borrow-
ings of these companies. The combined borrowings of these companies rose by 24% to `1,20,000 crore at the end of August compared
to `96,700 crore in March 2011.
Higher cost of borrowing and firm crude oil prices together with depreciating rupee is expected to result in losses for the OMCs during
the financial year 2011-12.
September 28, 2011
Another Autofuel Becomes Expensive
A few days after a `3 per litre rise in petrol prices, another auto fuel — compressed natural gas — is expected to become dearer. Indra-
prastha Gas plans to increase the price by up to 6-7% (`2 per kg) in north India. Other companies, including Mahanagar Gas in Mum-
bai and Adani Gas in Ahmedabad, may also follow suit. The rise in international gas prices and depreciating Indian rupee has led to this
move, thereby making CNG, another auto fuel — mainly used by public transport utilities — more expensive.
JSW Steel Cuts Production By 70%
JSW Steel cuts output by a third on account of iron ore shortage; An acute shortage of iron ore in Karnataka and exorbitant auction
prices have forced India's largest steelmaker JSW Steel to cut production by around a third and threatens to shutter steel manufacturing
across the region. More than 70 sponge iron units in Bellary have shut shop already, leaving around 200,000 people jobless, people
involved with the industry say. (The Economic Times, September 27, 2011)
PRU Analysis
In a recent development, the largest steel producer in India, JSW Steel has cut production by 70% at its Vijayanagar Steel Plant from 10
million tonnes to 3 million tonnes. This is attributable to shortage of iron ore in Karnataka following the Supreme Court order to sus-
pend all mining activities in the three districts of the state. JSW Steel procures most of its iron ore requirement from this state. It can be
highlighted here that after the commissioning of its 3.2-miilion-tonne blast furnace at Vijayanagar plant in July this year, the company
become the largest steel producer in India with a production capacity of 14.3 million tonnes, marginally higher than that of Steel Au-
thority of India Ltd.
It is worth mentioning here that in order to meet the requirement of steel manufacturers, as well as sponge and pig iron units in the
state, the Government had ordered e-auctioning of the existing 25 million tonnes of iron ore inventory (14 million tones of low grade
and 11 million tones of high grade ore) at 1.5 million tonnes per month. This translates into an availability of 50,000 tonnes per day.
Earlier, it was estimated by brokerage house Prabhudas Lilladher that JSW Steel would be able to run at 80% of its capacity by procur-
ing enough iron ore from the government-owned National Mines Development Corporation (NMDC, the only miner allowed to mine in
the state), other mines in Chhattisgarh and Orissa and through e-auction.
However, the steel companies including JSW Steel have found the reserve prices of iron ores at the recent auction to be arbitrary and
not in line with prevalent domestic market prices. The base price for 63 grade lump (63% iron content) was set at `3,700 per tonne,
against the market price of `3,500 per tonne and the auction price went up to `5,800 per tonne at the auction, which was almost 50%
higher from the reserve price.
The reserve price for iron fines with low iron content was fixed at `2,700 per tonne at the auction. The ore buyers claimed that the re-
serve price of the low grade iron ore was fixed arbitrary and have desisted from buying in the e-auctions.
Only 10% of the sold iron ore through auction has been dispatched to the plants till date due to several procedural delays. Also, steel
makers have to bear an additional cost on account of royalty and forest development tax to be paid on the final price to the state govern-
ment.
It can be mentioned here that JSW Steel alone requires about 18 million tonnes of iron ore for its annual production. But, after the blan-
ket ban on mining, only 19-20 million tonnes is available (including NMDC‘s production of 1 million tonnes per month) to meet the
entire requirement of the region.
JSW's decision to cut output might impact key user industries — such as auto and consumer durables manufacturers — which use flat
steel. Company‘s production mix of flat and long steel was 75:25 during Q1FY12. According to Bhushan Steel and Uttam Galva,
which are the major suppliers to automakers like Honda, Maruti and Hyundai, supply of auto grade steel has fallen by 15-20% already.
September 28, 2011
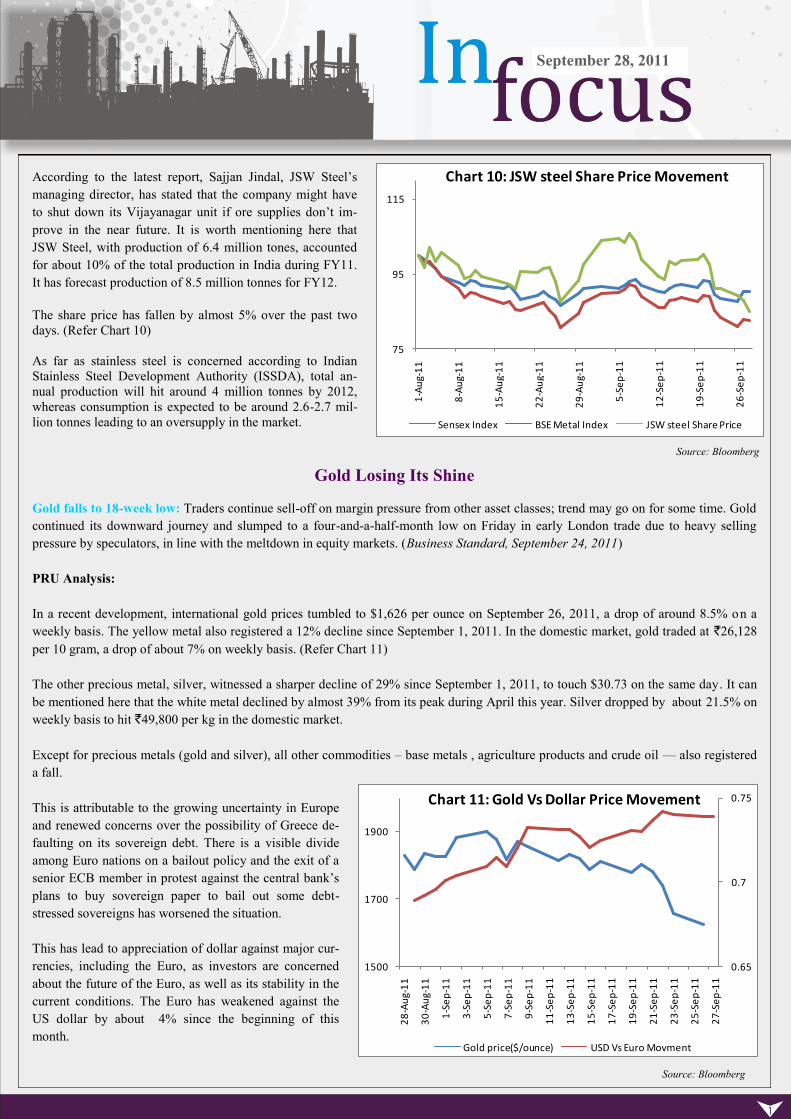
According to the latest report, Sajjan Jindal, JSW Steel‘s
managing director, has stated that the company might have
to shut down its Vijayanagar unit if ore supplies don‘t im-
prove in the near future. It is worth mentioning here that
JSW Steel, with production of 6.4 million tones, accounted
for about 10% of the total production in India during FY11.
It has forecast production of 8.5 million tonnes for FY12.
The share price has fallen by almost 5% over the past two
days. (Refer Chart 10)
As far as stainless steel is concerned according to Indian
Stainless Steel Development Authority (ISSDA), total an-
nual production will hit around 4 million tonnes by 2012,
whereas consumption is expected to be around 2.6-2.7 mil-
lion tonnes leading to an oversupply in the market.
Gold Losing Its Shine
Gold falls to 18-week low: Traders continue sell-off on margin pressure from other asset classes; trend may go on for some time. Gold
continued its downward journey and slumped to a four-and-a-half-month low on Friday in early London trade due to heavy selling
pressure by speculators, in line with the meltdown in equity markets. (Business Standard, September 24, 2011)
PRU Analysis:
In a recent development, international gold prices tumbled to $1,626 per ounce on September 26, 2011, a drop of around 8.5% on a
weekly basis. The yellow metal also registered a 12% decline since September 1, 2011. In the domestic market, gold traded at `26,128
per 10 gram, a drop of about 7% on weekly basis. (Refer Chart 11)
The other precious metal, silver, witnessed a sharper decline of 29% since September 1, 2011, to touch $30.73 on the same day. It can
be mentioned here that the white metal declined by almost 39% from its peak during April this year. Silver dropped by about 21.5% on
weekly basis to hit `49,800 per kg in the domestic market.
Except for precious metals (gold and silver), all other commodities – base metals , agriculture products and crude oil — also registered
a fall.
This is attributable to the growing uncertainty in Europe
and renewed concerns over the possibility of Greece de-
faulting on its sovereign debt. There is a visible divide
among Euro nations on a bailout policy and the exit of a
senior ECB member in protest against the central bank‘s
plans to buy sovereign paper to bail out some debt-
stressed sovereigns has worsened the situation.
This has lead to appreciation of dollar against major cur-
rencies, including the Euro, as investors are concerned
about the future of the Euro, as well as its stability in the
current conditions. The Euro has weakened against the
US dollar by about 4% since the beginning of this
month.
75
95
115
1-A
ug-
11
8-A
ug-
11
15
-Au
g-1
1
22
-Au
g-1
1
29
-Au
g-1
1
5-S
ep
-11
12
-Se
p-1
1
19
-Se
p-1
1
26
-Se
p-1
1
Chart 10: JSW steel Share Price Movement
Sensex Index BSE Metal Index JSW steel Share Price
0.65
0.7
0.75
1500
1700
1900
28
-Au
g-1
1
30
-Au
g-1
1
1-S
ep
-11
3-S
ep
-11
5-S
ep
-11
7-S
ep
-11
9-S
ep
-11
11
-Se
p-1
1
13
-Se
p-1
1
15
-Se
p-1
1
17
-Se
p-1
1
19
-Se
p-1
1
21
-Se
p-1
1
23
-Se
p-1
1
25
-Se
p-1
1
27
-Se
p-1
1
Chart 11: Gold Vs Dollar Price Movement
Gold price($/ounce) USD Vs Euro Movment
Source: Bloomberg
Source: Bloomberg
September 28, 2011
While there is no direct proof, it is widely believed that an appreciation in the dollar value has lead to the decline in gold prices. The
yellow metal is not considered as a safe haven investment under the current circumstances. Gold has always been used as a hedge
against dollar movement. The dollar is the only globally accepted reserve currency. Most countries continue to park a major part of
their foreign exchange reserves in dollar-denominated assets. But, when the value of dollar starts weakening due to any crisis (financial
or political), gold usually becomes the default investment option.
It can be mentioned here that gold prices have been steadily rising, driven by the global uncertainty and continuing slowdown in the
US. Markets are now speculating about the demise of the gold as a safe haven investment option, as the appeal of dollar has increased.
However, according to World Gold Council (WGC), robust physical demand from India, the world‘s largest consumer, and China wi ll
prevent any sustained slump in the precious metal‘s movement in the long run. India and China account for around 55% of the global
demand, out of which the share of gold jewellery, bars and coin stands at around 78%.
Silver witnessed a sharper decline as investors booked profits in this precious metal to cut losses in other asset classes.
Interestingly, the Chicago Mercantile Exchange also has hiked the margins on gold, silver by 21% and 16% in order to curb specula-
tive activity in the market.
Cotton Yarn Exports Registration Up
Yarn export registration up 70%: Textile sector recovery to be short-lived, say experts; high interest rates, DEPB end cloud pros-
pects. In a clear sign of revival in the textile industry, albeit for a short period, the registration for cotton yarn exports surged 70% in
August. The textile commissionerate, under the ministry of textiles, recorded renewed interest from yarn exporters and registered 97.7
million kg of orders in August, against 57.2 million kg in July. (Business Standard, September 22, 2011)
PRU Analysis
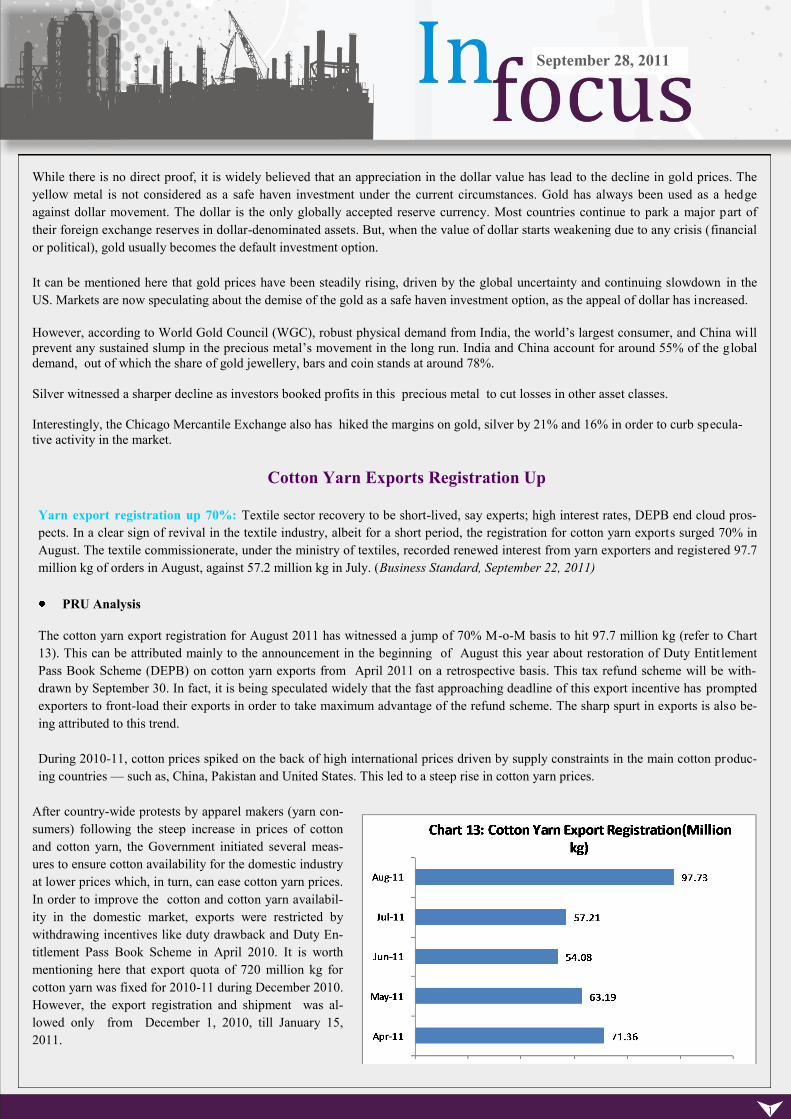
The cotton yarn export registration for August 2011 has witnessed a jump of 70% M-o-M basis to hit 97.7 million kg (refer to Chart
13). This can be attributed mainly to the announcement in the beginning of August this year about restoration of Duty Entit lement
Pass Book Scheme (DEPB) on cotton yarn exports from April 2011 on a retrospective basis. This tax refund scheme will be with-
drawn by September 30. In fact, it is being speculated widely that the fast approaching deadline of this export incentive has prompted
exporters to front-load their exports in order to take maximum advantage of the refund scheme. The sharp spurt in exports is also be-
ing attributed to this trend.
During 2010-11, cotton prices spiked on the back of high international prices driven by supply constraints in the main cotton produc-
ing countries — such as, China, Pakistan and United States. This led to a steep rise in cotton yarn prices.
After country-wide protests by apparel makers (yarn con-
sumers) following the steep increase in prices of cotton
and cotton yarn, the Government initiated several meas-
ures to ensure cotton availability for the domestic industry
at lower prices which, in turn, can ease cotton yarn prices.
In order to improve the cotton and cotton yarn availabil-
ity in the domestic market, exports were restricted by
withdrawing incentives like duty drawback and Duty En-
titlement Pass Book Scheme in April 2010. It is worth
mentioning here that export quota of 720 million kg for
cotton yarn was fixed for 2010-11 during December 2010.
However, the export registration and shipment was al-
lowed only from December 1, 2010, till January 15,
2011.
September 28, 2011
While there was no cotton yarn exports for over two-and-a-half months (January 15 to March 31, 2011) the industry continued to pro-
duce yarn using high-cost cotton procured during this period in anticipation of strong realisations from the global markets after the res-
toration of the export incentives. However, due to subdued domestic demand, spinning mills were not able to pass on the high price of
cotton. It can be mentioned here that demand softened in the domestic market following closure of dyeing units in Tirupur.
This led to a huge pile-up of large, unsold cotton yarn stock. Unsold stocks have increased the working capital requirement of the spin-
ning mills. The profitability was squeezed since spinners couldn‘t pass on the high cotton price to customers on account of weak de-
mand. Currently, spinning units with highly leveraged capital structure and with rising interest rates are prone to high risk of defaults.
Although, there is a temporary revival of cotton yarn exports, we don‘t expect it to sustain as demand might weaken due to uncertainty
in the global economy, especially in the EU and US. International cotton prices have gone up on the back of the Chinese government‘s
purchasing programme and on expectations of the cotton crop deterioration in Pakistan due to heavy rains. In its latest report, the
United States Department of Agriculture (USDA) has lowered its crop estimate for Pakistan by 500,000 bales — from 10.3 million to
9.8 million. Excessive heat and drought have also had an impact on the US crop. Hence, while there is a spurt in cotton prices, this
might not necessarily imply a pick-up in demand.
Although removal of export restrictions and restoration of export benefits on cotton and cotton yarn will help in stabilising prices, spin-
ning units will continue to be hit by high interest rates. However, purchases for the Chinese reserve programme — starting from Sep-
tember 1, 2011, till March 31, 2012 — should keep prices from falling significantly below certain levels.
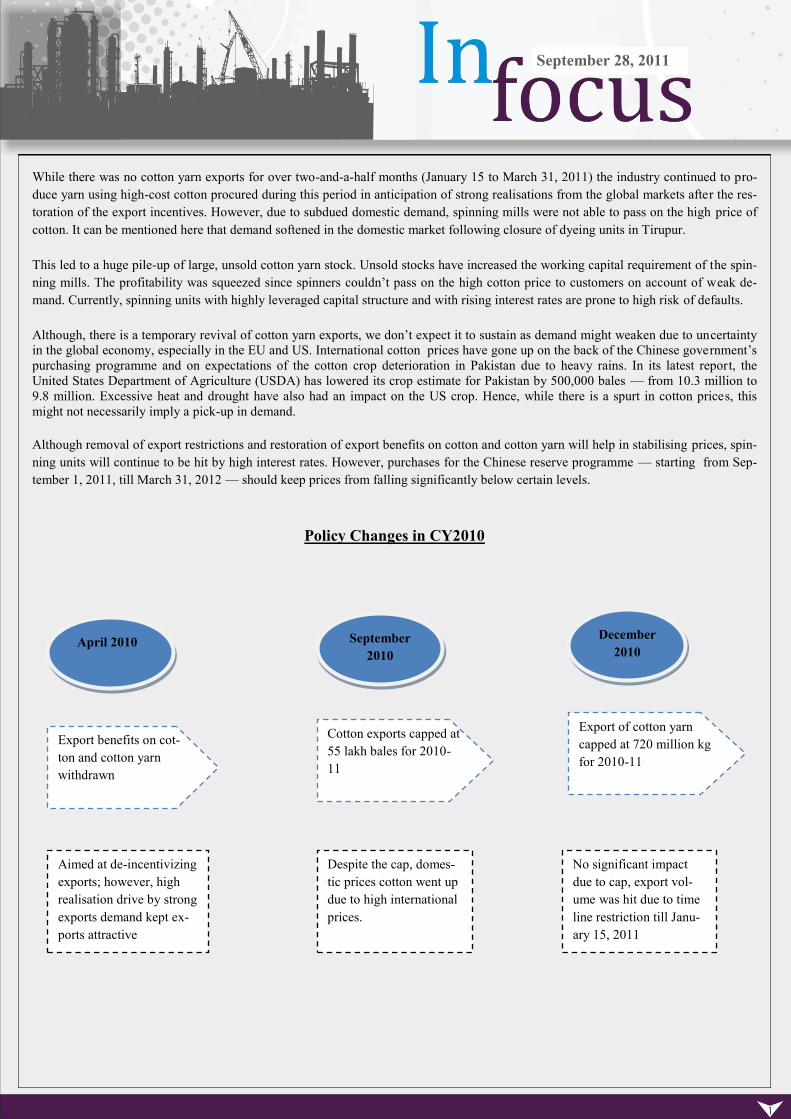
Policy Changes in CY2010
April 2010
Export benefits on cot-
ton and cotton yarn
withdrawn
Aimed at de-incentivizing
exports; however, high
realisation drive by strong
exports demand kept ex-
ports attractive
September
2010
Cotton exports capped at
55 lakh bales for 2010-
11
Despite the cap, domes-
tic prices cotton went up
due to high international
prices.
December
2010
Export of cotton yarn
capped at 720 million kg
for 2010-11
No significant impact
due to cap, export vol-
ume was hit due to time
line restriction till Janu-
ary 15, 2011
September 28, 2011
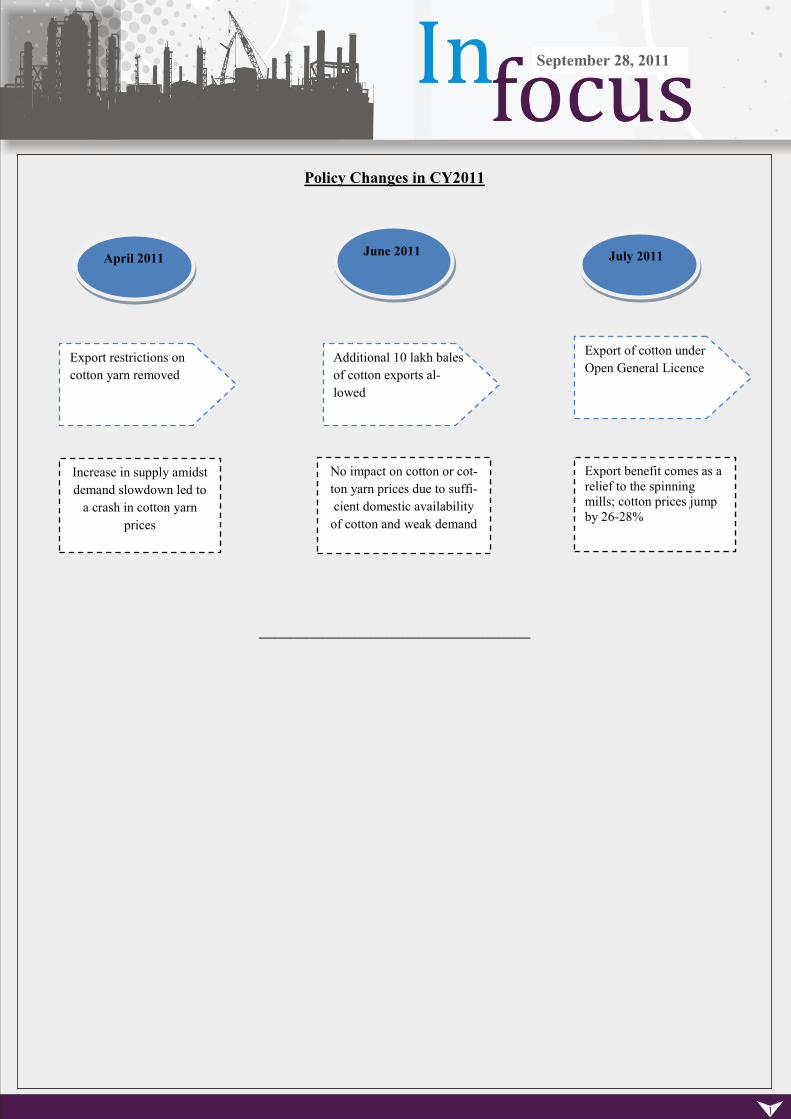
Policy Changes in CY2011
—————————————————
April 2011
Export restrictions on
cotton yarn removed
Increase in supply amidst
demand slowdown led to
a crash in cotton yarn
prices
June 2011
Additional 10 lakh bales
of cotton exports al-
lowed
No impact on cotton or cot-
ton yarn prices due to suffi-
cient domestic availability
of cotton and weak demand
July 2011
Export of cotton under
Open General Licence
Export benefit comes as a
relief to the spinning
mills; cotton prices jump
by 26-28%
September 28, 2011
Disclaimer Clause
This report is for customer ‘information’ only and does not constitute investment advice or an offer to purchase or subscribe for any investment.
This document is not intended to provide professional advice and should not be relied upon in that regard. Persons accessing this document are ad-
vised to obtain appropriate professional advice where necessary. This document is not directed to or intended for display, downloading, printing,
reproducing or for distribution to or use by any person or entity who is a citizen or resident or located in any locality, state, country or other juris-
diction where such distribution, publication, reproduction, availability or use would be contrary to law or regulation or would subject Dhanlaxmi
Bank Limited or its associates or group companies to any registration or licensing requirement within such jurisdiction. If this document is inadver-
tently sent or has reached any individual in such country, the same may be ignored and brought to the attention of the sender. This document may
not be reproduced, distributed or published for any purpose without prior written approval of Dhanlaxmi Bank Limited.