Partnerships for Evaluating Policy Change Panel Discussion June 13,2006.
91
Partnerships for Evaluating Policy Change Panel Discussion June 13,2006
-
Upload
joanna-neal -
Category
Documents
-
view
216 -
download
1
Transcript of Partnerships for Evaluating Policy Change Panel Discussion June 13,2006.

Partnerships for Evaluating Policy Change
Panel Discussion
June 13,2006
2
Why Policy and Environmental Change Essential Part of Behavior Change

3
Social-Ecological Model
Interpersonal
Individual
Institutional/Organizational
Community
Policy, Systems, Environment

4
Why Policy and Environmental Change Essential Part of Behavior Change Bigger Bang for the Buck
5
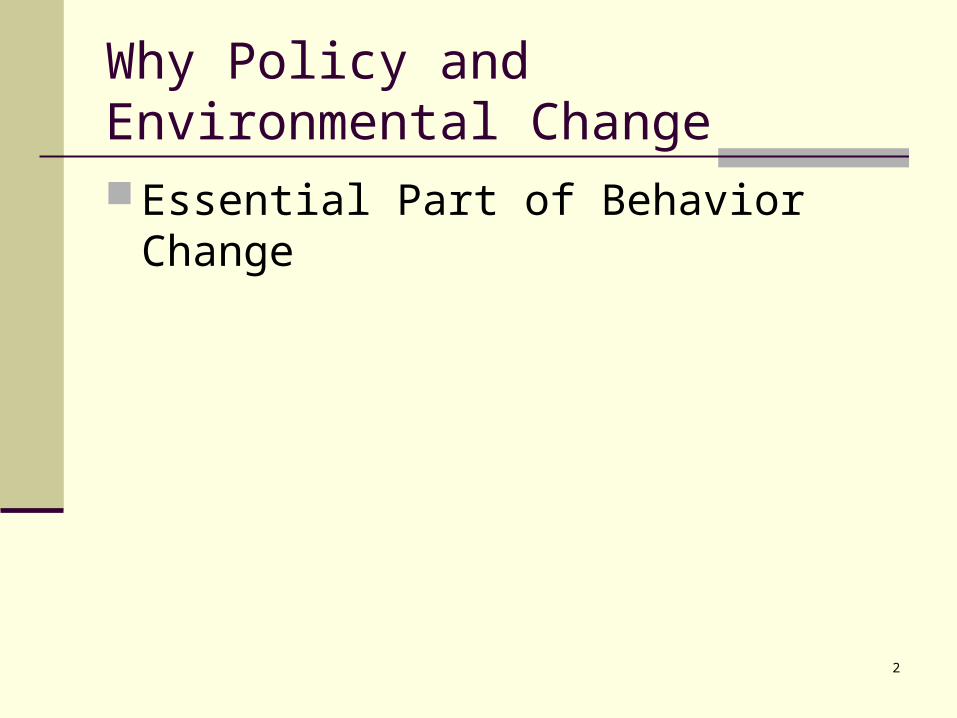
Multilevel Pyramid Model of Stepped Care Interventions
Specialty
Primary Care
Health Systems
Community and Neighborhood
Media
Policies
Reach
Highest
Lowest
Intensity / Cost
Highest
Lowest

6
Why Policy and Environmental Change Essential Part of Behavior Change Bigger Bang for the Buck Policy and Environmental Changes Stay
7
Panelists
Amy Roussel, PhD - RTI Vic Colman, JD – Washington State
Department of Health Shelly Curtis, MPH, RD – The Children’s
Alliance Donna Johnson, PhD, RD – University of
Washington Marilyn Sitaker, MPH - Washington State
Department of Health
Evaluation and Policy Change
Presented byAmy Roussel, PhD
RTI International
Presented at Annual Meeting of the Association of State & Territorial Public
Health Nutrition Directors
Seattle, WA June 13, 2006
RTI International is a trade name of Research Triangle Institute
RTI International ■ 3040 Cornwallis Road ■ Research Triangle Park, NC 27709Phone: 919-990-8324 ■ Fax: 919-485-5589 ■ [email protected] ■ www.rti.org
9
Session Overview
Define our terms
Demystify evaluation
Discuss types of evaluation
Introduce CDC Framework for Evaluation
10
What Do We Mean by Evaluation?
The systematic investigation of the merit, worth, or significance of program activities or outcomes
Evaluation also explores how and why those activities are occurring
Evaluation builds on the program monitoring activities that your programs currently conduct
11
What Do We Mean by Policy?
A principle, plan, or course of action, as pursued by a government, organization, group, etc.
General term: includes policy, legislation, environmental change, systems change
Occurs at all levels of the socioecologic model

12
The Socioecologic Model

13
Some Policy Change Examples
Imposing a 1% sales tax on items listed as “sweet” or “snack” in the USDA National Nutrient Database for Standard Reference
A community building a permanent structure to house a farmers’ market
School systems eliminating deep-fat fryers from all cafeteria kitchens
Worksites subsidizing healthy food choices
Families instituting sit-down dinner policies (& no TV!)
14
What Have You Done?
15
More on Evaluation
Evaluation helps you
build capacity
manage programs effectively
assess and improve existing efforts
understand reasons for performance
plan and implement new policies or programs
demonstrate the value of your efforts
ensure accountability

16
Evaluation Types and Questions
Formative evaluation: To develop or improve a policy
What kind of policy changes will people respond to?
Process evaluation: To assess process or implementation
How [or how well] was the policy implemented?
Outcomes evaluation: To assess outcomes or impact
What difference did the policy make?

17
Start Where You Are
Consider developmental trajectory of policy changeDevelopment – formative evaluation Implementation – process evaluation Institutionalization – outcomes evaluation

18
Consider the Evidence Base
Evidence-based practicePolicy changes known to be effective
Practice-based evidenceYour evaluation will help build the evidence base
Plan your evaluation accordingly

19
Specifying Goals and Questions
What do you want to know?
What do stakeholders want to know?
What do you intend to do with what you learn?

20
CDC Framework for Evaluation

21
6-Step Model
Engage stakeholders
Describe the program
Focus the design
Gather credible evidence
Justify conclusions
Ensure use and share lessons learned

22
Step 1: Engage Stakeholders
Stakeholders include:
Those interested in the program or policy
Those affected by the policy
Those who are primary users of evaluation
23
What Stakeholders Can Do
Key stakeholder evaluation functions include:
Describing the policy and intended impacts
Selecting evaluation questions and methods
Serving as data sources
Interpreting findings
Disseminating information
Implementing results

24
Step 2: Describe the Program
Summarize the policy change being evaluated
Establish common definitions and terms
Delineate intended outcomes and other factors that may help or hinder
Describe how the policy fits into the larger picture

25
Program Descriptions
Often involve logic models – but not necessarily!
Ask yourself: What are we trying to accomplish?
And then what happens?
“If you don’t know where you’re going, you’ll end up somewhere else.”
-Yogi Berra

26
Step 3: Focus the Evaluation
Consider the purpose What questions are you and stakeholders asking? How will evaluation information be used?
Reality checks What’s the developmental stage? What’s the evidence base? What resources are available for evaluation?
Evaluation questions + policy stage design

27
Step 4: Gather Credible Evidence
Qualitative or quantitative?
Primary (new) or secondary (existing) data?
Clear protocols help to ensure rigor
Use multiple data sources Use multiple data sources
whenever possiblewhenever possible

28
Step 5: Justify Conclusions
Structured analysis - reproducible
Assess findings against standardsWhat would constitute success?Seek stakeholders’ inputs on this early
Interpret the data – what does this tell you?
29
Step 6: Ensure Use & Share Lessons Learned
Present findings
Discuss findings
Develop action plan
Act on findings
Evaluation without action? What’s the point?

30
Sharing Lessons Learned
Choose your medium – or media Match method to audience Allow room for stories, accounts, testimonies
The report is not the end of the evaluation
Solicit feedback from partners, staff, stakeholders
Open dialogue is essential
Share results and brainstorm next steps Focus on improvement Let the past inform the future

31
Acting on Findings
Evaluation ought to be useful and actionable
Participatory planning facilitates action
What needs to be done?Who will do it?Who will help?
Turn the plan into action
Keep goal of improvement in mind

32
Review
Policy – an inclusive term
Evaluation – not so scary any more?
The CDC Framework – a handy tool
Putting it Together – see handoutKey items learnedAction itemsSMART objectives

33
Any Questions?

34
Victor Colman, JD Senior Policy AdvisorWashington State Department of Health
Making Policy Choices: Importance of Evaluation June 2006
35
Learning Objectives
• Learn about a state’s approach to improving nutrition and physical activity via the entire spectrum of prevention
• Highlight challenges in making policy choices – with a particular focus on the role of evaluation

36
Nutrition and Physical Activity: The Washington State Story
Rare Opportunity Now in Place to Create a “Healthier Washington”part of Governor’s Health Care agendaconvergence of public, media, public health &
policymaker interest in chronic disease prevention, most notably nutrition and physical activity
37
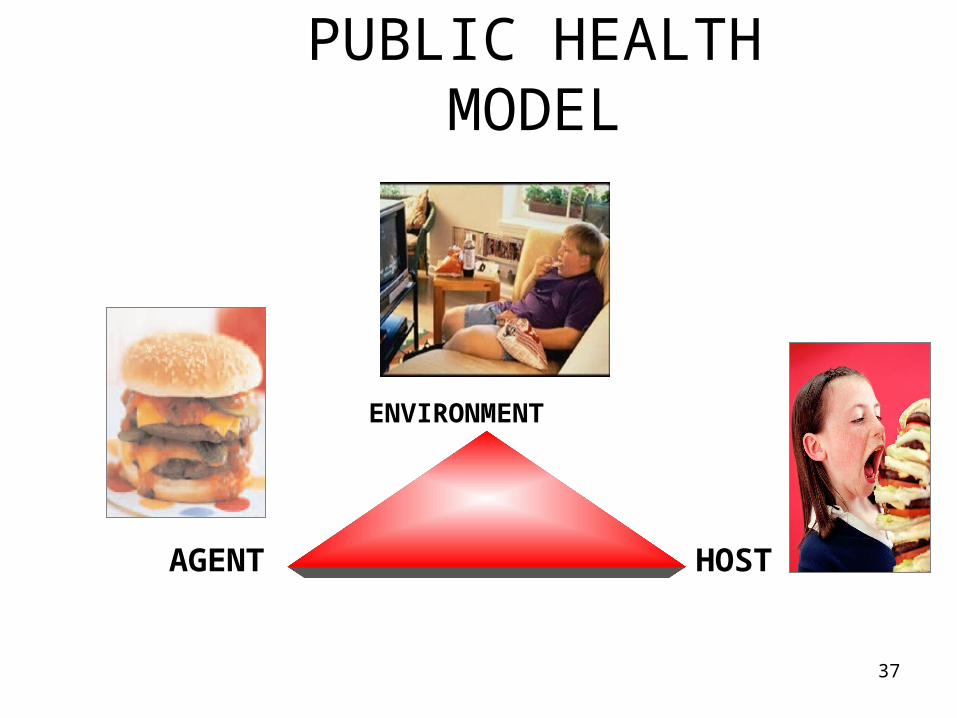
PUBLIC HEALTH MODEL
ENVIRONMENT
HOSTAGENT

38
The Spectrum of PreventionInfluencing Policy & Legislative
Changing Organizational Practices
Fostering Coalitions & Networks
Educating Providers
Promoting Community Education
Strengthening Individual Knowledge & Skills
39
Our Vision:

40
Nutrition and Physical Activity: The Washington State Story
Coalitions and Partnerships– Washington’s Action For Healthy Kids Team – Access to Healthy Foods Coalition– Washington Coalition for Promoting Physical Activity– Transportation Choices Coalition– Bicycle Alliance of Washington– Breastfeeding Coalition of Washington – Anti-Hunger Nutrition Coalition– WA Association of Local WIC Agencies
41
Nutrition and Physical Activity: The Washington State Story
Importance of Evidence-Based Policy Research
• In early 2005, DOH released a “Policy Resource Guide” as a tool for local, state and private interests
42
43
Nutrition and Physical Activity: The Washington State Story
Importance of Collective Policy Development
• Emerging Role of the Nutrition and Physical Activity Policy Leadership Group
• Ongoing development of a broad policy platform

44
Policy Development: Conceptual Framework
45
Nutrition and Physical Activity: The Washington State Story
Importance of Policy Implementation – Recent Bills– SB 5436 – school policy– SB 5186 – physical activity and planning

46
Nutrition and Physical Activity: The Washington State Story
Lessons Learned• Too much focus on change at state capital
level• Policy change is, on balance, easier to enact
at local and institutional levels• Determining adequate enforcement capacity
can be a critical factor in successful policy implementation
47
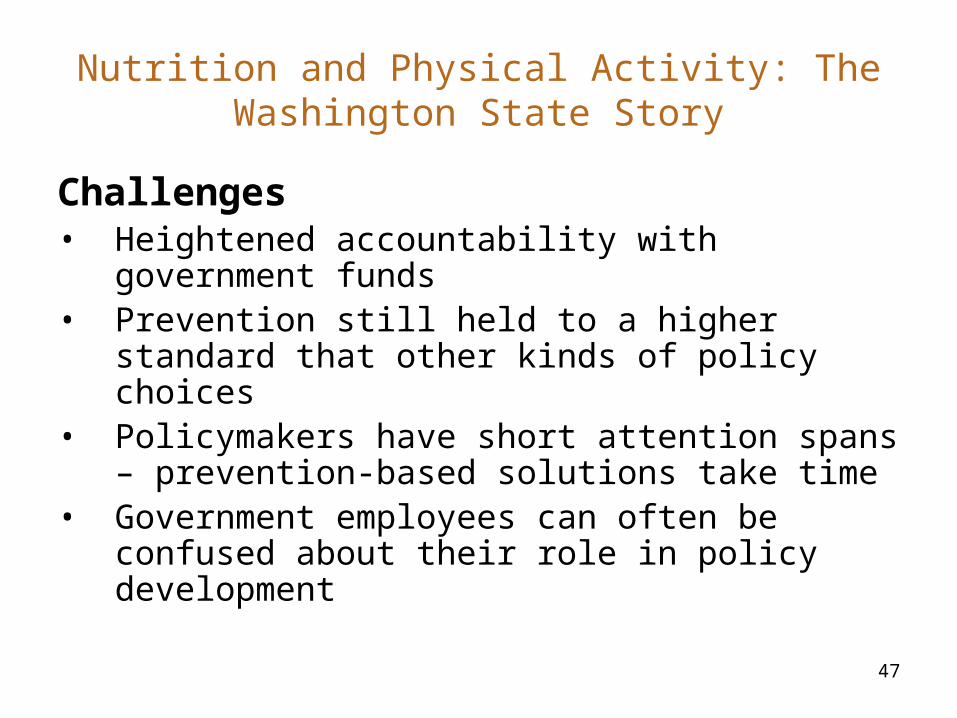
Nutrition and Physical Activity: The Washington State Story
Challenges• Heightened accountability with government
funds• Prevention still held to a higher standard that
other kinds of policy choices• Policymakers have short attention spans –
prevention-based solutions take time• Government employees can often be confused
about their role in policy development
48
Nutrition and Physical Activity: The Washington State Story
Take Home Message
When making policy choices, the feasibility of and the need for evaluation should NOT be an afterthought
49
Nutrition and Physical Activity: The Washington State Story
Victor Colman, JD Senior Policy Advisor Division of Community and Family Health, Washington State Department of Health
Tel. # 360.236.3721
50

Advocacy & Organizing for Policy Change
Shelley Curtis, MPH, RDFood Policy ManagerChildren’s Alliance
52
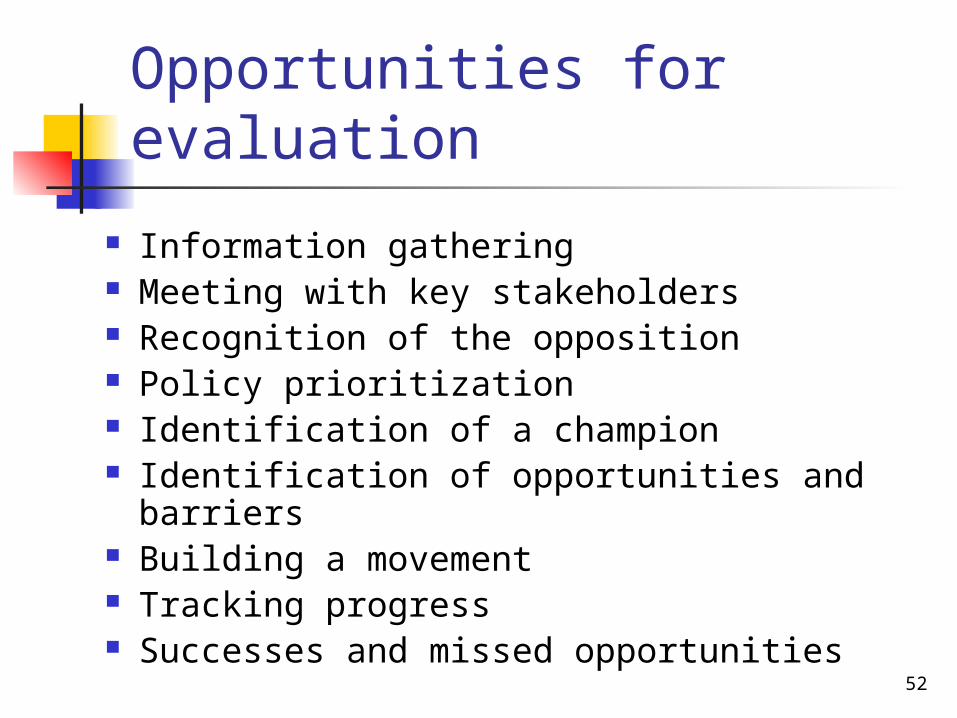
Opportunities for evaluation
Information gathering Meeting with key stakeholders Recognition of the opposition Policy prioritization Identification of a champion Identification of opportunities and barriers Building a movement Tracking progress Successes and missed opportunities

53
Case study - SB 5436
Lack of consensus re: end goal Champion willing to compromise Powerful opposition Lack of evidence of success Fear of losing revenue and local control Accountability piece missing No resources for implementation Organizing success

Evaluation of Policy Change
Conceptual Models & Practical Opportunities
55
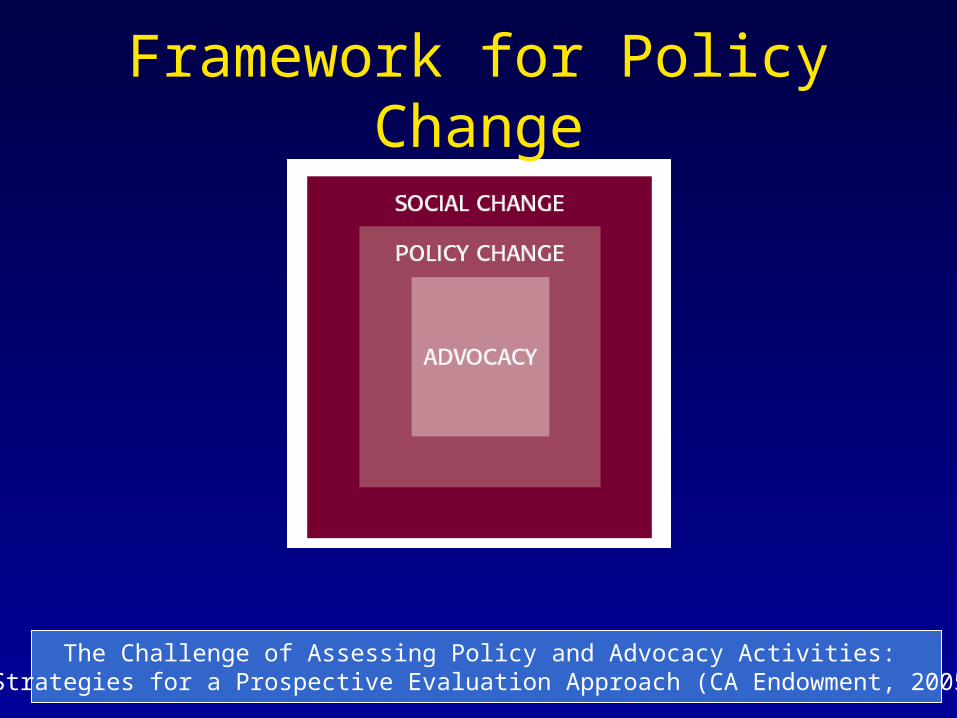
Framework for Policy Change
The Challenge of Assessing Policy and Advocacy Activities: Strategies for a Prospective Evaluation Approach (CA Endowment, 2005)

56
Social Change
• Changes in the private sector
• Expansion & investment in civil society and democracy– Building infrastructure groups– Involving and educating the public
• Creating real material change in individual lives
• Policy Change

57
Policy Change
1. Setting the agenda
2. Specifying alternatives
3. Making a choice
4. Implementing the decision

58
Public Health Advocacy
1. Information gathering & dissemination
2. Strategy development
3. Action

59
Theory of Change: “so that”
Schools offer nutritious foods to children
Pass laws that require school nutrition policies
Children's’ diets improve
Children's health improves
So that
So that
So that

60
Federal/state laws and regulations mandate nutrition policies
School districts develop policies
School districts implement policies
Each school has a “food environment”
Students consume foods at school
Students’ total diets are impacted by foods available at school
Students’ health outcomes improve
Sample Policy Change Evaluation: Schools
61
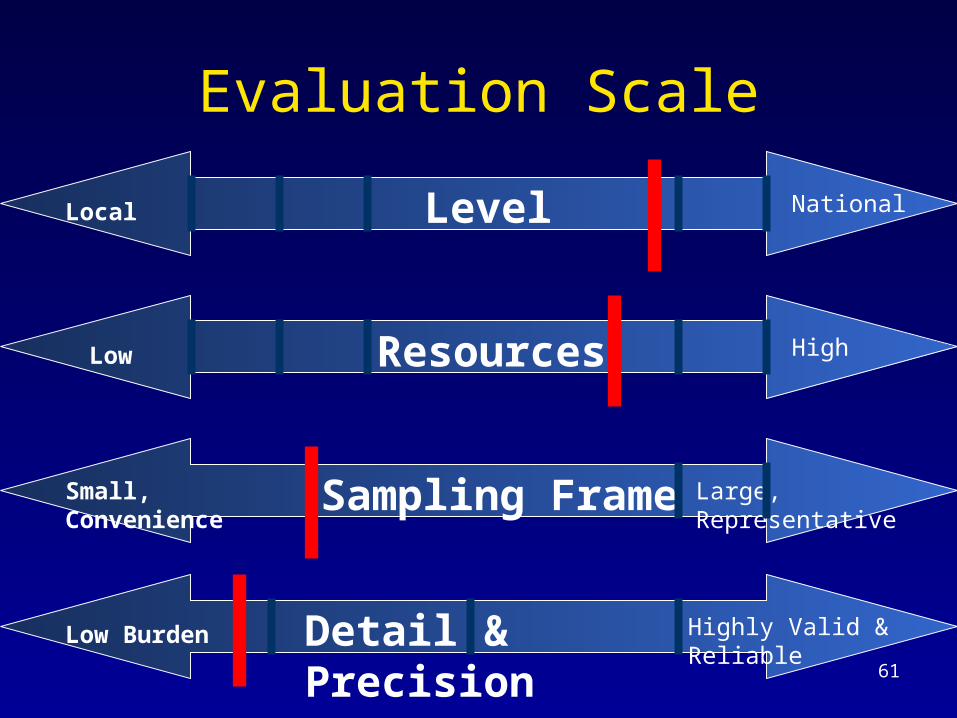
Evaluation Scale
Level
Resources
Sampling Frame
Detail & Precision
Local National
Low High
Large, RepresentativeSmall, Convenience
Highly Valid & ReliableLow Burden

62
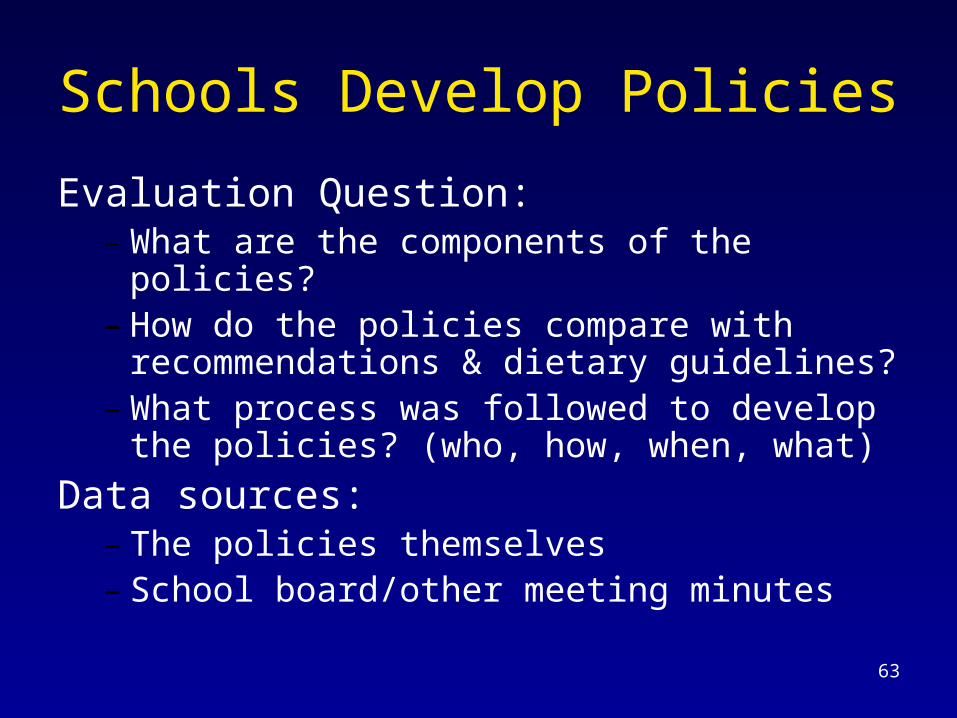
Schools Develop Policies
Evaluation Questions:– What are the components of the policies?– How do the policies compare with
recommendations & dietary guidelines?– What process was followed to develop the
policies? (who, how, when, what)
Data Sources:– The policies themselves– School board/other meeting minutes
63
Schools Develop Policies
Evaluation Question:– What are the components of the policies?– How do the policies compare with
recommendations & dietary guidelines?– What process was followed to develop the
policies? (who, how, when, what)
Data sources:– The policies themselves– School board/other meeting minutes
64
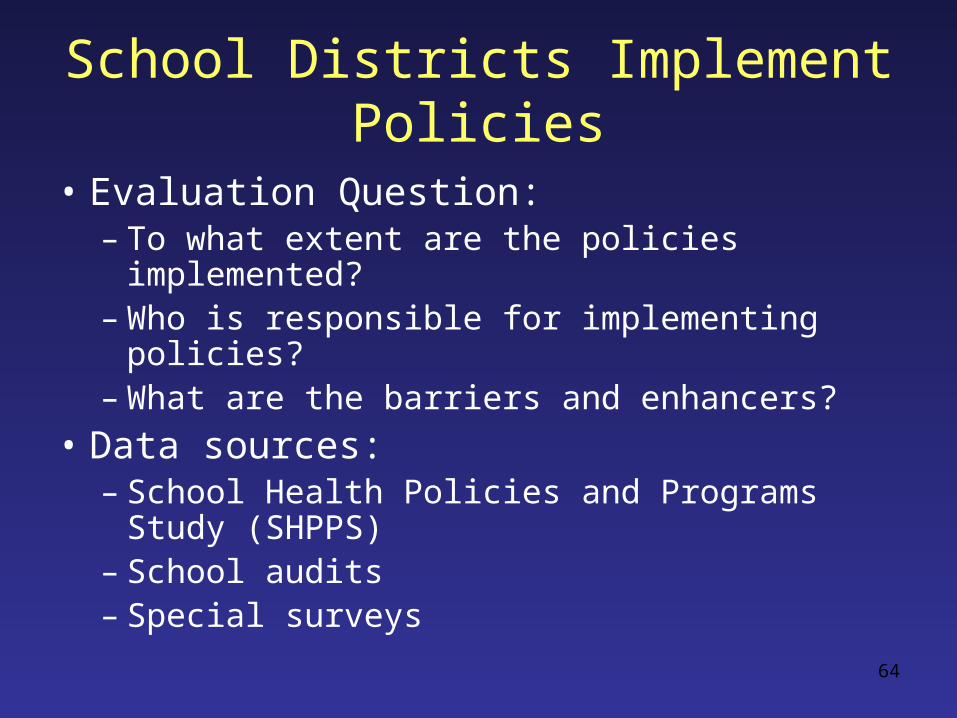
School Districts Implement Policies
• Evaluation Question:– To what extent are the policies implemented?– Who is responsible for implementing policies?– What are the barriers and enhancers?
• Data sources:– School Health Policies and Programs Study
(SHPPS) – School audits– Special surveys
65
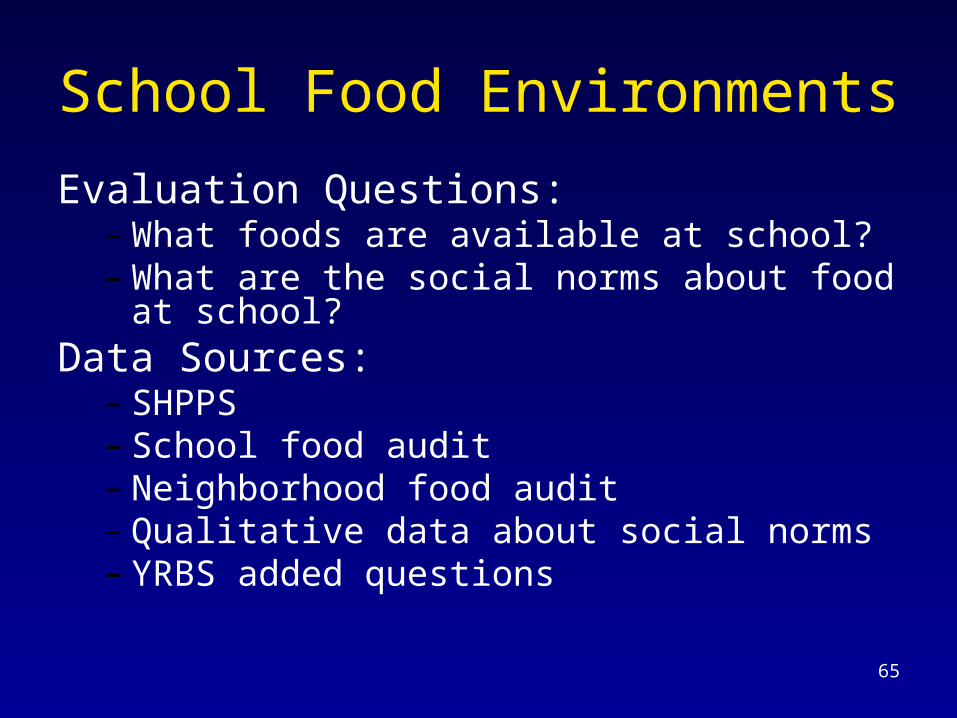
School Food Environments
Evaluation Questions:– What foods are available at school?– What are the social norms about food at
school?Data Sources:
– SHPPS – School food audit– Neighborhood food audit– Qualitative data about social norms– YRBS added questions
66
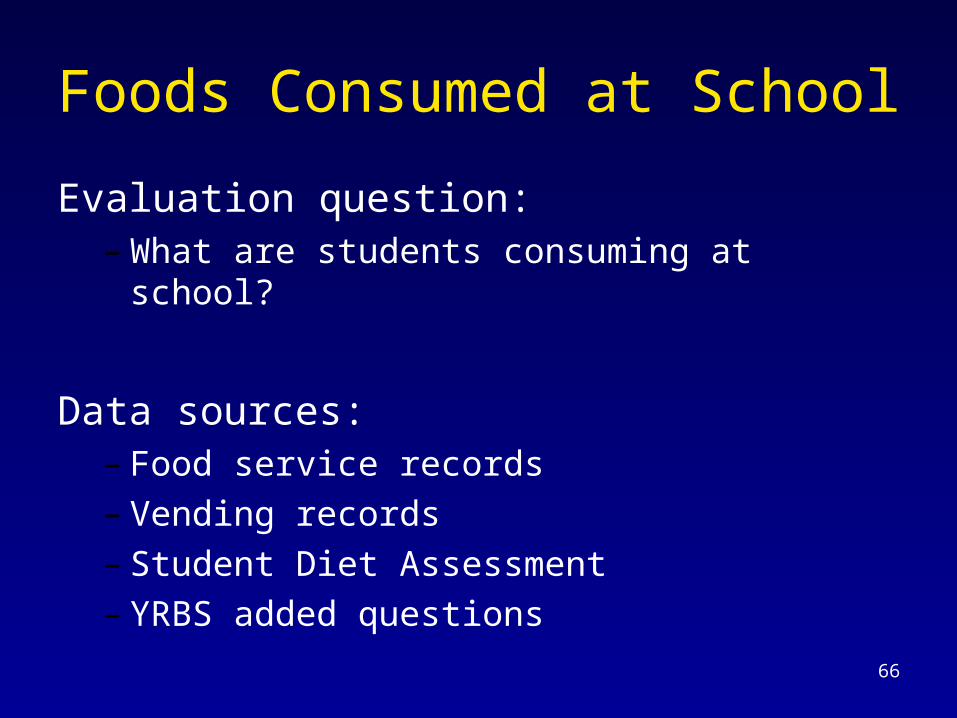
Foods Consumed at School
Evaluation question:– What are students consuming at school?
Data sources:– Food service records – Vending records– Student Diet Assessment– YRBS added questions
67
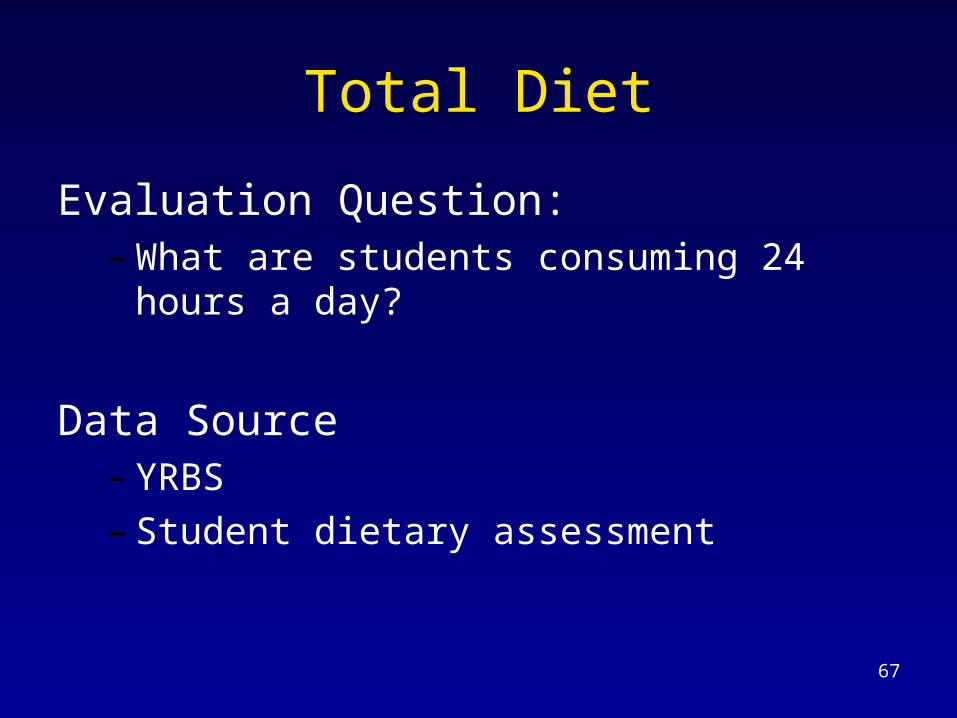
Total Diet
Evaluation Question: – What are students consuming 24 hours a
day?
Data Source– YRBS– Student dietary assessment

68
Health Outcomes
Evaluation question:– How many students have BMIs > 85%?– How many students have diabetes?– How many students have asthma?
Data Sources– School nurses– YRBS
69
Demographic/ contextual factors
• School and neighborhood environments
• Demographic characteristics of students and their families
• Washington Assessment of Student Learning test results
• Geographic location

70
Example: Washington State
• SB 5436: required all public school districts develop nutrition policies by August 1, 2005
• Policies posted from 130 school districts http://depts.washington.edu/waschool/SDpolicies.html
71
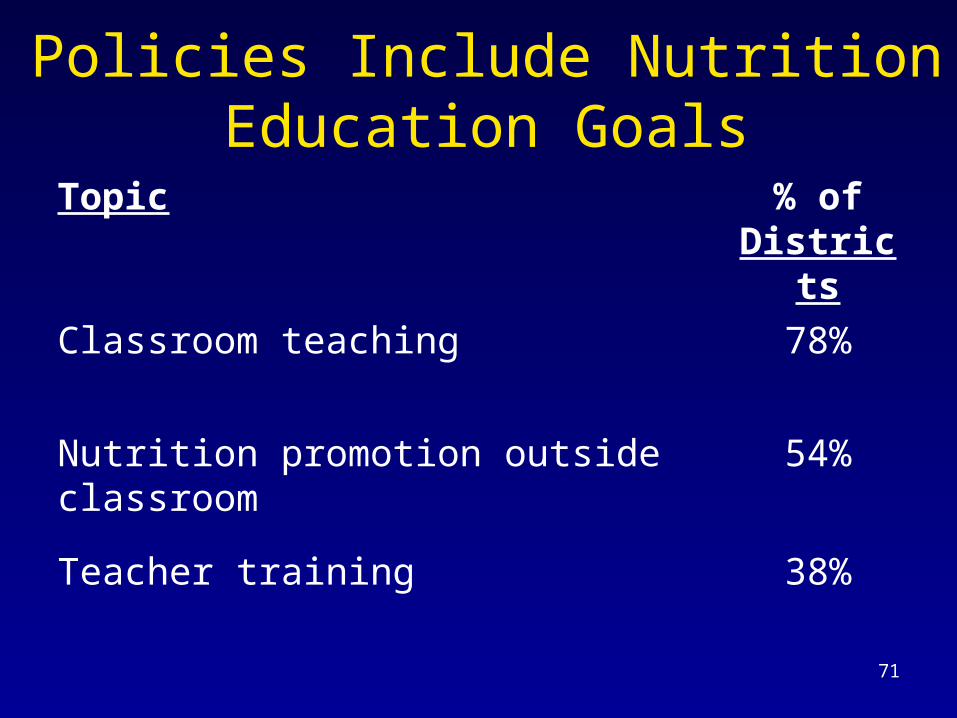
Policies Include Nutrition Education Goals
Topic % of Districts
Classroom teaching 78%
Nutrition promotion outside classroom 54%
Teacher training 38%
72
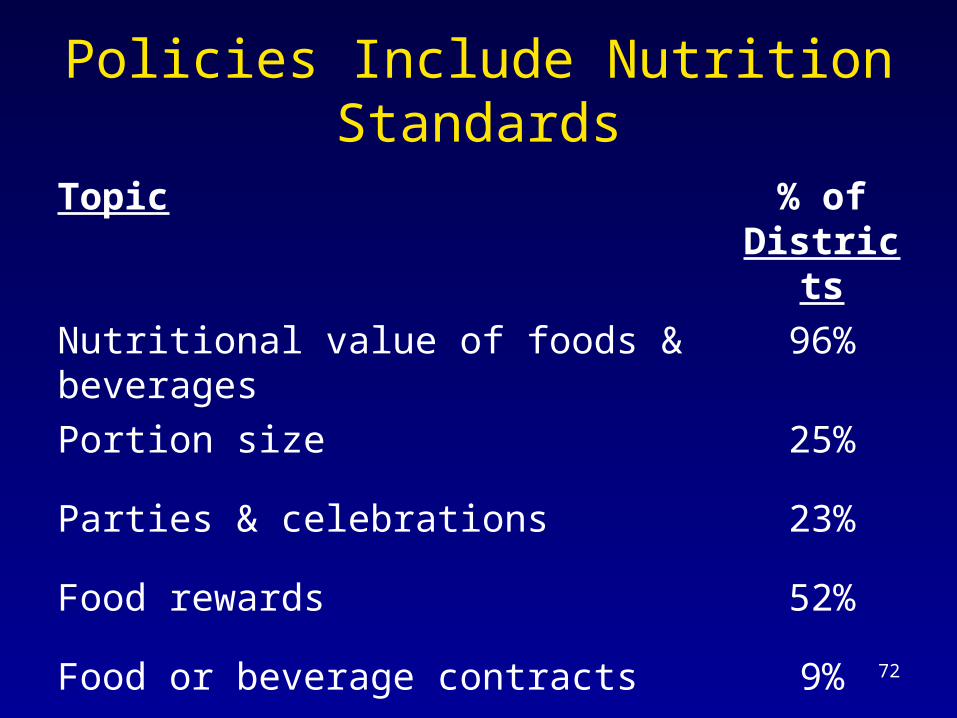
Policies Include Nutrition Standards
Topic % of Districts
Nutritional value of foods & beverages 96%
Portion size 25%
Parties & celebrations 23%
Food rewards 52%
Food or beverage contracts 9%
73
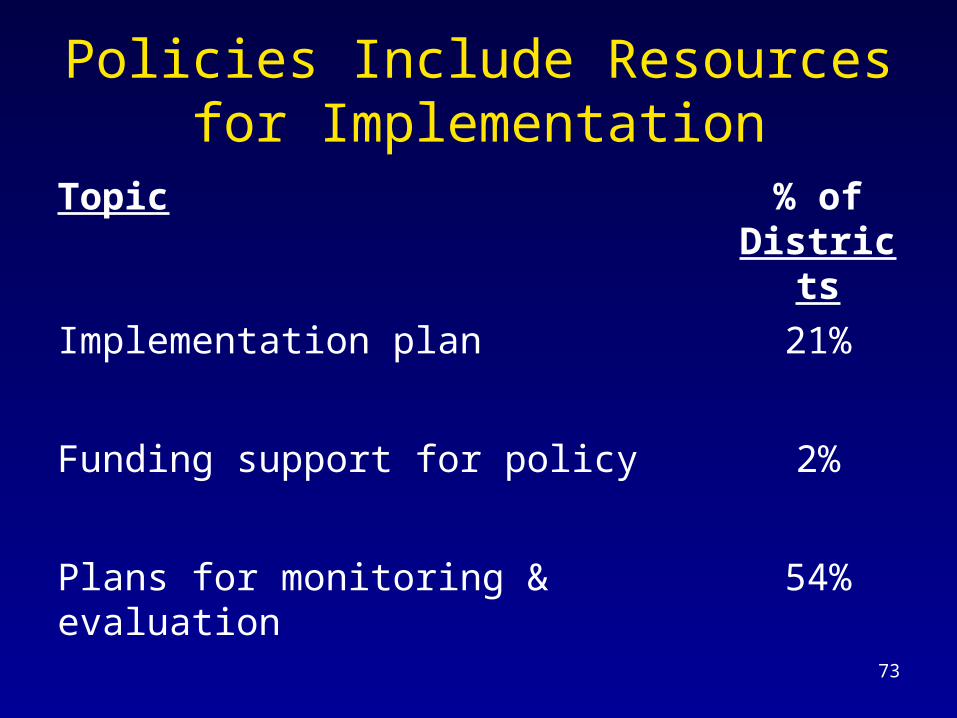
Policies Include Resources for Implementation
Topic % of Districts
Implementation plan 21%
Funding support for policy 2%
Plans for monitoring & evaluation 54%

74
Seattle Public Schools: Competitive Foods
• Total fat content must be less than or equal to 30% of total calories (3 grams per 100 calories) per serving (not including seeds and nuts)
• Saturated fat content must be less than or equal to 10% of total calories per serving;
• Sugar content must be less than or equal to 15 grams per serving (not including fresh, dried or frozen fruits and vegetables)
• Beverage sales are limited to beverages containing less than or equal to 15 grams of added sugar (e.g., corn syrup, honey, sucrose, etc.) per serving and no caffeine.
• Portion size guidelines
http://www.seattleschools.org/area/policies/h/H66.01.pdf

75
Soda - Mean Weekly Consumption
0
0.5
1
1.5
2
2.5
3
Cohort RBHS CHS
Fall 2003
Spring 2004
Fall 2004
Spring 2005
76
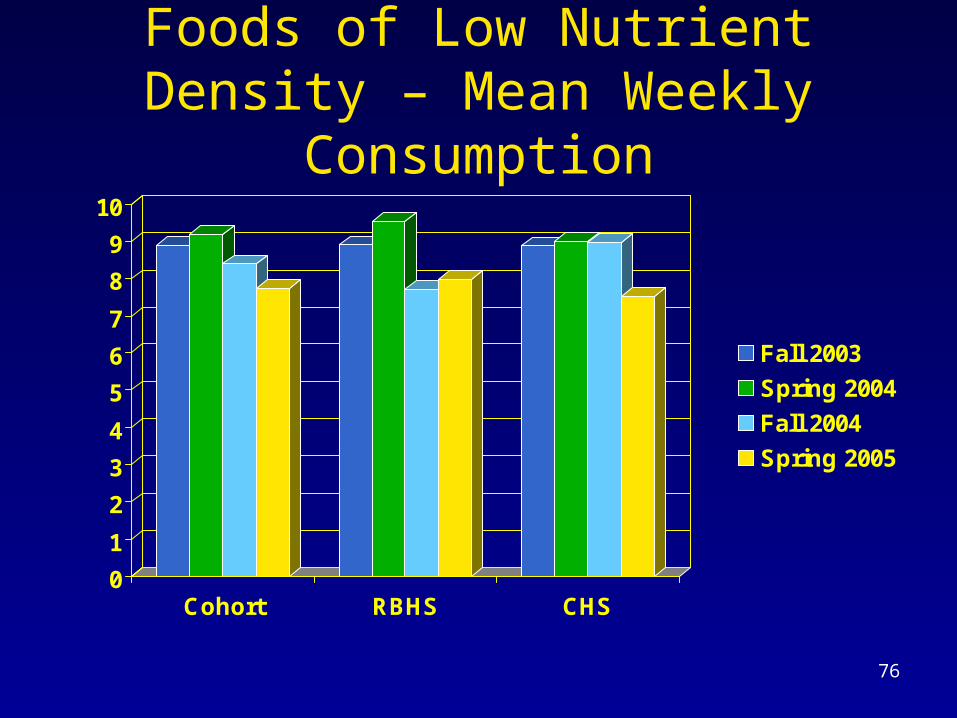
Foods of Low Nutrient Density – Mean Weekly Consumption
0
1
2
3
4
5
6
7
8
9
10
Cohort RBHS CHS
Fall 2003
Spring 2004
Fall 2004
Spring 2005

77
Practical Approach to Policy Evaluation
• Conceptual framework
• Theory of change
• Evaluation opportunities at each step
• Continuum of evaluation scale
• Take advantage of partnerships, coalitions, existing resources, students
Monitoring Changes in Policy and Environments with State-wide Surveillance
Marilyn Sitaker, MPH EpidemiologistCardiovascular Disease, Diabetes, Nutrition and Physical Activity Section, Washington State Department of Health
79
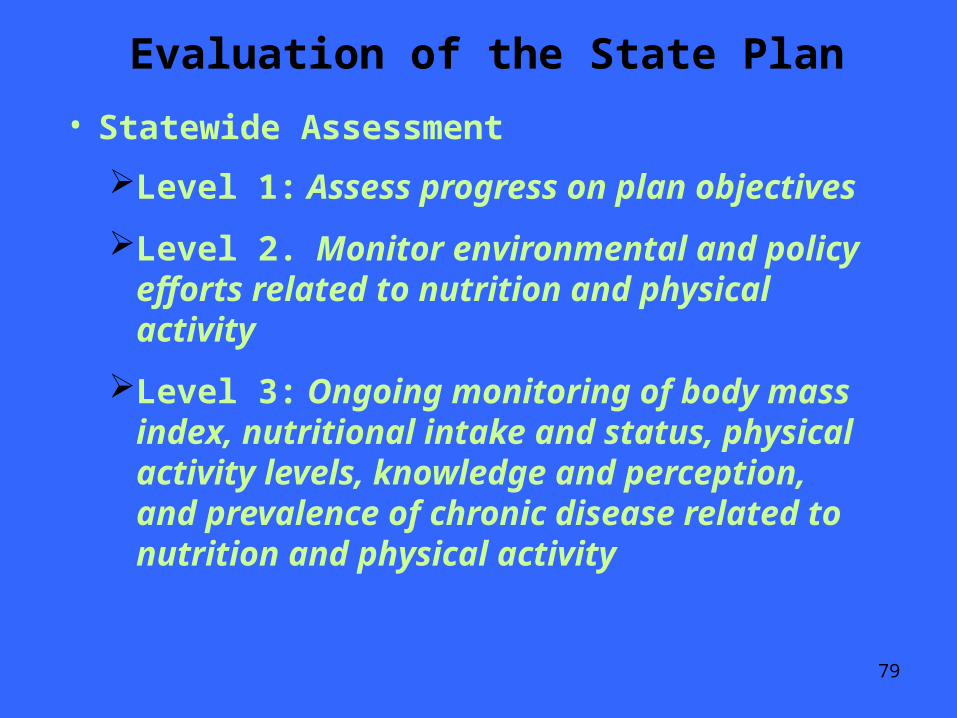
Evaluation of the State Plan
• Statewide Assessment
Level 1: Assess progress on plan objectives
Level 2. Monitor environmental and policy efforts related to nutrition and physical activity
Level 3: Ongoing monitoring of body mass index, nutritional intake and status, physical activity levels, knowledge and perception, and prevalence of chronic disease related to nutrition and physical activity

80
Evaluation of the State Plan
Plan Objectives
1. Increase access to health promoting foods
2. Reduce hunger and food insecurity
3. Increase the percent of mothers who breastfeed their infants and toddlers
4. Increase access to free and low cost recreational opportunities for physical activity
5. Increase the number of physical activity opportunities specifically available to children
6. Increase the number of active community environments
81
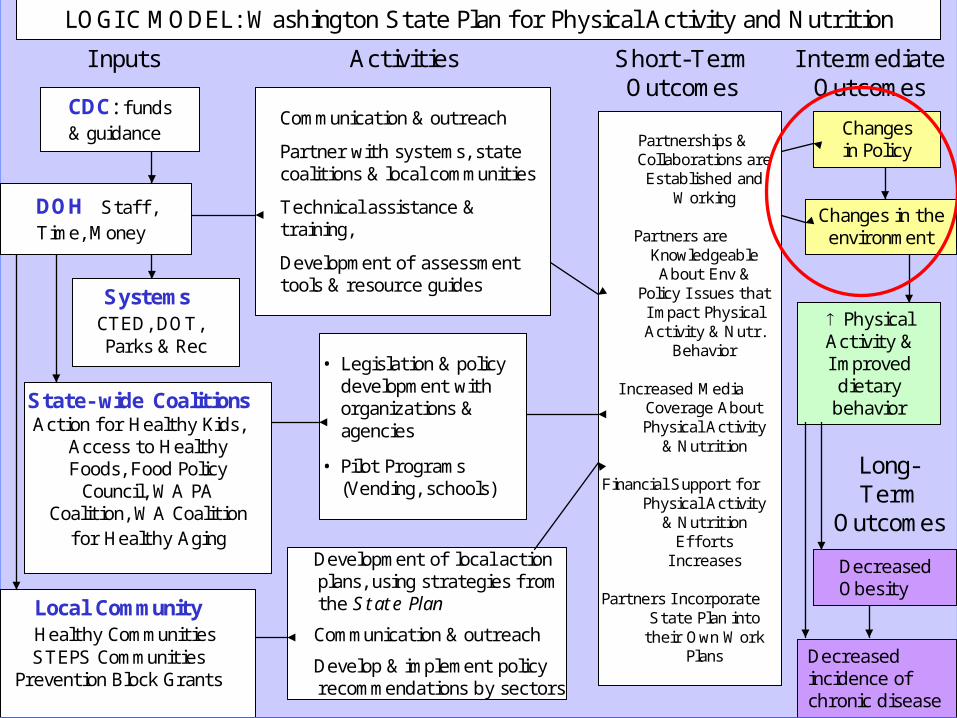
• Legislation & policy development with organizations & agencies
• Pilot Programs (Vending, schools)
Development of local action plans, using strategies f rom the State Plan
Communication & outreach
Develop & implement policy recommendations by sectors
Activities Short-Term Outcomes
I ntermediate Outcomes
LOGI C MODEL: Washington State Plan f or Physical Activity and Nutrition
Physical Activity & I mproved dietary behavior
Changes in the environment
Local CommunityHealthy CommunitiesSTEPS Communities
Prevention Block Grants
State- wide CoalitionsAction f or Healthy Kids,
Access to Healthy Foods, Food Policy
Council, WA PA Coalition, WA Coalition
f or Healthy Aging
SystemsCTED, DOT, Parks & Rec
I nputs
DOH Staff , Time, Money
Communication & outreach
Partner with systems, state coalitions & local communities
Technical assistance & training,
Development of assessment tools & resource guides
Partnerships & Collaborations are Established and
Working
Partners are Knowledgeable About Env &
Policy I ssues that I mpact Physical Activity & Nutr.
Behavior
I ncreased Media Coverage About Physical Activity
& Nutrition
Financial Support f or Physical Activity
& Nutrition Eff orts
I ncreases
Partners I ncorporate State Plan into
their Own Work Plans
CDC: f unds & guidance Changes
in Policy
Long-Term
Outcomes
Decreased incidence of chronic disease
Decreased Obesity
82
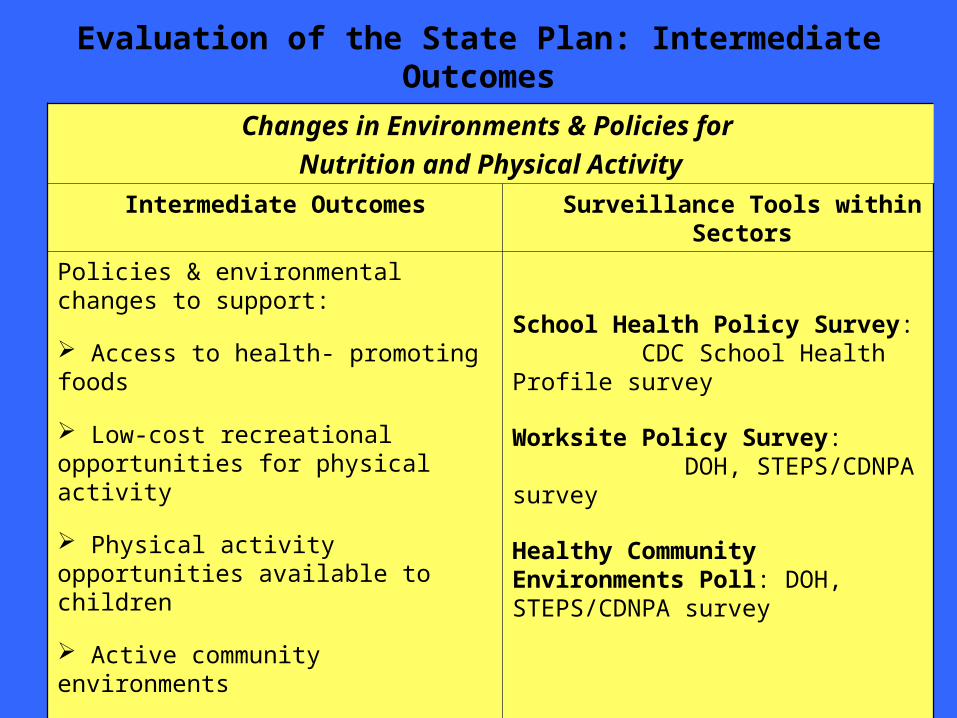
Evaluation of the State Plan: Intermediate Outcomes
Changes in Environments & Policies for
Nutrition and Physical Activity
Intermediate Outcomes Surveillance Tools within Sectors
Policies & environmental changes to support:
Access to health- promoting foods
Low-cost recreational opportunities for physical activity
Physical activity opportunities available to children
Active community environments
Breastfeeding-friendly environments
School Health Policy Survey: CDC School Health Profile survey
Worksite Policy Survey: DOH, STEPS/CDNPA survey
Healthy Community Environments Poll: DOH, STEPS/CDNPA survey
83
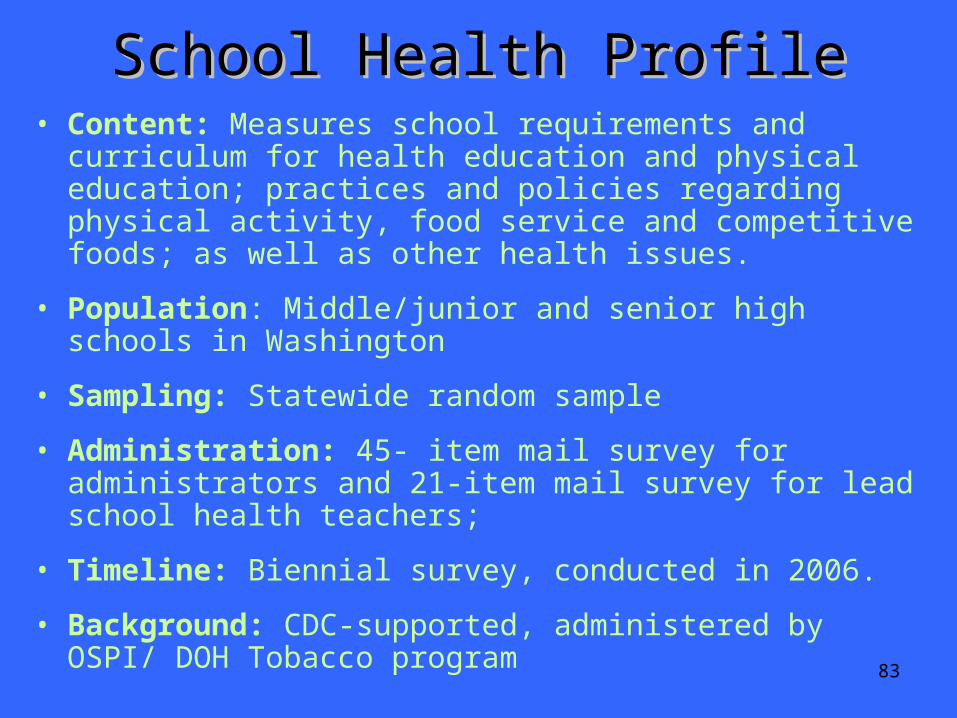
School Health ProfileSchool Health Profile• Content: Measures school requirements and curriculum for
health education and physical education; practices and policies regarding physical activity, food service and competitive foods; as well as other health issues.
• Population: Middle/junior and senior high schools in Washington
• Sampling: Statewide random sample
• Administration: 45- item mail survey for administrators and 21-item mail survey for lead school health teachers;
• Timeline: Biennial survey, conducted in 2006.
• Background: CDC-supported, administered by OSPI/ DOH Tobacco program
84
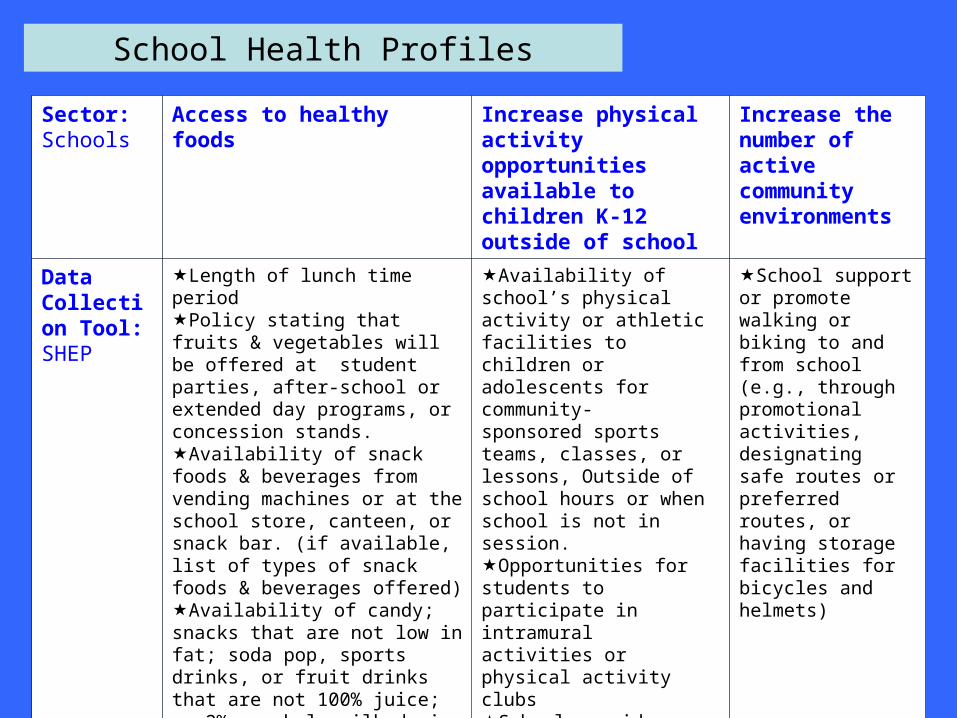
School Health Profiles
Sector:Schools
Access to healthy foods Increase physical activity opportunities available to children K-12 outside of school
Increase the number of active community environments
Data Collection Tool:SHEP
Length of lunch time periodPolicy stating that fruits & vegetables will be offered at student parties, after-school or extended day programs, or concession stands.Availability of snack foods & beverages from vending machines or at the school store, canteen, or snack bar. (if available, list of types of snack foods & beverages offered) Availability of candy; snacks that are not low in fat; soda pop, sports drinks, or fruit drinks that are not 100% juice; or 2% or whole milk during school hours between meals, before school and/or during school lunch.
Availability of school’s physical activity or athletic facilities to children or adolescents for community- sponsored sports teams, classes, or lessons, Outside of school hours or when school is not in session.Opportunities for students to participate in intramural activities or physical activity clubs School provides transportation home for students who participate in after-school intramural activities or physical activity clubs
School support or promote walking or biking to and from school (e.g., through promotional activities, designating safe routes or preferred routes, or having storage facilities for bicycles and helmets)
85
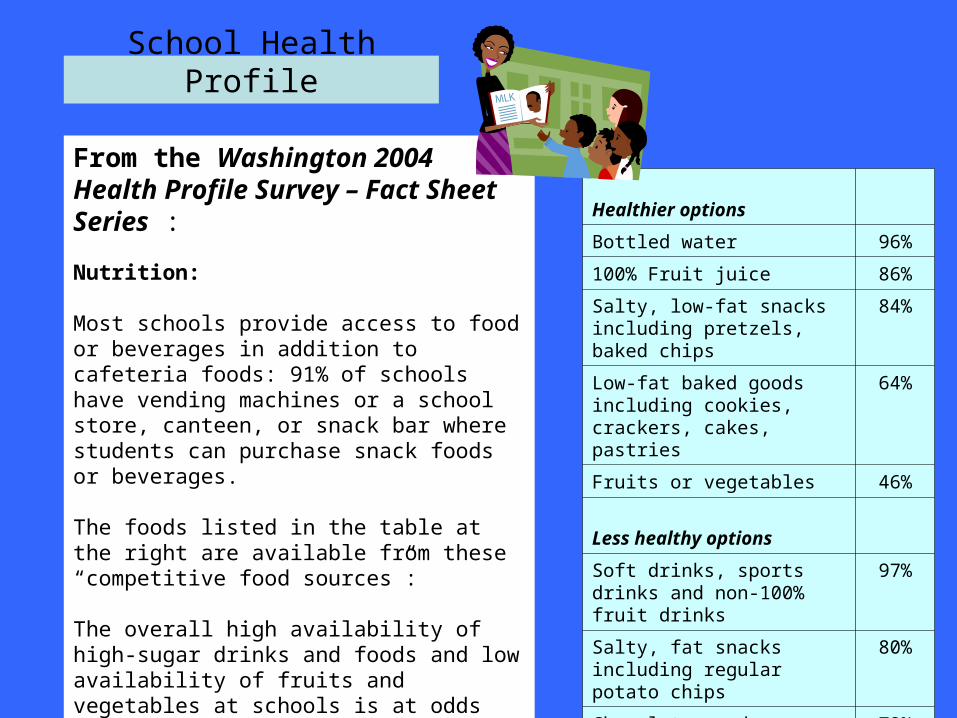
From the Washington 2004 Health Profile Survey – Fact Sheet Series :
Nutrition:
Most schools provide access to food or beverages in addition to cafeteria foods: 91% of schools have vending machines or a school store, canteen, or snack bar where students can purchase snack foods or beverages. The foods listed in the table at the right are available from these “competitive food sources”:
The overall high availability of high-sugar drinks and foods and low availability of fruits and vegetables at schools is at odds with health messages to moderate intake of sugars and choose a variety of fruits and vegetables daily.
School Health Profile
Healthier options
Bottled water 96%
100% Fruit juice 86%
Salty, low-fat snacks including pretzels, baked chips
84%
Low-fat baked goods including cookies, crackers, cakes, pastries
64%
Fruits or vegetables 46%
Less healthy options
Soft drinks, sports drinks and non-100% fruit drinks
97%
Salty, fat snacks including regular potato chips
80%
Chocolate candy 72%
Other candy 75%

86
Healthy Community Healthy Community Environments PollEnvironments Poll
• Content: Measures access to opportunities for PA, healthy foods, built environment and nutrition environment, active lifestyle, secondhand smoke policies & tobacco use
• Population: Non-institutionalized English speaking WA adults with land-line phones (similar to BRFSS)
• Sampling: Statewide, with oversample in STEPS communities (response rate expected to be about 40%)
• Administration: 22 minute RDD phone survey conducted by Gilmore; 18-22 minutes long; required IRB approval
• Timeline: Fall 2005; repeat every 2 years.
• Background: DOH STEPS/CDNPA/Tobacco collaboration
87
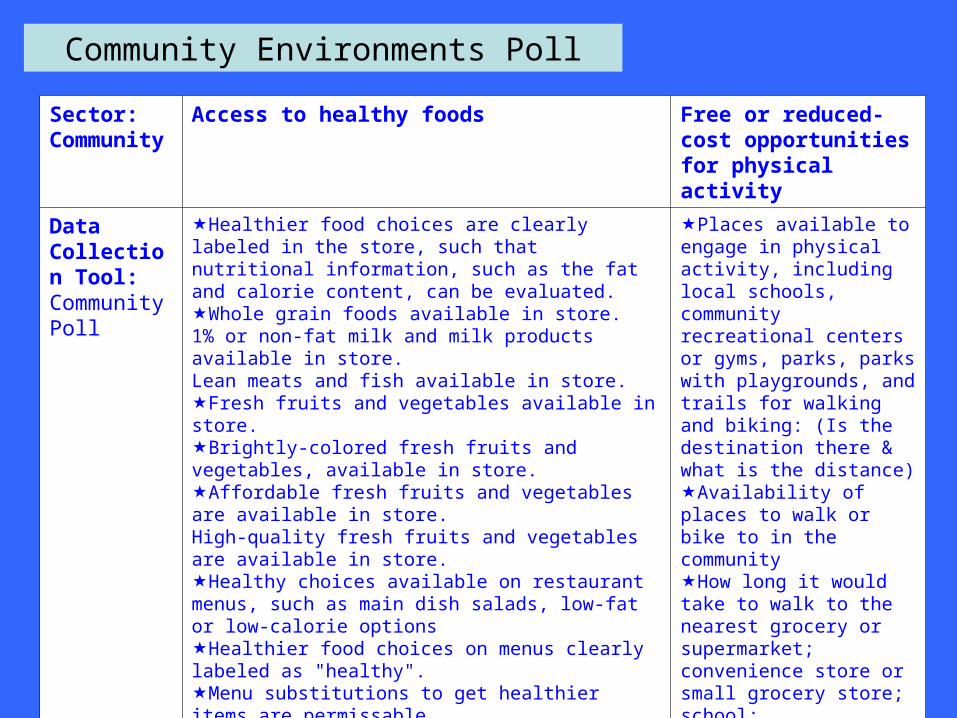
Community Environments Poll
Sector: Community
Access to healthy foods Free or reduced-cost opportunities for physical activity
Data Collection Tool:Community Poll
Healthier food choices are clearly labeled in the store, such that nutritional information, such as the fat and calorie content, can be evaluated. Whole grain foods available in store. 1% or non-fat milk and milk products available in store.Lean meats and fish available in store.Fresh fruits and vegetables available in store.Brightly-colored fresh fruits and vegetables, available in store.Affordable fresh fruits and vegetables are available in store.High-quality fresh fruits and vegetables are available in store.Healthy choices available on restaurant menus, such as main dish salads, low-fat or low-calorie optionsHealthier food choices on menus clearly labeled as "healthy". Menu substitutions to get healthier items are permissable.It is possible to get nutritional information, such as the fat and calorie content of menu items from information listed on the menu or posted in the restaurant.
Places available to engage in physical activity, including local schools, community recreational centers or gyms, parks, parks with playgrounds, and trails for walking and biking: (Is the destination there & what is the distance)Availability of places to walk or bike to in the communityHow long it would take to walk to the nearest grocery or supermarket; convenience store or small grocery store; school; restaurant;parks; playgrounds; trails;

88
Availability of Healthy, Affordable Foods in the Grocery Store
0% 20% 40% 60% 80% 100%
Healthy foods are clearly labelled
I can compare nutritional information
I can f ind w hole grain foods
I can f ind low fat dairy products
I can f ind lean meats and f ish
I can f ind fresh fruits, vegetables andsalad ingredients
I can f ind brightly colored fruits andvegetables
The cost of fresh fruits & vegetablesmakes it easy to include in my diet
The fresh fruits & vegetables I can f indare high quality

89
Healthy Worksite SurveyHealthy Worksite Survey• Content: Measures policies, & environments to support
healthy nutrition, physical activity, breastfeeding and to discourage tobacco use. Included some questions about benefits and attitudes
• Population: WA businesses with 50+ employees, selected from WA Department of Employment Security.
• Sampling: Phase A (tobacco policies only) = county-based sampling. Phase B (nutrition & PA) = forced distribution sampling from Phase A list (response rate about 60%)
• Administration: 15 minute phone survey of HR managers, conducted by Gilmore. Phase A, 1500 businesses, Phase B, 540
• Timeline: Phase A= Summer 2004; Phase B = Fall 2005. Repeat in 2007.
• Background: DOH STEPS/CDNPA/Tobacco collaboration
90
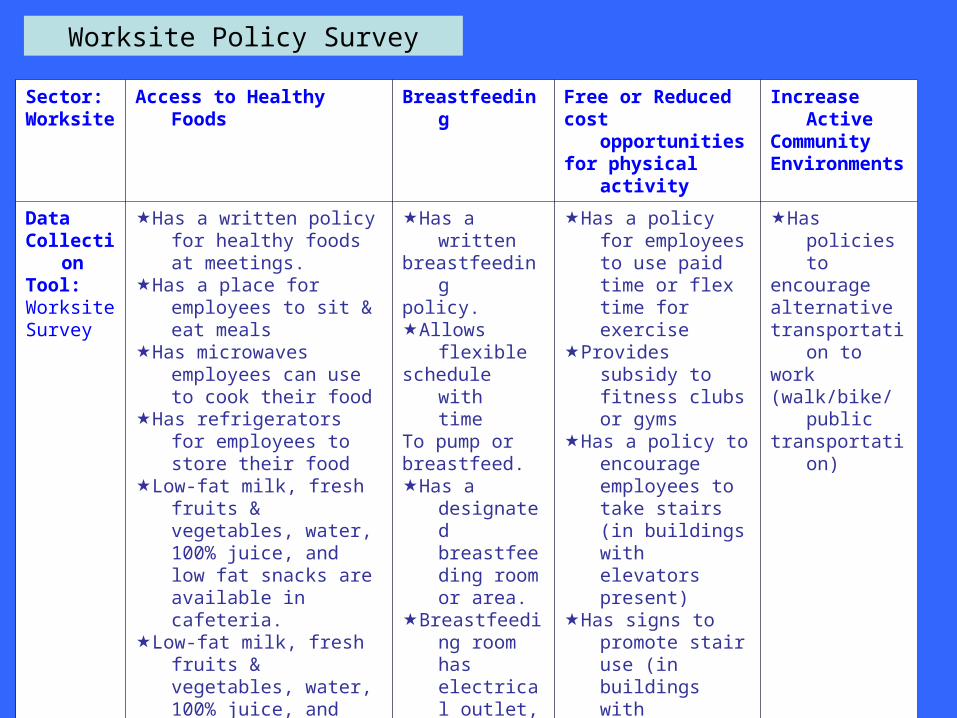
Worksite Policy Survey
Sector:Worksite
Access to Healthy Foods Breastfeeding Free or Reducedcost opportunitiesfor physical activity
Increase ActiveCommunityEnvironments
DataCollectionTool:WorksiteSurvey
Has a written policy for healthy foods at meetings.
Has a place for employees to sit & eat meals
Has microwaves employees can use to cook their food
Has refrigerators for employees to store their food
Low-fat milk, fresh fruits & vegetables, water, 100% juice, and low fat snacks are available in cafeteria.
Low-fat milk, fresh fruits & vegetables, water, 100% juice, and low fat snacks are available in vending.
“Healthy food” labeling used in cafeteria
“Healthy food” labeling used in vending
Has a writtenbreastfeedingpolicy.Allows flexibleschedule with
timeTo pump orbreastfeed.Has a
designated breastfeeding room or area.
Breastfeeding room has electrical outlet, locking door, sink with soap & water, refrigerator to store milk.
Has a policy for employees to use paid time or flex time for exercise
Provides subsidy to fitness clubs or gyms
Has a policy to encourage employees to take stairs (in buildings with elevators present)
Has signs to promote stair use (in buildings with elevators present)
Has policies to encourage alternative transportation to work
Has policies to
encouragealternativetransportation towork(walk/bike/publictransportation)

91
Low Fat Snacks* and Fruits/Veg by Worksite Food Source
0% 20% 40% 60% 80% 100%
cafeteria
snack bar/coffee stand
vending
free foodLow FatSnacks
FreshFruits orVegetables
* Pretzels, chex mix, granola bars
Worksite policies & practices to encourage non-motorized tranport
0% 20% 40% 60% 80% 100%
Policy: w alk& bike
Subsidize public transport
Secured bike storage at w ork
Show ers