
Partition of protein (mass t)o sister cell pair ast...
6
Partition of protein (mass) to sister cell pairs at mitosis: a re-evaluation ROLAND SENNERSTAM Department of Tumor Pathology, Karohnska Hospital and Institute, 104 01 Stockholm 60, Stveden Summary Since the 1960s it has been thought that there is to some extent a difference in the partition of mass to daughter cells at mitosis. Recent studies using modern techniques give further support to such a phenomenon, which has become almost an axiom in cell biology. It has been suggested that such unequal distribution of metabolic constituents at mitosis contributes to the dispersion in cell gener- ation times. In the present •work, PCC3 embryonal carci- noma (EC) cells were studied as undifferentiated Gi sister pairs by microspectrophotometry (MSP) following Feulgen-Naphthol Yellow staining (FNYS), in order to evaluate their protein content. Despite the considerable intraclonal intermitotic time heterogeneity found in undifferentiated PCC3 EC cells, it was concluded that the postmi- totic difference in mass (protein) between sister cell pairs exerts a minimal influence upon the cell population mass variability, whereas it was de- duced to have an influence upon variation in interphase time duration when comparing sister cell pairs. This offers a cell-physiological expla- nation to the randomly distributed difference repeatedly found between sister cell generation times. Furthermore, there was no correlation seen between the mass difference found between sister cell pairs postmitotically and the size of the mother cell. Key words: partition, mitosis, growth rate. Introduction The development of higher plant cells is often the result of precisely regulated cell division, resulting in an unequal cell division prior to cytodifferentiation. This has been demonstrated in leaf cells of Sphagnum cymbifolium, yielding hyaline and chlorenchymous cells (Zepf, 1952). Similar results have been reported when using plants (Stebbins & Shah, 1960; Esau, 1969). In animal cells, a regular modification of cell division is seen at meiosis, resulting in three abortive cells called polar bodies. This raises the question as to whether cell division is a prerequisite for cytodifferen- tiation. In myogenesis, it has been suggested that a 'quantal cell cycle' precedes the differentiative event (Holtzer, 1970). Along with the rigorously regulated asymmetrical cell division in plant cells, a less-certain random uneven distribution of cell mass to daughter cells at mitosis has been found when analysing postmitotic sister pairs by time-lapse cinematography combined with interference microscopy (Killander & Zetterberg, 1965). Recently, further evidence has been presented to support the theory of an unequal partition of mass and RN A during Journal of Cell Science 90, 301-306 (1988) Printed in Great Britain © The Company of Biologists Limited 1988 cytokinesis (Darzynkiewicz et al. 1982). New combined methods of fluorescence staining and flow cytometry were applied to large mitotic and postmitotic populations selected by mitotic detach- ment. A theoretical model was developed, correlating the dispersion in cell generation time with the unequal partition of RNA during cytokinesis (Kimmel et al. 1984). Estimating cell volume, growth rate and inter- division times, it was suggested that inequality in cytoplasmic distribution at cytokinesis might be one of two causes of generation-time dispersion (Hola & Riley, 1987). The question of whether there is a general uneven distribution of metabolic constituents at mi- tosis is particularly important in cell biology. The PCC3 EC cells investigated in this study were found to have an intraclonal growth kinetic heterogeneity in the undifferentiated stage, with evidence of a bimodal growth pattern involving two subvariants of the cell- growth cycle. This offers an interesting opportunity for evaluating the effect of mass partition at mitosis and its contribution to size variation and growth rate hetero- geneity. The most impeccable way of analysing the partition of metabolic constituents during cytokinesis is to investigate identified postmitotic sister pairs, a 301
Transcript of Partition of protein (mass t)o sister cell pair ast...
Partition of protein (mass) to sister cell pairs at mitosis: a re-evaluation
ROLAND SENNERSTAM
Department of Tumor Pathology, Karohnska Hospital and Institute, 104 01 Stockholm 60, Stveden
Summary
Since the 1960s it has been thought that there is tosome extent a difference in the partition of massto daughter cells at mitosis. Recent studies usingmodern techniques give further support to such aphenomenon, which has become almost an axiomin cell biology. It has been suggested that suchunequal distribution of metabolic constituents atmitosis contributes to the dispersion in cell gener-ation times.
In the present •work, PCC3 embryonal carci-noma (EC) cells were studied as undifferentiatedGi sister pairs by microspectrophotometry (MSP)following Feulgen-Naphthol Yellow staining(FNYS), in order to evaluate their protein content.Despite the considerable intraclonal intermitotic
time heterogeneity found in undifferentiatedPCC3 EC cells, it was concluded that the postmi-totic difference in mass (protein) between sistercell pairs exerts a minimal influence upon the cellpopulation mass variability, whereas it was de-duced to have an influence upon variation ininterphase time duration when comparing sistercell pairs. This offers a cell-physiological expla-nation to the randomly distributed differencerepeatedly found between sister cell generationtimes. Furthermore, there was no correlationseen between the mass difference found betweensister cell pairs postmitotically and the size of themother cell.
Key words: partition, mitosis, growth rate.
Introduction
The development of higher plant cells is often theresult of precisely regulated cell division, resulting inan unequal cell division prior to cytodifferentiation.This has been demonstrated in leaf cells of Sphagnumcymbifolium, yielding hyaline and chlorenchymouscells (Zepf, 1952). Similar results have been reportedwhen using plants (Stebbins & Shah, 1960; Esau,1969). In animal cells, a regular modification of celldivision is seen at meiosis, resulting in three abortivecells called polar bodies. This raises the question as towhether cell division is a prerequisite for cytodifferen-tiation. In myogenesis, it has been suggested that a'quantal cell cycle' precedes the differentiative event(Holtzer, 1970).
Along with the rigorously regulated asymmetricalcell division in plant cells, a less-certain random unevendistribution of cell mass to daughter cells at mitosis hasbeen found when analysing postmitotic sister pairs bytime-lapse cinematography combined with interferencemicroscopy (Killander & Zetterberg, 1965). Recently,further evidence has been presented to support thetheory of an unequal partition of mass and RN A duringJournal of Cell Science 90, 301-306 (1988)Printed in Great Britain © The Company of Biologists Limited 1988
cytokinesis (Darzynkiewicz et al. 1982).New combined methods of fluorescence staining and
flow cytometry were applied to large mitotic andpostmitotic populations selected by mitotic detach-ment. A theoretical model was developed, correlatingthe dispersion in cell generation time with the unequalpartition of RNA during cytokinesis (Kimmel et al.1984). Estimating cell volume, growth rate and inter-division times, it was suggested that inequality incytoplasmic distribution at cytokinesis might be one oftwo causes of generation-time dispersion (Hola &Riley, 1987). The question of whether there is a generaluneven distribution of metabolic constituents at mi-tosis is particularly important in cell biology. ThePCC3 EC cells investigated in this study were found tohave an intraclonal growth kinetic heterogeneity in theundifferentiated stage, with evidence of a bimodalgrowth pattern involving two subvariants of the cell-growth cycle. This offers an interesting opportunity forevaluating the effect of mass partition at mitosis and itscontribution to size variation and growth rate hetero-geneity. The most impeccable way of analysing thepartition of metabolic constituents during cytokinesis isto investigate identified postmitotic sister pairs, a
301
method used in this work.Because of the intraclonal 'predeterminate' insta-
bility found in the EC line investigated, and since it hasbeen suggested that, in general, unequal mass distri-bution during cell division contributes to the variationin intermitotic time (Cooper, 1979), it is important toknow whether there is a regulated or a random unevendistribution of mass (protein) to daughter cells duringcytokinesis in these EC cells. Along with its assumedcontribution to cell generation time variability, themechanism might be involved in determining the fateof a cell committed to differentiation.
Materials and methods
Cell culture
The PCC3 N/ l cell line and the medium conditions used incell tissue culture have been described (Sennerstam &Stromberg, 1984).
Sibling cell inlerdivisioii times
Using a TV-video time-lapse technique sister cell pairgeneration times were estimated at 5 % pCC>2 and 37°C in aclosed system as described (Sennerstam & Stromberg, 1984).
Mitotic detachment
Exponentially growing undifferentiated EC cells were cul-tured in 9cm plastic Petri dishes. After washing each dishthree times with fresh medium, following by a 10-minincubation (37°C and 5 % pCO^) mitotic cells were detachedby small rapid movements during 10-15 min. The mediumwas removed and the mitotic cells were seeded onto glassslides at a concentration resulting in less than one sisterpair/visual field in the microspectrophotometer (MSP).
Feulgen-Xaphthol Yellow staining procedureAt 0-5, 10, 1-5, 2-0 and 3 0 h after mitosis slides were washedthree times in phosphate-buffered saline (PBS) and fixed in4% paraformaldehyde before being treated with the com-bined Feulgen-Naphthol Yellow staining (FNYS) procedure(Gaub et al. 1975). This method permits simultaneousmicrospectrophotometric analyses of DNA and protein insingle cells and the protein value is closely correlated to theamount of dry mass of the cell. In screening 100 consecutivecells after fixation and staining on each of three slides for0-5 h, 1 h and 1-5 h after mitosis (300 cells altogether), 92%of the cells were in Gi and 8% in early S phase. Among this92 % a variable number of tetraploid G i cells was occasionallyfound.
Sister pairs were identified in the rapid scanning micro-spectrophotometer (Caspersson & Lomakka, 1962). Sincethere is a minimal difference needed between sister cell pairsto permit measurement as single cells, even non-separatedsister pairs were analysed to avoid an effect depending uponthe selection. The relation between non-separated and separ-ated sister pairs was around 2:1 at 1 -5 h after mitosis (seeFig. I).
The method used to identify cells as sister pairs was testedby the video-time-lapse technique. Two hours after mitotic
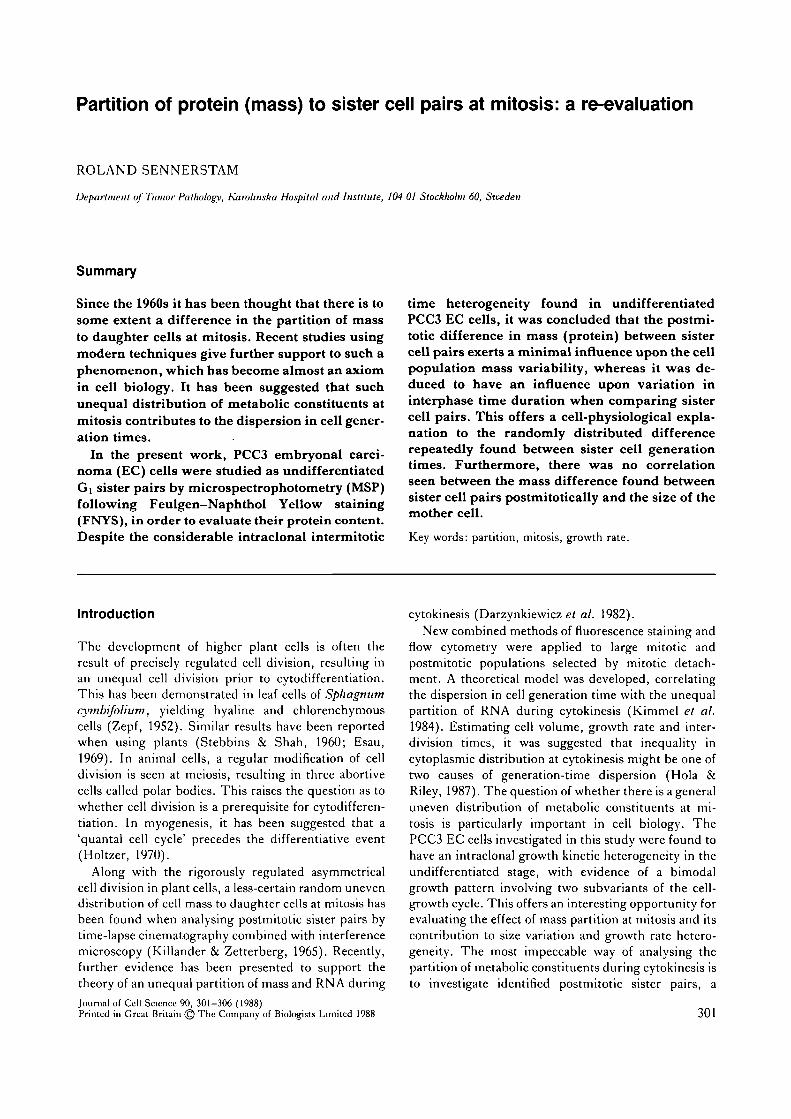
Fig. 1. Six sister cell pairs are shown as they appear afterfixation (4% paraformaldehyde) and staining (FNYS). Aphase-contrast objective was used to visualize the wholecell, since two colours of different wavelengths were used.The possibility of measuring two cells lying close to eachother as two distinct single cells is to some extent restrictedin the MSP. In the figure two sister pairs are separatedenough to be measured in the MSP. The other four pairsare classified as non-separated sister pairs.
detachment 100 pairs of cells (sum of several experiments)seen on the monitor were defined as sister pairs. Theidentification was checked by rewinding the tape and relatingthe cells to the postmitotic position. All sister pairs had beencorrectly identified. The motility of the cells during the firsthours after mitosis was very limited and the bilateral sym-metrical configuration of sister pairs is easily recognized. Theselection might possibly favour the bilateral symmetricalconfiguration to some extent.
Results
At each of the five postmitotic times chosen, around 50identified sister pairs were analysed. Non-separatedsister pairs were also investigated. The protein value ofwell-separated sister pairs was added. The coefficientsof variation of those added protein values were com-pared with the coefficients of variation for the popu-lation of separated sister pairs, to evaluate the influenceof mitotic partition (Table 1).
Using the Feulgen DNA value as the basis fordenoting cells as Gi cells (Table 2), it was found thatwith a constant absolute mass difference \d\ andstandard deviation (s.D.) between sister pairs over timein early G), there was an increase in the coefficient ofvariation (15-5%) for the whole population of separ-ated sister pairs (from 13-55% to 15-45%) and thepopulation of their pairwise added values (from13-02% to 15-03%) as well as for the population ofnon-separated sister pairs (from 13-29% to 15-55%,Table 1). Comparing (by /-test) the three values at0-5 h after mitosis (13-55%, 13-02% and 13-29%),
302 R. Sennerstam

Table 1. Comparison of coefficients of variation
A. Separated sister pairs
Time (h)after mitosis
0-5101-52-03-0
S phase:
* Relative units.
Sister pairs
(")
4549494849
21
B. Non-separated sister pairs
Time aftermitosis (h)
Protein:sum ofsister pairs(mean)*
Protei
Mean value
7-057-097-588-708-24
9-85
S.D.
n/cell
• S.D.
0-9561 0 %1-2711-4371-381
1-467
c.v.(%)
c.v.(%)
13-5515-4516-7716-5216-84
14-89
Protein:non-separatedsister pairs
(")
Differencebetween sister pairs
M0-42420-40570-41%0-70240-7706
0-9341
Mean*
S.D.
0-42090-38820-42450-67880-6821
0-7013
c.v.(%)
0-5101-52-03-0
S phase:
1 Relative units.
14-0814-17151917-4016-57
19-72
1-8332-1302-3822-4562-468
2-726
13-0215-0315-6814-2514-89
13-82
4948474949
13-5214-1514-6016-7616-08
13-2915-5515-7314-7315-12
Table 2. DNA in separated sister pairs
mitosis (h)
0-51-01-52-03 0
* Relative units.
(")
4549494849
Fculgen
(mean)*
3-1773-1813-2423-2233-243
DNA
S.D.
0-25120-31640-22660-21970-2245
Difference in DNAbetween
\d\
0-17780-15630-18190-16690-1576
sister pairs
S.D.
0-1655013090-13770-145001149
S phase
('<)
259
1029
DNA cells
(mean)*
4-0253-8703-8784-0664-069
plus the corresponding three values from the controlexperiment and the corresponding six values at l-0hafter mitosis, a significant difference appeared(P<O01) . There was only a minor difference (3 %) incoefficient of variation (c.v.) comparing the mass ofseparated sister pairs (c.v. = 13-55%) with the popu-lation comprising their added protein values(c.v. = 13-02%) in the first hour after mitosis.
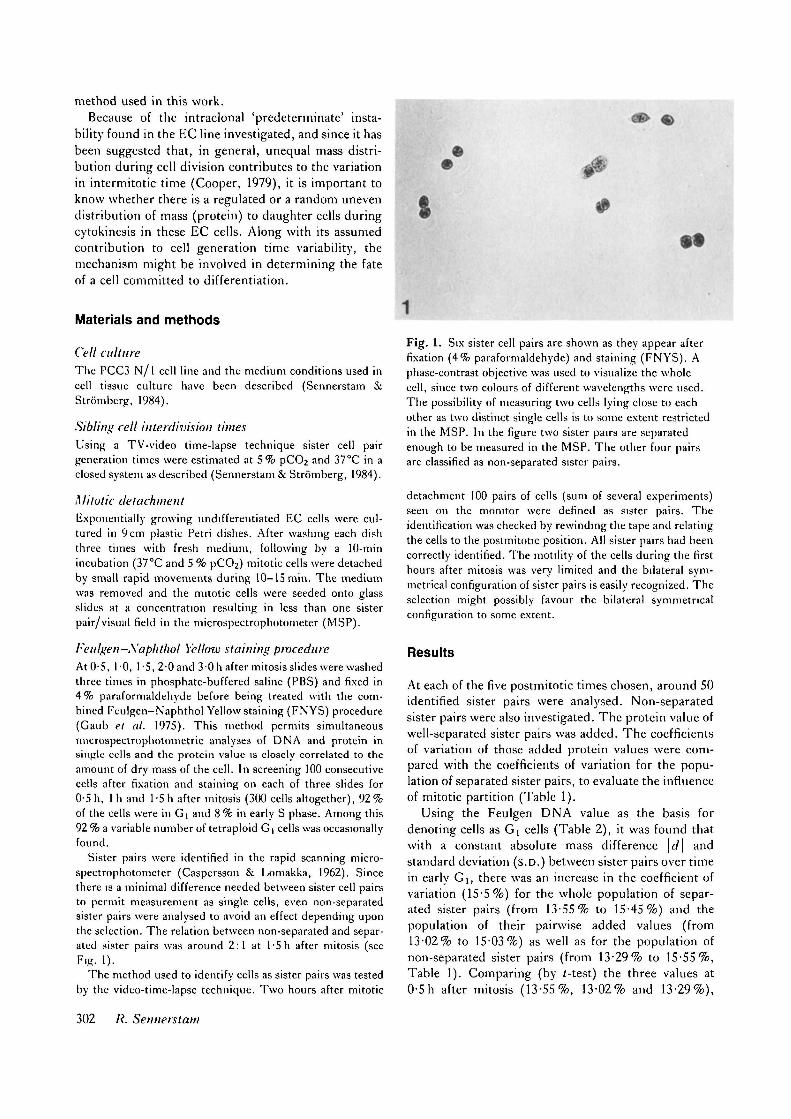
The postmitotic absolute mass difference betweensister pairs was not correlated to the mass of the mothercell (Fig. 2A). The mass value of the mother cell (sum
of sister pair) was compared 1 -5 h after mitosis withtheir mass difference in linear regression analysis and anear-zero correlation appeared (;=0-06, not signifi-cant (ns)). In this experiment the cells were stainedwith NYS only, to avoid the hydrolysis in the Feulgcnstain method. Total nucleotides (DNA + RNA) esti-mated by ultraviolet light absorption in rapid scanningmicrospectrophotometry upon unstained absolute alco-hol/acetone (1:1, v/v)-fixed cells lh after mitosisrevealed a similar result (r = 0-02, ns; Fig. 2B). Thismight explain why the difference between mass of
Protein partition at mitosis 303
\d\
\d\
30-
2-5
2-0
1-5
10
0-5-
0-0
3-0
2-5
2-0-
1-5-
1-0
0-5-
oo-
•
-\ '+ *** T
/
•
••
16 22 28 34 40Protein (mass) of mother cells (rel. units)
18 22 28 30Total nucleotides of mother cells (rel. units)
Fig. 2. A. The mass value; and B, total nucleotides ofmother cells (sum of daughter cells, n = 100 and ;; = 98,respectively) are compared with the daughter cell mass andtotal nucleotide differences \d \ in linear regressionanalyses. In A the cells were stained with NYS only andsister pairs corresponding to the tetraploid mass valueswere included. The coefficients of correlation are for mass,/"= 0-06 and total nucleotides, r = 002 . The equationsobtained by linear regression analyses are: A, V'=0-57 +0-005.Y (t = 0-83); and B, Y= 0-40+0-006.Y (/ = 0-22). Nostatistically significant correlation appeared in any curve,rel., relative.
sister pairs in early G| did not alter the c.v. in thepopulation (see above).
Two to three hours after mitosis an increased absol-ute mass difference between sister pairs appeared(Table 1). This was found to be due to a change ingrowth rate between sister pairs initiated at a rate-regulating point ('restriction point') in the Gi phaseprior to S phase initiation (unpublished data). Byanalysing total nucleotides 2h after mitosis and com-paring the difference between sister cell pairs and theadded sister pair values, a significant positive coef-ficient of correlation was found (/=0-24, P<0-01) .This indicates that the larger cells were the first toreach the restriction point.
20-
10-
0-5 1-5Daughter cell size differences (rel. units)
100-
50-
log
10-
l10 20
Time (h)
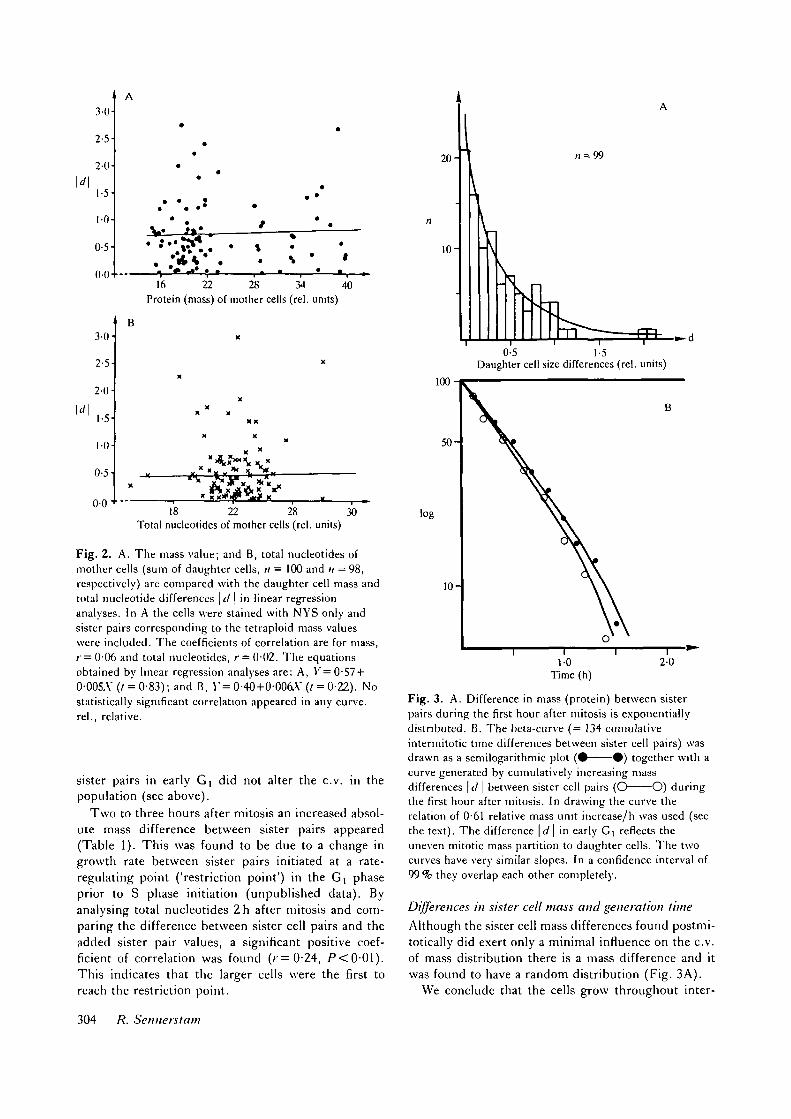
Fig. 3. A. Difference in mass (protein) between sisterpairs during the first hour after mitosis is exponentiallydistributed. B. The beta-curve (= 134 cumulativeintermitotic time differences between sister cell pairs) wasdrawn as a semilogarithmic plot ( • • ) together with acurve generated by cumulatively increasing massdifferences | d \ between sister cell pairs (O O) duringthe first hour after mitosis. In drawing the curve therelation of 061 relative mass unit mcrease/h was used (seethe text). The difference \d\ in early Gi reflects theuneven mitotic mass partition to daughter cells. The twocurves have very similar slopes. In a confidence interval of99 % they overlap each other completely.
Differences in sister cell mass and generation time
Although the sister cell mass differences found postmi-totically did exert only a minimal influence on the c.v.of mass distribution there is a mass difference and itwas found to have a random distribution (Fig. 3A).
We conclude that the cells grow throughout inter-
304 R. Sennerstam
phase, without arrest. The mean intermitotic time was12-3 h and the mean cell size in early Gi was about 7-5relative units. Thus, to reach the same point in the nextcell cycle (doubling in size) requires a size increase of7-5 relative units. This gives a growth rate of 7-5relative size units/12'3 h = 0-61 size units/h. Thisrelation between size increase and time elapsed wasused to compare sister cell generation time differencesand postmitotic sister cell size differences in the samesemilogarithmic graph. A very close correlation be-tween the two curves was found (Fig. 3B). Thus, itwas shown that the uneven partition of mass at mitosiscorresponds to the generation time difference found indaughter cells. A similar result has been found in ahuman breast cancer cell line investigated by us(unpublished data). The mean values for mass andintermitotic time used to estimate size increase/h mightbe regarded as a very rough method. However, it wasthought to be very suitable, since there was no corre-lation between sister cell mass differences and mass ofmother cell at mitosis, which must depend upongrowth rate.
Discussion
From the results of our investigation it was deducedthat the uneven distribution of mass at mitosis had aminimal effect upon the c.v. and cell mass distributionin early Gi (Table 1). This might be a consequence ofthe fact that the mass difference \d\ between sisterpairs in early G| was not correlated with cell size(Fig. 2). This is tantamount to a situation where thesame amount of mass difference appears after eachmitosis, irrespective of the mass of the mother cell. If,however, such a difference were to play a role in massdistribution it would result in an increased size vari-ation in the population, with some cells growingsuccessively smaller, while from one generation to thenext others become successively larger. That is not thecase, however; size distribution follows a fairly con-stant pattern in consecutive cell cycles. Thus, theunequal distribution of mass at mitosis (apart fromerrors in the methods) is corrected for in some wayalready in early Gi. Such a correction may be effectedat a restriction point in Gi and re-establishes the needfor size control in G| phase. How do these resultscorrespond to data reported by other groups?
Unequal distribution of mass at mitosisMethod 1. Killander & Zetterberg (1965) analysed
postmitotically identified sister pairs. The FNYSmethod, which would have made it possible to ascer-tain the G| state by the Feulgen DNA value, had notbeen developed. Instead, a time interval called 'theinitial stage', up to 2#25 h s~ after mitosis was used as a
criterion for the Gi state. Cell size was estimated byinterference microscopy. The main drawback to thismethod is mentioned by the authors themselves,namely that the time elapsed is used when denotingcells as G] cells. In view of our results there is aconsiderable risk that some early S phase cells may bepresent up to 2-25 h after mitosis (Table 2). What ismore, if as predicted there is a 'point of growth rateregulation' near the onset of DNA synthesis, it willincrease the size variation between sister pairs. Thiswill increase the c.v. in size, as was found, anderroneously be concluded to be the result of anasymmetrical mass distribution at mitosis. The poss-ible presence of early S phase cells in the 'initial stage'would reduce the difference when comparing G2 withGi DNA values. This was also the case. A mere 1 -8- to1-9-fold increase in DNA value was found whencomparing G) with G2 cells.
Method2. In the flow cytometric technique the cellsare stained with the fluorescent, metachromatic dyeAcridine Orange (AO). Large mitotic and postmitoticpopulations were analysed for cellular RNA contentand mass was estimated by light-scattering values(Darzynkiewicz et al. 1982). The method offered nopossibility of analysing identified sister pairs, which isthe main drawback of this technique.
However, when comparing mitotic with postmitoticcells, a 15 % increase in the coefficient of variation wasfound for both RNA and mass. The results seem to beconvincing evidence of an unequal mitotic division ofthe two macromolecules investigated. In the resultspresented here, however, a similar and significantincrease in the c.v. (155%) was found in early Giwithout relating it to an unequal partition of mass,since there was no significant difference between thec.v. in the size of single sister cells and the populationof their added protein values (Table 1). The increase inthe c.v. found in early G\ was instead assumed todepend upon a growth rate heterogeneity in the popu-lation (Sennerstam & Stromberg, 1984, 1988). In amammalian epithelial cell line growth rate showed agreater variability (sixfold range) than intcrdivisiontimes (twofold range) (Hola & Riley, 1987). Such aheterogeneity would increase the c.v. in size, like thecontinuously increasing distance between cars travel-ling at different rates.
By comparing our results to the two reports men-tioned the following conclusions can be drawn.
(1) Our results support the concept of a randomuneven partition of protein (mass) to daughter cells atmitosis.
(2) The exponentially distributed difference in mass\d\ occurring between sister pairs leaves open thepossibility of interpreting the random difference insister pair generation times as due to an uneven masspartition at mitosis. This suggests a cell-physiological
Protein partition at mitosis 305

origin for the randomly distributed difference foundbetween generation times in sibling cells and the so-called indeterminate A-state (Minor & Smith, 1974).The present results support the theory of a G|A period,as suggested by Darzynkiewicz el al. (1982).
(3) The mass difference \d\ found postmitoticallydoes not alter the c.v. in mass distribution for the wholepopulation. However, 2h after mitosis an increasedc.v. was found in a population of separated sister pairscompared with the same cells analysed as non-separ-ated sister pairs. This phenomenon has been found tobe due to a growth rate regulating site in the Gi phase(unpublished data). The relative constancy of absolutesister cell pair mass differences at 0-5 h, 1 -0 h and 1 -5 hafter mitosis (Table 1) along with size increase supportsthe theory of a suggested similarity in growth rate ofsister pairs from the first part of Gi phase up to therestriction point, a growth rate suggested as beinginitiated at the restriction point in the previous cellcycle (Sennerstam & Stromberg, 1988).
References
CASPERSSON, T. & LOMAKKA, G. (1962). Scanningmicroscopy techniques for high resolution quantitativecytochemistry. Ann. N.Y. Acad. Sci. 97, 449-463.
COOPER, S. (1979). A unifying model for GI period inprokaryotes and eukaryotes. Nature, Loud. 280, 17-19.
DARZYNKIEWICZ, Z., CRISMAN, H., TRAGANOS, F. &
STEINKAMP, J. (1982). Cell heterogeneity during the cellcycle. J. cell. Pltysiol. 113, 465-474.
ESAU, K. (1969). The phloem. In Handbuch derPlanzenanatomie, vol. V (ed. VV. Zimmerman, P.Ozenda & H. D. Wulf), part 2, p. 205. Berlin: GebruderBorntrager.
GAUB, J., AUER, G. & ZETTERBERG, A. (1975).
Quantitative cytochemical aspects of a combined
Feulgen-Naphthol yellow S staining procedure for thesimultaneous determination of nuclear and cytoplasmicproteins and DNA in mammalian cells. Expl Cell Res.92, 323-332.
HOLA, M. & RILEY, A. (1987). The relative significance ofgrowth rate and interdivision time in the size control ofcultured mammalian epithelial cells. J. Cell Sci. 88,73-80.
HOLTZER, H. (1970). Proliferative and quantal cell cyclesin the differentiation of muscle, cartilage, and red bloodcells. Cell Biol. 9, 69-88.
KILLANDER, D. & ZETTERBERG, A. (1965). Quantitativecytochemical studies on interphase growth. I.Determination of DNA, RNA and mass content of agedetermined mouse fibroblasts in vitro. Expl Cell Res. 38,272-289.
KIMMEL, M., DARZYNKIEWICZ, Z., ARINO, O. &
TRAGANOS, F. (1984). Analysis of a cell cycle modelbased on unequal division of metabolic constituents todaughter cells during cytokinesis. J. theor. Biol. 110,637-664.
MINOR, P. D. & SMITH, J. A. (1974). Explanation ofdegree of correlation of sibling generation times inanimal cells. Nature, hand. 248, 241-243.
SENNERSTAM, R. & STROMBERG, J.-O. (1984). A
comparative study of the cell cycles of nullipotent andmultipotent embryonal carcinoma cell lines duringexponential growth. Devi Biol. 103, 221-229.
SENNERSTAM, R. & STROMBERG, J.-O. (1988). Evidence foran intraclonal random shift between two types of cellcycle times in an embryonal carcinoma cell line. J. theor.Biol. (in press).
STEBBINS, G. L. & SHAH, S. S. (1960). Developmentalstudies of cell differentiation in the epidermis ofmonocotyledons. II. Cytological features of stomataldevelopment in the Gramineae. Devi Biol. 2, 477-500.
ZEPF, E. (1952). Uber die Differenzierung desSphagnumblattes. Z. Bot. 40, 87-118.
{Received 13 November 1987 -Accepted 23 February 1988)
306 R. Sennerstam