Particle Fragmentation during the Last Stages of Biomass ... · 1 Particle Fragmentation during the...
10
1 Particle Fragmentation during the Last Stages of Biomass Combustion in a Large-Scale Laboratory Furnace M. Almeida Mechanical Engineering Department, Instituto Superior Técnico, Universidade de Lisboa, Portugal Abstract The main objective of this work is to study the particle fragmentation during the last stages of biomass combustion in a large-scale laboratory furnace For comparison purposes coal has also been used. The biomass fuels studied included cork residues, platanus branches and furniture residues and data is reported for particle burnout and particle concentration and size distribution. In addition, a number of selected particle samples were examined in a scanning electron microscope. The results reveal that: a) particle fragmentation occur in combustion of coal, cork residues and platanus branches; b) particle fragmentation does not occur during the combustion of furniture residues; c) for coal, PM 1 were largely composed by Fe and Si, and a decrease in particle diameter led to increases in Fe and S contents and a decrease in their Si content; d) in all biomasses the concentrations of Si and Ca decrease with decreasing the particle diameter; for platanus branches S increases as the particle diameter decreases; for furniture residues, Cl increases for small particles; for furniture residues and platanus branches, K increases as the particle diameter decreases. Keywords: coal, biomass, particles, fragmentation, ashes 1. Introduction Particle fragmentation, which corresponds to the particle disintegration during combustion, is one of the most important concerns in biomass combustion as it contributes to the ultra-fine particulate matter (PM) emissions, which are especially harmful to the human health. Particle fragmentation is a rather complex subject and the very few studies available in the literature have mainly concentrated on coal combustion. Costa et al. [1, 2] study the chemical kinetics and the particle fragmentation of pine shells, and wheat straw, before and after torrefaction in a drop tube furnace (DTF). For the fragmentation study were done measures for the concentration and particle size distribution for all biomasses in the DTF at 1100 ! C. The main conclusion was that the torrefaction does not promote the particle fragmentation even for biomasses which have great tendency for that. Xu et al. [3] examined the fragmentation of coal combustion in a DTF and reported that, in the final stages of the combustion process, particles tend to break and divide in more particles leading to a decrease in the particle mean diameter. Seames [4] used scanning electron microscope techniques to evaluate the fragmentation of coal particles and concluded that, as coal occurs at constant diameter, the event finding a collapsed particle may indicate particle fragmentation. It should be noted that, while coal burns at approximately constant diameter, biomass tends to retain its original desorbed shape during combustion, thus varying particle diameter during combustion [5]. This means that the evaluation of the particle fragmentation in biomass combustion using mean diameters or scanning electron microscope techniques may be inconclusive. Liu et al. [6] study the char fragmentation of coal combustion in a DTF at 1300 ! C. The char samples were collected for different burnout values, and their structure was analysed in a scanning electron microscope. The results show fragmentation during the first stages of combustion of char, resulting in a large number of small particles. In general, the fragmentation begins for burnout values lower than 30% and became significant between 30% and 50%.
Transcript of Particle Fragmentation during the Last Stages of Biomass ... · 1 Particle Fragmentation during the...

1
Particle Fragmentation during the Last Stages of Biomass Combustion in a Large-Scale Laboratory Furnace
M. Almeida Mechanical Engineering Department, Instituto Superior Técnico, Universidade de Lisboa, Portugal
Abstract The main objective of this work is to study the particle fragmentation during the last stages of biomass combustion in a large-scale laboratory furnace For comparison purposes coal has also been used. The biomass fuels studied included cork residues, platanus branches and furniture residues and data is reported for particle burnout and particle concentration and size distribution. In addition, a number of selected particle samples were examined in a scanning electron microscope. The results reveal that: a) particle fragmentation occur in combustion of coal, cork residues and platanus branches; b) particle fragmentation does not occur during the combustion of furniture residues; c) for coal, PM1 were largely composed by Fe and Si, and a decrease in particle diameter led to increases in Fe and S contents and a decrease in their Si content; d) in all biomasses the concentrations of Si and Ca decrease with decreasing the particle diameter; for platanus branches S increases as the particle diameter decreases; for furniture residues, Cl increases for small particles; for furniture residues and platanus branches, K increases as the particle diameter decreases. Keywords: coal, biomass, particles, fragmentation, ashes 1. Introduction Particle fragmentation, which corresponds to the particle disintegration during combustion, is one of the most important concerns in biomass combustion as it contributes to the ultra-fine particulate matter (PM) emissions, which are especially harmful to the human health. Particle fragmentation is a rather complex subject and the very few studies available in the literature have mainly concentrated on coal combustion. Costa et al. [1, 2] study the chemical kinetics and the particle fragmentation of pine shells, and wheat straw, before and after torrefaction in a drop tube furnace (DTF). For the fragmentation study were done measures for the concentration and particle size distribution for all biomasses in the DTF at 1100 !C. The main conclusion was that the torrefaction does not promote the particle fragmentation even for biomasses which have great tendency for that. Xu et al. [3] examined the fragmentation of coal combustion in a DTF and reported that, in the final stages of the combustion process, particles tend to break and divide in more particles leading to a decrease in the particle mean diameter. Seames [4] used scanning electron microscope techniques to evaluate the fragmentation of coal particles and concluded that, as coal occurs at constant diameter, the event finding a collapsed particle may indicate particle fragmentation. It should be noted that, while coal burns at approximately constant diameter, biomass tends to retain its original desorbed shape during combustion, thus varying particle diameter during combustion [5]. This means that the evaluation of the particle fragmentation in biomass combustion using mean diameters or scanning electron microscope techniques may be inconclusive. Liu et al. [6] study the char fragmentation of coal combustion in a DTF at 1300 !C. The char samples were collected for different burnout values, and their structure was analysed in a scanning electron microscope. The results show fragmentation during the first stages of combustion of char, resulting in a large number of small particles. In general, the fragmentation begins for burnout values lower than 30% and became significant between 30% and 50%.

2
2. Materials and methods The present tests have been performed in the Instituto Superior Técnico large-scale laboratory
furnace (see Figure 1) is a vertical cylinder 0.6 m in diameter and 2.4 m in length, down-fired along its axis by a swirl burner. The furnace roof and the initial 1.2 m length of the cylindrical walls are refractory-lined. The outer surfaces of the refractory walls are surrounded by cooling water jackets. The remaining 1.2 m length of the wall surfaces are water cooled only. A more detailed description of the experimental facility can be found elsewhere [7-9].
Figure 1. IST laboratory furnace.
Figure 2 shows a schematic of the furnace roof and burner arrangement. The burner consists of
a central gun and a secondary air supply in a conventional double-concentric configuration, terminating in a refractory quarl. The burner gun consist of two concentric tubes: the central orifice is used for the introduction of the solid fuels together with the primary air (transport air) and the annular orifice is used for the introduction of natural gas (see figure 2). The secondary air, supplied by a fan of variable speed, enters the plenum chamber situated above the burner (see figure1), in which in encounters a movable block swirl generator of the type developed at the International Flame Research Foundation. The air then flows through an interchangeable cylindrical duct and subsequently into the refractory quarl section. The solid fuel feeding system is fully described in [7,9]. The transport (primary) air for the solid fuels is supplied by an air compressor, with the flow rates being measured using mass flow controllers.
The gases for the measurement of the flue gas concentration data were obtained with the aid of a stainless steel water-cooled probe [7,9]. The probe had a central tube through which quenched samples were evacuated. This central tube was surrounded by two concentric tubes for probe cooling. The gas sample was drawn through the probe and part of the system by an oil-free diaphragm pump. A condenser removed the main particulate burden and condensate. A filter and a drier removed any residual particles and moisture so that a constant supply of clean dry combustion gases was delivered to the analyzers through a manifold to give species concentration on a dry basis. The analytical instrumentation included a magnetic pressure analyzer for O2 measurements, a non dispersive infrared gas analyzer for CO2 and CO measurements, a flame ionization detector for HC measurements and a chemiluminescent analyzer for NOx measurements. At the combustor exit, probe effects were negligible and errors arose mainly from quenching of chemical reactions, which was found to be adequate. Repeatability of these flue gas data was, on average, within 15%. Solid

3
sampling was performed with the aid of the stainless steel water cooled, water-quenched probe used for gas species sampling. Upon leaving the probe, the char samples were collected in a glass container. Following decantation, the collected solid sample was placed in an oven at approximately 110 !C to dehydrate. The particle burnout values were obtained from the following equation [7,9]:
𝜓 = !!(!!/!!)(!! !!)
(1)
where 𝜓 is the particle burnout, 𝑤 is the dry ash mass fraction, and the subscripts k and x refer to ash content in the input solid-fuel and char sample, respectively.
Figure 2. Furnace roof and burner arrangement.
Particulate matter (PM) concentrations and size distributions were made with the aid of two
low pressure impactor, one three-stage cascade impactor (LPI, TCR Tecora) and another thirteen stage cascade impactor (LPI, Dekati). PM was sampled in three different axial positions (1.65, 1.95 and 2.25 m), used a water-cooled, nitrogen-quenched stainless steel probe. The three stages LPI allowed collecting three PM cut sizes during the same sampling: PM with diameters above 10 µμm (PM10), PM with diameters between 2.5 µμm and 10 µμm, and PM with diameters below 2.5 µμm (PM2.5). The thirteen stages DLPI allowed size-classified the PM according to their aerodynamic diameter in the range of 0.03-10 µm. In order to avoid condensation, a heating jacket (model Winkler WOTX1187) was used during sampling. In the three stages LPI the particle was collected on quartz microfiber filters, which were dried in an oven and weighted before each test. After each test, the filters were again dried, to eliminate moisture, and weighted to determine the quantity of PM captured. The thirteen stages DLPI use aluminium filters and in that case just weighted after and before each test to determine the PM captured.
Finally, PM collected for all fuels from threes axial positions in the laboratorial furnace were examined in a scanning electron microscope (SEM) – JEOL, model JSM-7001F, equipped with an energy-dispersive X-ray spectroscopy (EDS) detector that allows for quantifying the ultimate composition of a PM sample with a resolution of about 1 µm2. For each selected impactor substrate, PM chemical composition data were obtained from five different areas of 50 × 50 µm2. 3. Solid fuels and test conditions The biomasses studied in this work include cork, furniture residues and platanus. The platanus and

4
furniture residues are collected in the north of Portugal and cork are collected in the south of Portugal, in Algarve. For comparative purposes a bituminous coal from United Kingdom has also been used. The proximate and ultimate analyses of coal were made in the Laboratório de Caracterização de Combustíveis do Instituto Nacional de Engenharia e Tecnologia Industrial, according to the standards. The biomasses characterization was made in the laboratório de caracterização de residuos CVR (Centro para a Valorização de Resíduos) according to the standards. Table 2 shows the properties of all fuels.
Table 3 shows the tests conditions. In order to help the combustion process and flame stabilization, a small amount of natural gas has been used in all tests.
Table 2. Properties of the solid fuels.
Proximate analysis (wt%, as received) Coal Furniture Cork Platanus
Volatiles Fixed Carbon Moisture Ash
44.6 87.79 76.6 81 51.4 11.53 21.39 17.68 1.7 - - - 2.3 0.68 2.01 1.32
Ultimate analysis (wt%, dry ash free)
Carbon Hydrogen Nitrogen Sulphur Oxygen
79.3 43.6 53.8 47.6 5.9 6.3 6.62 5.98 1.9 0.62 0.35 0.54 0.5 0.034 0.034 0.16 8.4 49.95 39.2 45.72
Ash analysis (wt%, dry basis) SiO!
Al!O!
Fe!O!
CaO
SO!
MgO
TiO!
P!O!
K!O
Na!O
Cl
Other oxides
39.4 4.84 3.44 1.29
23.2 3.01 1.58 0.765
24.7 1.95 0.28 0.592
3.5 35.09 70.3 59.92
1.5 4.31 1.62 2.68
1.0 6.78 1.67 8.48
1.7 3.23 0.05 <0.01
0.2 3.34 1.75 12.9
1.2 24.71 13.55 8.66
2.6 1.69 2.38 2.69
< 0.01 0.59 2.4 1.03
1.0 - - -
High heating value (MJ/kg) 35.0 - - -
Low heating value (MJ/kg) 33.6 18.1 19.2 18.1
5
Table 3. Tests conditions.
Parameter Coal Cork Platanus Furniture Total flame power (kW) 100
Natural gas power (kW) 60
Solid fuel power (kW) 40
Natural gas flow rate (kg/h) 4.45
Solid fuel flow rate (kg/h) 4.3 7.5 8.0 8.0
Excess air coefficient 1.15
Mass flow rate primary air (kg/h) 5.0 5.5 5.2 5.0
Mass flow rate secondary air (kg/h) 120.4 132.1 124.9 120.4
Swirl number 1.4 4. Results and discussion
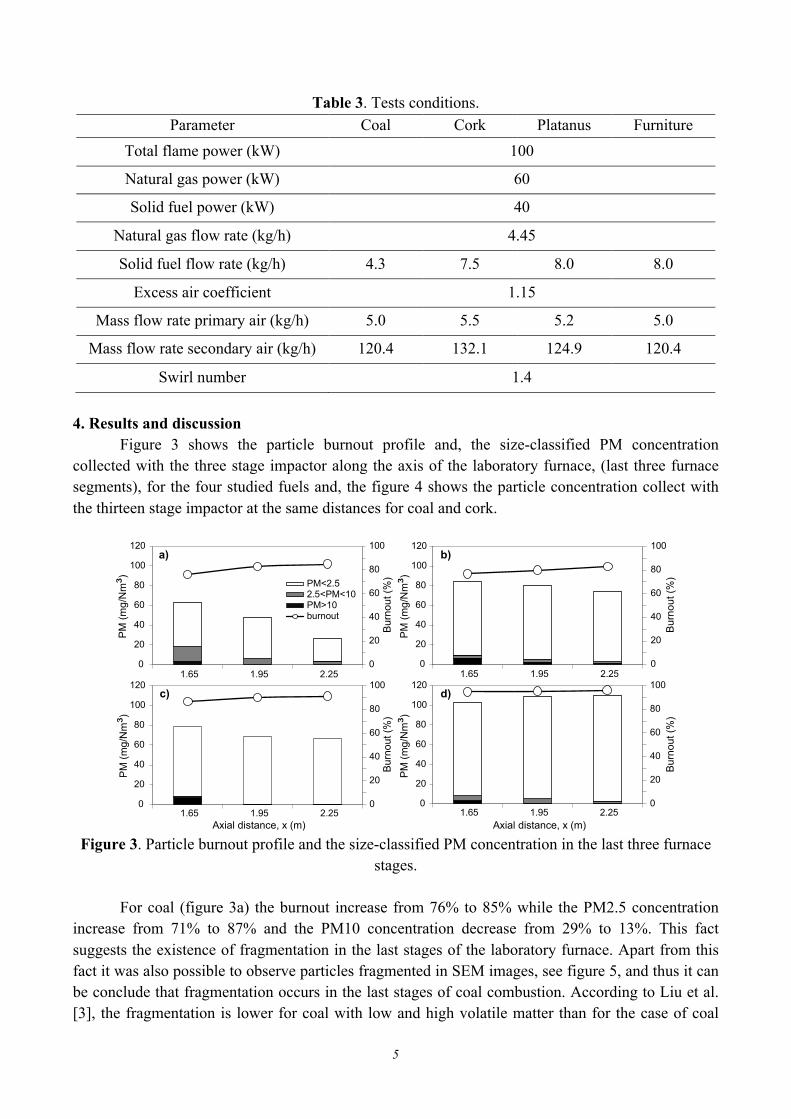
Figure 3 shows the particle burnout profile and, the size-classified PM concentration collected with the three stage impactor along the axis of the laboratory furnace, (last three furnace segments), for the four studied fuels and, the figure 4 shows the particle concentration collect with the thirteen stage impactor at the same distances for coal and cork.
Figure 3. Particle burnout profile and the size-classified PM concentration in the last three furnace
stages.
For coal (figure 3a) the burnout increase from 76% to 85% while the PM2.5 concentration increase from 71% to 87% and the PM10 concentration decrease from 29% to 13%. This fact suggests the existence of fragmentation in the last stages of the laboratory furnace. Apart from this fact it was also possible to observe particles fragmented in SEM images, see figure 5, and thus it can be conclude that fragmentation occurs in the last stages of coal combustion. According to Liu et al. [3], the fragmentation is lower for coal with low and high volatile matter than for the case of coal
0
20
40
60
80
100
120
1.65 1.95 2.25
PM
(mg/
Nm³)
0
20
40
60
80
100
Bur
nout
(%)
0
20
40
60
80
100B
urno
ut (%
)
0
20
40
60
80
100
120
1.65 1.95 2.25
PM
(mg/
Nm³)
0
20
40
60
80
100
0
20
40
60
80
100
120
1.65 1.95 2.25
Bur
nout
(%)
PM
(mg/
Nm³)
Axial distance, x (m) Axial distance, x (m)
0
20
40
60
80
100
0
20
40
60
80
100
120
1.65 1.95 2.25
Bur
nout
(%)
PM
(mg/
Nm³) PM<2.5
2.5<PM<10PM>10burnout
a) b)
c) d)

6
with high concentration in volatiles. Through SEM images it is also possible to see that not all particles are fragmented which can support the last conclusion. In figure 4 it is possible to identify a bimodal particle size distribution, and not trimodal like said in some studies. In this case, it can be observed the ultrafine mode for particles with 0.1 µμm diameter and the intermediate mode for particles with 2.5 µμm. Regarding the morphology of the coal particles, there are some differences between PM2.5 (particles with diameter less than 2.5 µμm) and PM1 (particles with diameter less than 1µμm). The PM2.5 is dominated by spherical with a smooth surface while the PM10 have irregular shape and coagulates. This may indicate that the formation of particle with diameter less than 1 µμm is mainly for collision and partial fusion of particles. The chemical composition (see figure 6) shows that in the PM collected in substrate 4 of the DLPI (figure 6c) (PM with aerodynamic diameter around 0.158 µm), Fe and S appear in bigger quantity than in PM2.5 where S is not detected and the Fe concentration is minor. The results show that Si concentration tends to decrease with the decreasing of particle size unlike Fe and S, whose concentration increase with the decrease of particle diameter.
Figure 4. PM size distribution for coal and cork obtained with the DLPI in the last three furnace
segments.
Figure 5. Typical SEM images of coal particles collected at axial distance of: (a, b) 1.65 m, (c, d)
x 5,000 20.0kV SEI1µm MicroLabSEM x 15,000 20.0kV SEI
1µm MicroLabSEM
a) b)
x 5,000 20.0kV SEI1µm MicroLabSEM x 15,000 15.0kV SEI
1µm MicroLabSEM
c) d)
x 5,000 20.0kV SEI1µm MicroLabSEM x 15,000 20.0kV SEI
1µm MicroLabSEM
e) f)

7
1.95 m and (e, f) 2.25 m. For the case of cork (figure 3b) burnout increases from 77% to 83% while the PM2.5
increase from 88.9% to 96.3% and the PM10 decrease from 11.1% to 3.7%. These facts suggest fragmentation occurs in the last stages of the laboratory furnace. In figure 4 it is possible to identify a bimodal particle distribution, like that occurs for the case of coal. It is also possible to see from the SEM images (figure 7), that the biomass, unlike of that happened for coal, does not show spherical shape nor tendency to maintain its shape during combustion. On the other hand, it is also possible to see that seems to be fragments and also a spherical shape particle. Regarding the particle size distribution and the SEM images it can be concluded that fragmentation occurs in cork combustion. The PM chemical composition (see figure 6) shows that K and Cl concentration increase with the decreasing of particle diameter unlike of Ca and Si that decrease with the decreasing of particle size.
For the case of furniture residue (figure 3c) burnout increase from 87% to 91% while the PM2.5 increase from 89.7% to 99.5% and the PM10 decrease from 10.3% to 0.5%. These facts suggest that particle fragmentation occurs in the last stages of furniture combustion. Regarding the SEM images (figure 8) it is possible to verify that furniture residues had no well-defined shape. In the last segment the particles appear to be agglomerate and not fragmented thus it can be said that for the case of furniture residues particle fragmentation does not occur. The PM chemical composition (figure 9) shows that K and Cl concentration increase with the decreasing of particle diameter, unlike of Ca and Si that decrease with the decreasing of the particle size.
For the case of platanus (figure 3d) burnout increases from 95% to 96% while the PM2.5 concentration increase from 92% to 98% and PM10 decrease from 8% to 2%. The fact that burnout virtually does not increase and the PM2.5 concentration increase significantly, suggests that particle fragmentation occurs in the last stages of platanus combustion. Comparatively to furniture residues, the platanus particles do not have a well-defined particles shape despite it close spherical format. However, in this case the SEM images (figure 10) do not reveal any fragmentation phenomenon. Regarding the chemical composition (see figure 9), the S and K concentration increase with the decreasing of the particle diameter unlike of Si and Ca that decrease with the decreasing of particle diameter.
Figure 6. Chemical composition of particles collected at axial distance of 2.25 m: (a, b, c) coal, (d,
e, f) cork. Error bars represent standard deviations derived from 5 independent measurements.
0
20
40
60
80
100
C O Na Al Si S Cl K Fe Ca Mg
Concentration(wt%)
0
20
40
60
80
100
C O Na Al Si S Cl K Fe Ca Mg0
20
40
60
80
100
C O NaMg Si P S Cl K Ca Ti Fe
0
20
40
60
80
100
C O NaMg Si P S Cl K Ca Ti FeElement
0
20
40
60
80
100
C O Al Si S Cl K Ca MgElement
0
20
40
60
80
100
C O Al Si S Cl K Ca Mg
Concentration(wt%)
Element
2.5 < PM < 10 PM2.5 Substrate 4a) b) c)
2.5 < PM < 10 PM2.5 Substrate 4d) e) f)

8
Figure 7. Typical SEM images of cork particles collected at axial distance of: (a, b) 1.65 m, (c, d)
1.95 m and (e, f) 2.25 m.
Figure 8. Typical SEM images of furniture particles collected at axial distance of: (a, b) 1.65 m, (c,
d) 1.95 m and (e, f) 2.25 m.
x 50 20.0kV SEI100µm MicroLabSEM x 100 20.0kV SEI
100µm MicroLabSEM
a) b)
x 1,000 20.0kV SEI10µm MicroLabSEM x 5,000 20.0kV SEI
1µm MicroLabSEM
c) d)
x 1,000 20.0kV SEI10µm MicroLabSEM x 10,500 20.0kV SEI
1µm MicroLabSEM
e) f)
x 1,000 20.0kV SEI10µm MicroLabSEM x 5,000 20.0kV SEI
1µm MicroLabSEM
a) b)
x 1,000 20.0kV SEI10µm MicroLabSEM x 5,000 20.0kV SEI
1µm MicroLabSEM
c) d)
x 5,000 20.0kV SEI1µm MicroLabSEM x 10,000 20.0kV SEI
1µm MicroLabSEM
e) f)

9
Figure 9. Chemical composition of particles collected at axial distance of 2.25 m: (a, b) furniture
and (c, d) platanus. Error bars represent standard deviations derived from 5 independent measurements.
Figure 10. Typical SEM images of platanus particles collected at axial distance of: (a, b) 1.65 m, (c,
d) 1.95 m and (e, f) 2.25 m. 5. Conclusions This work intended to study the fragmentation of the particles in the last stages of the combustion of solid fuels (biomass and coal) in an existing laboratory furnace. The results reported include particle burnout, particle mass concentration and size distribution, measured in three different positions along the furnace axis. In addition, a number of selected PM collected for all fuels were examined in
a) b)
c) d)
2.5 < PM < 10 PM2.5
2.5 < PM < 10 PM2.5
0
20
40
60
80
100
C O Na Al Si P S Cl K Ca Cr Fe Cu Zn Ti Mg
0
20
40
60
80
100
C O Mg Al Si P S Cl K CaElement
0
20
40
60
80
100
Concentration(wt%)
C O Mg Al Si P S Cl K CaElement
0
20
40
60
80
100
Concentration(wt%)
C O Na Al Si P S Cl K Ca Cr Fe Cu Zn Ti Mg
x 1,000 20.0kV SEI10µm MicroLabSEM x 5,000 20.0kV SEI
1µm MicroLabSEM
a) b)
x 5,000 15.0kV SEI1µm MicroLabSEM x 10,000 15.0kV SEI
1µm MicroLabSEM
c) d)
x 5,000 15.0kV SEI1µm MicroLabSEM x 15,000 15.0kV SEI
1µm MicroLabSEM
e) f)

10
a scanning electron microscope. The main conclusions arising from the discussion of the present results are:
• Particle fragmentation occur in combustion of coal, cork residues and platanus branches; • Particle fragmentation does not occur during the combustion of furniture residues; • For coal, sub-micrometer particles were largely composed by Fe and Si, and a decrease in
particle diameter led to increases in Fe and S contents and a decrease in the Si content; • In all biomasses the concentrations of Si and Ca decrease with decreasing the particle
diameter; for platanus branches S increases as the particle diameter decreases; for furniture residues, Cl increases for small particles; for furniture residues and platanus branches, K increases as the particle diameter decreases.
References [1] F. Costa, G. Wang, M. Costa, Proceedings of the Combustion Institute 35 (2015) 3591-3599. [2] F. Costa, M. Costa, Energy Procedia 66 (2015) 277-280. [3] M. Xu, D. Yu, H. Yao, X. Liu, Y. Qiao, Proceedings of the Combustion Institute 33 (2011)
1681-1697. [4] W. S. Seames, Proc. Combust. Inst. 81 (2003) 109-125 [5] A. Williams, J. M. Jones, L. Ma, M. Pourkashanian, Progress in Energy and Combustion
Science 38 (2012) 113-137. [6] G. Liu, H. Wu, R. P. Gupta, J. A. Lucas, A. G. Tate, T. F. Wall, Fuel 79 (2000) 627-633 [7] C. Casaca, M. Costa, Combust. Science and Technology 175 (2003) 1953-1977. [8] C. Casaca, M. Costa, Proceedings of the Combustion Institute 32 (2009) 2641-2648. [9] G. Wang, T. Pinto, M. Costa, Fuel 117 (2014) 269-277.