Particle formation in urban and regional background ... · Abstract Introduction Conclusions ... to...
30
ACPD 13, 20531–20560, 2013 Particle formation in urban and regional background environments Z. B. Wang et al. Title Page Abstract Introduction Conclusions References Tables Figures Back Close Full Screen / Esc Printer-friendly Version Interactive Discussion Discussion Paper | Discussion Paper | Discussion Paper | Discussion Paper | Atmos. Chem. Phys. Discuss., 13, 20531–20560, 2013 www.atmos-chem-phys-discuss.net/13/20531/2013/ doi:10.5194/acpd-13-20531-2013 © Author(s) 2013. CC Attribution 3.0 License. Atmospheric Chemistry and Physics Open Access Discussions This discussion paper is/has been under review for the journal Atmospheric Chemistry and Physics (ACP). Please refer to the corresponding final paper in ACP if available. Characteristics of regional new particle formation in urban and regional background environments in the North China Plain Z. B. Wang 1,3 , M. Hu 1 , J. Y. Sun 2 , Z. J. Wu 1,3 , D. L. Yue 1 , X. J. Shen 2 , Y. M. Zhang 2 , X. Y. Pei 1,4 , and A. Wiedensohler 3 1 State Key Joint Laboratory of Environmental Simulation and Pollution Control, College of Environmental Sciences and Engineering, Peking University, Beijing 100871, China 2 Key Laboratory for Atmospheric Chemistry, Chinese Academy of Meteorological Sciences, Beijing 100081, China 3 Leibniz Institute for Tropospheric Research, Permoserstr. 15, 04318 Leipzig, Germany 4 Department of Chemistry and Molecular Biology, Atmospheric Science, University of Gothenburg, 41296 Gothenburg, Sweden Received: 16 July 2013 – Accepted: 30 July 2013 – Published: 7 August 2013 Correspondence to: M. Hu ([email protected]) and J. Y. Sun ([email protected]) Published by Copernicus Publications on behalf of the European Geosciences Union. 20531
Transcript of Particle formation in urban and regional background ... · Abstract Introduction Conclusions ... to...

ACPD13, 20531–20560, 2013
Particle formation inurban and regional
backgroundenvironments
Z. B. Wang et al.
Title Page
Abstract Introduction
Conclusions References
Tables Figures
J I
J I
Back Close
Full Screen / Esc
Printer-friendly Version
Interactive Discussion
Discussion
Paper
|D
iscussionP
aper|
Discussion
Paper
|D
iscussionP
aper|
Atmos. Chem. Phys. Discuss., 13, 20531–20560, 2013www.atmos-chem-phys-discuss.net/13/20531/2013/doi:10.5194/acpd-13-20531-2013© Author(s) 2013. CC Attribution 3.0 License.
EGU Journal Logos (RGB)
Advances in Geosciences
Open A
ccess
Natural Hazards and Earth System
Sciences
Open A
ccess
Annales Geophysicae
Open A
ccess
Nonlinear Processes in Geophysics
Open A
ccess
Atmospheric Chemistry
and Physics
Open A
ccess
Atmospheric Chemistry
and Physics
Open A
ccess
Discussions
Atmospheric Measurement
Techniques
Open A
ccess
Atmospheric Measurement
Techniques
Open A
ccess
Discussions
Biogeosciences
Open A
ccess
Open A
ccess
BiogeosciencesDiscussions
Climate of the Past
Open A
ccess
Open A
ccess
Climate of the Past
Discussions
Earth System Dynamics
Open A
ccess
Open A
ccess
Earth System Dynamics
Discussions
GeoscientificInstrumentation
Methods andData Systems
Open A
ccess
GeoscientificInstrumentation
Methods andData Systems
Open A
ccess
Discussions
GeoscientificModel Development
Open A
ccess
Open A
ccess
GeoscientificModel Development
Discussions
Hydrology and Earth System
Sciences
Open A
ccess
Hydrology and Earth System
Sciences
Open A
ccess
Discussions
Ocean Science
Open A
ccess
Open A
ccess
Ocean ScienceDiscussions
Solid Earth
Open A
ccess
Open A
ccess
Solid EarthDiscussions
The Cryosphere
Open A
ccess
Open A
ccess
The CryosphereDiscussions
Natural Hazards and Earth System
Sciences
Open A
ccess
Discussions
This discussion paper is/has been under review for the journal Atmospheric Chemistryand Physics (ACP). Please refer to the corresponding final paper in ACP if available.
Characteristics of regional new particleformation in urban and regionalbackground environments in the NorthChina PlainZ. B. Wang1,3, M. Hu1, J. Y. Sun2, Z. J. Wu1,3, D. L. Yue1, X. J. Shen2, Y. M. Zhang2,X. Y. Pei1,4, and A. Wiedensohler3
1State Key Joint Laboratory of Environmental Simulation and Pollution Control, College ofEnvironmental Sciences and Engineering, Peking University, Beijing 100871, China2Key Laboratory for Atmospheric Chemistry, Chinese Academy of Meteorological Sciences,Beijing 100081, China3Leibniz Institute for Tropospheric Research, Permoserstr. 15, 04318 Leipzig, Germany4Department of Chemistry and Molecular Biology, Atmospheric Science, University ofGothenburg, 41296 Gothenburg, Sweden
Received: 16 July 2013 – Accepted: 30 July 2013 – Published: 7 August 2013
Correspondence to: M. Hu ([email protected]) and J. Y. Sun ([email protected])
Published by Copernicus Publications on behalf of the European Geosciences Union.
20531
ACPD13, 20531–20560, 2013
Particle formation inurban and regional
backgroundenvironments
Z. B. Wang et al.
Title Page
Abstract Introduction
Conclusions References
Tables Figures
J I
J I
Back Close
Full Screen / Esc
Printer-friendly Version
Interactive Discussion
Discussion
Paper
|D
iscussionP
aper|
Discussion
Paper
|D
iscussionP
aper|
Abstract
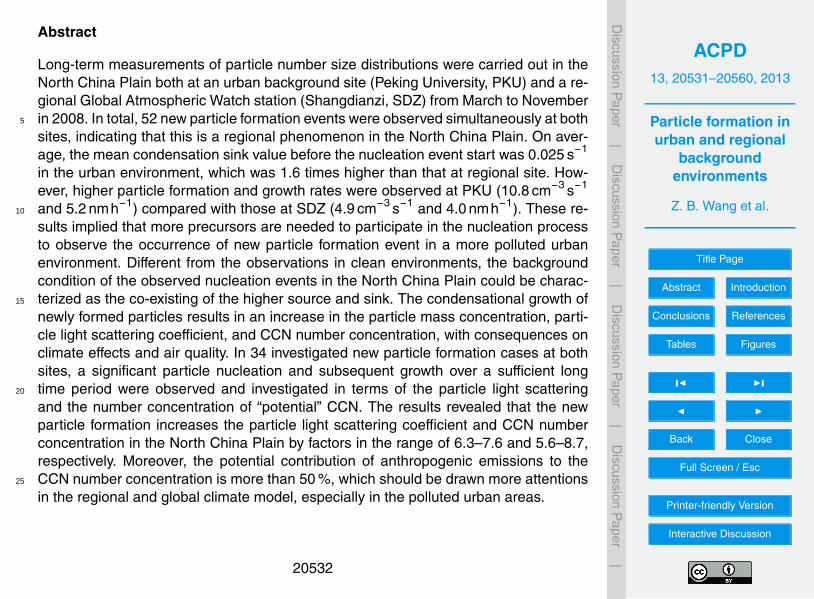
Long-term measurements of particle number size distributions were carried out in theNorth China Plain both at an urban background site (Peking University, PKU) and a re-gional Global Atmospheric Watch station (Shangdianzi, SDZ) from March to Novemberin 2008. In total, 52 new particle formation events were observed simultaneously at both5
sites, indicating that this is a regional phenomenon in the North China Plain. On aver-age, the mean condensation sink value before the nucleation event start was 0.025 s−1
in the urban environment, which was 1.6 times higher than that at regional site. How-ever, higher particle formation and growth rates were observed at PKU (10.8 cm−3 s−1
and 5.2 nmh−1) compared with those at SDZ (4.9 cm−3 s−1 and 4.0 nmh−1). These re-10
sults implied that more precursors are needed to participate in the nucleation processto observe the occurrence of new particle formation event in a more polluted urbanenvironment. Different from the observations in clean environments, the backgroundcondition of the observed nucleation events in the North China Plain could be charac-terized as the co-existing of the higher source and sink. The condensational growth of15
newly formed particles results in an increase in the particle mass concentration, parti-cle light scattering coefficient, and CCN number concentration, with consequences onclimate effects and air quality. In 34 investigated new particle formation cases at bothsites, a significant particle nucleation and subsequent growth over a sufficient longtime period were observed and investigated in terms of the particle light scattering20
and the number concentration of “potential” CCN. The results revealed that the newparticle formation increases the particle light scattering coefficient and CCN numberconcentration in the North China Plain by factors in the range of 6.3–7.6 and 5.6–8.7,respectively. Moreover, the potential contribution of anthropogenic emissions to theCCN number concentration is more than 50 %, which should be drawn more attentions25
in the regional and global climate model, especially in the polluted urban areas.
20532

ACPD13, 20531–20560, 2013
Particle formation inurban and regional
backgroundenvironments
Z. B. Wang et al.
Title Page
Abstract Introduction
Conclusions References
Tables Figures
J I
J I
Back Close
Full Screen / Esc
Printer-friendly Version
Interactive Discussion
Discussion
Paper
|D
iscussionP
aper|
Discussion
Paper
|D
iscussionP
aper|
1 Introduction
Impacts of aerosol particles on the earth-atmosphere system, including the climate,ecosystem, air quality and public health determine its highlight topics in atmosphericenvironmental research (IPCC, 2007). New particle formation (NPF), through the nu-cleation of gas phase species and continuous condensational growth, is an important5
source of aerosol particles in global scale (Yu et al., 2008; Merikanto et al., 2009).These newly formed particles can grow into sizes in which they can act as potentialcloud condensation nuclei (CCN) and in this way influence the regional and globalclimate system indirectly (Lohmann and Feichter, 2005). On the other hand, in envi-ronments such as the North China Plain with a high potential of secondary aerosol10
formation, the particle light scattering coefficient can also be significantly increased asshown in Wiedensohler et al. (2009).
NPF events have been observed in a variety of atmospheric environments includingthe stratosphere (Lee et al., 2003), remote polar area (Park et al., 2004), high alti-tudes mountains (Weber et al., 1997; Venzac et al., 2008), inside boreal forest (Dal15
Maso et al., 2005), coastal environments (O’Dowd et al., 2002), continental rural andsuburban regions (Birmili et al., 2003; Petäjä et al., 2007), as well as urban environ-ments (Stanier et al., 2004; McMurry et al., 2005; Salma et al., 2011) and very pollutedmegacities such as Mexico City (Dunn et al., 2004), New Delhi (Mönkkönen et al.,2005) and Beijing (Wu et al., 2007). Meanwhile, evidences also revealed that ambient20
new particle formation might take place on a larger regional scale (Tunved et al., 2003;Dal Maso et al., 2007; Hussein et al., 2009; Bae et al., 2010; Jung et al., 2013). Kul-mala et al. (2004) summarized the formation and growth properties based on over 100field campaigns. The results showed that the typical particle growth rates in nucleationmode range from 1 to 20 nmh−1 in mid-latitudes; whereas particle formation rates vary25
widely depend on the air mass type of sampling site. However, most of these measure-ments were conducted in Europe and North America or they were limited for a short
20533

ACPD13, 20531–20560, 2013
Particle formation inurban and regional
backgroundenvironments
Z. B. Wang et al.
Title Page
Abstract Introduction
Conclusions References
Tables Figures
J I
J I
Back Close
Full Screen / Esc
Printer-friendly Version
Interactive Discussion
Discussion
Paper
|D
iscussionP
aper|
Discussion
Paper
|D
iscussionP
aper|
time period, the long-term observations, especially carried out in developing countries,were rare.
In China, long-term continuous measurements of particle number size distributionshave been first performed at Beijing urban (Peking University, PKU) since March 2004(Wehner et al., 2004) and at regional background station Shangdianzi (SDZ) since5
March 2008 (Shen et al., 2011). High frequencies of NPF events were observed aroundBeijing region. In addition, the NPF events also had been observed at marine area (Linet al., 2007), high-elevation mountains (Li et al., 2011; Guo et al., 2012), rural sitesof Pearl River Delta (Liu et al., 2008; Wang et al., 2013c), suburban environments inYangtze River Delta region (Gao et al., 2009; Herrmann et al., 2013) and Lanzhou (Gao10
et al., 2011), as well as urban Shanghai (Du et al., 2012). These observations werehowever independent and only based on for a short-term observations, no informationon the long-term measurements of new particle formation events in a regional scalehas been reported yet.
Regional NPF events have been observed in Beijing area based on the simultane-15
ous long-term measurements of particle number size distributions both at PKU andSDZ sites from March to November 2008. In this study, we are aiming to investigatethe relationship of NPF events between polluted urban and regional background en-vironments. This is the first study to characterize regional NPF events in China. Thecharacteristics are compared and the influences of NPF event on the aerosol direct20
(particle light scattering coefficient) and indirect (CCN number concentration) effectsare estimated.
2 Measurements
2.1 Sampling site
The urban sampling site PKU is located in the northwest of Beijing center, outside the25
fourth-ring road. The observatory is set on the sixth roof of an academic building on
20534

ACPD13, 20531–20560, 2013
Particle formation inurban and regional
backgroundenvironments
Z. B. Wang et al.
Title Page
Abstract Introduction
Conclusions References
Tables Figures
J I
J I
Back Close
Full Screen / Esc
Printer-friendly Version
Interactive Discussion
Discussion
Paper
|D
iscussionP
aper|
Discussion
Paper
|D
iscussionP
aper|
the campus of Peking University (39.99◦ N, 116.31◦ E; 50 ma.s.l.). Two major roads withheavy traffics at the east and south of the site are respectively 200 m and 500 m away.PKU site is assumed as representative of the Beijing urban environment. Detailed de-scriptions of the measurement site we refer the reader to Wu et al. (2008).
SDZ site (40.65◦ N, 117.28◦ E, 287 ma.s.l.) is one of the regional stations of the5
Global Atmosphere Watch (GAW) Program in China. This station is located in the northpart of the North China Plain, about 12 km northeast of the PKU site. The samplingsite is situated on the south slope of Yanshan Mountains, in the valley with a northeast-southwest orientation. There are few local anthropogenic pollution sources surround-ing the SDZ, which could reflect the regional background situation for the North China10
Plain. Detailed information on the SDZ site can be found in Shen et al. (2011).
2.2 Instrumentation
Number size distributions of atmospheric particles in the size range 3–900 nm at PKUsite and 3–850 nm at SDZ site were both measured by dual mobility particle size spec-trometer TROPOS-type TDMPS (Twin Differential Mobility Particle Sizer) (Birmili et al.,15
1999). The whole system consists of two parallel Differential Mobility Analyzers (DMAs)and two Condensation Particle Counters (CPCs) (model 3010 and model 3025, TSIInc., St. Paul, MN, USA). The relative humidity (RH) within the whole system was keptbelow 40 % both in the inlet line and in the sheath air cycle to obtain the number sizedistributions of dry particles. In addition, the particle number size distributions were20
corrected for particle losses inside the mobility particle size spectrometers and in thesampling configuration, following the method of the “equivalent length” as described inWiedensohler et al. (2012).
20535

ACPD13, 20531–20560, 2013
Particle formation inurban and regional
backgroundenvironments
Z. B. Wang et al.
Title Page
Abstract Introduction
Conclusions References
Tables Figures
J I
J I
Back Close
Full Screen / Esc
Printer-friendly Version
Interactive Discussion
Discussion
Paper
|D
iscussionP
aper|
Discussion
Paper
|D
iscussionP
aper|
2.3 Data analysis
2.3.1 Classification scheme
The event classification criterion is based on the method described by Dal Masoet al. (2005). However, the nucleation events are only divided into two groups in thisstudy. The criterion for discerning an intensive nucleation event day (Class I) is the burst5
of new particles in the nucleation mode size range (3–25 nm) and the burst should lastseveral hours with a clear growth pattern. On some days, the formation of new particleswas observed without subsequent growth. These cases are more like the sudden burstof freshly nucleated particles, which are grouped into Class II. Besides these two kindsof NPF events, the sporadic occurrence of newly formed particles in the nucleation10
mode size range was also seen, however, the situation is not fulfill the criteria for theevent days. These days are represented as “undefined”.
2.3.2 Particle formation rate (FR) and growth rate (GR)
The lowest detecting particle size measured by the mobility particle size spectrometeris 3 nm. Hence, apparent formation rate (J3) can be expressed as:15
J3 = dNnuc/dt +Fcoag +Fgrowth (1)
Here, Nnuc is the number concentration of nucleation mode particles. Fcoag and Fgrowthrepresent the loss of particles due to coagulation and the flux of particles out of thespecified size range, respectively. The second term in Eq. (1) can be calculated ac-cording to:20
Fcoag = CoagSnucNnuc (2)
in which CoagSnuc is the coagulation sink of nucleation mode particles. In this study, weconsider the reference size for the coagulation sink to be the geometric mean diameter
20536

ACPD13, 20531–20560, 2013
Particle formation inurban and regional
backgroundenvironments
Z. B. Wang et al.
Title Page
Abstract Introduction
Conclusions References
Tables Figures
J I
J I
Back Close
Full Screen / Esc
Printer-friendly Version
Interactive Discussion
Discussion
Paper
|D
iscussionP
aper|
Discussion
Paper
|D
iscussionP
aper|
of nucleation mode (8 nm). CoagSnuc is defined as:
CoagS(Dp) =∫
K (D′p,Dp)n(D′
p)dD′p (3)
Here, K (D′p,Dp) is the coagulation coefficient of particles with diameters Dp and D′
p ac-cording to Fuchs (1964). The newly formed particles rarely grow beyond 25 nm beforeformation ended, and the last term can be neglected.5
The observed particle growth rate is calculated based on the “log-normal distribu-tion function method” described by Kulmala et al. (2012). Typical particle number sizedistributions are fitted by a least-square log-normal fitting method yielding parametersof 2–3 log-normal modes. Thus, the temporal variation of mean geometric diameterscould be obtained and the particle growth rate can be estimated (GR = dDp/dt , given10
in nmh−1).Moreover, we should keep in mind that the determinations of start and end times
of nucleation events in Class II type are difficult, which might cause huge uncertaintywhen calculating the particle formation and growth rates. Therefore, in this study weonly focus on the nucleation event in Class I type, which shows the clear nucleation15
and growth diurnal patterns.
2.3.3 Condensation sink (CS), condensable vapor concentration (C) and sourcerate (Q)
The condensation sink, describing how rapidly vapor molecules can condense onto theparticles, is used to represent the pre-existing particles concentration (Kulmala et al.,20
2001). Its value could be calculated using Eq. (4):
CS = 2πD∑
βDpN (4)
Here, D is the diffusion coefficient of the condensing vapor, β is the transitional regimecorrection factor, Dp is the particle diameter and N is the corresponding particle num-ber concentration. However, it has to be noted that in this study, the CS values are25
20537

ACPD13, 20531–20560, 2013
Particle formation inurban and regional
backgroundenvironments
Z. B. Wang et al.
Title Page
Abstract Introduction
Conclusions References
Tables Figures
J I
J I
Back Close
Full Screen / Esc
Printer-friendly Version
Interactive Discussion
Discussion
Paper
|D
iscussionP
aper|
Discussion
Paper
|D
iscussionP
aper|
achieved based on the dry particle number size distributions, which could not neces-sarily represent ambient wet condition well, especially during the humid summertime.Hence, the presented CS values might be underestimated compared with real ones.The uncertainty caused by the typical effect of hygroscopic growth on CS is between 5and 50 % as shown in previous research (Kulmala et al., 2001).5
The condensable vapor concentration C and its source rate Q could be achievedbased on the growth rate and the condensation sink (Kulmala et al., 2001). The growthrate depends on the amounts of condensable vapors in the atmosphere. Hence, thevapor concentration could be obtained by:
C = CGR=1 nm h−1 ×GR (5)10
Here, CGR=1 nm h−1 is the vapor concentration required for growth rate of 1 nmh−1, recentstudy (Nieminen et al., 2010) gave Eq. (6) to get its value:
CGR=1 nm h−1 =2ρvdv
γmv∆t·√
πmv
8kT·[
2x1 +1
x1 (x1 +1)−
2x0 +1
x0 (x0 +1)+2ln
(x1 (x0 +1)
x0 (x1 +1)
)](6)
Here we assume the properties of the condensable vapors are similar to gaseous sulfu-ric acid, which is proved to be the key component in nucleation process (Berndt et al.,15
2005; Sipila et al., 2010; Chen et al., 2012). The mass (mv) and density (ρv) of hy-drated sulfuric acid vapor molecule utilized in this study are 135 amu and 1650 kgm−3,respectively (Wang et al., 2013b).
With a pseudo steady state assumption, the vapor source rate can be estimated as
Q = CS ·C (7)20
Where Q is the condensable vapor source rate in unit cm−3 s−1.
20538

ACPD13, 20531–20560, 2013
Particle formation inurban and regional
backgroundenvironments
Z. B. Wang et al.
Title Page
Abstract Introduction
Conclusions References
Tables Figures
J I
J I
Back Close
Full Screen / Esc
Printer-friendly Version
Interactive Discussion
Discussion
Paper
|D
iscussionP
aper|
Discussion
Paper
|D
iscussionP
aper|
3 Results and discussions
3.1 Occurrence of new particle formation event
The investigation time period is from March to November 2008, during which the simul-taneous measurements of particle number size distributions were performed at bothsites. The numbers of days with valid data were 253 at PKU and 223 at SDZ, re-5
spectively, accounting for 92 % and 81 % to the total 275 investigated days (Table 1).The remaining days were either completely missing or have poor data quality. The fre-quencies of NPF event were 38 % and 39 % in classified days at urban and regionalsites, respectively. These frequencies are similar with that observed in Beijing betweenMarch 2004 and February 2005 (Wu et al., 2007). One third of nucleation events at10
PKU were the Class II type, which was higher than that at SDZ (21 %). This mightdue to the influences of local emissions at urban site. In total, 52 NPF events wereobserved simultaneously at both places based on 207 valid days with simultaneousmeasurements, suggesting the new particle formation is a regional phenomenon overthe North China Plain.15
The similar “U-shape” seasonal variation patterns of NPF event occurrence were ob-served at both sites, as shown in Fig. 1. The number of events was highest in springmonth (March–May), with 43 cases, occurring at both PKU and SDZ, respectively, ac-counting for 45 % and 49 % in total number of observed NPF events. More events wereobserved in spring may due to a higher frequency of strong wind from northern China,20
which favors to remove the pre-existing particles in the atmosphere and further lead tothe occurrances of NPF event (Wu et al., 2008). During the summertime, high tempera-tures and RHs are not propitious for NPF events. In addition, slowly moving air massesfrom southern, which dominate in the summertime, always contains more accumula-tion mode particles, resulting in pollution episodes (Wehner et al., 2008; Wang et al.,25
2013a). Hence, few events (22 at PKU and 10 at SDZ) were observed during this timeperiod. More NPF events were observed in autumn at SDZ (43 cases) compared withthat at PKU (31 cases), especially in October and November. This is because that the
20539

ACPD13, 20531–20560, 2013
Particle formation inurban and regional
backgroundenvironments
Z. B. Wang et al.
Title Page
Abstract Introduction
Conclusions References
Tables Figures
J I
J I
Back Close
Full Screen / Esc
Printer-friendly Version
Interactive Discussion
Discussion
Paper
|D
iscussionP
aper|
Discussion
Paper
|D
iscussionP
aper|
heavy pollution episodes always take place in the urban Beijing in this season. Duringthe episode, the local meteorological condition (high temperature, moderate RH andcalm wind) leads to very poor dispersion of pollutants and results in the local emissionsare trapped in the urban atmosphere (Wu et al., 2008). On the contrary, the pre-existingparticles are less at SDZ site, which favors to produce more events happening.5
3.2 Nucleation event characterization
Individual and mean formation rates of aerosol particles with a diameter of 3 nm areshown in Fig. 2a. They varied between 2.2 cm−3 s−1 and 34.5 cm−3 s−1 at PKU as wellas 0.4–24.5 cm−3 s−1 at SDZ. In addition, the mean value was 10.8 cm−3 s−1 at PKU,which was factor two higher than that at SDZ (4.9 cm−3 s−1). The formation rates at10
both sites were significantly higher than the observations in clean environments suchas 0.8 cm−3 s−1 in Hyytiälä (Dal Maso et al., 2005) and 1 cm−3 s−1 in Hohenpeissenberg(Birmili et al., 2003). However, the values at PKU are also much higher than observed atother urban sites such as Helsinki, 2.4 cm−3 s−1 (Hussein et al., 2008) and Budapest,4.2 cm−3 s−1 (Salma et al., 2011), as well as in similar magnitude with study in New15
Delhi, 3.3–13.9 cm−3 s−1 (Mönkkönen et al., 2005) and St. Louis, 17 ± 20 cm−3 s−1
(Qian et al., 2007). The highest formation rates were shown at both sites in spring(Fig. 2b), which can be explained by the favoring meteorological conditions such aslow temperature and humidity as well as strong north wind, bringing the clean air massin this season. The growth rates ranged from 2.5 nmh−1 to 15.3 nmh−1 with a mean20
and standard deviation of 5.2±2.2 nmh−1 at PKU site, which was slightly higher thanthe values at SDZ (1.0–9.7 nmh−1, 4.0±1.7 nmh−1). They essentially fit into the rangeof typical particle growth rate 1–20 nmh−1 (Kulmala et al., 2004). In contrary to the par-ticle formation rate, the highest growth rate is observed in summertime during whichthe enhancement of photochemical and biological activities together with the stagnant25
air masses preventing exchange with cleaner air contributed to the particle growth. Thisis consistent with a previous study (Wu et al., 2007).
20540

ACPD13, 20531–20560, 2013
Particle formation inurban and regional
backgroundenvironments
Z. B. Wang et al.
Title Page
Abstract Introduction
Conclusions References
Tables Figures
J I
J I
Back Close
Full Screen / Esc
Printer-friendly Version
Interactive Discussion
Discussion
Paper
|D
iscussionP
aper|
Discussion
Paper
|D
iscussionP
aper|
More pre-existing aerosol particles (presented as CS in this study) were found aturban environment (see Fig. 3). The mean CS values on NPF event days were 0.027±0.021 s−1 at PKU and 0.020±0.020 s−1 at SDZ, respectively, which were much lowerthan those on none-event days (0.047±0.024 s−1 and 0.026±0.018 s−1). During NPFevent days, the CS values were 5–10 times higher than that in European cities such as5
Marseille (0.003–0.015 s−1), Athens (0.006–0.013 s−1) and Helsinki (0.006 s−1), whilethe highest value was comparable with polluted areas like New Delhi (0.050–0.070 s−1)(Kulmala et al., 2005; Hussein et al., 2008). It is remarkable that the mean CS valuebefore the nucleation events start (08:00–11:00 LT) at PKU site was 0.025 s−1, whichwas close to the observations at SDZ during none-event days (0.024 s−1). This result10
implied that more precursors are needed for particle nucleation process to observe theoccurrence of new particle formation event at polluted urban environment.
Table 2 lists the statistical results of condensation sink, condensable vapor con-centration and its source rate. The seasonal variations of vapor concentration and itssource rate showed that the highest values during summer months. This result is con-15
sistent with the previous study by Wu et al. (2007). The vapor concentration at PKU(9.3×107 cm−3) was 1.3 times higher than that at SDZ (7.1×107 cm−3) during thewhole measurement period. This is easy to understand that more vapors should be in-volved in the particle nucleation and growth processes to preventing the newly formedparticles captured by higher pre-existing particles in a polluted urban environment. As20
a result, the source rate of condensable vapor was on average 1.8 times higher atBeijing urban compared to the SDZ site. Overall, unlike the observations in clean envi-ronments, the background condition of NPF events in the North China Plain could becharacterized as the higher source (vapor concentration) and higher sink (pre-existingparticles), even in the background regional station. Hence, the nucleation mechanisms25
in this background situation need to be concerned in further research.
20541

ACPD13, 20531–20560, 2013
Particle formation inurban and regional
backgroundenvironments
Z. B. Wang et al.
Title Page
Abstract Introduction
Conclusions References
Tables Figures
J I
J I
Back Close
Full Screen / Esc
Printer-friendly Version
Interactive Discussion
Discussion
Paper
|D
iscussionP
aper|
Discussion
Paper
|D
iscussionP
aper|
3.3 Influences on the light scattering and CCN production
Aerosol particles formed by homogeneous nucleation can grow to larger sizes in whichthey could affect the global radiation budget by light scattering directly (Stier et al.,2007). Furthermore, most field observations (Kuwata et al., 2008; Kuang et al., 2009;Wiedensohler et al., 2009) pointed out that a large fraction of these particles may act as5
CCN in the atmosphere and influence the regional or global climate system indirectly(Lohmann and Feichter, 2005). Due to the lack of direct measurements of particle lightscattering coefficients (σsp), its values were reconstructed based on the measured dryparticle number size distributions utilizing a Mie model (Bohren and Huffman, 1998).The refractive index used in the code was 1.55–0.55i, which was derived from the ambi-10
ent measurement at a rural site (Yufa) around Beijing (Cheng et al., 2009). Meanwhile,quantitative determination of CCN number concentration is not possible without directmeasurements or detailed information on the volume fractions of chemical composi-tions. Since such data are not available during the investigated period, we have to relyon some surrogate measures for the CCN number concentration. The idea to estimate15
the production of potential CCN is based on the assumption that particles larger thana certain diameter could be activated to form CCN (Lihavainen et al., 2003; Laakso-nen et al., 2005; Kerminen et al., 2012). Three quantities, CCN45, CCN90 and CCN200,namely the number concentrations of particles larger than 45 nm, 90 nm and 200 nm indry diameter, respectively, are selected to represent the “potential” CCN number con-20
centrations. This selection can be considered justified, because the field observationsduring the HaChi (Haze in China) summer campaign in the North China Plain (Wuqingsite) showed the activation diameters at super saturations of 0.058 %, 0.085 %, 0.18 %,0.36 % and 0.72 % are 200 nm, 170 nm, 90 nm, 70 nm and 45 nm, respectively (Denget al., 2011). To investigate the influences of NPF event to the aerosol direct and indirect25
effects, here we first determined time t1 and t2 when these parameters (σsp, CCN45,CCN90 and CCN200) reached the minimum and maximum during the timeframe for thedetermination of particle growth rate, respectively. The increase is then denoted from
20542

ACPD13, 20531–20560, 2013
Particle formation inurban and regional
backgroundenvironments
Z. B. Wang et al.
Title Page
Abstract Introduction
Conclusions References
Tables Figures
J I
J I
Back Close
Full Screen / Esc
Printer-friendly Version
Interactive Discussion
Discussion
Paper
|D
iscussionP
aper|
Discussion
Paper
|D
iscussionP
aper|
the differences between their minimum and maximum, which are calculated by aver-aging over t1 ±0.5 h and t2 ±0.5 h to decrease the uncertainties. Even these estimatedvalues could not represent the real condition, we could see the influences of new par-ticle formation on optical properties and potential CCN productions.
In addition, it also should be clarified that this method might produce several poten-5
tial misunderstanding on estimating the contributions of NPF event to the particle lightscattering coefficient and CCN number concentration in the polluted urban environ-ment. This is because that the intensive primary emissions by anthropogenic activityat urban environment can emit both the precursors and aerosol particles into the am-bient atmosphere. On one hand, these precursors could be involved in the nucleation10
process and further enhance the production of newly formed particles. On the otherhand, the emitted particles are in a wide particle size range, which might directly in-fluence the particle light scattering coefficient or act as potential CCN. Nevertheless,these effects could be neglected at a regional background site such as SDZ. Hence,in this section, we only pay attention to the regional NPF events observed concurrently15
at both sites (total 34 events in Class I type). Moreover, considering that the particlelight scattering coefficient might be affected by the other parameters such as particlechemical compositions and mixing state, which are totally different between urban andregional sites, hence the differences in diverse environments will not be discussed fur-ther in this study. The potential contributions of regional NPF event to production of20
CCN are firstly calculated for the regional and urban sites, and the gap is estimated asmainly contributed by the anthropogenic emissions at polluted urban environment.
Figure 4 showed an example that simultaneous NPF events observed both at PKUand SDZ on 26 September 2008. New particles were nucleated around 09:00 LT in themorning followed by a significant growth to larger particles (∼ 80 nm) indicated by the25
“banana-shaped” temporal development of the particle number size distribution (Fig. 4aand b). The particle number concentrations of the nucleation mode (N3–25) and of allparticles (N3–900) were shown in Fig. 4c and d. At PKU site, the maximum of N3–25
and N3–900 were 52 300 cm−3 and 60 300 cm−3, respectively. In contrary, the fraction
20543

ACPD13, 20531–20560, 2013
Particle formation inurban and regional
backgroundenvironments
Z. B. Wang et al.
Title Page
Abstract Introduction
Conclusions References
Tables Figures
J I
J I
Back Close
Full Screen / Esc
Printer-friendly Version
Interactive Discussion
Discussion
Paper
|D
iscussionP
aper|
Discussion
Paper
|D
iscussionP
aper|
of N3–25 in N3–900 could up to 93 % at the beginning of the nucleation event and thepeak values were shown at the same time at SDZ. The mean condensation sink beforenucleation events start (08:00–11:00 LT) was 0.007 s−1 at PKU, which was almost oneorder of magnitude higher than that at SDZ (0.001 s−1). However, the particle formationand growth rates were 9.8 cm−3 s−1 and 4.5 nmh−1 at PKU, as well as 4.3 cm−3 s−1 and5
3.7 nmh−1 at SDZ, respectively, indicating more condensable vapor should contributeto the particle nucleation and growth processes in polluted urban environment.
The estimated particle scattering coefficients (550 nm) and mass concentrations arepresented in Fig. 4e and f. The mass concentration was calculated using measuredparticle number size distribution with assumed density of 1.7 gcm−3. Obviously, strong10
correlations (R2 = 0.99) were observed between particle scattering coefficients andparticle mass concentrations at both sites. At PKU site, the particle light scattering coef-ficients and mass concentrations showed a significant increase from 15:00 to 23:00 LT,with the average growth rates 13.9 Mm−1 h−1 and 4.5 µgm−3 h−1, respectively. On thecontrary, these two parameters exhibited a continuing elevation until to midnight at15
SDZ. The growth rates were 7.8 Mm−1 h−1 and 1.7 µgm−3 h−1, respectively. The anal-ysis above indicated that the subsequent growth of nucleated particles resulted in anincrease in particle light scattering coefficient and mass concentration, through whichaffected the climate and air quality.
The variations of CCN number concentrations were displayed in Fig. 4g and h.20
CCN45 showed a simultaneous increase with the nucleation mode particles at bothsites, however, the enhancements in CCN90 and CCN200 were several hours later. Thelowest CCN45, CCN90 and CCN200 were 2200 cm−3, 700 cm−3 and 160 cm−3 duringthe event, respectively, and gradually raised to the maximum values of 15 600 cm−3,5600 cm−3 and 900 cm−3 for PKU at midnight. The enhancement factors were 7.0,25
7.8 and 5.5, respectively. Contrary to this, these three quantities increased by factorsof 24.3, 13.6 and 10.5 at SDZ. The higher CCN enhancement factors at SDZ mightdue to the lower pre-existing particles at the initial time. However, in absolute term,the increasing CCN45, CCN90 and CCN200 were 4900 cm−3, 2600 cm−3 and 370 cm−3
20544

ACPD13, 20531–20560, 2013
Particle formation inurban and regional
backgroundenvironments
Z. B. Wang et al.
Title Page
Abstract Introduction
Conclusions References
Tables Figures
J I
J I
Back Close
Full Screen / Esc
Printer-friendly Version
Interactive Discussion
Discussion
Paper
|D
iscussionP
aper|
Discussion
Paper
|D
iscussionP
aper|
higher at urban site compared with regional site, respectively, suggesting that the po-tential contributions of anthropogenic emissions to CCN number concentrations were37 %, 54 % and 50 % in this case.
On average, the regional new particle formation resulted in the enhancement of par-ticle light scattering coefficient with 200±25 Mm−1 at PKU and 100±90 Mm−1 at SDZ,5
respectively, with factors of 6.3±3.8 and 7.6±6.6. The higher increment at urban en-vironment might be attributed to the anthropogenic emission and more complex atmo-sphere. Meanwhile, we observed CCN45, CCN90 and CCN200 increase by factors of5.6, 6.0 and 5.6 at PKU, respectively, and 8.7, 7.0 and 6.5 at SDZ (see Table 3). Thisresult indicated very clearly that atmospheric new particle formation is an extremely10
important source of new “potential” CCN over the North China Plain. Moreover, thepotential contribution by the anthropogenic emissions to CCN number concentrationshould be concerned at the urban site, with average fraction in the range of 59–63 %.
4 Conclusions
To investigate the characters of regional new particle formation events in the North15
China Plain, simultaneously measurements of particle number size distributions hadbeen carried out at urban site PKU and regional site SDZ from March to November in2008. Both station have been equipped with a dual mobility particle size spectrometer,type TROPOS-TDMPS.
In total, the frequencies of nucleation event were 38 % and 39 % at urban and re-20
gional background sites, respectively, with 52 regional NPF events at both places dur-ing the whole measurement period. The seasonal variations of NPF event occurrencewere similar at both sites, with more events in spring and lowest number in the sum-mertime.
Apparent particle formation rates were in the range of 2.2–34.5 cm−3 s−1 at PKU,25
which was higher than that at SDZ site (0.4–24.5 cm−3 s−1). The mean growth rateswere 5.2 nmh−1 and 4.0 nmh−1 at PKU and SDZ, respectively. Before the nucleation
20545

ACPD13, 20531–20560, 2013
Particle formation inurban and regional
backgroundenvironments
Z. B. Wang et al.
Title Page
Abstract Introduction
Conclusions References
Tables Figures
J I
J I
Back Close
Full Screen / Esc
Printer-friendly Version
Interactive Discussion
Discussion
Paper
|D
iscussionP
aper|
Discussion
Paper
|D
iscussionP
aper|
event starts (08:00–11:00 LT), more pre-existing particles were observed at pollutedurban environment than that at the regional site. The mean values of condensationsink were 0.025 s−1 at PKU and 0.016 s−1 at SDZ, respectively, which were both sig-nificantly higher than the measurements in European cities. Overall, the backgroundcondition of NPF event in the North China Plain could be characterized as the higher5
precursor vapor concentration and pre-existing particles, even in the regional back-ground environment.
The condensational growth of nucleated particles results in an increase in the par-ticle mass concentration, scattering coefficient and CCN production. The increase ofthe particle light scattering coefficient resulting from the new particle formation event10
is a factor in the range of 6.3–7.6 in the North China Plain. Three quantities, CCN45,CCN90 and CCN200, were selected to estimate the “potential” CCN number concen-trations. On the average of 34 selected cases with significant growth pattern, CCN45,CCN90 and CCN200 number concentrations are enhanced increase by factors of 5.6,6.0 and 5.6 at PKU, respectively, and 8.7, 7.0 and 6.5 at SDZ. In addition, the anthro-15
pogenic emissions may contribute more than half (59–63 %) of the CCN productionsat the polluted urban environment, which should be paid more attention in the regionaland global climate model. Meanwhile, the simultaneously measurements of particlenumber size distributions, direct CCN number concentrations as well as the chemicalcomponents of fine particles are needed in the further studies.20
Acknowledgements. This work was supported by the National Natural Science Foundation ofChina (21025728, 21190052 and 41175113), the National Basic Research Program (973) ofChina (2011CB403401 and 2013CB228503), the China Ministry of Environmental Protection’sSpecial Funds for Scientific Research on Public Welfare (201009002) and European Integratedproject on Aerosol Cloud Climate and Air Quality Interactions, EUCAARI (036833).25
20546

ACPD13, 20531–20560, 2013
Particle formation inurban and regional
backgroundenvironments
Z. B. Wang et al.
Title Page
Abstract Introduction
Conclusions References
Tables Figures
J I
J I
Back Close
Full Screen / Esc
Printer-friendly Version
Interactive Discussion
Discussion
Paper
|D
iscussionP
aper|
Discussion
Paper
|D
iscussionP
aper|
References
Bae, M.-S., Schwab, J. J., Hogrefe, O., Frank, B. P., Lala, G. G., and Demerjian, K. L.: Charac-teristics of size distributions at urban and rural locations in New York, Atmos. Chem. Phys.,10, 4521–4535, doi:10.5194/acp-10-4521-2010, 2010.
Berndt, T., Böge, O., Stratmann, F., Heintzenberg, J., and Kulmala, M.: Rapid forma-5
tion of sulfuric acid particles at near-atmospheric conditions, Science, 307, 698–700,doi:10.1126/science.1104054, 2005.
Birmili, W., Stratmann, F., and Wiedensohler, A.: Design of a DMA-based size spectrom-eter for a large particle size range and stable operation, J. Aerosol Sci., 30, 549–553,doi:10.1016/S0021-8502(98)00047-0, 1999.10
Birmili, W., Berresheim, H., Plass-Dülmer, C., Elste, T., Gilge, S., Wiedensohler, A., andUhrner, U.: The Hohenpeissenberg aerosol formation experiment (HAFEX): a long-termstudy including size-resolved aerosol, H2SO4, OH, and monoterpenes measurements, At-mos. Chem. Phys., 3, 361–376, doi:10.5194/acp-3-361-2003, 2003.
Bohren, C. F. and Huffman, D. R.: Absorption and Scattering of Light by Small Particles, John15
Wiley and Sons, Wiley-Intersci., New York, 544 pp., 1998.Chen, M., Titcombe, M., Jiang, J., Jen, C., Kuang, C., Fischer, M. L., Eisele, F. L., Siep-
mann, J. I., Hanson, D. R., Zhao, J., and McMurry, P. H.: Acid–base chemical reaction modelfor nucleation rates in the polluted atmospheric boundary layer, P. Natl. Acad. Sci. USA, 109,18713–18718, doi:10.1073/pnas.1210285109, 2012.20
Cheng, Y. F., Berghof, M., Garland, R. M., Wiedensohler, A., Wehner, B., Muller, T., Su, H.,Zhang, Y. H., Achtert, P., Nowak, A., Poschl, U., Zhu, T., Hu, M., and Zeng, L. M.: Influenceof soot mixing state on aerosol light absorption and single scattering albedo during air massaging at a polluted regional site in northeastern China, J. Geophys. Res., 114, D00G10,doi:10.1029/2008jd010883, 2009.25
Dal Maso, M., Kulmala, M., Riipinen, I., Wagner, R., Hussein, T., Aalto, P. P., and Lehti-nen, K. E. J.: Formation and growth of fresh atmospheric aerosols: eight years of aerosolsize distribution data from SMEAR II, Hyytiala, Finland, Boreal Environ. Res., 10, 323–336,2005.
Dal Maso, M., Sogacheva, L., Aalto, P. P., Riipinen, I., Komppula, M., Tunved, P., Korhonen, L.,30
Suur-Uski, V., Hirsikko, A., KurtÉN, T., Kerminen, V.-M., Lihavainen, H., Viisanen, Y., Hans-son, H.-C., and Kulmala, M.: Aerosol size distribution measurements at four Nordic field sta-
20547

ACPD13, 20531–20560, 2013
Particle formation inurban and regional
backgroundenvironments
Z. B. Wang et al.
Title Page
Abstract Introduction
Conclusions References
Tables Figures
J I
J I
Back Close
Full Screen / Esc
Printer-friendly Version
Interactive Discussion
Discussion
Paper
|D
iscussionP
aper|
Discussion
Paper
|D
iscussionP
aper|
tions: identification, analysis and trajectory analysis of new particle formation bursts, TellusB, 59, 350–361, doi:10.1111/j.1600-0889.2007.00267.x, 2007.
Deng, Z. Z., Zhao, C. S., Ma, N., Liu, P. F., Ran, L., Xu, W. Y., Chen, J., Liang, Z., Liang, S.,Huang, M. Y., Ma, X. C., Zhang, Q., Quan, J. N., Yan, P., Henning, S., Mildenberger, K.,Sommerhage, E., Schäfer, M., Stratmann, F., and Wiedensohler, A.: Size-resolved and bulk5
activation properties of aerosols in the North China Plain, Atmos. Chem. Phys., 11, 3835–3846, doi:10.5194/acp-11-3835-2011, 2011.
Du, J., Cheng, T., Zhang, M., Chen, J., He, Q., Wang, X., Zhang, R., Tao, J., Huang, G., Li, X.,and Zha, S.: Aerosol size spectra and particle formation events at urban Shanghai in EasternChina, Aerosol Air Qual. Res., 12, 1362–1372, doi:10.4209/aaqr.2011.12.0230, 2012.10
Dunn, M. J., Jimenez, J. L., Baumgardner, D., Castro, T., McMurry, P. H., and Smith, J. N.:Measurements of Mexico City nanoparticle size distributions: observations of new particleformation and growth, Geophys. Res. Lett., 31, L10102, doi:10.1029/2004gl019483, 2004.
Fuchs, N. A.: The Mechanics of Aerosols, American Institute of Physics, Dover, NY, 1964.Gao, J., Wang, T., Zhou, X., Wu, W., and Wang, W.: Measurement of aerosol number size distri-15
butions in the Yangtze River delta in China: formation and growth of particles under pollutedconditions, Atmos. Environ., 43, 829–836, doi:10.1016/j.atmosenv.2008.10.046, 2009.
Gao, J., Chai, F., Wang, T., and Wang, W.: Particle number size distribution andnew particle formation (NPF) in Lanzhou, Western China, Particuology, 9, 611–618,doi:10.1016/j.partic.2011.06.008, 2011.20
Guo, H., Wang, D. W., Cheung, K., Ling, Z. H., Chan, C. K., and Yao, X. H.: Observation ofaerosol size distribution and new particle formation at a mountain site in subtropical HongKong, Atmos. Chem. Phys., 12, 9923–9939, doi:10.5194/acp-12-9923-2012, 2012.
Herrmann, E., Ding, A. J., Petäjä, T., Yang, X. Q., Sun, J. N., Qi, X. M., Manninen, H., Hakala, J.,Nieminen, T., Aalto, P. P., Kerminen, V.-M., Kulmala, M., and Fu, C. B.: New particle formation25
in the western Yangtze River Delta: first data from SORPES-station, Atmos. Chem. Phys.Discuss., 13, 1455–1488, doi:10.5194/acpd-13-1455-2013, 2013.
Hussein, T., Martikainen, J., Junninen, H., Sogacheva, L., Wagner, R., Dal Maso, M., Riip-inen, I., Aalto, P. P., and Kulmala, M.: Observation of regional new particle formation in theurban atmosphere, Tellus B, 60, 509–521, doi:10.1111/j.1600-0889.2008.00365.x, 2008.30
Hussein, T., Junninen, H., Tunved, P., Kristensson, A., Dal Maso, M., Riipinen, I., Aalto, P. P.,Hansson, H.-C., Swietlicki, E., and Kulmala, M.: Time span and spatial scale of regional new
20548

ACPD13, 20531–20560, 2013
Particle formation inurban and regional
backgroundenvironments
Z. B. Wang et al.
Title Page
Abstract Introduction
Conclusions References
Tables Figures
J I
J I
Back Close
Full Screen / Esc
Printer-friendly Version
Interactive Discussion
Discussion
Paper
|D
iscussionP
aper|
Discussion
Paper
|D
iscussionP
aper|
particle formation events over Finland and Southern Sweden, Atmos. Chem. Phys., 9, 4699–4716, doi:10.5194/acp-9-4699-2009, 2009.
IPCC: Intergovernmental Panel on Climate Change. Report, Cambridge University Press, Cam-bridge, UK, 2007.
Jung, J., Miyazaki, Y., and Kawamura, K.: Different characteristics of new particle formation5
between urban and deciduous forest sites in Northern Japan during the summers of 2010–2011, Atmos. Chem. Phys., 13, 51–68, doi:10.5194/acp-13-51-2013, 2013.
Kerminen, V.-M., Paramonov, M., Anttila, T., Riipinen, I., Fountoukis, C., Korhonen, H., Asmi, E.,Laakso, L., Lihavainen, H., Swietlicki, E., Svenningsson, B., Asmi, A., Pandis, S. N., Kul-mala, M., and Petäjä, T.: Cloud condensation nuclei production associated with atmospheric10
nucleation: a synthesis based on existing literature and new results, Atmos. Chem. Phys.,12, 12037–12059, doi:10.5194/acp-12-12037-2012, 2012.
Kuang, C., McMurry, P. H., and McCormick, A. V.: Determination of cloud condensation nucleiproduction from measured new particle formation events, Geophys. Res. Lett., 36, L09822,doi:10.1029/2009gl037584, 2009.15
Kulmala, M., Maso, M. D., Mäkelä, J. M., Pirjola, L., Väkevä, M., Aalto, P., Miikkulainen, P.,Hämeri, K., and O’Dowd, C. D.: On the formation, growth and composition of nucleationmode particles, Tellus B, 53, 479–490, 2001.
Kulmala, M., Vehkamäki, H., Petäjä, T., Dal Maso, M., Lauri, A., Kerminen, V.-M., Birmili, W.,and McMurry, P. H.: Formation and growth rates of ultrafine atmospheric particles: a review20
of observations, J. Aerosol Sci., 35, 143–176, doi:10.1016/j.jaerosci.2003.10.003, 2004.Kulmala, M., Petäjä, T., Mönkkönen, P., Koponen, I. K., Dal Maso, M., Aalto, P. P., Lehti-
nen, K. E. J., and Kerminen, V.-M.: On the growth of nucleation mode particles: source ratesof condensable vapor in polluted and clean environments, Atmos. Chem. Phys., 5, 409–416,doi:10.5194/acp-5-409-2005, 2005.25
Kulmala, M., Petäjä, T., Nieminen, T., Sipilä, M., Manninen, H. E., Lehtipalo, K., Dal Maso,M., Aalto, P. P., Junninen, H., Paasonen, P., Riipinen, I., Lehtinen, K. E. J., Laaksonen, A.,and Kerminen, V.-M.: Measurement of the nucleation of atmospheric aerosol particles, Nat.Protocols, 7, 1651–1667, doi:10.1038/nprot.2012.091, 2012.
Kuwata, M., Kondo, Y., Miyazaki, Y., Komazaki, Y., Kim, J. H., Yum, S. S., Tanimoto, H., and30
Matsueda, H.: Cloud condensation nuclei activity at Jeju Island, Korea in spring 2005, Atmos.Chem. Phys., 8, 2933–2948, doi:10.5194/acp-8-2933-2008, 2008.
20549

ACPD13, 20531–20560, 2013
Particle formation inurban and regional
backgroundenvironments
Z. B. Wang et al.
Title Page
Abstract Introduction
Conclusions References
Tables Figures
J I
J I
Back Close
Full Screen / Esc
Printer-friendly Version
Interactive Discussion
Discussion
Paper
|D
iscussionP
aper|
Discussion
Paper
|D
iscussionP
aper|
Laaksonen, A., Hamed, A., Joutsensaari, J., Hiltunen, L., Cavalli, F., Junkermann, W.,Asmi, A., Fuzzi, S., and Facchini, M. C.: Cloud condensation nucleus productionfrom nucleation events at a highly polluted region, Geophys. Res. Lett., 32, L06812,doi:10.1029/2004gl022092, 2005.
Lee, S. H., Reeves, J. M., Wilson, J. C., Hunton, D. E., Viggiano, A. A., Miller, T. M., Ballen-5
thin, J. O., and Lait, L. R.: Particle formation by ion nucleation in the upper troposphere andlower stratosphere, Science, 301, 1886–1889, doi:10.1126/science.1087236, 2003.
Li, W. J., Zhang, D. Z., Shao, L. Y., Zhou, S. Z., and Wang, W. X.: Individual particle analysis ofaerosols collected under haze and non-haze conditions at a high-elevation mountain site inthe North China plain, Atmos. Chem. Phys., 11, 11733–11744, doi:10.5194/acp-11-11733-10
2011, 2011.Lihavainen, H., Kerminen, V. M., Komppula, M., Hatakka, J., Aaltonen, V., Kulmala, M.,
and Viisanen, Y.: Production of “potential” cloud condensation nuclei associated withatmospheric new-particle formation in northern Finland, J. Geophys. Res., 108, 4782,doi:10.1029/2003jd003887, 2003.15
Lin, P., Hu, M., Wu, Z., Niu, Y., and Zhu, T.: Marine aerosol size distributionsin the springtime over China adjacent seas, Atmos. Environ., 41, 6784–6796,doi:10.1016/j.atmosenv.2007.04.045, 2007.
Liu, S., Hu, M., Wu, Z. J., Wehner, B., Wiedensohler, A., and Cheng, Y. F.: Aerosol number sizedistribution and new particle formation at a rural/coastal site in Pearl River Delta (PRD) of20
China, Atmos. Environ., 42, 6275–6283, doi:10.1016/j.atmosenv.2008.01.063, 2008.Lohmann, U. and Feichter, J.: Global indirect aerosol effects: a review, Atmos. Chem. Phys., 5,
715–737, doi:10.5194/acp-5-715-2005, 2005.Mönkkönen, P., Koponen, I. K., Lehtinen, K. E. J., Hämeri, K., Uma, R., and Kulmala, M.:
Measurements in a highly polluted Asian mega city: observations of aerosol number size25
distribution, modal parameters and nucleation events, Atmos. Chem. Phys., 5, 57–66,doi:10.5194/acp-5-57-2005, 2005.
McMurry, P. H., Fink, M., Sakurai, H., Stolzenburg, M. R., Mauldin, R. L., Smith, J., Eisele, F.,Moore, K., Sjostedt, S., Tanner, D., Huey, L. G., Nowak, J. B., Edgerton, E., and Voisin, D.:A criterion for new particle formation in the sulfur-rich Atlanta atmosphere, J. Geophys. Res.,30
110, D22S02, doi:10.1029/2005jd005901, 2005.
20550

ACPD13, 20531–20560, 2013
Particle formation inurban and regional
backgroundenvironments
Z. B. Wang et al.
Title Page
Abstract Introduction
Conclusions References
Tables Figures
J I
J I
Back Close
Full Screen / Esc
Printer-friendly Version
Interactive Discussion
Discussion
Paper
|D
iscussionP
aper|
Discussion
Paper
|D
iscussionP
aper|
Merikanto, J., Spracklen, D. V., Mann, G. W., Pickering, S. J., and Carslaw, K. S.: Impact ofnucleation on global CCN, Atmos. Chem. Phys., 9, 8601–8616, doi:10.5194/acp-9-8601-2009, 2009.
Nieminen, T., Lehtinen, K. E. J., and Kulmala, M.: Sub-10 nm particle growth by vapor conden-sation – effects of vapor molecule size and particle thermal speed, Atmos. Chem. Phys., 10,5
9773–9779, doi:10.5194/acp-10-9773-2010, 2010.O’Dowd, C. D., Hämeri, K., Mäkelä, J. M., Pirjola, L., Kulmala, M., Jennings, S. G.,
Berresheim, H., Hansson, H.-C., de Leeuw, G., Kunz, G. J., Allen, A. G., Hewitt, C. N., Jack-son, A., Viisanen, Y., and Hoffmann, T.: A dedicated study of new Particle Formation andFate in the Coastal Environment (PARFORCE): overview of objectives and achievements, J.10
Geophys. Res., 107, 8108, doi:10.1029/2001jd000555, 2002.Park, J., Sakurai, H., Vollmers, K., and McMurry, P. H.: Aerosol size distribu-
tions measured at the South Pole during ISCAT, Atmos. Environ., 38, 5493–5500,doi:10.1016/j.atmosenv.2002.12.001, 2004.
Petäjä, T., Kerminen, V.-M., Dal Maso, M., Junninen, H., Koponen, I. K., Hussein, T., Aalto, P. P.,15
Andronopoulos, S., Robin, D., Hämeri, K., Bartzis, J. G., and Kulmala, M.: Sub-micron atmo-spheric aerosols in the surroundings of Marseille and Athens: physical characterization andnew particle formation, Atmos. Chem. Phys., 7, 2705–2720, doi:10.5194/acp-7-2705-2007,2007.
Qian, S., Sakurai, H., and McMurry, P. H.: Characteristics of regional nucleation events in urban20
East St. Louis, Atmos. Environ., 41, 4119–4127, doi:10.1016/j.atmosenv.2007.01.011, 2007.Salma, I., Borsós, T., Weidinger, T., Aalto, P., Hussein, T., Dal Maso, M., and Kulmala, M.:
Production, growth and properties of ultrafine atmospheric aerosol particles in an urban en-vironment, Atmos. Chem. Phys., 11, 1339–1353, doi:10.5194/acp-11-1339-2011, 2011.
Shen, X. J., Sun, J. Y., Zhang, Y. M., Wehner, B., Nowak, A., Tuch, T., Zhang, X. C., Wang, T. T.,25
Zhou, H. G., Zhang, X. L., Dong, F., Birmili, W., and Wiedensohler, A.: First long-term studyof particle number size distributions and new particle formation events of regional aerosol inthe North China Plain, Atmos. Chem. Phys., 11, 1565–1580, doi:10.5194/acp-11-1565-2011,2011.
Sipila, M., Berndt, T., Petaja, T., Brus, D., Vanhanen, J., Stratmann, F., Patokoski, J.,30
Mauldin, R. L., Hyvarinen, A. P., Lihavainen, H., and Kulmala, M.: The role of sulfuric acid inatmospheric nucleation, Science, 327, 1243–1246, doi:10.1126/science.1180315, 2010.
20551

ACPD13, 20531–20560, 2013
Particle formation inurban and regional
backgroundenvironments
Z. B. Wang et al.
Title Page
Abstract Introduction
Conclusions References
Tables Figures
J I
J I
Back Close
Full Screen / Esc
Printer-friendly Version
Interactive Discussion
Discussion
Paper
|D
iscussionP
aper|
Discussion
Paper
|D
iscussionP
aper|
Stanier, C. O., Khlystov, A. Y., and Pandis, S. N.: Nucleation events during the Pittsburgh airquality study: description and relation to key meteorological, gas phase, and aerosol param-eters, Aerosol Sci. Tech., 38, 253–264, doi:10.1080/02786820390229570, 2004.
Stier, P., Seinfeld, J. H., Kinne, S., and Boucher, O.: Aerosol absorption and radiative forcing,Atmos. Chem. Phys., 7, 5237–5261, doi:10.5194/acp-7-5237-2007, 2007.5
Tunved, P., Hansson, H.-C., Kulmala, M., Aalto, P., Viisanen, Y., Karlsson, H., Kristensson, A.,Swietlicki, E., Dal Maso, M., Ström, J., and Komppula, M.: One year boundary layer aerosolsize distribution data from five nordic background stations, Atmos. Chem. Phys., 3, 2183–2205, doi:10.5194/acp-3-2183-2003, 2003.
Venzac, H., Sellegri, K., Laj, P., Villani, P., Bonasoni, P., Marinoni, A., Cristofanelli, P., Calzo-10
lari, F., Fuzzi, S., Decesari, S., Facchini, M. C., Vuillermoz, E., and Verza, G. P.: High fre-quency new particle formation in the Himalayas, P. Natl. Acad. Sci. USA, 105, 15666–15671,doi:10.1073/pnas.0801355105, 2008.
Wang, Z. B., Hu, M., Wu, Z. J., Yue, D. L., He, L. Y., Huang, X. F., Liu, X. G., and Wieden-sohler, A.: Long-term measurements of particle number size distributions and the relation-15
ships with air mass history and source apportionment in the summer of Beijing, Atmos.Chem. Phys. Discuss., 13, 5165–5197, doi:10.5194/acpd-13-5165-2013, 2013a.
Wang, Z. B., Hu, M., Wu, Z. J., Yue, D. L., Zheng, J., Zhang, R. Y., Pei, X. Y., Paasonen, P.,Dal Maso, M., Boy, M., and Wiedensohler, A.: Investigation of the connections between at-mospheric new particle formation and organics at an urban site of Beijing, Atmos. Chem.20
Phys. Discuss., 13, 3419–3450, doi:10.5194/acpd-13-3419-2013, 2013b.Wang, Z. B., Hu, M., Yue, D. L., He, L. Y., Huang, X. F., Yang, Q., Zheng, J., Zhang, R. Y., and
Zhang, Y. H.: New particle formation in the presence of a strong biomass burning episode ata downwind rural site in PRD, China, Tellus B, 65, 2013c.
Weber, R. J., Marti, J. J., McMurry, P. H., Eisele, F. L., Tanner, D. J., and Jefferson, A.: Mea-25
surements of new particle formation and ultrafine particle growth rates at a clean continentalsite, J. Geophys. Res.-Atmos., 102, 4375–4385, doi:10.1029/96JD03656, 1997.
Wehner, B., Wiedensohler, A., Tuch, T. M., Wu, Z. J., Hu, M., Slanina, J., and Kiang, C. S.:Variability of the aerosol number size distribution in Beijing, China: new article forma-tion, dust storms, and high continental background, Geophys. Res. Lett., 31, L22108,30
doi:10.1029/2004gl021596, 2004.Wehner, B., Birmili, W., Ditas, F., Wu, Z., Hu, M., Liu, X., Mao, J., Sugimoto, N., and Wieden-
sohler, A.: Relationships between submicrometer particulate air pollution and air mass his-
20552

ACPD13, 20531–20560, 2013
Particle formation inurban and regional
backgroundenvironments
Z. B. Wang et al.
Title Page
Abstract Introduction
Conclusions References
Tables Figures
J I
J I
Back Close
Full Screen / Esc
Printer-friendly Version
Interactive Discussion
Discussion
Paper
|D
iscussionP
aper|
Discussion
Paper
|D
iscussionP
aper|
tory in Beijing, China, 2004–2006, Atmos. Chem. Phys., 8, 6155–6168, doi:10.5194/acp-8-6155-2008, 2008.
Wiedensohler, A., Cheng, Y. F., Nowak, A., Wehner, B., Achtert, P., Berghof, M., Birmili, W.,Wu, Z. J., Hu, M., Zhu, T., Takegawa, N., Kita, K., Kondo, Y., Lou, S. R., Hofzumahaus, A.,Holland, F., Wahner, A., Gunthe, S. S., Rose, D., Su, H., and Pöschl, U.: Rapid aerosol5
particle growth and increase of cloud condensation nucleus activity by secondary aerosolformation and condensation: a case study for regional air pollution in Northeastern China, J.Geophys. Res.-Atmos., 114, D00G08, doi:10.1029/2008jd010884, 2009.
Wiedensohler, A., Birmili, W., Nowak, A., Sonntag, A., Weinhold, K., Merkel, M., Wehner, B.,Tuch, T., Pfeifer, S., Fiebig, M., Fjäraa, A. M., Asmi, E., Sellegri, K., Depuy, R., Ven-10
zac, H., Villani, P., Laj, P., Aalto, P., Ogren, J. A., Swietlicki, E., Williams, P., Roldin, P.,Quincey, P., Hüglin, C., Fierz-Schmidhauser, R., Gysel, M., Weingartner, E., Riccobono, F.,Santos, S., Grüning, C., Faloon, K., Beddows, D., Harrison, R., Monahan, C., Jennings, S. G.,O’Dowd, C. D., Marinoni, A., Horn, H.-G., Keck, L., Jiang, J., Scheckman, J., McMurry, P. H.,Deng, Z., Zhao, C. S., Moerman, M., Henzing, B., de Leeuw, G., Löschau, G., and Bas-15
tian, S.: Mobility particle size spectrometers: harmonization of technical standards and datastructure to facilitate high quality long-term observations of atmospheric particle number sizedistributions, Atmos. Meas. Tech., 5, 657–685, doi:10.5194/amt-5-657-2012, 2012.
Wu, Z. J., Hu, M., Liu, S., Wehner, B., Bauer, S., Maßling, A., Wiedensohler, A., Petäjä, T., DalMaso, M., and Kulmala, M.: New particle formation in Beijing, China: statistical analysis of20
a 1-year data set, J. Geophys. Res., 112, D09209, doi:10.1029/2006jd007406, 2007.Wu, Z. J., Hu, M., Lin, P., Liu, S., Wehner, B., and Wiedensohler, A.: Particle number size
distribution in the urban atmosphere of Beijing, China, Atmos. Environ., 42, 7967–7980,doi:10.1016/j.atmosenv.2008.06.022, 2008.
Yu, F., Wang, Z., Luo, G., and Turco, R.: Ion-mediated nucleation as an important global source25
of tropospheric aerosols, Atmos. Chem. Phys., 8, 2537–2554, doi:10.5194/acp-8-2537-2008,2008.
20553

ACPD13, 20531–20560, 2013
Particle formation inurban and regional
backgroundenvironments
Z. B. Wang et al.
Title Page
Abstract Introduction
Conclusions References
Tables Figures
J I
J I
Back Close
Full Screen / Esc
Printer-friendly Version
Interactive Discussion
Discussion
Paper
|D
iscussionP
aper|
Discussion
Paper
|D
iscussionP
aper|
Table 1. Classification statistics of events at PKU and SDZ. N (%): N is the number of eachclass and the value in bracket indicates the percentage accounting for the days with valid data.
Site Class I Class II Non-event Undefined Valid Bad/Missinga
PKU 67 (26 %) 29 (12 %) 80 (32 %) 77 (30 %) 253 22SDZ 69 (31 %) 18 (8 %) 87 (39 %) 49 (22 %) 223 52
20554

ACPD13, 20531–20560, 2013
Particle formation inurban and regional
backgroundenvironments
Z. B. Wang et al.
Title Page
Abstract Introduction
Conclusions References
Tables Figures
J I
J I
Back Close
Full Screen / Esc
Printer-friendly Version
Interactive Discussion
Discussion
Paper
|D
iscussionP
aper|
Discussion
Paper
|D
iscussionP
aper|
Table 2. Statistics of condensable vapor concentration (C), condensation sink (CS) and sourcerate (Q) during the NPF event over the three seasons and whole measurements period. CS isthe median value during the timeframe for determination of GR.
# Event CS (× 10−2 s−1) C (× 107 cm−3) Q (× 106 cm−3 s−1)PKU/SDZ PKU SDZ PKU SDZ PKU SDZ
Spring 29/26 2.6±1.4 2.4±2.1 8.7±2.9 7.7±2.8 2.2±0.4 1.8±0.6Summer 18/10 2.2±1. 0.9±0.8 11.6±5.7 7.9±3.8 2.5±0.6 0.7±0.3Autumn 20/33 1.7±1.2 0.9±0.6 8.1±2.2 6.4±3.1 1.4±0.3 0.6±0.2Average in total 67/69 2.2±1.3 1.4±1.6 9.3±4.0 7.1±3.2 2.1±0.5 1.2±0.5
20555

ACPD13, 20531–20560, 2013
Particle formation inurban and regional
backgroundenvironments
Z. B. Wang et al.
Title Page
Abstract Introduction
Conclusions References
Tables Figures
J I
J I
Back Close
Full Screen / Esc
Printer-friendly Version
Interactive Discussion
Discussion
Paper
|D
iscussionP
aper|
Discussion
Paper
|D
iscussionP
aper|
Table 3. Statistics of three quantities (CCN45, CCN90 and CCN200) at two sites and the potentialcontributions of anthropogenic emissions.
PKU_average SDZ_average Anthropogenic emissions (%)Increase number Increase Increase number Increase Min Max Average
(× 103 cm−3) factor (× 103 cm−3) factor
CCN45 13.0±4.7 5.6±3.5 7.7±6.1 8.7±7.6 13 91 59±23CCN90 5.7±2.6 6.0±3.9 3.4±3.1 7.0±6.5 20 95 63±24CCN200 1.2±0.7 5.6±3.7 0.8±0.7 6.5±6.3 10 94 62±25
20556

ACPD13, 20531–20560, 2013
Particle formation inurban and regional
backgroundenvironments
Z. B. Wang et al.
Title Page
Abstract Introduction
Conclusions References
Tables Figures
J I
J I
Back Close
Full Screen / Esc
Printer-friendly Version
Interactive Discussion
Discussion
Paper
|D
iscussionP
aper|
Discussion
Paper
|D
iscussionP
aper|
Fig. 1. The frequencies of NPF events vs. month at two sites during the whole measurementperiod.
20557

ACPD13, 20531–20560, 2013
Particle formation inurban and regional
backgroundenvironments
Z. B. Wang et al.
Title Page
Abstract Introduction
Conclusions References
Tables Figures
J I
J I
Back Close
Full Screen / Esc
Printer-friendly Version
Interactive Discussion
Discussion
Paper
|D
iscussionP
aper|
Discussion
Paper
|D
iscussionP
aper|
Fig. 2. The variations of particle formation rates (FR, a and b) and growth rate (GR, c and d)at PKU (red) and SDZ (black) during measurement period. The bars in (b) and (d) indicate thestandard deviation.
20558

ACPD13, 20531–20560, 2013
Particle formation inurban and regional
backgroundenvironments
Z. B. Wang et al.
Title Page
Abstract Introduction
Conclusions References
Tables Figures
J I
J I
Back Close
Full Screen / Esc
Printer-friendly Version
Interactive Discussion
Discussion
Paper
|D
iscussionP
aper|
Discussion
Paper
|D
iscussionP
aper|
Fig. 3. Diurnal variations of condensation sink (CS) on NPF event (red) and none-event (blue)at PKU (solid line) and SDZ (dash line).
20559

ACPD13, 20531–20560, 2013
Particle formation inurban and regional
backgroundenvironments
Z. B. Wang et al.
Title Page
Abstract Introduction
Conclusions References
Tables Figures
J I
J I
Back Close
Full Screen / Esc
Printer-friendly Version
Interactive Discussion
Discussion
Paper
|D
iscussionP
aper|
Discussion
Paper
|D
iscussionP
aper|
Fig. 4. (a) and (b): The particle number size distributions and mean diameters of the dom-inating mode (black square); (c) and (d): the evolution of condensation sink (CS, olive) andthe number concentrations of nucleation mode (N3–25, red) and total (N3–900, black) particles;(e) and (f): the calculated particle light scattering coefficient at 550 nm (σsp, cyan) and massconcentration (M, purple); (g) and (h): the calculated CCN number concentration (CCNcal) incertain diameter ranges (45–900 nm, blue; 90–900 nm, green; 200–900 nm, orange). Left andright panels represent the PKU and SDZ sites, respectively.
20560