Participation and Expenditure of Rural-Urban … odds vary according to the specific side bet. A...
29
1 DEPARTMENT OF ECONOMICS ISSN 1441-5429 DISCUSSION PAPER 24/13 Participation and Expenditure of Rural-Urban Migrants in the Illegal Lottery in China Zhiming Cheng * , Russell Smyth † and Gong Sun ‡§ Abstract Using a unique dataset from the Pearl River Delta in China we examine the factors associated with rural-urban migrants’ participation in, and expenditure on, illegal gambling. We find that similar demographic and lifestyle characteristics are associated with participation in, and expenditure on, the illegal lottery. The characteristics which have the largest marginal effects on participation and expenditure are gender, whether one also participates in the legal lottery and playing mah-jong and other card games. The amount of a normal sized bet placed by males is 30 per cent higher than that placed by females, based on the mean value of a normal bet. The corresponding figures for those who participate in the official lottery and those who play mah-jong or card games respectively are 48 per cent and 39 per cent higher. Policy implications and recommendations stemming from the major findings are discussed. Key words: China; rural-urban migrant workers; illegal lottery * School of Economics, University of Wollongong. † Department of Economics and Centre for Development Economics and Sustainability, Monash University ‡ Department of Marketing and Management, Macquarie University. § We thank Choon Wang for helpful comments on an earlier version. © 2013 Zhiming Cheng, Russell Smyth and Gong Sun All rights reserved. No part of this paper may be reproduced in any form, or stored in a retrieval system, without the prior written permission of the author.
Transcript of Participation and Expenditure of Rural-Urban … odds vary according to the specific side bet. A...

1
DEPARTMENT OF ECONOMICS
ISSN 1441-5429
DISCUSSION PAPER 24/13
Participation and Expenditure of Rural-Urban Migrants in the Illegal Lottery in
China
Zhiming Cheng*,
Russell Smyth
† and Gong Sun
‡§
Abstract Using a unique dataset from the Pearl River Delta in China we examine the factors associated with
rural-urban migrants’ participation in, and expenditure on, illegal gambling. We find that similar
demographic and lifestyle characteristics are associated with participation in, and expenditure on,
the illegal lottery. The characteristics which have the largest marginal effects on participation and
expenditure are gender, whether one also participates in the legal lottery and playing mah-jong and
other card games. The amount of a normal sized bet placed by males is 30 per cent higher than that
placed by females, based on the mean value of a normal bet. The corresponding figures for those
who participate in the official lottery and those who play mah-jong or card games respectively are
48 per cent and 39 per cent higher. Policy implications and recommendations stemming from the
major findings are discussed.
Key words: China; rural-urban migrant workers; illegal lottery
* School of Economics, University of Wollongong. † Department of Economics and Centre for Development Economics and Sustainability, Monash University
‡ Department of Marketing and Management, Macquarie University.
§ We thank Choon Wang for helpful comments on an earlier version.
© 2013 Zhiming Cheng, Russell Smyth and Gong Sun
All rights reserved. No part of this paper may be reproduced in any form, or stored in a retrieval system, without the prior written
permission of the author.

2
1. Introduction
The underground economy is becoming increasingly important in developing and transition economies
(Schneider, 2005). On the plus side, the underground economy fosters entrepreneurship and provides
jobs, goods and services, especially for the poor (Venkatesh, 2006). It can also assist to cut through
bureaucratic red tape and provide an ‘alternative path’ to foster economic development (De Soto, 1990).
The down side of the underground economy is that associated illegal activities such as prostitution, drug
trafficking and illegal gambling pose significant challenges to economic and social governance in
developing and transition countries (Dreher & Schneider, 2010; Schneider & Enste, 2000).
Illegal gambling is an important component of the underground economy. Investigating illegal numbers
gambling in the United States (U.S.), Sellin (1963, p. 12) indicates that ‘the numbers racket, among
syndicated underworld operations, is one of the most highly organized [and] well staffed, and [is]
thoroughly disciplined. Playing the numbers and gambling in general, like participation in other vices,
survive because large portions of the population enjoy them, see no harm in them, and do not regard
them as immoral, even when they are illegal.’ Illegal gambling is particularly prevalent in developing
and transition countries in Asia. For example, in the late 1990s illegal gambling constituted as much as
60 per cent of the underground economy and was associated closely with organized crime and political
corruption in Thailand (Phongphaichit et al., 1998). It is estimated that one trillion RMB ($US 161
billion) is wagered illegally every year in a thriving underground economy in China (Eimer, 2010).
Following China’s economic reforms, the central government abandoned the Maoist legal norm that
prohibited all types of gambling. This resulted in a resurgence in gambling as a preferred form of
entertainment among the Chinese (Loo et al., 2008). In 2012 the nationwide sales of state-run lotteries,
which were established in 1987, in China were worth 262 billion RMB ($US 42 billion), representing an
18 per cent annual growth rate (Ministry of Finance, 2013). Currently China’s legal lottery market is
ranked only behind the U.S. lottery market, which was worth $US60 billion in 2012.
Operating alongside the legal lottery market in China is a flourishing illegal lottery market. An illegal
lottery called liuhecai first appeared in Guangdong province in southern China in the late 1990s. The
illegal lottery uses the numbers drawn in an official lottery with the same Chinese name in Hong Kong
(called the Mark Six Lottery in English). In recent years the illegal lottery has spread to, and become
very popular in, all regions of mainland China as well as Taiwan (Yen & Wu, 2013).
China’s rural-urban migration has been described as the largest migration flow in history (Zhao, 1999).
Currently more than 100 million rural-urban migrants live and work in urban China and many of them
are active consumers of gambling products (Sun, 2012). In China the hukou (household registration)
system assigns every Chinese either a rural or urban status. Since rural-urban migrants still hold rural
hukou, they are not officially recognized as urban citizens. Past studies on rural-urban migrants have
studied various aspects of their labour market experience as well as other socioeconomic outcomes.
However, there is no research on the extent to which rural-urban migrants participate in the illegal
lottery, despite anecdotal evidence suggesting gambling is important in their lives. For example, a recent

3
survey of 182 migrant workers suggests that approximately one third had participated in lotteries and 45
per cent had engaged in other gambling games after work; moreover, some rural-urban migrants took
leave to gamble immediately after receiving their monthly salary (Gan & You, 2013).
Rural-urban migrants generally face poor living and working conditions and experience low quality of
life (see e.g. Gao & Smyth, 2011; Knight & Gunatilaka, 2010; Nielsen et al., 2010). Many studies have
found that rural-urban migrants feel like ‘outsiders’ in China’s urban areas (see e.g. Zhuang, 2013).
Male migrants, in particular, often turn to drinking and gambling on the illegal lottery to escape their
sense of loneliness and in hope of improving their lot in life. There is evidence that illegal gambling
among rural-urban migrants is associated with myriad negative outcomes, such as betting addiction and
lottery-related crime. The illegal lottery in China has been linked to organised crime, including criminal
illegal activities, such as drugs and prostitution (Human Rights in China, 2002; Liang, 2009). One study
estimates that there are seven million ‘problem gamblers’ participating in lotteries in China; of which,
430,000 are seriously addicted (Evans, 2012). There are several reports of cases where rural-urban
migrants have committed crime, in order to finance addiction to playing the illegal lottery (see e.g. Cui,
2013).
The purpose of this study is to examine the determinants of participation in, and expenditure on, the
illegal lottery among rural-urban migrants. To do so, we employ a unique representative dataset
collected in Guangdong province – one of the major destinations for rural-urban migrants, the birthplace
of the illegal lottery and the largest provincial market for both the legal and illegal lotteries.
We extend the literature on migration and illegal gambling in the following important ways. First,
despite the growing prevalence of illegal gambling in China, there is little research on it and no studies
which focus exclusively on the determinants of participation in illegal gambling. Second, there are no
studies on the extent to which migrants participate in illegal gambling or gambling of any kind. Third,
most existing studies focus exclusively on the determinants of participation in, and expenditure on,
lotteries. In addition to examining determinants of participation and expenditure, we also examine the
frequency with which rural-urban migrants participate in the illegal lottery. A better understanding of
the factors determining the frequency with which rural-urban migrants participate in the illegal lottery
and the amount spent on the illegal lottery will assist policymakers in formulating intervention strategies
that minimize the impact of problem gambling behaviour among migrants and other populations.
Foreshadowing the main results, we find that gender, participating in the official lotteries and engaging
in other forms of gambling, such as playing mah-jong and card games, are the factors which have the
strongest marginal effect on participation in, and expenditure on, the illegal lottery. Specifically, males
are 13-14 per cent more likely to participate in the illegal lottery than females, those who play the
official lottery are 34 per cent more likely to also participate in the illegal lottery and those who play
mah-jong and card games as after work activities are 16 per cent more likely to participate in the illegal
lottery. The amount of a normal bet placed by males is 30 per cent higher than that placed by females,
based on the average bet placed. The corresponding figures for those who participate in the official
lottery and those who play mah-jong or card games respectively are 48 per cent and 39 per cent.
4
2. The illegal lottery in China
Punters in the Chinese illegal lottery bet on the special number drawn in the Hong Kong Mark Six
Lottery. There are 49 balls so the winning probability is 1/49, or 2 per cent, with a payout rate typically
at 40-to-1. In addition to betting on the special number, a series of sideline bets are also available. For
example, punters can bet on the colour of the special number (red, green or blue), the Chinese zodiac
signs pre-assigned to each of the lottery balls, whether or not the special number is odd or even, whether
or not the special number is larger than 25, the last digit of the special number and so on. There is no
minimum or maximum amount of a given bet. The odds vary according to the specific side bet.
A peculiar aspect of the illegal lottery in China is that numerous versions of ‘hint sheets’ with photos of
revealing women, cartoon figures, classic poetry, riddles and jokes are published and widely circulated
by illegal publishers (see Figure 1 for an example). Punters also seek enlightenment through the popular
media. For example, many believe that the British BBC pre-school children's television series
Teletubbies contains hints revealed by prophets, making it popular among punters. The belief that hint
sheets contain winning numbers has led many punters to imagine that lotteries, which are random in
nature, represent, in essence, a predictable game and profitable investment (Liu, 2011).
[Figure 1 here]
The illegal lottery operates within a pyramid structure with four tiers. The bottom tier consists of the
punters. The second bottom tier consists of those who collect, and record, bets from the punters. Many
bet collectors, some of whom only accept bets from punters with whom they are familiar, are either the
proprietors or employees at corner stores, newsagents, eateries or internet cafes. This facilitates easy and
covert contact with punters. Bet collectors usually receive 10 per cent of the bet as commission. The bet
collectors pass the bets to small bookies who represent the third tier in the pyramid. At the top of the
pyramid are the larger bookies who take some of the larger bets from the smaller bookies. Following the
draw the bookies give the winnings to the bet collectors to distribute to the punters. A credit account is
available for trusted repeat punters and big punters, in which they can settle their accounts following the
draw. In general, there is a high level of trust between the stakeholders in the illegal lottery (Deng, 2006).
Many Chinese prefer the illegal lottery to the official lottery because there have been a number of
instances of cheating in the legal lottery and punters believe the lottery in Hong Kong to be fairer.
A feature of the illegal lottery pyramid structure is that participants only have contact with those at the
tier immediately above them. Thus, the punters do not have contact with the small bookies and the bet
collectors have no contact with the large bookies. In most cases, communication is top-down and one-
way between big bookies, small bookies and bet collectors via mobile phones and instant messaging
programs. The Chinese government has failed to eradicate the illegal lottery despite periodic crack
downs on the punters and bet collectors because the secretive tiered structure provides protection to both
the small and large bookies who are financing the illegal lottery further up the pyramid.
5
In Hong Kong the Mark Six Lottery is broadcast on television on Tuesday, Thursday and Saturday.
Since the broadcast is blocked in Mainland China, internet and modern communication technology play
important roles in marketing the illegal lottery and publicizing the winning numbers. Some enterprises
have also attempted to benefit from the illegal business. Before 2005, one of China’s biggest domestic
search engines provided a large number of paid advertisements for illegal lottery websites. Later these
advertisements were banned at the request of the internet administrators. However, currently one of the
largest international search engines still provides abundant information linking to illegal lottery websites.
Because of the large volume of cell phone traffic immediately before and after the draw (around 8 pm to
9 pm on draw nights) it is often difficult for people to connect on their cell phones in this period. In 2006,
one of the authors observed in a city in Guangdong province that a state-owned mobile service provider
erected outdoor advertising, which proclaimed: ‘Choose us! Your cell phone call will be able to get
through at the critical moments on Tuesday, Thursday and Saturday nights!’
At the beginning of the century, the illegal lottery was predominately confined to the rural areas of
China, but it has now spread and is widely followed in both rural and urban China (see Zeng, 2004 for a
detailed account of its early development). There is no national statistics on the magnitude of the illegal
lottery in China, but some statistics demonstrate its impact in particular locales. Reflecting its roots, the
illegal lottery is most popular in southern China. In the rural areas of Guangdong province, it is
estimated that 3.3 billion RMB was spent on the illegal lottery in 2003 and that 40 per cent of the
expenditure flowed to bookies (Liang, 2004). In Yueyang city in Hunan province, which has a
population of 5.3 million, more than 300 million RMB flowed to bookies in 2004. In Miluo city in
Hunan province, which has a population of 650 thousand, more than 5 million RMB was remitted to
bookies on every lottery draw day, and the amount of personal bank savings decreased by 97 million
RMB in December 2004 alone (Guo, 2005). In northern China in one village of 6,000 households near
Tianjin, it was reported that 6 million RMB was spent on the illegal lottery within a half year and the
local bank savings deceased by 500 thousand RMB each month in 2003 (Wen, 2004). One of the peaks
of betting occurred in December 2004, when a red special number had not been drawn for 19
consecutive draws in the Mark Six Lottery. In view of the high probability that a red special number
would be drawn, nearly 20 billion RMB was spent by punters during that month alone (Li, 2005).
3. Literature review
International research on lotteries
Theoretical and empirical research on the economics of lotteries has been plentiful (Ariyabuddhiphongs,
2011; Clotfelter & Cook, 1990; Perez & Humphreys, forthcoming). The majority of these studies have
focused on mature legal lottery markets (such as Australia, Spain, the United Kingdom and U.S). Most
of the extant research has examined the relationships between demographic and socioeconomic
characteristics and gambling behaviour. Some general themes emerge in the literature.

6
Generally speaking, males are more likely to participate in lotteries than females (Coups et al., 1998;
Herring & Bledsoe, 1994). But, some studies have reached the opposite conclusion. In Sydney, in
Australia, females had a higher preference for lotteries than males and they experienced problem
gambling at levels comparable to males (Hing & Breen, 2001). Most studies have found that those who
are single are more likely to participate in lotteries and be more frequent gamblers than those who are
married (Hodgins et al., 2012). In Malaysia, household size has been found to have a statistically
negative effect on lottery participation and expenditure among Chinese households (Tan et al., 2010).
Differences in age and life cycle patterns may lead to variations in lottery participation and expenditure.
But the relationship between age and gambling is uncertain. Barnes at al. (2011) find that the frequency
of participation in lotteries in the U.S. exhibits a non-linear relationship in which participation is at a
maximum between one’s thirties and sixties. But in some states, such as Massachusetts, the 65 and over
age group are the major participants in lotteries and are the main age group responsible for increasing
per capita sales of the state-run lottery (Jackson, 1994). Gambling among youth is also of particular
concern. Felsher et al. (2003) find that youth participate in all forms of lotteries because their parents
purchased tickets for them, and that young participants with significant gambling problems had much
higher parental participation in the lottery compared to non-gamblers and social gamblers.
Most studies find that the better educated are less likely to play lotteries (Coups et al., 1998; Mikesell,
1991; Stranahan & Borg, 1998b). Similarly, a number of studies find that income is negatively
correlated with participation in lotteries. Lotteries are particularly popular among low-income
individuals in the U.S. who may substitute lottery play for other entertainment, or view lotteries as a
means to improve their standard of living (Clotfelter & Cook, 1991). Blalock et al. (2007) find a strong
and positive relationship between participation in lotteries and poverty rates, but no relationship between
movie ticket sales, another inexpensive form of entertainment, and poverty rates. However, findings for
income are not uniform. Scott and Garen (1994) find that, controlling other demographic and
socioeconomic variables, income has no significant effect on expenditure on lotteries. Stranahan and
Borg (1998a) suggest that income has a negative and significant impact on participation in lotteries, but
no significant effect on lottery expenditure, conditional on participation. As a consequence, Humphreys
et al. (2011) suggest that estimates of the income elasticity of demand for lotteries are susceptible to
model selection and specification and call for more empirical attention to this issue.
Other common findings are that participation in lotteries is positively correlated with peer participation
in lotteries, frequency of participation in other forms of gambling and misunderstanding about the
probability of winning (Coups et al., 1998). Frequency of participation in lotteries has been found to be
positively correlated with scratch card play, gambling on horse and greyhound racing, participating in
the football pools, and bingo as well as with beliefs about skill, luck and optimism (Rogers & Webley,
2001). Findings on the relationship between religion and gambling in western contexts have been mixed.
Some studies have found that the religious are more likely to gamble and that their intensity of gambling
is higher (Hodge et al., 2007; Hoffman, 2000; Joukhador et al., 2004), while other studies find an
insignificant, or even negative, relationship between being religious and gambling (Diaz, 2000; Lam,
2006). Among higher-frequency gamblers, individuals with obsessive-compulsive disorder, higher

7
anxiety or depression and with higher impulsivity and antisocial personality traits have been found to be
more likely to have self-reported gambling-related problems (Hodgins et al., 2012).
Research on the illegal lottery in China
The literature on gambling in Mainland China is scant and most is focused on legal lotteries. A limited
number of studies provide descriptive details on the characteristics of those who participate in legal
lotteries. One such study, using data from Guangzhou (the capital of Guangdong province), shows that
the majority of participants in the official lottery were young, middle-aged males with above-average-
income and a high school education or better (Zeng & Zhang, 2007). Another such study finds that most
participants in legal online lotteries in China are well educated and married with relatively high average
income (approximately 3,000-5,000 RMB per month) (Chen, 2012). Some other studies have examined
problem gambling behaviour associated with the official sports lottery (Li et al., 2012a) and the
relationship between the official lottery administration and lottery consumption (Li et al., 2012b).
There are two studies in Chinese which examine determinants of participation in lotteries in mainland
China using a regression framework. One study by Zhang and Zheng (2006) examines lottery
participation among 550 people in Haikou city in Hainan province. Employing a probit model, they find
that being male, married, less educated and having lower income is correlated with participation in
lotteries. Another study, using data collected from Yangzhou city in Jiangsu province, finds that neither
marital status nor income were significantly correlated with lottery participation (Zhang, 2007). A
limitation of both studies is that neither distinguish between participants in legal and illegal lotteries and
thus do not provide insights into the characteristics of those who participate in the illegal lottery.1
In the English literature, there are a few anthropological studies focusing on lotteries in the rural areas.
Based on long term fieldwork in Hubei province, Steinmüller (2011) describes the operation of the
illegal lottery in the countryside in central China and finds that in many villages there are huge numbers
of people betting regularly. He finds that participation in the illegal lottery has grown rapidly and that
local governments are selective in attempting to control it. He argues that popular gambling reflects how
boundaries of what is socially acceptable are changing in the Chinese countryside. Gong (2013) analyses
how women justify their participation in the illegal lottery in rural China and suggests that women’s
participation in the illegal lottery is tied to seeking peer approval. Jin (2008) studies the participation of
Catholics in illegal lotteries in a village in eastern Guangdong and explores the reasons that Catholics
participate despite the strong opposition from the local Catholic Church. Other studies examine the role
of religion and superstition as factors underpinning participation in illegal lotteries and the strategies
punters use to select colours and numbers (see e.g. Bosco et al., 2009; Liu, 2011). These studies point to
an increasing level of social acceptance of illegal lotteries, at least in rural China.
To summarize, the existing literature has focused on describing the characteristics of those who
participate in either the official lotteries in mainland China or fail to distinguish between the legal and
1 These two papers do not report the sampling method or describe the data collection.

8
illegal lotteries. Those studies that do explicitly focus on the illegal lottery take an anthropological
perspective and are centred on understanding aspects of the illegal lotteries in rural China. There are no
studies which examine determinants of participation in illegal lotteries in urban China and no studies
which consider the involvement of rural-urban migrants in either the legal or illegal lotteries.
4. Data and descriptive statistics
The data used in this study came from the Survey of Rural-to-Urban Migrant Workers in the Pearl River
Delta, which was administered in nine prefecture-level cities (dijishi) by Sun Yat-Sen University in
2006. To ensure that the data was representative of the rural-urban migrant population, the sampling
framework adhered to three principles. First, the allocation of the sample across the nine cities followed
the actual proportional distribution of the migrant population in these cities according to the official
population census. Second, the allocation of the sample across secondary and tertiary industries
followed the actual proportional distribution of migrants in these industries according to the official
statistical yearbook in 2005. Third, no more than three interviewees were recruited from each employer.
The survey contained several questions that elicited information of interest to this study. These questions
included whether the respondent participated in the illegal lottery and, if so, how often he or she
participated in the illegal lottery; the amount of the average bet the respondent placed and the total
number of bets as well as if the respondent had ever won and, if so, the total number of times he or she
had won and the highest winning prize. In addition, respondents were asked whether they participated in
official lotteries and some questions in relation to their after-work lifestyle, such as playing mah-jong
and card games which usually involve gambling in the Chinese context. Other information collected in
the survey pertained to income, employment status, and personal and family characteristics. Only those
respondents who answered the lottery-related questions are included in the analysis, making the final
sample size 3,937. The distribution of the sample across cities is presented in Table 1.
[Table 1 here]
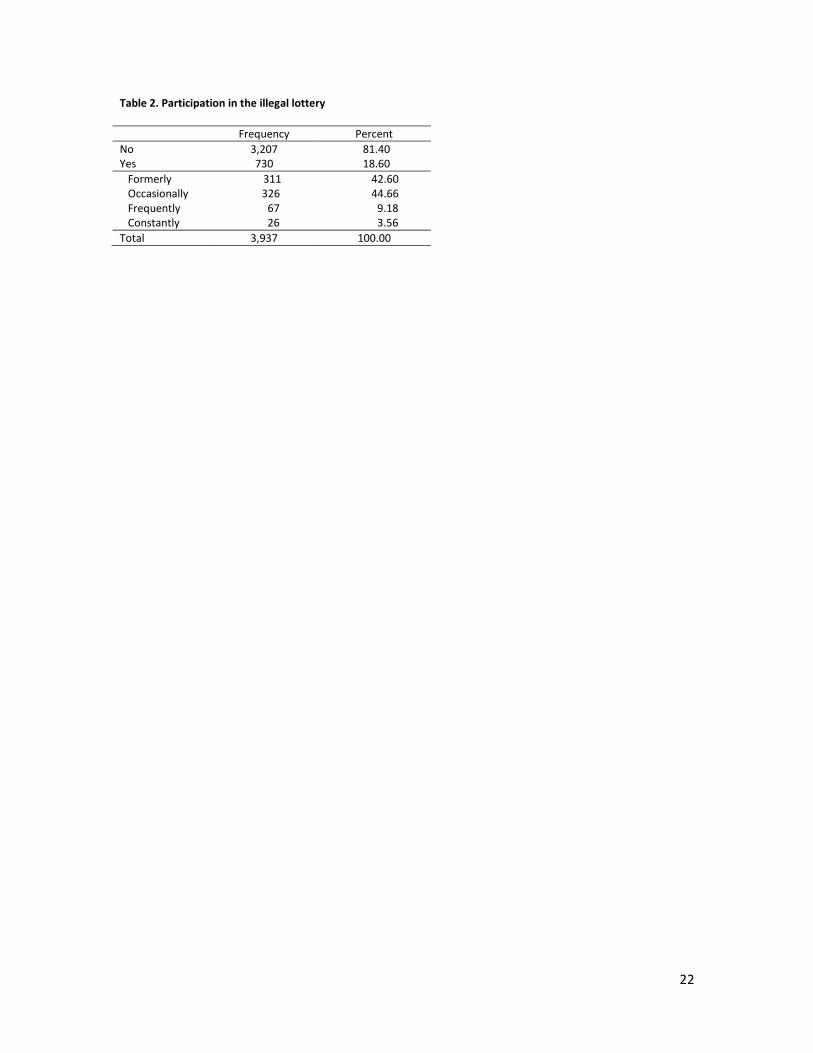
Tables 2 and 3 present descriptive statistics for the sample. Just over half the sample is male (55.4 per
cent) and married (51.4 per cent). The average age is 29.6 years. The education level is low with almost
three quarters (72.5 per cent) being educated to junior high school or below. The participation rate in the
illegal lottery was 18.6 per cent. This was significantly higher than the participation rate in official
lotteries (6.9 per cent). Among 730 participants in the illegal lottery, approximately 70 per cent had won
prizes. The normal amount of a bet ranged from one to 2,000 RMB, reflecting the flexible bet
requirement. The average normal amount of a bet was 46 RMB, while the total amount wagered by any
one individual ranged from one to 180,000 RMB. Hence, the average ‘normal bet’ consumed about 4
per cent of mean monthly income, which was around 1,100 RMB. If the individual played all 12-13
games in a month, nearly half of their mean monthly income would be spent on the illegal lottery.
[Tables 2 and 3 here]

9
5. Econometric method
In the 1980s and early-1990s some studies employed standard tobit models unconditional on lottery
participation to examine lottery expenditure. This approach assumes that independent variables have the
same impact on probability of participation and expenditure. However, it may lead to biased estimates
because lottery consumption is subject to two decisions: whether to bet, and, if so, how much to bet. For
example, studies in the U.S. find that ethnicity/race does not affect participation, but African Americans,
Hispanics and other minorities tend to spend more if they do gamble (Scott & Garen, 1994; Stranahan &
Borg, 1998a). Another study finds that while African American youths are less likely than average to
gamble, they tend to do so more frequently if they do gamble (Welte et al., 2001).
There are two major approaches with similar methodological frameworks to address the presence of
non-participants in the dataset. One is the double-hurdle model, which has been used in modelling usage
of, and expenditure on, tobacco and alcohol. The other is a two-stage model, which distinguishes
between the decision to participate in the lottery and the decision of how much to spend on the lottery.
The two-stage approach entails using a probit model to estimate lottery participation and then a
truncated tobit model to estimate lottery expenditure (Stranahan and Borg, (1998b). We adopt the two-
stage approach because it permits a more flexible specification in selecting variables than the double-
hurdle model. In the first stage of the estimation this entails modelling the probability of participation in
the illegal lottery through a binary outcome model. Equation (1) is of the form:
…… (1)
where is the ith respondent’s expenditure on the illegal lottery, xi is a vector of explanatory variables
affecting participation in the illegal lottery, β is a vector of parameters and εi is the error term. Equation
(1) can be converted to a probit model of illegal lottery participation of the form:
( )
( ) …… (2)
where is the standard normal cumulative distribution function. Equation (2) implies that the
respondent participates in the illegal lottery when actual expenditure is positive.
The second stage estimates the actual expenditure conditional on participation, meaning that expenditure
is truncated at zero. A truncated tobit model models a sample of respondents who had a positive level of
expenditure on the illegal lottery. The truncated tobit model is of the form:
( | )
(
) (
√ ) { (
) ( ) } …… (3)
where Ø(yi|yi > 0) is the standard normal density of yi conditional on participation in the illegal lottery
and Ø(yi) ~ N(βxi, σ2).

10
While most existing studies only consider whether or not respondents had participated in gambling, the
survey also provides information on migrants’ frequency of participation in the illegal lottery. Table 2
suggests that 45, 7 and 3 per cent of migrant workers participated on an occasional, frequent and
constant basis respectively. This allows us to consider the probability of a respondent falling into each
frequency category. A multinominal logit model considers the effect of the vector of explanatory
variables xi on the probability that individual i will fall into in one of the j categories of participation (vij):
( ) ( )
∑ ( )
…… (4)
With the multinomial model non-participants act as the reference group, and all coefficients are
normalised to zero. Maximum likelihood is employed in estimating equations (2), (3) and (4).
6. Results
Table 4 shows the marginal effects from a probit regression for determinants of participation in the
illegal lottery. Model 1 includes basic demographic and socioeconomic variables. Males are 14.6 per
cent more likely than females to participate in the illegal lottery. The marginal effects for age and age
squared show an inverted U-shaped pattern, implying that migrant workers are initially more likely to
participate in the illegal lottery as age increases, but the probability of participation decreases after age
29. Marital status, having children and schooling all have an insignificant effect on participation.
Migrants from larger households are more likely to participate in the illegal lottery. For each additional
member of the household, participation increases 0.8 per cent. This result may imply that migrant
workers from larger households face more financial and/or life pressure in the cities and that they are
more attracted by the illegal lottery with a stronger desire to win. Migrant workers with higher income
are more likely to participate, but it has a small marginal effect. To further examine this point, we
grouped income into different categories in Models 2 to 5, discussed below.
Having religious beliefs significantly increases the probability of participating in the illegal lottery.
Those who state that they are religious are 5.7 per cent more likely to participate than those who are not
religious. This result is consistent with the notion that that superstitious/religious ideas associated with
the illegal lottery and supposedly embedded in hint sheets and in cryptic messages in the popular media
have more credence with people who have religious beliefs. As Binde (2007) (p.145) puts it: ‘Gambling
and religion have certain elements in common: notions of the unknown, mystery, and fate, as well as
imagery of suddenly receiving something of great value that changes life for the better. In many
traditional cultures gambling has existed in concord with polytheistic and animistic religion; gambling
and religion go well together precisely because of the elements they have in common.’ In China and
many traditional non-Western societies, in particular, religious and superstitious beliefs are often
interwoven with participation in gambling. Chinese people believe that one’s lot in life can be changed
if it is the will of the gods and that it is possible to turn the tide of fortune through seeking divine

11
intervention to help them win the lottery (Tse et al., 2010). Consequently, Chinese gamblers often pray
to the gods for success and explain wins and losses in terms of divine will (Binde, 2007; Harrell, 1974).
Migrant workers in an informal job are 3.4 per cent less likely to participate in the illegal lottery than
those in a formal job. One possible reason for this result is that the collective living arrangements, such
as factory dormitories and shared rental housing, provide formal workers with a more active and familiar
gambling environment, as well as easier access to bet collectors near residential areas. Another possible
reason is that formal workers have a higher income and better benefits and with more stable employment
are less concerned about spending on the illegal lottery than informal workers.
Using more nuanced specifications, Models 2-5 provide more information on how grouped income,
grouped age and after work activities effect participation. In Model 1 income has a significant, but a
very small, marginal effect. Therefore, in Model 2 income is categorized into five groups. Compared to
the lowest income group (earning less than 700 RMB per month), respondents earning 1000-1300 RMB
per month are 6.6 per cent more likely to participate, respondents earning 1300-1600 RMB per month
are 10.6 per cent more likely to participate and those earning more than 1600 RMB per month are 10.5
per cent more likely to participate. This result suggests that the illegal lottery ‘tax’ exhibits a progressive
trend and imposes a greater burden relative to income on the relatively rich than on the relatively poor
among migrant workers. This differs from the evidence of a regressive legal lottery tax found in many
other countries (Hansen, 1995; Price & Novak, 2000), but is similar to the case of Spain where, in
contrast to previous research on the legal lottery in developed countries, a strong relationship was
observed between legal lottery expenditure and income, with an estimated income elasticity higher than
one (Perez & Humphreys, 2011). While legal lotteries can be viewed as implicit taxes contributing to
government revenue from a public finance perspective (Clotfelter & Cook, 1987), in the illegal lottery in
China it is the bookies that have benefited from participation of higher income punters.
Model 3 examines the relationship between age and participation in the illegal lottery. The results
suggest that migrant workers in their twenties and thirties are the most likely to participate in the illegal
lottery. Relative to migrants aged less than 20, migrants in their twenties are 6.7 per cent more likely to
participate in the illegal lottery and those in their thirties are 10.6 per cent more likely to participate in
the illegal lottery. Model 4 includes both income and age categories in the same specification. The
marginal effects are significant and generally similar to those reported in Models 2 and 3.
In Model 5, in addition to basic demographic variables, a series of variables related to life style are
included. Migrant workers who enjoy reading after-work are 3.6 per cent less likely to participate in the
illegal lottery. This result might reflect that avid readers are better informed of the low odds of winning
or that reading and playing the lottery are substitutes as leisure activities. Existing research has found
that those who are constrained in terms of the time that they have to allocate to leisure are more likely to
participate in lotteries as a form of leisure (Casey, 2006). Those who enjoy reading after work might
have more time to participate in leisure. Other activities, such as studying, doing housework and looking
after children are not correlated with participation in the illegal lottery.
12
If migrant workers enjoy playing mah-jong and card games (usually involving gambling) and
participating in the official lottery, they are more likely to participate in the illegal lottery. Those who
play mah-jong and card games are 16.2 per cent more likely to participate in the illegal lottery, while
those who participate in the official lottery are 34.1 per cent more likely to also participate in the illegal
lottery. These results suggest that the illegal lottery is complementary to official lotteries and other
forms of gambling for many punters, and that betting on the illegal lottery has become an integral part of
gambling culture that views minor gambling as a harmless enjoyable activity (xiaodu yiqing). In other
words, participation in the illegal lottery may be perceived by migrant workers as entertainment rather
than gambling (Yoong et al., 2013). This is consistent with U.S. experience where people who
participate in one lottery tend to participate in others as well, regardless of legal status (Hybels, 1979).
It is expected that Guangdong will soon experiment a new official lottery similar to the Mark Six
Lottery in a bid to take the market for the illegal lottery. The results, here, challenge the view of some
Chinese officials and commentators in the Chinese media that developing a legal version of the Mark
Six Lottery will suppress the illegal lottery through diverting punters to the legal lottery market. It is
unlikely that a legal Mark Six Lottery in Guangdong would replace the illegal lottery given the much
lower winning probability in official lotteries, complementary effects of legal and illegal lotteries,
inconvenient access to official lottery selling booths and mistrust towards the legal lottery system. The
results also help explain why the illegal lottery has not been eliminated, but has become more popular
despite numerous police raids during a period of rapid expansion of the legal lottery market.
In urban China, migrants struggle in reshaping their self-identity while facing institutional barriers such
as the hukou system (Wang & Fan, 2012). Many of them, especially younger migrants, have not
engaged in agricultural work, have little emotional attachment with the countryside and have a desire to
become recognized as urban citizens. Nonetheless, being defined as peasants in the hukou system and as
urban workers in the process of urban industrialization, rural-urban migrants have ambiguous and
overlapping identities (Pun, 1999). This has resulted in a state of limbo for migrant workers in which
‘there is no future as a labourer [while] returning to the village has no meaning’ (Chan, 2010, p. 659).
Moreover, many urban locals ‘look down’ on rural-urban migrants, making it challenging for the latter
to adapt to urban life (Nielsen & Smyth, 2008). Migrant workers often have strong feelings of social and
economic injustice (Davis & Feng, 2008) and impingement of their legal rights is prevalent (Chan,
2001). Table 3 presents the descriptive statistics of such subjective indicators of wellbeing.
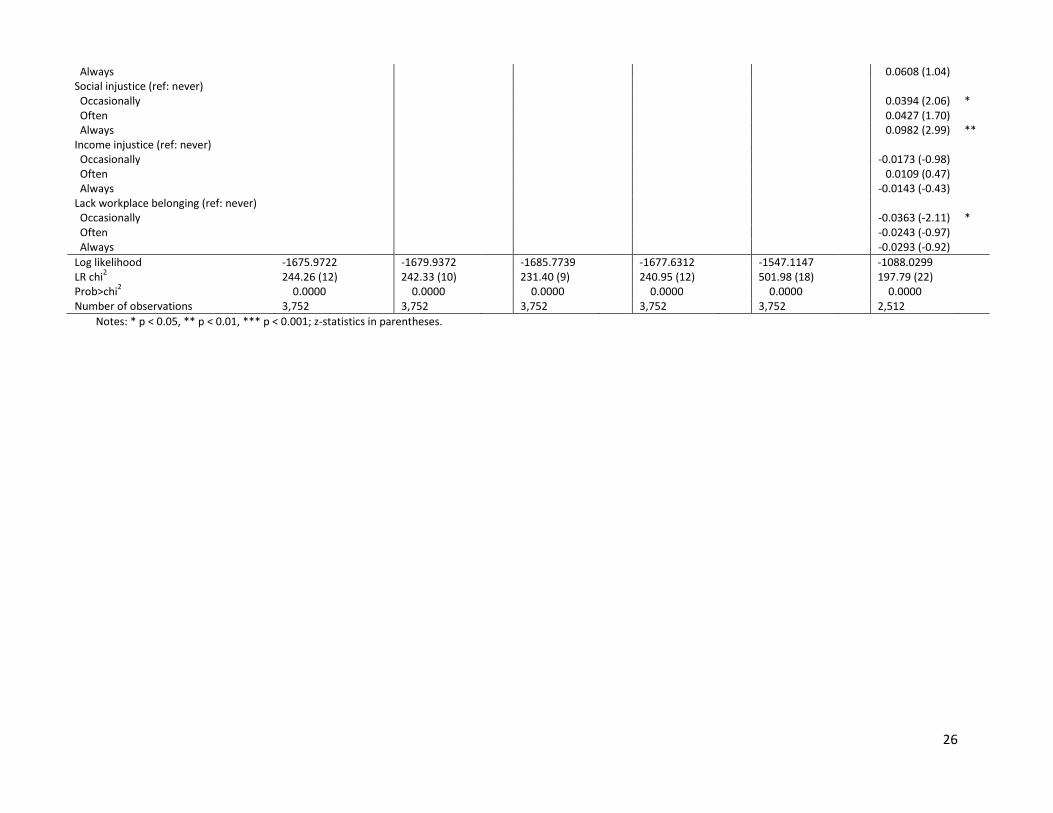
In Model 6, in addition to demographic variables we include these indicators of subjective wellbeing.
Perceptions of adaptation to urban life and income injustice have no statistically significant effects.
Those who self report having an ambiguous or overlapping social identity are 3.9 per cent more likely to
participate in the illegal lottery than those who perceive themselves as peasants. Those who consider that
their labour rights are violated are 3.3 per cent more likely to participate in the illegal lottery. Those who
occasionally consider life difficult (as opposed to never) are 2.7 per cent more likely to participate in the
illegal lottery. Those who occasionally and always feel a sense of social injustice are 3.9 per cent and
9.8 per cent respectively more likely to participate in the illegal lottery relative to those who never feel a
sense of social injustice. A possible explanation is that migrant workers who self report having an

13
ambiguous or overlapping social identity, believe their labour rights violated, consider their lives
difficult or feel a sense of social injustice regard winning in the illegal lottery as a chance to make
positive change. This is consistent with media observation that the main demand for lotteries comes
from the poor and disadvantaged members of society who see winning the lottery as a means to change
their lives in the context of deepening income inequality in urban China (Rabinovitch, 2013).
[Table 4 here]
One cannot draw inferences about causality between generic subjective indicators, such as feeling a
sense of social injustice or feeling that life is difficult, and playing the lottery from the results in Table 4.
In the gambling psychology literature, more generally, the direction of causality between subjective
wellbeing and gambling has not been fully established (see the studies reviewed in Tang & Oei, 2011).
Those who feel a sense of social injustice, or that life is difficult, might participate in the lottery as a
form of escapism or in the hope of winning and improving their lot. Alternatively, playing the lottery
(and losing) might contribute to feeling a sense of injustice or feeling that life is difficult.
To explore this issue further, we present bivariate probit instrumental variable (IV) estimates in which
we instrument for life is difficult and feel a sense of social injustice. To instrument for life is difficult we
use positive responses to questions asking respondents whether they were penalized for not holding a
valid temporary residence permit (zanzhu zheng), whether they need to pay a sponsorship fee (zanzhu fei)
for their children to attend the local public school and whether they feel that local people do not trust
them. To instrument for feeling a sense of social injustice we use positive responses to a question asking
respondents whether they are willing to participate in collective action to fight for their rights and
benefits if violated. Results of a Wald test of exogeneity suggest that both the bivariate probit IV models
are appropriate. The coefficients on the IVs are significant at the 1 per cent level with a positive sign in
first stage regressions, suggesting that they are correlated with life is difficult and feeling a sense of
social injustice respectively. However, there is no reason to believe that any of the IVs would be
correlated with participating in the illegal lottery. The marginal effects for life is difficult and feeling a
sense of injustice from the IV estimates are reported in Table 5. Both variables are significant at the 1
per cent level and the marginal effects are similar to Model 6 in Table 4. The marginal effects of the
control variables, which are not reported, are also similar to those reported in Model 6 in Table 4.
[Table 5 here]
Table 6 presents results from a truncated tobit regression for the determinants of expenditure on a
normal bet and total bets. The same variables are statistically significant regardless of how the
dependent variable is measured. The results for age, gender, religion, reading after work, playing card
games and mah-jong after work and participation in the official lottery are significant with the expected
signs and are similar to the probit for participation in the illegal lottery. Gender, playing cards and
participating in the official lottery have the largest marginal effects on both the size of a normal bet and
total bets. The amount of a normal sized bet placed by males is 30 per cent higher than that placed by
females, based on the mean value of a normal bet. The corresponding figures for those who participate

14
in the official lottery and those who play mah-jong or card games respectively are 48 per cent and 39 per
cent higher. The coefficients on education and marital status are insignificant, similar to the probit for
participation and while income is significant, the marginal effect is small, similar to Models 1, 3 and 6 in
Table 4. However, differing from the results for participation, household size and formality of
employment are not statistically significant determinants of expenditure on the illegal lottery.
[Table 6 here]
Table 7 shows the relative-risk ratios of falling into different frequency categories from the
multinominal logistic regression. There are several interesting points. First, reading after work is not
significant in predicting who falls into the former punter category, but reading is inversely related to
being an occasional, frequent or constant punter. Second, higher income increases the probability of
being a former or constant punter, but has no effect on being an occasional or frequent punter. Third,
being religious increases the probability of being a former or occasional punter, but has no statistical
effect on being a frequent, or constant, punter. This result implies that for frequent and constant punters
superstition is less influential in playing the illegal lottery. This is consistent with casual observation that
frequent participants in the lotteries prefer to calculate the probability of winning numbers rather than
looking for clues hidden in the hint sheets, and that playing the lottery is a normal consumption for some
punters. Fourth, playing social gambling games and buying official lottery tickets are the most
significant factors increasing the relative-risk ratios of falling into each of the frequency categories from
former to constant. Finally, when it comes to explaining the characteristics of those who constantly
participate in the illegal lottery, the most important predictors are playing card games, participating in
the legal lottery and having a relatively high income.
[Table 7 here]
7. Conclusion
This study has examined migrant participation in, and expenditure on, the illegal lottery using
representative data from the Pearl River Delta in Guangdong. Considering separate decisions in
participation and expenditure, we applied a two-stage approach in which a probit model was used to
investigate the determinants of participation and a truncated tobit model was used to examine the
determinants of expenditure. We also employed multinominal logit regression to examine the
determinants of falling into different gambling frequency categories compared to non-participants.
We find that migrant workers who are male, in their twenties or thirties, have relatively high income, are
religious, come from larger households, work in the formal sector, participate in the legal lottery and
play mah-jong and cards are more likely to participate in the illegal lottery. Of these factors, gender,
participating in the legal lottery and playing mah-jong and cards have the largest marginal effects. We
find that marital status, schooling, and having children had no significant effect. Our results differ from
previous findings for China reported in Zhang and Zheng (2006) who find that urban residents who are

15
married, less educated and have lower income were more likely to participate in lotteries. In contrast to
Zhang and Zheng (2006) we focus on the illegal lottery (Zhang and Zheng, 2006, do not distinguish
between the legal and illegal lotteries) and our sample is restricted to rural-urban migrants.
With a few exceptions we found that the same factors that were associated with participation in the
illegal lottery were also associated with expenditure, conditional on participation. The exceptions were
household size and whether the individual was in formal employment, which were insignificant in
explaining expenditure. Moreover, the same factors which were associated with the amount of a normal
bet were associated with the amount of total bets. The factors which had the largest marginal effects in
explaining participation – gender, participation in the legal lottery and playing mah-jong and cards –
also had the largest marginal effects in explaining expenditure on the illegal lottery.
In developed countries, psychological intervention and guidance on personal finance for the treatment of
gambling problems are widely used. However, implementing these methods would be difficult in China
because (problem and pathological) gambling is usually regarded as a private or household matter,
rather than a social problem. Some government agencies and NGOs have been working to help rural-
urban migrants in various ways, but they are less concerned with the illegal gambling problem. There is
much scope to give more attention to assisting rural-urban migrants and other populations affected by
the illegal lottery. Our results suggest that intervention policies should target high risk groups such as
males, those in their twenties and thirties and those with relatively higher income.
Besides these factors suggested by quantitative analysis, some wider policy implications flow from our
examination of the illegal lottery. Punters and bet collectors – the targets of most official crackdowns –
are usually charged with a misdemeanour and fined no more than 3,000 RMB and/or detention of no
more than 15 days as prescribed by the Public Security Administration Punishments Law (Article 70).
Considering the large profits to be made from the illegal lottery, these penalties are of little deterrent
among the large population involved. Indeed, there has long been a popular belief among Chinese that
where there are large numbers of violators the law fails (fa bu zezong). The only really effective way to
dismantle the illegal lottery is to impose heavier penalties higher up the pyramid on the small bookies
and, in particular, the large bookies who finance the illegal lottery.
In the early 2000s, the illegal lottery experienced its fastest growth when public distrust towards the
legal lotteries peaked following a number of scandals. The licensing and administration of legal lotteries
in China by (semi) government agencies is often shrouded in mystery and perceived to be corrupt. The
transparency of the legal lotteries, which operate in the name of charities and other public funds, is of
particular public concern, but the administrators have been reluctant to address them. Only nine of 34
provinces and municipalities provide brief information regarding the management, and distribution, of
lottery income. Addressing transparency would help reinforce people’s confidence in the legal lotteries.
There are various ways through which research on the illegal lottery in China can be improved. Data
collection should cover different socio-economic groups to provide a better base for a comparative study
such as between rural residents, rural-urban migrants and urban locals. Previous research has found that

16
in Taiwan lottery advertising is more influential on individuals with lower incomes and schooling (Lee
& Chang, 2008). Due to data limitations, we are unable to examine whether anti-illegal lottery
advertising and crackdowns have unintentionally helped the illegal lottery expand through raising
people’s awareness of the product (Borg & Stranahan, 2005). Because of data limitations we were also
unable to examine the influence of other factors such as personality and impulsive sensation seeking,
which have been found to be important in other countries (McDaniel & Zuckerman, 2003), on lottery
participation and expenditure among migrant workers. Future research on these facets, with appropriate
data, has the potential to generate further results with important policy implications.
17
References
Ariyabuddhiphongs, V. (2011). Lottery Gambling: A Review. Journal of Gambling Studies, 27(1), 15-33. Barnes, G M, Welte, J W, Tidwell, M-C O, & Hoffman, J H. (2011). Gambling on the Lottery: Sociodemographic
Correlates across the Lifespan. Journal of Gambling Studies, 27(4), 575-586. Binde, P. (2007). Gambling and Religion: Histories of Concord and Conflict. Journal of Gambling Issues, 20, 145-
165. Blalock, G, Just, D R, & Simon, D H. (2007). Hitting the Jackpot or Hitting the Skids: Entertainment, Poverty, and
the Demand for State Lotteries. American Journal of Economics and Sociology, 66(3), 545-570. Borg, M O, & Stranahan, H A. (2005). Does Lottery Advertising Exploit Disadvantaged and Vulnerable Markets?
Business Ethics Quarterly, 15(1), 23-35. Bosco, J, Liu, L H-M, & West, M. (2009). Underground Lotteries in China: The Occult Economy and Capitalist
Culture. In D. C. Wood (Ed.), Economic Development, Integration, and Morality in Asia and the Americas (pp. 31-62). Bingley: Emerald.
Casey, E. (2006). Domesticating Gambling: Gender, Caring and the Uk National Lottery. Leisure Studies, 25(1), 3-16.
Chan, A. (2001). China's Workers under Assault: The Exploitation of Labor in a Globalizing Economy. New York: M.E. Sharpe.
Chan, K W. (2010). The Global Financial Crisis and Migrant Workers in China: 'There Is No Future as a Labourer; Returning to the Village Has No Meaning'. International Journal of Urban and Regional Research, 34(3), 659-677.
Chen, H. (2012). Problem Gamblers and Irrational Purchase of Lotteries in China. Paper presented at the Conference on Problem Gamblers and Responsible Lotteries, Beijing.
Clotfelter, C T, & Cook, P J. (1987). Implicit Taxation in Lottery Finance. National Tax Journal, 40(4), 533-546. Clotfelter, C T, & Cook, P J. (1990). On the Economics of State Lotteries. The Journal of Economic Perspectives,
4(4), 105-119. Clotfelter, C T, & Cook, P J. (1991). Selling Hope: State Lotteries in America. Cambridge: Harvard University Press. Coups, E, Haddock, G, & Webley, P. (1998). Correlates and Predictors of Lottery Play in the United Kingdom.
Journal of Gambling Studies, 14(3), 285-303. Cui, P. (2013). Trucker Robbed Women in Order to Buy Illegal Lottery. Retrieved April 30, 2013, from
http://www.chinadaily.com.cn/hqgj/jryw/2013-04-09/content_8713693.html Davis, D S, & Feng, W (Eds.). (2008). Creating Wealth and Poverty in Postsocialist China. Stanford: Stanford
University Press. De Soto, H. (1990). The Other Path: The Invisible Revolution in the Third World. San Francisco: Perennial Library. Dreher, A, & Schneider, F. (2010). Corruption and the Shadow Economy: An Empirical Analysis. Public Choice,
144(1-2), 215-238. Evans, M. (2012). China Catches Lottery Fever. Retrieved April 30, 2013, from
http://www.aljazeera.com/indepth/features/2012/12/20121223144826895159.html Felsher, J R, Derevensky, J L, & Gupta, R. (2003). Parental Influences and Social Modelling of Youth Lottery
Participation. Journal of community & applied social psychology, 13(5), 361-377. Gan, M, & You, Y. (2013). Bad Habits of the New Generation Migrant Workers and Intervention Strategy of
Industrial Social Work. Journal of South China Agricultural University, 12(1), 105-111. Gao, W, & Smyth, R. (2011). What Keeps China's Migrant Workers Going? Expectations and Happiness among
China's Floating Population. Journal of the Asia Pacific Economy, 16(2), 163-182. Gong, J. (2013). 'Quality' of Gambling: Women Participating in Underground Lottery of Rural China. Retrieved
March 8, 2013, from http://youthfieldcamp.org/2012-report-gong-j/ Guo, Y. (2005). The Impacts of Illegal Lottey on the Financial Sector. Retrieved August 18, 2012, from
http://www.financialnews.com.cn/fz/200501310070.htm Harrell, C S. (1974). When a Ghost Becomes a God. Stanford Stanford University Press.
18
Herring, M, & Bledsoe, T. (1994). A Model of Lottery Participation. Policy Studies Journal, 22(2), 245-257. Hing, N, & Breen, H. (2001). Profiling Lady Luck: An Empirical Study of Gambling and Problem Gambling Amongst
Female Club Members. Journal of Gambling Studies, 17(1), 47-69. Hodgins, D C, Schopflocher, D P, Martin, C R, El-Guebaly, N, Casey, D M, Currie, S R, et al. (2012). Disordered
Gambling among Higher-Frequency Gamblers: Who Is at Risk? Psychological medicine, 42(11), 2433-2444.
Human Rights in China. (2002). Institutional Exclusion: The Tenuous Legal Status of Internal Migrants in China's Major Cities. London: Human Rights in China.
Humphreys, B R, Lee, Y S, & Soebbing, B P. (2011). Modeling Consumers' Participation in Gambling Markets and Frequency of Gambling. Journal of Gambling Business and Economics, 5(1), 1-22.
Hybels, J H. (1979). The Impact of Legalization on Illegal Gambling Participation. Journal of Social Issues, 35(3), 27-35.
Jackson, R. (1994). Demand for Lottery Products in Massachusetts. Journal of Consumer Affairs, 28(2), 313-325. Knight, J, & Gunatilaka, R. (2010). Great Expectations? The Subjective Well-Being of Rural–Urban Migrants in
China. World Development, 38(1), 113-124. Lee, Y-K, & Chang, C-T. (2008). A Social Landslide: Social Inequalities of Lottery Advertising in Taiwan. Social
Behavior and Personality: an international journal, 36(10), 1423-1437. Li, H, Mao, L L, Zhang, J J, Wu, Y, Li, A, & Chen, J. (2012a). Dimensions of Problem Gambling Behavior Associated
with Purchasing Sports Lottery. Journal of Gambling Studies, 28(1), 47-68. Li, H, Zhang, J J, Mao, L L, & Min, S D. (2012b). Assessing Corporate Social Responsibility in China's Sports Lottery
Administration and Its Influence on Consumption Behavior. Journal of Gambling Studies, 28(3), 515-540. Li, X. (2005). The 'Red Ball' Affair. from http://lixu1984.blogchina.com/81600.html Liang, H. (2004). The Illegal Lottery Took 1.3 Billion Yuan a Year from Peasants in Guangdong Province.
Retrieved April 4, 2013, from http://www.china.com.cn/chinese/2004/Aug/646803.htm Liang, H. (2009). Fanlan De Liuhecai Yu Mishi De Fa Shiyong (the Prevalance of Illegal Lottery and Issues in Law
Enforcement). (Yanjiusheng faxue) Graduate Law Review, 24(1), 1-12. Liu, X. (2011). Speculation as Salvation: The Politics of Possibilities in Southeastern China's Underground Lotteries.
Paper presented at the the American Anthropological Association Annual Meeting, Montreal. Loo, J M Y, Raylu, N, & S.Oei, T P. (2008). Gambling among the Chinese: A Comprehensive Review. Clinical
Psychology Review, 28(7), 1152-1166. McDaniel, S R, & Zuckerman, M. (2003). The Relationship of Impulsive Sensation Seeking and Gender to Interest
and Participation in Gambling Activities. Personality and Individual Differences, 35(6), 1385-1400. Mikesell, J L. (1991). Lottery Expenditure in a Non-Lottery State. Journal of Gambling Studies, 7(2), 89-98. Ministry of Finance. (2013). Sales of Lotteries as of December 2012. Retrieved March 10, 2013, from
http://zhs.mof.gov.cn/zhuantilanmu/caipiaoguanli/201301/t20130111_727675.html Nielsen, I, & Smyth, R. (2008). Who Wants Safer Cities? Perceptions of Public Safety and Attitudes to Migrants
among China's Urban Population. International Review of Law and Economics, 28(1), 46-55. Nielsen, I, Smyth, R, & Zhai, Q. (2010). Subjective Well-Being of China's Off-Farm Migrants. Journal of Happiness
Studies, 11(3), 315-333. Perez, L, & Humphreys, B. (forthcoming). The 'Who and Why' of Lottery: Empirical Highlights from the Seminal
Economic Literature. Journal of Economic Surveys. Perez, L, & Humphreys, B R. (2011). The Income Elasticity of Lottery: New Evidence from Micro Data. Public
Finance Review, 39(4), 551-570. Phongphaichit, P, Piriyarangsan, S, & Treerat, N. (1998). Guns, Girls, Gambling, Ganja: Thailand's Illegal Economy
and Public Policy. Chiang Mai: Silkworm Books. Pun, N. (1999). Becoming Dagongmei (Working Girls): The Politics of Identity and Difference in Reform China.
The China Journal, 42, 1-18. Rabinovitch, S. (2013). China's Lottery Boom Sparks Social Fears. Retrieved April 22, 2013, from
http://www.ft.com/cms/s/0/b1eec222-5bd6-11e2-bf31-00144feab49a.html
19
Rogers, P, & Webley, P. (2001). "It Could Be Us!": Cognitive and Social Psychological Factors in Uk National Lottery Play. Applied Psychology, 50(1), 181-199.
Schneider, F. (2005). Shadow Economies around the World: What Do We Really Know? European Journal of Political Economy, 21(3), 598-642.
Schneider, F, & Enste, D H. (2000). Shadow Economies: Size, Causes, and Consequences. Journal of Economic Literature, 38(1), 77-114.
Scott, F, & Garen, J. (1994). Probability of Purchase, Amount of Purchase, and the Demographic Incidence of the Lottery Tax. Journal of Public Economics, 54(1), 121-143.
Sellin, T. (1963). Organized Crime: A Business Enterprise. The Annals of the American Academy of Political and Social Science, 347(1), 12-19.
Steinmüller, H. (2011). The Moving Boundaries of Social Heat: Gambling in Rural China. Journal of the Royal Anthropological Institute, 17(2), 262-280.
Stranahan, H A, & Borg, M O. (1998a). Horizontal Equity Implications of the Lottery Tax. National Tax Journal, 51(1), 71-82.
Stranahan, H A, & Borg, M O. (1998b). Separating the Decisions of Lottery Expenditures and Participation: A Truncated Tobit Approach. Public Finance Review, 29(2), 99-117.
Sun, W. (2012). The Poetry of Spiritual Homelessness: A Creative Pratice of Coping with Industrial Alienation. In A. Kipnis (Ed.), Chinese Modernity and the Individual Psyche (pp. 67-88). New York: Palgrave Macmillan.
Tan, A K G, Yen, S T, & Nayga, J, Rodolfo M. (2010). Socio-Demographic Determinants of Gambling Participation and Expenditures: Evidence from Malaysia. International Journal Of Consumer Studies, 34(3), 316-325.
Tang, C S-k, & Oei, T P. (2011). Gambling Cognition and Subjective Well-Being as Mediators between Perceived Stress and Problem Gambling: A Cross-Cultural Study on White and Chinese Problem Gamblers. Psychology of Addictive Behaviors 25(3), 511-520.
Tse, S, Yu, A C H, Rossen, F, & Wang, C-W. (2010). Examination of Chinese Gambling Problems through a Socio-Historical-Cultural Perspective. The Scientific World Journal, 10, 1694-1704.
Venkatesh, S A. (2006). Off the Books: The Underground Economy of the Urban Poor. Cambridge: Harvard University Press.
Wang, W W, & Fan, C C. (2012). Migrant Workers' Integration in Urban China: Experiences in Employment, Social Adaptation, and Self-Identity. Eurasian Geography and Economics, 53(6), 731-749.
Welte, J W, Barnes, G M, Wieczorek, W F, Tidwell, M-C, & Parker, J. (2001). Gambling Participation in the U.S.: Results from a National Survey. Journal of Gambling Studies, 18(4), 313-337.
Wen, M. (2004). Underground Lottery Has Emerged in Tianjin. Retrieved September 1, 2012, from http://news.sina.com.cn/s/2004-08-10/00193978872.shtml
Yoong, D, Koon, T H, & Min, N C. (2013). 'This Is Not Gambling but Gaming': Methods of Promoting a Lottery Gaming Company in a Malaysian Daily. Discourse & Society, 24(2), 229-247.
Zeng, W. (2004). Dixia Liuhecai Jiemi (Revealing the Secrets of Underground Mark Six). Beijing: Minzu chubanshe. Zeng, Z, & Zhang, D. (2007). A Profile of Lottery Players in Guangzhou, China. International Gambling Studies,
7(3), 265-280. Zhang, Y. (2007). Guangnian, Xueli, Huanjin He Bocai Xingwei (Attitude, Qualifcation, Environment and Gambling
Behaviour). Shijie jingji (Journal of World Economy), 2007/6, 48-55. Zhang, Y, & Zheng, M. (2006). Hainan Bocai Canyulv Shizheng Fenxi (an Emperical Analysis of Lottery
Participation in Hainan). JIngji wenti tansuo (Inquiry into Economic Issues), 2006/4, 1-9. Zhao, Y. (1999). Leaving the Countryside: Rural to Urban Migration Decisions in China. American Economic
Review, 89(2), 281-286. Zhuang, P. (2013, March 3). Migrant Workers Feel Like Outsiders in Mainland Cities, Says Survey. Retrieved
April 29, 2013, from http://www.scmp.com/news/china/article/1170903/migrant-workers-feel-outsiders-mainland-cities-says-survey

20
Figure 1. A sample hint sheet
Note: A sample hint sheet for No. 28 Draw on 12 March, 2013. Punters believe that information on the special
number is contained somewhere on the sheet. The special number for this draw was 4; however hints related to
almost all 49 numbers can be found on the sheet. Punters believe that, if they do not win, it is because they are not
smart enough to find the correct information or it is divine will. The note at the top right corner shows that this sheet
is published by the spurious ‘Hong Kong Rich Women Network’ and the note at the bottom shows the contacts for Mr.
Zeng, a non-existent Taoist prophet at ‘Hong Kong Mark Six Information Centre’ who helps people get rich.

21
Table 1. Sample distribution
Tier of city* City Frequency Percent
First tier Guangzhou 1,285 32.64 Shenzhen 755 19.18
Second tier Zhuhai 194 4.93 Foshan 269 6.83 Dongguan 609 15.47 Zhongshan 197 4.98
Third tier Zhaoqing 197 5.00 Huizhou 200 5.08 Jiangmen 232 5.89 Total 3,937 100.00
*Tier of city is defined by the Bureau of Human Resources and Social Security of Guangdong Province according to the
minimum wage level and socioeconomic development.
22
Table 2. Participation in the illegal lottery
Frequency Percent
No 3,207 81.40 Yes 730 18.60
Formerly 311 42.60 Occasionally 326 44.66 Frequently 67 9.18 Constantly 26 3.56
Total 3,937 100.00

23
Table 3. Descriptive statistics
Variable Number of observations Mean (Std. Dev.)/percentage Min Max
Illegal lottery
Won prize 730 0.7027 (0.4574) 0 1 No (=0) 217 29.72% Yes (=1) 513 70.28% Normal amount of a bet (RMB) 717 46.29 (142.59) 1 2,000 Total amount of bets (RMB) 643 3,399.25 (13273.55) 1 180,000 Amount of the largest prize (RMB) 502 1,372.89 (4703.85) 1 60,000 Total amount of prizes (RMB)1 585 1,219.51 (4097.91) 0 50,000
Demographic, socioeconomic and employment characteristics
Gender 3,937 0.5540 (0.4972) 0 1 Female (=0) 1,756 44.60% Male (=1) 2,181 55.40%
Marital status 3,935 0.5136 (0.4999) 0 1 Unmarried (=0) 1,914 48.64% Married (=1) 2,021 51.36%
Age 3,934 29.59 (9.94) 14 71 <20 (=0) 541 13.75% 20-29 (=1) 1,582 40.21% 29-39 (=2) 1,040 26.44% 39-49 (=3) 548 13.93% >49 (=4) 223 5.67%
Schooling 3,934 9.24 (2.27) 6 15 Primary and below (=0) 871 22.14% Junior high (=1) 1,980 50.33% Senior high (=2) 592 15.05% Technological school (=3) 385 9.79% Graduate diploma (=4) 106 2.69%
Monthly income (RMB) 3,760 1101.20 (678.20) 0 20000 <700 (=0) 618 16.44 700-1000 (=1) 1,210 32.18 1000-1300 (=2) 1,006 26.76 1300-1600 (=3) 466 12.39 >1600 (=4) 460 12.23
Religious 3,937 0.2771 (0.4476) 0 1 No (=0) 2,872 72.29% Yes (=1) 1,101 27.71%
Household size 3,934 4.9426 (1.7705) 1 20
Have child(ren) 3,937 0.4989 (0.5001) 0 1 No (=0) 1,937 50.11% Yes (=1) 1,964 49.89%
Employment type 3,937 0.2223 (0.4158) 0 1 Formal (=0) 3062 77.77% Informal (=1) 875 22.23%
After-work activities
Read newspaper and book 3,937 0.4379 (0.4962) 0 1 No (=0) 2,213 56.21% Yes (=1) 1,724 43.79%
Study 0.0066 (0.0810) 0 1 No (=0) 3,911 99.34% Yes (=1) 26 0.66%
Do housework 3,973 0.2103 (0.4076) 0 1 No (=0) 3,109 78.97% Yes (=1) 828 21.03%
Look after child(ren) 0.0030 (0.0551) 0 1 No (=0) 3,925 99.70% Yes (=1) 12 0.30%
Play mah-jong and cards 3,973 0.1570 (0.3638) 0 1 No (=0) 3,319 84.3% Yes (=1) 618 15.7%

24
Participate in official lotteries 3,973 0.0691 (0.2536) 0 1 No (=0) 3,665 93.09 Yes (=1) 272 6.91
Subjective indicators
Social identity2 3,937 0.5677 (0.7912) 0 2 Peasant (=0) 2,451 62.26% Non-peasant (=1) 737 18.72% Ambiguous/overlapping (=2) 749 19.02%
Labour rights violated 3,059 0.2380 (0.4259) 0 1 No (=0) 2,331 76.20% Yes (=1) 728 23.80%
Adaptation to urban life3 3,826 1.4449 (0.6103) 0 2 Poor (=0) 240 6.27% Neutral (=1) 1,644 42.97% Good (=2) 1,942 50.76%
Life is difficult 3,976 0.8725 (0.8258) 0 3 Never (=0) 1,453 38.28% Occasionally (=1) 1,488 39.20% Often (=2) 741 19.52% Always (=3) 114 3.00%
Feel sense of social injustice 3,699 1.0695 (0.9928) 0 3 Never (=0) 1,285 34.74% Occasionally (=1) 1,290 34.87% Often (=2) 706 19.09% Always (=3) 418 11.30%
Feel sense of income injustice 3,627 0.8828 (0.9167) 0 3 Never (=0) 1,520 41.91% Occasionally (=1) 1,252 34.55% Often (=2) 613 16.90% Always (=3) 241 6.64%
Lack workplace belonging 3,723 0.8257 (0.9376) 0 3 Never (=0) 1,721 46.23% Occasionally (=1) 1,226 32.93% Often (=2) 480 12.89% Always (=3) 296 7.95%
Note: 1. includes some participants who had never won a prize; 2. ‘Social identity’ refers to migrant workers’ answer to the question: ‘What is your social identity in your own opinion?’ 3. ‘Adaption to urban life’ refers to migrant workers’ answer to the question: ‘How well do you adapt to urban life?’

25
Table 4. Determinants of participation in the illegal lottery, based on a binary probit regression
(1) (2) (3) (4) (5) (6)
Variable Marginal effect Marginal effect Marginal effect Marginal effect Marginal effect Marginal effect Male (ref: female) 0.1461 (11.12) *** 0.1369 (10.29) *** 0.1453 (11.09) *** 0.1377 (10.37) *** 0.0892 (6.45) *** 0.1368 (8.49) *** Age 0.0245 (4.68) *** 0.0229 (4.49) *** 0.0193 (3.00) ** Age
2/100 -0.0366 (-5.12) *** -0.0304 (-4.83) *** -0.0294 (-3.17) **
Married (ref: unmarried) -0.0179 (-0.63) -0.0030 (-0.16) 0.0105 (0.59) 0.0080 (0.45) 0.0120 (0.68) 0.0069 (0.31) Schooling 0.0011 (0.38) 0.0002 (0.06) 0.0012 (0.40) 0.0001 (0.04) 0.0008 (0.28) 0.0023 (0.63) Income 0.00003 (3.85) *** 0.00003 (4.05) *** 0.00004 (3.33) ** Religious (ref: no) 0.0569 (3.97) *** 0.0564 (3.94) *** 0.0593 (4.14) *** 0.0587 (4.10) *** 0.0574 (4.01) *** 0.0537 (3.13) *** Household size 0.0079 (2.31) * Have child(ren) (ref: no) 0.0240 (0.80) Informal job (ref: formal) -0.0377 (-2.12) * Tier of city (ref: first tier) Second tier -0.0301 (-2.05) * Third tier -0.0320 (-1.74) Income group (ref: <700) 700-1000 0.0251 (1.19) 0.0222 (1.05) 0.0218 (1.03) 1000-1300 0.0658 (2.94) ** 0.0648 (2.90) * 0.0518 (2.33) * 1300-1600 0.1062 (3.88) *** 0.1073 (3.91) *** 0.0863 (3.18) ** >1600 0.1047 (3.75) *** 0.1078 (3.81) *** 0.0736 (2.69) ** Age group (ref: <20) 20-29 0.0673 (4.14) ** 0.0585 (2.55) * 0.0504 (2.19) * 29-39 0.1056 (3.51) ** 0.0988 (3.30) ** 0.0700 (2.37) * 39-49 0.0279 (0.87) 0.0239 (0.75) 0.0114 (0.36) >49 -0.0160 (-0.43) -0.0141(-0.38) 0.0016 (0.04) After-work activities Reading (ref: no) -0.0355 (-2.37) ** Study (ref: no) -0.0323 (-0.41) Do housework (ref: no) -0.0157 (-1.00) Look after children (ref: no) 0.0103 (0.09) Play mah-jong and card games (ref: no) 0.1618 (8.90) *** Participate in official lottery (ref: no) 0.3408 (11.77) *** Subjective indicators Social identity (ref: peasant) Non-peasant 0.0018 (0.11) Ambiguous/overlapping 0.0388 (2.23) * Labour rights violated (ref: no) 0.0327 (1.81) * Adaptation to urban life (ref: poor) Neutral 0.0689 (1.83) Good 0.0547 (1.47) Life is difficult (ref: never) Occasionally 0.0265 (1.51) * Often 0.0758 (3.05)
26
Always 0.0608 (1.04) Social injustice (ref: never) Occasionally 0.0394 (2.06) * Often 0.0427 (1.70) Always 0.0982 (2.99) ** Income injustice (ref: never) Occasionally -0.0173 (-0.98) Often 0.0109 (0.47) Always -0.0143 (-0.43) Lack workplace belonging (ref: never) Occasionally -0.0363 (-2.11) * Often -0.0243 (-0.97) Always -0.0293 (-0.92)
Log likelihood -1675.9722 -1679.9372 -1685.7739 -1677.6312 -1547.1147 -1088.0299 LR chi
2 244.26 (12) 242.33 (10) 231.40 (9) 240.95 (12) 501.98 (18) 197.79 (22)
Prob>chi2 0.0000 0.0000 0.0000 0.0000 0.0000 0.0000
Number of observations 3,752 3,752 3,752 3,752 3,752 2,512
Notes: * p < 0.05, ** p < 0.01, *** p < 0.001; z-statistics in parentheses.

27
Table 5: Bivariate probit IV estimates for ‘life is difficult’ and ‘feel a sense of social injustice’
Variable Marginal effect
Life difficult (no=0, yes=1)
1 0.0515 (1.09) ***
Other control variables? Included Wald test of exogeneity: chi
2(1) 3.19
Prob > chi2 0.0105
Number of observations 2,767
Social injustice (no=0, yes=1)
2 0.0821 (1.23) ***
Other control variables? Included Wald test of exogeneity: chi
2(1) 5.49
Prob > chi2 0.0192
Number of observations 2,642
Notes: * p < 0.05, ** p < 0.01, *** p < 0.001; z-statistics in parentheses. IVs: 1. I was penalized for not holding a valid temporary residence permit (zanzhu zheng); I need to pay a sponsorship fee (zanzhu fei) for my child to attend the local public school; Local people do not trust me (Yes=1, No=0 in each case); 2. I am willing to participate in collective action to fight for my rights and benefits if they are violated (Yes=1, No=0).

28
Table 6. Determinants of expenditure on the illegal lottery, based on truncated tobit regression
Normal amount of a bet Total amount of bets
Variable Coefficient Marginal effect Coefficient Marginal effect
Male (ref: female) 67.78 (7.18) *** 14.27 5865.98 (6.64) *** 1189.61 Age 12.24 (3.60) *** 2.58 869.57 (2.75) ** 176.35 Age
2/100 -17.98 (-3.82) *** -3.78 -1291.81 (-2.98) ** -261.98
Married (ref: unmarried) -12.59 (-1.01) -2.65 -37.48 (-0.03) -7.60 Schooling 0.22 (0.11) 0.05 17.91 (0.10) 3.63 Income 0.02 (3.47) ** 0.004 2.33 (4.73) *** 0.47 Religious (ref: no) 31.64 (3.49) *** 6.66 3369.47 (3.98) *** 678.32 Household size 4.00 (1.77) 0.84 326.20 (1.52) 65.1595 Informal job (ref: formal) -10.54 (-0.95) -2.22 -1065.79 (-1.03) -216.14 Read newspaper and book (ref: no) -19.35 (-2.23) *** -4.07 -1604.09 (-1.98) * -325.31 Play mah-jong and card games (ref: no) 85.29 (8.48) *** 17.96 6314.02 (6.64) *** 1280.47 Participate in official lottery (ref: no) 105.06 (8.03) *** 22.12 11410.61 (9.25) *** 2314.04 Constant -467.12 (-7.90) *** -40340.75 (-7.30) ***
Log likelihood -5264.3687 -7472.8678 LR chi
2 388.45 (12) 369.79 (12)
Prob>chi2 0.0000 0.0000
Number of observations 3,740 3,667 Censored observations 3,057 3,057 Uncensored observations 683 610
Notes: * p < 0.05, ** p < 0.01, *** p < 0.001; t-statistics in parentheses.

29
Table 7. Determinants of patterns of participation in the illegal lottery, based on multinominal logistic regression
Formerly Occasionally Frequently Constantly
Variable Relative-risk ratio Relative-risk ratio Relative-risk ratio Relative-risk ratio
Male (ref: female) 1.9313 (4.64) *** 2.0193 (4.71) *** 8.4424 (4.02) *** 3.1265 (1.76) Age 1.1510 (2.58) * 1.1495 (2.45) * 1.0169 (0.15) 1.2392 (1.13) Age
2/100 0.8109 (-2.71) ** 0.8095 (-2.64) ** 0.9647 (-0.25) 0.7559 (-1.06)
Married (ref: unmarried) 0.7968 (-1.20) 1.2053 (0.96) 1.9307 (1.56) 0.8405 (-0.29) Schooling 1.0036 (0.12) 1.0135 (0.44) 1.0670 (1.03) 0.8731 (-1.32) Income 1.0002 (1.96) * 1.0002 (1.98) 1.0000 (-0.19) 1.0003 (2.00) * Religious (ref: no) 1.6594 (3.81) *** 1.3874 (2.36) ** 1.1757 (0.53) 1.0459 (0.09) Household size 1.0347 (0.99) 1.0498 (1.43) 1.0415 (0.57) 1.1240 (1.17) Informal job (ref: formal) 0.9113 (-0.55) 0.8786 (-0.77) 1.0977 (0.29) 0.8214 (-0.37) Read newspaper and book (ref: no) 0.8990 (-0.78) 0.7257 (-2.37) ** 0.5036 (-2.39) ** 0.2844 (-2.61) ** Play mah-jong and card games (ref: no)
2.3926 (5.91) *** 2.8584 (7.44) *** 2.6602 (3.51) *** 3.9139 (3.17) **
Participate in official lottery (ref: no) 2.0249 (3.06) ** 7.6407 (11.62) *** 14.6775 (8.97) *** 24.6662 (6.84) ***
Log likelihood -2235.9082 LR chi
2 601.15 (48)
Prob>chi2 0.0000
Pseudo R2 0.1185
Number of observations 3,752
Notes: * p < 0.05, ** p < 0.01, *** p < 0.001; z-statistics in parentheses; The reference group is non-participants and all estimated coefficients for this group are normalised to zero.