PARTIAL LEAST SQUARES INTEGRATED NATIONAL ... LEAST SQUARES...Kajian ini bertujuan untuk menyediakan...
24
I PARTIAL LEAST SQUARES INTEGRATED NATIONAL WATER QUALITY STANDARDS (NWQS) FOR INDEXING OF WATER QUALITY FROM INDUSTRIAL EFFLUENT FREDA EMMANUEL 14030190 A thesis submitted In fulfilment of the requirements for the Master of Environmental Science (Land Use and Water Resource Management) Faculty of Resource Science and Technology Universiti Malaysia Sarawak 2015
Transcript of PARTIAL LEAST SQUARES INTEGRATED NATIONAL ... LEAST SQUARES...Kajian ini bertujuan untuk menyediakan...
I
PARTIAL LEAST SQUARES INTEGRATED NATIONAL WATER QUALITY
STANDARDS (NWQS) FOR INDEXING OF WATER QUALITY FROM
INDUSTRIAL EFFLUENT
FREDA EMMANUEL
14030190
A thesis submitted
In fulfilment of the requirements for the Master of Environmental Science
(Land Use and Water Resource Management)
Faculty of Resource Science and Technology
Universiti Malaysia Sarawak
2015

II
DECLARATION
I, FREDA EMMANUEL hereby declare that the work in this thesis is my own except for
quotations and summaries which have been duly acknowledged.
Date: _____________________ ___________________
(FREDA EMMANUEL)

III
ACKNOWLEDGEMENT
I owe this achievement to many individuals in my life who believed in my abilities to
pursue my studies, a goal I once let go due to other work and life commitments.
I will forever be grateful to my husband, my daughter and other family members who
know that my priorities remained unchanged despite the many hours I invest in this study,
and helped me find time to make this study an easy task to tackle.
However, without the guidance of my supervisor, Dr. Sim Siong Fong, none of my hard
work and effort would be of any good use. Discussions with her have always been one that
I look forward to throughout the course of this thesis, as she would always explain things
thoroughly to me whenever I am in doubts. Thanks, Dr. Sim for letting me become a part
of this innovative effort which I know will make huge contribution to the field of water
quality evaluation in the future.
I would also like to take this opportunity to convey my gratitude to Dr. Tay Meng Guan
who has continuously encouraged me to persevere through the temporary setbacks and
finish strong. The staffs of FRST and Pn. Rosmina of Faculty of Engineering also deserved
more credit for their work and help that they provide to students like myself.
Lastly, this achievement is dedicated to Prof. Dr. Andrew Alek Tuen who taught me that
one can and should never stop learning in life, an advice I took so literally that I am now a
better person and student.

IV
Table of Contents
PAGE
TITLE I
DECLARATION II
ACKNOWLEDGEMENT III
TABLE OF CONTENTS IV-VI
LIST OF ABBREVIATIONS VII
LIST OF TABLES VIII
LIST OF FIGURES IX
LIST OF APPENDICES X
ABSTRACT & ABSTRAK XI
1.0 INTRODUCTION ........................................................................................................... 1
1.1 Research Background ............................................................................................. 1
1.2 Statement of Problem .............................................................................................. 4
1.3 Objectives of Study ................................................................................................. 6
2.0 LITERATURE REVIEW ................................................................................................ 7
2.1 Introduction ............................................................................................................. 7
2.2 Water Quality .......................................................................................................... 7
2.3 Water Quality Parameters ....................................................................................... 8
2.3.1 Physical Parameters ......................................................................................... 8
2.3.2 Chemical Parameters ....................................................................................... 9
2.3.3 Inorganic Chemical Parameters ..................................................................... 11
2.4 River Pollution Issues in Malaysia ....................................................................... 12
2.5 River Classifications in Malaysia ......................................................................... 13
2.6 Partial Least Squares – Water Quality Index (PLS-WQI) .................................... 15

V
3.0 MATERIALS AND METHODS .................................................................................. 17
3.1 Study Area ............................................................................................................ 17
3.2 Sampling Frequency and Duration ....................................................................... 19
3.3 Sample Collection and Preservation ..................................................................... 19
3.4 Analysis Methods and Instrumentation ................................................................ 19
3.4.1 In-situ Water Quality Measurement .............................................................. 19
3.4.2 Laboratory Analysis ...................................................................................... 19
3.4.2.1 Biochemical Oxygen Demand (BOD) ....................................................... 20
3.4.2.2 Chemical Oxygen Demand ........................................................................ 20
3.4.2.3 Total Suspended Solids .............................................................................. 21
3.4.2.4 Ammoniacal Nitrogen ................................................................................ 22
3.4.2.5 Phosphorus ................................................................................................. 22
3.4.2.6 Oil & Grease .............................................................................................. 23
3.4.2.7 Heavy Metals (Iron & Manganese) ........................................................... 23
3.5 Evaluation of Water Quality Using Various Method ........................................... 24
3.5.1 DOE-WQI ...................................................................................................... 24
3.5.2 National Water Quality Standards (NWQS) ................................................. 25
3.5.3 Partial Least Squares – Water Quality Index (PLS-WQI) ............................. 26
4.0 RESULTS AND DISCUSSION .................................................................................... 27
4.1 Water Quality Results ........................................................................................... 27
4.2 Comparison of Various Water Quality Evaluation Methods ................................ 30
4.2.1 Based on 6 pre-determined DOE-WQI parameters ....................................... 30
4.2.1.1 Water Quality Index (WQI) ....................................................................... 30
4.2.1.2 Comparison of DOE-WQI, PLS-WQI and Average NWQS ..................... 31
4.2.1.3 Sensitivity of DOE-WQI, PLS-WQI and Average NWQS ....................... 33
4.2.2 Inclusion and Restriction of Parameters ........................................................ 33
4.2.2.1 Sensitivity of PLS-WQI and Average NWQS ........................................... 38
5.0 CONCLUSION AND RECOMMENDATION ............................................................ 39
5.1 Conclusion ............................................................................................................ 39
5.2 Recommendation .................................................................................................. 40

VI
6.0 REFERENCES .............................................................................................................. 42
APPENDIX A ..................................................................................................................... 45
APPENDIX B ...................................................................................................................... 46
APPENDIX C ...................................................................................................................... 47
APPENDIX D ..................................................................................................................... 48
APPENDIX E ...................................................................................................................... 49
APPENDIX F ...................................................................................................................... 50
APPENDIX G ..................................................................................................................... 51
APPENDIX H ..................................................................................................................... 52
APPENDIX I ....................................................................................................................... 58

VII
LIST OF ABBREVIATIONS
BOD Biochemical Oxygen Demand
COD Chemical Oxygen Demand
DID Department of Irrigation & Drainage
DO Dissolved Oxygen
DOE Department of Environment
eNWQS Extended National Water Quality Standards
mg miligram
l liter
NWQS National Water Quality Standards
NH3-N Ammoniacal Nitrogen
P Phosphorus
PLS Partial Least Squares
SI Sub-index
TSS Total Suspended Solid
UNIMAS Universiti Malaysia Sarawak
WS Water Sampling
WQI Water Quality Index

VIII
LIST OF TABLES
PAGE
Table 3.1 Details of sampling stations 18
Table 3.2 DOE-WQI sub-index calculation formula 25
Table 4.1 Average water quality results 27
Table 4.2 Classification corresponding to parameters included in indexing
process at Station WS1
35
Table 4.3 Classification corresponding to parameters included in indexing
process at Station WS2
36
Table 4.4 Concentration of Fe and Mn as reported in other studies and
present study
36
Table 4.5 Classification corresponding to parameters included in indexing
process at Station WS3
37

IX
LIST OF FIGURES
PAGE
Figure 3.1 Location map of the study area indicating sampling stations 17
Figure 3.2 Samples were collected from stations along Sejingkat River with
many industries located along its banks
18
Figure 3.3 Grab samples of river water were collected using water sampler 18
Figure 3.4 in-situ measurements of temperature, pH and DO were routinely
taken at the time of sampling
18
Figure 4.1 Illegal dumping site and ship parked near Station WS3 29
Figure 4.2 Construction involving heavy machineries along the riverbank,
upstream of Station WS2
30
Figure 4.3 Water quality indexes of all sampling stations 31
Figure 4.4 Comparison of various evaluation methods 32
X
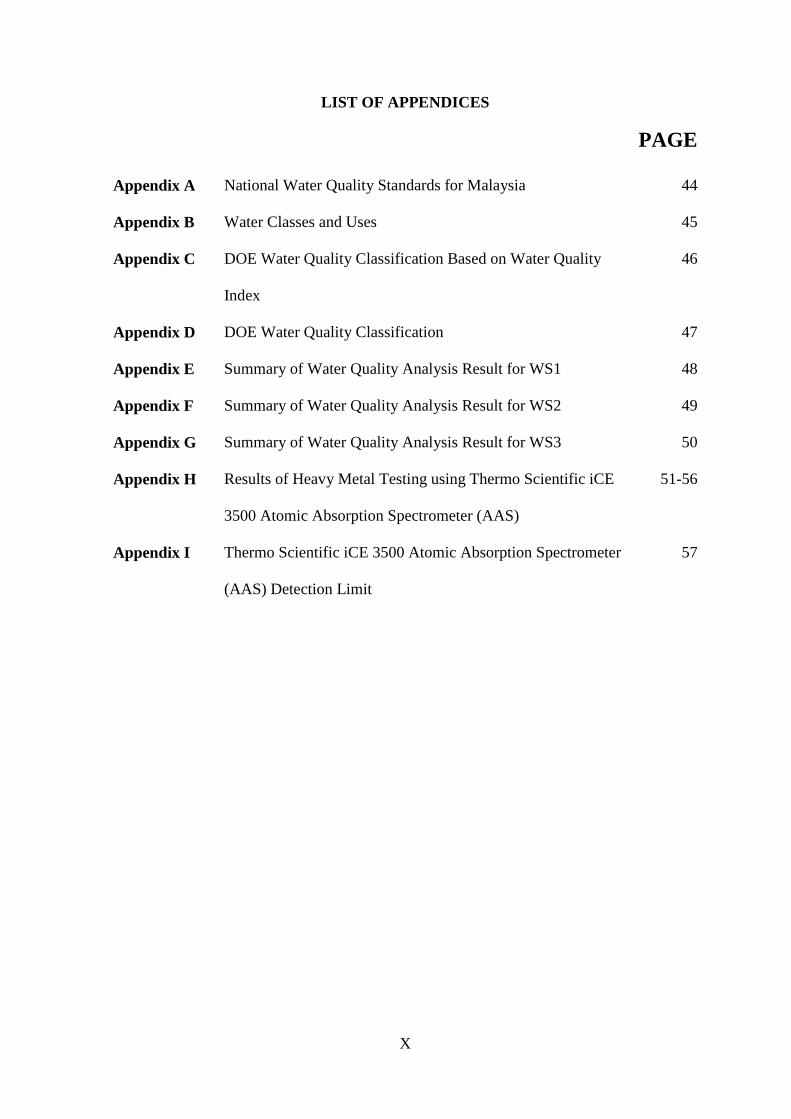
LIST OF APPENDICES
PAGE
Appendix A National Water Quality Standards for Malaysia 44
Appendix B Water Classes and Uses 45
Appendix C DOE Water Quality Classification Based on Water Quality
Index
46
Appendix D DOE Water Quality Classification 47
Appendix E Summary of Water Quality Analysis Result for WS1 48
Appendix F Summary of Water Quality Analysis Result for WS2 49
Appendix G Summary of Water Quality Analysis Result for WS3 50
Appendix H Results of Heavy Metal Testing using Thermo Scientific iCE
3500 Atomic Absorption Spectrometer (AAS)
51-56
Appendix I Thermo Scientific iCE 3500 Atomic Absorption Spectrometer
(AAS) Detection Limit
57

XI
Partial Least Squares Integrated National Water Quality Standards (NWQS) for
Indexing of Water Quality from Industrial Effluent
Freda Emmanuel
Master of Environmental Science
Faculty of Resource Science and Technology
Universiti Malaysia Sarawak
ABSTRACT
This study attempts to provide a better classification of water quality that is of accurate representation of the
actual health of river water and is achieved by applying existing water quality evaluation method used in our
country, namely DOE-WQI and average NWQS as well as a newly developed model based on Partial Least
Squares (PLS) regression and the guideline of NWQS, called PLS-WQI in the indexing process. Indexing
with DOE-WQI equation method using six (6) pre-determined DOE-WQI parameters revealed that all
stations falls under Class III with a slightly polluted status. PLS-WQI and average NWQS corresponds well
with DOE-WQI method and it is also observed that average NWQS often provides better classification of
water quality among all methods studied. Further indexing with PLS-WQI using the algorithm programmed
in Matlab R2009b which allows for the consideration of only parameters that impart the greatest influence on
water quality has resulted in a better presentation of the actual water quality at each station. PLS-WQI
predicted Stations WS1 and WS2 to be of Class 3.66 with parameters pH, DO, BOD and COD at Station
WS1 and pH, DO and COD at Station WS2. Meanwhile, Station WS3 is predicted to be of Class 4.45 when
indexing was carried out with variables pH, DO, BOD, COD, TSS, AN, OG and Mn. Therefore, PLS-WQI is
flexible and is thoroughly more sensitive compared to the other two (2) existing methods.
Keywords: water quality, water quality index, partial least squares regression, Sejingkat River.
Partial Least Squares Integrated National Water Quality Standards (NWQS) untuk
Pengindeksan Kualiti Air dari Effluen Perindustrian
Freda Emmanuel
Sarjana Sains Persekitaran
Fakulti Sains dan Teknologi Sumber
Universiti Malaysia Sarawak
ABSTRAK
Kajian ini bertujuan untuk menyediakan klasifikasi kualiti air yang dapat memberikan perwakilan kesihatan
sebenar air sungai dan dicapai melalui kaedah penilaian kualiti air yang sedia ada di negara kita iaitu DOE-
WQI dan purata NWQS serta model yang dibangunkan berdasarkan Partial Least Squares (PLS) regression
dan garis panduan daripada NWQS, iaitu PLS-WQI. Pengindeksan melalui DOE-WQI menggunakan enam
(6) parameter yang telah ditetapkan mengelaskan semua stesen dalam kelas III dengan status sedikit tercemar.
PLS-WQI dan NWQS purata didapati memberikan klasifikasi yang sepadan dengan DOE-WQI dan ianya
juga didapati bahawa NWQS purata sering memberikan klasifikasi yang lebih baik berbanding kaedah lain.
Pengindeksan berikutnya dengan PLS-WQI melalui algoritma yang diprogramkan dalam Matlab R2009b
yang mempertimbangkan hanya parameter yang menjejaskan kualiti air telah memberikan klasifikasi yang
mencerminkan kualiti air sebenar di setiap stesen. PLS-WQI meramalkan Stesen WS1 dan WS2 berada
dalam kelas 3.66 dengan parameter pH, DO, BOD dan COD di Stesen WS1 dan parameter pH, DO dan COD
di Stesen WS2. Stesen WS3 pula dikategorikan dalam Kelas 4.45 melalui pengindeksan dengan parameter
pH, DO, BOD, COD, TSS, AN, OG dan Mn. Oleh itu, PLS-WQI adalah fleksibel dan lebih sensitif
berbanding dua (2) kaedah yang sedia ada.
Kata kunci: kualiti air, indeks kualiti air, partial least squares regression, Sungai Sejingkat.

1
1.0 INTRODUCTION
1.1 Research Background
Good quality water is essential for all living things and our dependency on this natural
resource remain unaffected even as we develop into an era of modern technologies.
However, our natural resources like river ecosystem suffer the consequences which stems
from our actions to achieve higher level of urbanization and industrialization.
More areas are specified as industrial zone such as Sejingkat Industrial Zone, located
approximately 20 km from Kuching town, comprises of various factories which
manufactures different products such as glue resin, plywood and flour to meet market
demand.
The establishment of industrial zone not only manufacture useful products to meet demand,
but at the same time generates wastes that are complex in composition. When these wastes
are discharged into the environment without prior treatment, it creates deleterious effect
such as pollution and poses serious threat to human and the routine functioning of
ecosystem.
The discharge of industrial effluents into the river became an important issue and received
numerous attentions from environmentalist, policy makers and general public alike over
the past few decades because of the declining health of the river water. Environmental
Quality (Industrial Effluent) Regulations 2009 defines industrial effluent as “any waste in
the form of liquid or wastewater generated from manufacturing process including the
treatment of water for water supply or any activity occurring at any industrial premises”.
The law further prohibits any spill, accidental discharge or leakage of industrial effluent

2
into soil and inland waters or Malaysian waters as the presence of toxic heavy metal can
have an adverse impact on the environment.
Therefore, continuous monitoring of river water quality is vital as it forms the basis of
water pollution control (Foran & Fink, 1993). In addition, periodic monitoring of water
quality permits better understanding of the general condition of the river water thus
allowing detection of any emerging pollutants in the river ecosystem.
Regular water quality monitoring programme has been carried out by Department of
Environment (DOE) since 1978 in an effort to establish status and observe trends of water
quality over time in addition to detecting water quality changes and identifying pollution
sources (Country Report on Pollution, 2011). The tasks of evaluating river water quality
status based on pollution load and designation of classes of beneficial uses were achieved
through Water Quality Index (WQI) stipulated under the National Water Quality Standards
(NWQS) for Malaysia (WEPA, 2006). The WQI was formulated by DOE hence the term
DOE-WQI is also used interchangeably. While NWQS serves as a benchmark to provide
recommended water quality criteria for respective parameters, WQI simplifies the complex
water quality data into a single number ranging from 0 to 100 with larger value
corresponding to better water quality.
By summarizing complex water quality data into a numerical score, people without
background knowledge but are concerned about the health of the environment such as the
general public and policy makers can be more informed in a consistent manner and in an
easily understandable format (Bordalo, et.al, 2006) Furthermore, by classifying water into
various beneficial uses, it provides hindsight of what the water can be used for and how.
For example, a slightly polluted water body would require treatment prior to use for

3
drinking or domestic purposes and much polluted water would only be suitable for limited
purposes.
Water quality indexing is a common method used by many countries to assess the overall
status of the rivers. Although these indices differ from country to country, it is based on a
few pre-determined physico-chemical parameters and compounded to numerical rating for
evaluation of river water quality (Bhargava, 1983; Pesce & Wunderlin, 2000). In Malaysia,
the parameters considered are pH, dissolved oxygen (DO), biochemical oxygen demand
(BOD5), chemical oxygen demand (COD), ammoniacal nitrogen (NH3-N) and total
suspended solids (TSS).
Following the advancement in technology and the growing water quality database,
researchers have directed their focus to implement advanced statistical approaches to
manage high dimensional data such as water quality data (Abdullah, et al., 2008; Gazzaz et
al., 2012). This study aims to employ the Partial Least Squares integrated National Water
Quality Standards for prediction of river water quality affected by the industrial effluent.
Conventionally, the National Water Quality Standards (NWQS) categorises water quality
into 5 discreet classes according to parameters. No mathematical calculation is available to
derive a numerical score to indicate the overall water quality. With the integration of PLS,
a continuous variable is derived with an increasing number corresponds to more polluted
water. This approach is an extension to the existing National Water Quality Standards with
two distinct improvements:
Instead of categorising the water quality into five classes according to parameters,
an index of continuous variable can be computed to suggest the overall water
quality offering better sensitivity. For example, two water samples with indices
2.05 and 2.95 indicate that the latter is more polluted.

4
The partial least squares integrated water quality index allows selection of
indicators. Conventionally, parameters considered are pre-determined according to
methods. For example, DOE-WQI uses 6 parameters for determination of water
quality index; for PLS-WQI, users can determine the parameters and the number of
parameters used for computation of WQI.
1.2 Statement of Problem
Our river ecosystem is never static. Indeed, it is subjected to constant change caused by
physical forces and introduction of pollutants that threaten the quality of life. In addition,
as population grows, a corresponding increase in wastes generated is observed as the Earth
resources deplete at a worrying rate. This is a serious global issue as well as in our country,
Malaysia as we advance into a developing nation through various development and
industrialization projects that threatens the sustainability of water resources.
Department of Environment (DOE), Department of Irrigation & Drainage (DID) as well as
other state level agencies have been conducting extensive water quality classification and
monitoring of rivers throughout the states in Malaysia. According to Malaysia
Environmental Quality Report (EQR, 2012), DOE alone has been monitoring 473 rivers at
832 manual stations and 10 continuous water quality monitoring stations throughout
Malaysia using DOE-WQI evaluation method that summarizes complex water quality data
into an index that reflects the quality of the river water.
However, despite the on-going evaluation and monitoring efforts, reports indicated a
downward trend of water quality year by year. This could be attributed to the limitations of
the evaluation method which are restricted to 6 pre-determined parameters which may fail
to accurately communicate the water quality information (Zainudin, 2010).

5
Furthermore, the various inputs of pollutants along the stretch of a river alters the quality
of the river and changes the dynamic of river water as it runs its course. A particular station
may receive a good WQI and yet have its quality impaired by other constituents that are
not accounted for in the index. An industrial zone area for instance would discharge
industrial effluents consisting of new toxic pollutants thus making these heavy metals more
polluting to the receiving water than other constituents. Therefore, the levels of heavy
metal constituents should be monitored and accounted for in the water quality evaluation
of the particular river.
However, the function of the index system of evaluation used in our country to provide
precise information on water quality is incapacitated as it remained unchanged or
undergoes very little change over the past few years. Such a loophole in the one-size-fits-
all evaluation system could result in severe degradation of water quality if it continues to
classify river water to respective beneficial classes which are not representative of the
actual condition of the water.
Unless serious mitigation are applied to expel the negative impact contributed by pollutants,
total water availability in our country will also decline in addition to degrading quality as a
result of high cost of treating polluted waters for consumption.
Lastly, an efficient water quality monitoring index is even more essential now that there
are more rivers to monitor throughout Malaysia. Malaysia Environmental Quality Report
(EQR) has stated that in 2012, nine (9) rivers within the Klang River Basin were added to
the national river water quality monitoring programme. As the water quality monitoring
stations increase, more samples will be collected from the monitoring stations, thus causing
the amount of data generated over time to swell and making the task of evaluating water
quality data challenging (Gazzaz et al., 2012). The capability of the current evaluation

6
method needs to be improved so that it will be able to manage and evaluate large water
quality database.
1.3 Objectives of Study
The general objective of this study is to assess the quality of river water at Sejingkat
Industrial Zone with the aim of providing a better classification that is of accurate
representation of the actual health of the river water. The specific objectives are as outlined
below:
To identify the key parameters responsible of significant change in river water
quality
To determine the water quality based on WQI, average NWQS and PLS-WQI using
6 pre-determined parameters and other additional parameters; and
To ascertain the sensitivity of each water quality evaluation method

7
2.0 LITERATURE REVIEW
2.1 Introduction
Water is essential for the survival of plants, living organisms and especially human as most
of us rely greatly on water resources in different aspects of life (Reeve, 2002). However,
despite our reliance on clean water, we continue to severely degrade the quantity and
quality of rivers and streams worldwide through our various activities.
Agricultural production and industrial activities are some of the examples of human
activities that impact water quality to an extent that weakens or destroy natural ecosystems.
Furthermore, although both water quality and water quantity are important, the former has
received far less investment, scientific support in recent decades compared to the latter
(Palaniappan et al., 2010).
Besides, it is estimated that developing countries discharge more than 70 percent of
untreated industrial wastes into the river water (UN Water Statistics, 2004). Such poor
management of wastewater will result in poor quality of water hence the decreased
availability of clean water for future use. Therefore, on-going monitoring and good data
are vital in order to improve water quality.
2.2 Water Quality
Water quality refers to chemical, physical and biological characteristics of water and is
often indicated by measuring the concentration of various water quality parameters. The
set of parameters monitored are often chosen based on the objective of the monitoring and

8
is compared to a set of standards against which compliance can be assessed. Once the
quality of the water body has been ascertained, it can be determined to be beneficial for
various purposes, namely drinking, irrigation and many more.
In addition, water quality information also relates to the level of pollution in the water as it
measures the suitability of water for a particular use. Therefore, in order to obtain a
comprehensive and representative water quality, selection of a set of correct parameters
that changes the water quality over time is vital.
2.3 Water Quality Parameters
The presence of contaminants which would alter the quality and characteristics of water
are used as an indicator to indicate the overall quality of the water and can be categorised
into physical, chemical and biological parameters.
2.3.1 Physical Parameters
2.3.1.1 Temperature
Water temperature is measured on a linear scale of degree Celcius and affects the solubility
of oxygen in water as well as water chemistry and the functioning of aquatic organisms.
For example, a change in water temperature will affect the rate of photosynthesis,
metabolic rates of aquatic organisms and the way that organisms react to toxic wastes.
However, water temperature varies with several factors such as season, geographic
location, stream flow and input of industrial effluent.

9
2.3.1.2 Suspended Solids
Suspended solids are an indication of the amount of suspended solids in water. A large
volume of suspended sediment will reduce light penetration, thus suppressing
photosynthesis activity of phytoplankton. The decline in primary production will impact
the survival of aquatic organisms in the water. Sediment deposition may also affect the
physical characteristics of the water and lower its functionality for certain purposes such as
drinking and recreational. In addition, sediment deposited are generally negatively charged
and attracts positively charged molecules such as phosphorus and heavy metals. These
positively charged pollutants will further aggravate the declining quality of the water.
2.3.1.3 Oil & Grease
Oil & grease is a good indicator of any indiscriminate dumping of waste oil or oily waste
into the water.
2.3.2 Chemical Parameters
2.3.2.1 pH
pH stands for the hydrogen’s potential and is a general measure of the acidity or alkalinity
of water. pH measures the hydrogen ion concentration which is subjected to change
triggered by wastewater discharge or atmospheric deposition, to name a few. As the pH of
water decreases (water becomes more acidic) or increases (water becomes more basic),
concentrations of other substances in water will become more toxic.
2.3.2.2 Dissolved Oxygen
Concentration of dissolved oxygen (DO) in water is a measure of the amount oxygen
available in water, essential for aquatic life and is often stated in milligrams per liter (mg/l)

10
or as a percent saturation, the later which is temperature dependent. Percent saturation
denotes the potential capacity of the water to hold oxygen that is present. The solubility
and amount of dissolved oxygen in water is influenced by water temperature, quantity of
sediment among many others.
2.3.2.3 Biological Oxygen Demand
Biochemical oxygen demand (BOD) measures the amount of oxygen used by aerobic
bacteria during decomposition, and indicates organic pollution and poor water quality.
High quantity of organics in water depletes the dissolved oxygen in water and would
threaten the existence of aquatic living things.
2.3.2.4 Chemical Oxygen Demand
Chemical Oxygen Demand (COD) is also a measure of organics in the water. COD test
predicts the amount of oxygen used during the decomposition of organic matter and the
oxidation of inorganic chemicals such as heavy metals.
2.3.2.5 Ammoniacal Nitrogen
Ammonia is a nutrient required for life but is harmful when it is present in excess as it may
accumulate in the organism and alter the metabolism. Sources of ammoniacal nitrogen are
often from ammonia rich fertilizer.
2.3.2.6 Phosphorus
Like nitrogen, phosphorus is an essential nutrient for aquatic living organism and is
typically scarce in water. Therefore, even slight increase in concentration can set off a
whole chain of undesirable events in a given water body. Sources of phosphorus are both
natural and human, namely from soil and rocks, wastewater plants and water treatment.

11
Nonetheless, human activities contributed to the excessive loading of phosphorus into
many freshwater systems (Holtan et al., 1988)
2.3.3 Inorganic Chemical Parameters
2.3.3.1 Heavy Metal (Iron and Manganese)
Heavy metals are elements that normally occur at very low concentrations in the
environment, and are essential element for many living things. However, as the releases of
these trace metals into the environment can occur through several sources such as natural
processes and human activities, toxicity which is associated with excess concentration
becomes a concern.
The largest natural source of these metals is from rocks and soils that are directly exposed
to water, while anthropological source accounts for the discharge of liquid wastes from
various industries and activities into the water body. Nonetheless, the concentration of
metals in natural water from natural origin is minor as compared to anthropological source
such as through the discharge of liquid wastes into the water body.
Of all common metallic elements present in natural water, Fe is chosen as one of the heavy
metal parameters to be studied because Fe is the second most abundant metal (Enthaler et
al., 2008) as well as the most essential trace element in living things such as human and
animal. Mn is studied because it often occur naturally together with Fe, thus making it
imperative to monitor the level of both Fe and Mn in natural water so as to avoid high
concentration which could pose risk to the ecosystem. According to Natural Water Quality
Standards (NWQS), in natural waters both Fe and Mn are present at concentrations lower
than 1.0 mg/L and 0.1 mg/L respectively.

12
2.4 River Pollution Issues in Malaysia
The current environmental quality report published by DOE in 2014 revealed that 273 out
of 473 rivers monitored throughout the nation were classified as clean, 161 as slightly
polluted and 34 as polluted. Of the 34 polluted rivers, 19 rivers were classified as Class III,
14 as Class IV and one (1) as Class V using the DOE-WQI evaluation method.
Although only a small portion of the river ecosystem are deemed polluted, the value may
increase over time if no action is taken to maintain the existing clean rivers and improve
the ones classified as slightly polluted. However, because water pollution status is
published as an index, it is difficult to obtain a precise picture of the severity of river
pollution in Malaysia, a setback which could further hinder suitable water management
effort.
Furthermore, as more industries and factories are established, more effluents containing
toxic pollutants are discharged or dumped into the river water, which constituents vary
from one industry to another. The overall water quality is sometimes difficult to evaluate
due to the excess concentrations of different constituents in water from different sampling
points (Bakan et. al., 2010). Therefore, different area with diverse source of pollutants
need different evaluation index (Mamun et al., 2009) but the current index system used to
evaluate the river water quality has undergone very little changes.
As of recently many attentions have been focused on the potential threat that heavy metals
have onto the river environment (Tarique, 2008; Fang & Hong, 1999), many of which are
attributed to their toxicity and ability to accumulate in the food chain (Bashir et al., 2013).
Hossain et al. (2012) conducted a study to evaluate the quality of our river water and found
that not only does the quality deteriorate over time but it is especially due to input from

13
industries that are both conventional and non-conventional into the river flow. The
literature further revealed that pollution levels are higher in the middle stations of the river,
where the industries are discharging effluents, as compared to stations located upstream
and midstream.
In an aquatic ecosystem such as Sg. Sejingkat, there are various sources of pollutants into
the water body including river discharge, deposition from the atmosphere and industrial
waste input. The many studies conducted on the toxic effects of heavy metals have directed
the focus towards the impact from industrial discharge, monitoring the level of heavy
metals, particularly iron and manganese.
Iron and manganese have been identified as essential elements to the health of both human
and organisms at low quantities but toxic at slightly higher quantities (Nobi et al., 2010).
2.5 River Classifications in Malaysia
The traditional water quality report which details each parameter is found to be too
technical for those without background knowledge on water quality such as general public
and policy makers. Furthermore, adopting foreign criteria to local condition was not
suitable due to several factors such as differences in environmental characteristics and
climate.
Therefore, in 1978, the Department of Environment (DOE) Malaysia developed Water
Quality Index (WQI) guided by the limits stipulated in National Water Quality Standards
(NWQS) to communicate such information to those with concern. The WQI is an opinion-
poll formula, where a panel of experts was consulted on the choice of parameters to be
included as well as the respective weightage to be assigned to each parameter (DOE, 1994).