PART Z GENERAL - Shodhganga : a reservoir of Indian theses...
80
PART Z GENERAL
Transcript of PART Z GENERAL - Shodhganga : a reservoir of Indian theses...

PART Z
GENERAL

Chapter I
HISTORICAL AND GEOGRAPHICAL SET UP
1, General His tor ical and Cultural Background
The course of h is tory of the Trans-Ghaghara Plain has been
grea t ly influenced by i t s geographical condi t ions , spec ia l ly by
the l e v e l nature of the t e r r a in which i s much dissected by the
r i v e r s , and by i t s nearness t o lof ty mountains. Walled off by
the Greater and teaser Himalayas in the north and bounded by
the Ghaghara in the south, i t may be seen as a d i s t i n c t na tura l
region of t he Middle Ganga Valley, AS a region, i t has ce r t a in
p e c u l i a r i t i e s and spec ia l c h a r a c t e r i s t i c s which have made deep
impressions on the local cu l tu re and on the way of l i f e . But
v a r i e t y i s not lacking, the d ive r s i t y of na tura l condi t ions ,
the presence of a number of r a c i a l elements and loca l va r i a t i ons
in the subsistence economy have generated forces which have
produced the present mosaic.
The outstanding feature affect ing the region i s the
Himalaya, from where numerous r ive r s and t h e i r t r i b u t a r i e s
o r i g i n a t e . The benef ic ia l waters of the Ganga, the Yamuna and
the Ghaghara led ea r ly t o the development of agr icu l tu re and the
consequent humanlzation of the region. Town and v i l l a g e
communities grew up along the r i ve r s and converted t h i s region
into a cradle of c i v i l i s a t i o n . I t i s not surpr i s ing t h a t these
12
13
r ivers Metre held sacred by the people, and numerous religious
shrines, hermitages and bathing ghats grew up en the i r banks*
"All the r ivers", says Markandeya Purana, "are sacred; a l l flow
towards the sea, a l l are l ike mothers of the world; a l l purge i
away s ins ."
In history one does never know where t o begin, we may
consider the history of the region briefly according to the
t rad i t ional divisions, namely, ( i ) The Pre-historic and Ancient
Periods, ( i i ) The Early Medieval period, ( i l l ) The Late Medieval
Period, (iv) The Colonial Period and (v) The Post-independence
Period.
The Pre-historic and Ancient history of the region has been
pieced together from different sources of information such as epics,
legends, ancient l i te ra ture , accounts of foreign t ravel lers and
testimonies of archaeology based on epigraphs, coins, monuments,
ter racot ta , pottery and other a r t ic les of households and general
use., The sources of the history of medieval and modern periods
are bet ter known.
The Pre-historic and Ancient Periods comprise the ages before
the Maurya Dynasty, i . e . , before 321 B.C. The Early Medieval
Period begins with the Maurya Dynasty and las t s t i l l the end of
Marsha's reign, i . e . , from 321 B.C. to 646 A.D. The Late Medieval
Period includes the several Muslim dynasties and las t s un t i l the
Revolt against the British in 1857. During the centuries astride
the Early Medieval and the Late Medieval Jfcrioda, there were much
1 Markandeya Purana, Vol. LVii, p.30.

14
fluctuations in the fortunes of the rulers of northern India
in general, and of the Trans-Ghaghara Plain in particular. This
period (A.D. 646 to 1186} i s characterised by changes in the
government from t ine to time and also the weakening or strengthen
ing of central authority. Various Hindu castes as well as a
number of Muslims conquerors had the ir day in th i s region. Notable
Hindu chie fs , for example, Rajput, Bhars and poms, played a
s ignif icant role in building up their supermaey over the region
at various times. The hold of Muslim rulers, however, was sporadic
and negl igible and altogether l e f t l i t t l e imprint on the region,
notable Muslim chiefs of the period were salyld Salar Maaud,
Naslruddin Hahmud and some Ansaris who were the descendants of
the early rulers of the western part of the Trans-Ghaghara Plain.
Therefore, as compared to other periods, t o write down a chronolo
gical history of th i s region in th i s intervening period i s rather
d i f f i c u l t . As one of historians of the region observes, the facts
are too complex and imperfectly Known to admit of concise
satisfactory explanation of the history of th i s region and I t i s
easier to ask questions than to answer them.
We shal l treat the Colonial period and the post-independence
period in greater deta i l later in th i s chapter.
( i ) The Pre-historic and Ancient Periods
The region, which originally must have been a l l covered by
premaeval forests , appears to have been humanized in the ancient
times. Fifteen thousand years ago, man in th i s region was in the

15
pa laeo l i th i c age, with a nomadic way of l i f e . C iv i l i s a t ion based
on rudimentary agr icul ture and crude metal working dates back
t o about 10,000 years . Even as l a t e as "3500-2500 B.C* men
eked out a precarious e x i s t e n c e . . . and there was hardly any
t r ade in e s s e n t i a l commodities. Indeed, there was no surplus ; 3
man l ived on the edge of the needs". A se l f - sus ta in ing economy was in common pract ice in each family.
From times immemorial, the region remained the meeting place
of a number of e thnic groupst for example, two of the g rea tes t
p r e -h i s to r i c people* viz., the Mediterranean-Armenoids and the
Munclas and thereaf te r many other e thnic groups such as the Nishada
and the icirata, the Providian* and the Indo-Aryans — a i l appears
t o have contr ibuted t h e i r individual cu l tu res and ways of l i f e . I t
was even before the advent of the Aryans t h a t the region had
developed an organised ag r i cu l tu ra l socie ty , well-ordered v i l l a g e s ,
fo r t s and buildings* and reservoi rs and tanks for i r r i g a t i o n . Thus,
in the Rig-Vedic period, when the Aryans advanced upto the Trans-
Sanga Plain, they found the non-Aryans l i v ing a c i v i l i s e d l i f e in
the Middle Ganga Valley, In the post-Vedic period, the Ganga-
Yamuna Plains became a strong centre of the Aryan C iv i l i z a t i on .
2 Bukherjee, R*K«,, The Changing Face of Bengal (Calcutta, 1938), pp. 233-34.
3 Cul tura l Heritage of India (Calcutta, 1960J, Vol .1 , p . 106. 4 Baden-Powell, B.H., Vil lage Communities in India (London, 1899),
p* 49. 5 Map of Early India* "The Indus Valley Culture and the Aryan
Invasion", Vide Bellman, R.R., An Outline Atlas of Eastern History (London, 1954), p , 6.

16
Kosala which roughly corresponded to Awadh and the Saryupar
Plain, remained for long the eastern limit of Aryan civilization
until the Sadaniva (Gandak) was crossed, The earliest capital
of the Kosala kingdom was Ayodhya, which was the seat of the
epic hero, Rama. There is no doubt that in the wake of the
Aryan colonisation, the region seems to have developed an advanced
agricultural society and the villages and towns were in a
flourishing state*
In the Budhist period (around 550 B.C.), the region was covered
by a number of republican confederacies in the kingdom of
Kosala* The major part of the Saryupar Plain consisted of the
6 The extent of Kosala touched the Himalayan hills In the north but to delineate Its southern extremity is rather difficult, some light, however, is thrown on this problem by the Raraayana. When Rama started his exile journey from Ayodhya to the Dandaka forest, he took a southerly route where he crossed several rivers, vi*., The Taioasa (the modern Tons), the Vedaaruti (the modem Balta), the Gomati and the Syandlka (the modern sal). Having thus crossed the kingdom of Kosala, Rama proceeded towards the Ganga and to the territories of other kings.
But certain scholars (B.C.Law, N.L.Dey, A.Cunningham) believe that there were two Kosalas in the north. Their sources of informations are based on Avadanaaataka, i.e., Buddhist literature of Nepal <p.20), which refers to a war between the kings of the two Kosalas, i.e., Uttar Kosala and Dakshlna Kosala, and suggests that the river Saryu formed the dividing line between the two territories. But D.s.Pathak believes that if there were two capitals of Uttara (north) and Dakshlna (south) Kosala, vie,, saravasti and Kusevati, then the point of argument is about scusavatl which Is situated In Deorla district in the same territory of Uttar Kosala* However, the writer believes that there were two Kosalas with the capitals at Saravasti and Ayodhya respectively* In those days, it was difficult geographically to administer both the Kosalas from a single capital, Ayodhya, because of the obstacle placed by the Saryu, Hence, It Is likely that the capital of Uttar Kosala was Saravasti and the capital of Dakshna Kosala was Ayodhya.

X7
domains of the sakyas, Mallas and Pavas which were free republican
clans, some details of the ruling clans may be given. The
Sakiyas of Kapilvastu Inhabited the mdo-Nepal border, and their
Capital Kapilvastu has been recently identified with the present
Piprahwa in the district of Basti, about 25 km from Tilaurakot,
which was earlier believed to be the site of the capital* The
Koliyas of Ramagrama were the eastern neighbourers of the Sakyas,
and the river Rohini formed the dividing line between their
territories* The Mallas of Pava have been identified by Cunningham
with Padrauna in the Deoria district. some, however, consider
that the present Faelipur stands on the site of the ancient Pava.
The Malias of Kusinara, corresponds the modern Kasla or Kushlnagar,
where a small temple with a colossus of the Buddha has been
discovered. Lastly, the Koriyas of Pipphalivana remain unidentified.
AS a matter of fact, the history of ancient period in which
Kosala was a mighty kingdom may be characterized by a quite rich
as a centre of culture, trade, politics and religion and the places
mentioned above developed as a significant urban centres before
the Buddhist period. He shall discuss these towns in detail
later on.
(11) The Early Medieval Period
The region appears to have been prosperous in the period
after the departure of Alexander in 323 B.C. The Mauriyan regime
(321-184)B.C.), including the dynasties of Chandra Gupta,
BIndusaro and Ashoka and many others of his descendants, had
established a reign which covered every sphere of life of the

18
people. By the beginning of the Christian era, however* the
region again appears to have fallen into clan republics and
into the hands of the local Chieftains. A central power once
again emerged by A.D. 320 under the Gupta rule. The Gupta period
may verily be said to mark the climax of Hindu imperial tradition,
From the point of view of literature, religion, art, architecture,
commerce and colonial development, this period is undoubtedly the
most important in the ancient Indian history*
In the fifth century, the southern part of Gorakhpur was 7
probably included in the Gupta Dynasty of Magadh. After the
downfall of Gupta Dynasty (554-320), Harshvardnan established a
strong government in 606, but his death in 647 "loosened the
bonds which restrained the distruptive forces... and allowed them
to produce ... a medley of petty states with evervarying boundaries
and engaged in increasing internecine warfare".
After the downfall of the Harsha's reign, centrality of
governmental power was once against lost and the different parts
of the region came to be ruled by various local Chiefs. As a matter
of fact, they were perfectualiy locked in mutual conflict, ever
busy in strengthening their power against their neighbouring
rivals, as a result, always at daggers drawn, so that its stability
was lacking. For example, Bahraich and Gonda districts were held
1 Imperial Gazetteer of India. Vol. XII (Oxford, 1908), pp.341-42.
8 Majumdar, R.C., An Advance History of India (London, 1958), p. 156.
9 smith, V.A., Early History of India (Oxford, 1924), p. 370.

19
by the Bhars and the Poena (or Dortkatara) respectively. It was in
these circumstances that Saiyld Salar Masud, a Muslim warrior,
raided and seized Bahraich d i s t r i c t and after strengthening his
power, conquered the adjoining territory of the Gonda d i s t r i c t
which was previously under the rule of the Poms but later on came
under the domination of Rajput c lans. However, saiyld salar
Masud had a short span of l i f e and he died fighting in a batt le
against the local chiefs near Bahraich town in 1033. It may be
noted that Muslim rule had quite aotne time threatened India. The
conquest of Sindh had taken place as far back as 711/ the
incursions of Mahmud of Ghaeni took him eventually, in 1018, as
far as Kanauj, that i s to say, t o the very heart of Hindustan.
As the Hindu principal i t ies f e l l one after the other, the period
of Hindu rule came to an end.
( i l l ) The late Medieval Period
For some centuries, Turks, Mongols, Persians and Afghans
had continued to pour down into India* By the end of the twelfth
century, a Muslim Sultanate had been established in and around
Delhi. Before long almost the whole of northern India was under
the domain of Muslims. But the Trans-Ghaghara Plain was an
exception insofar as the local chiefs , mainly of Rajput. DOIP
and Bhar cojracunitiea, were in power but they had agreed t o pay
tribute to the Delhi sultanate. Hence, t h i s region was ruled by
the Muslims in partnership with the local ch ie f s . The Delhi
10 Imperial Gazetteer of India, o p . c i t . , pp. 212-13.

20
Sultanate l a t e r decided t o expand i t a t e r r i t o r y and br ing about
d i r e c t ru le and therefore seized roost of the western part of the
region. I t appointed a governor, Nasiruddln Mahmud, who ruled
t h i s par t r igorously in the f i r s t instance but h i s administration
could not l a s t long mainly because the hlnderance caused by
Ghaghara prevented him frost ge t t ing in to regular contact with
Delhi s u l t a n a t e . Eventually he was l e f t with l i t t l e au thor i ty
outaide h i s f o r t . In these circumstances, the Rajput c lans once
again emerged as contenders of power. While the eas tern part of
the region was ruled by the Bhars and the Poms who were often
replaced by the Rajput c l a n s . Thus, both the western and the
eas tern pa r t s of the region were ruled by local chiefs who were
not ful l-f ledged ru l e r s and t o a grea ter or l esser degree owed
al legiance t o the Delhi su l t ana t e . I t was not u n t i l the 13th
century t h a t t h i s atomist ic pat tern gave way t o Muslim ru le in
both pa r t s of the region.
The period of Mughal ru le (1525-1857) from Dabar t o Bahadur
Shall I I , proved t o be very s igni f icant insofar as i t affected
i t s p o l i t i c a l , soc ia l and economic l i f e of the region, in the
reign of Akber (1556-1605), the Gorakhpur sarkar included most
of Gorakhpur d i s t r i c t and Bast i d i s t r i c t , while the Bahraich
Sarkar consisted of par t s of Gonda and Kheri d i s t r i c t s . Both
tbe«e sarlcars were included in the Subah of Awadh (Oudh). However,
the death of Aurangzeb in 1707, the Nawaba of Awadh became
independent fsom the Mughal power. By the mid of 19th century,
i . e . , in 1657, the region came under the Br i t i sh r u l e .

21
(ivl The Colonial Period
It was during the rule of Emperor shahjahan (1628-1658)
that the East India Company, which had come into being as an
association of businessmen, accurately described as "The Governor
and Company of merchants of London Trading into the East Indies",
gained a foothold in India. By and by, the Company established
important factories in the eastern region of India. The Company
in course of time became a political force. After crushing the
Revolt of 1857, it took over the administration of region completely.
Thus, the region became part of the *North-western Provinces1
which later cane to be called the 'United Provinces of Agra and
Oudh* and was renamed 'Uttar Pradesh1 in 1947, The misdeeds of
the Company, both economic and political were too glaring to be
ignored so that the Imperial Government in London took matters
in its own hands and brought the territories of the Company under
direct British rule*
During the Colonial regime, the region was organised into
districts, tehsils and parganas for administrative purposes, with
some modification in the Mughal pattern. The heirarchical pattern
of British administration from the top to the bottom, from the
Viceroy and Governor General as the highest and the village ffufchJa
as the lowest, ended the political instability in the region* The
administration was able to do a great deal in restoring peace;
increasing river, road and rail transport; bringing about fiscal
and taxation policiesf and establishing educational and professional
institutions, hospitals and so on.

22
A period of relative peace and the provision of health
services led t o a development of the economy as well as t o a
rapid growth of population. However, free flow of imported goods,
mainly cotton t e x t i l e , and machine and tools disrupted the
oppucational structure of the population. AS a result , a large
nunftwar of sk i l led workers and labourers in household industries
became Jobless- Consequently, they turned to agricultural sector
which was already over-burdened. Economic exploitation by a
foreign cap i ta l i s t power l e t loose a continuous process of
impoverishment. The per capita income in the country in general
and in the Trans-Gheghara plain in particular steadi ly decreased.
Throughout the entire colonial period both agriculture and
industry stagnated in the Trans-Ghaghara Plain. The backwardness
of the region has been commented upon by R.L.Singh in the following
The British administration developed a step-coot he rly attitude towards the regional development of the Eastern U.P., as the 'Furabia army', and the eastern U.P. people, gave a stubborn fight to the British in the f i r s t struggle of independence during 1857-58. While the western u.P» was provided f a c i l i t i e s such as irrigation, power* road transport system and other services, the Eastern U.P. not only remained under the f u l l blunt of negligence on the part of the government, but a lso was allowed to undergo continuous hardships of droughts, floods, epidemics with very inadequate re l i e f measures.
However, Brit ish colonial rule was not without some benef i t .
It brought law and order, education, to some extent modernization
11 Singh, R.L. and Singh, K.N., "The Eastern upptar Pradesh** in India Regional studies (ed. R.L. Singh), (Calcutta, 1968),

33
and a shaping of the economic order although in e low key. It
also led to the growth of the spirit of nationalism in the country
in general but in this region in particular because of i t s
poverty and deprivation. The fact that the 1942 Movement against
the British colonial rule was one of the strongest in this region
was no accident*
(v) The Post-Independence Period
On the 19th of August, 1947, a new chapter opened in the
Indian history* After a long period of political subjugation by
the British colonial rule, India once again emerged as an
independent nation. The national government soon addressed
i tse l f to the task of economic reconstruction of the country
mainly through the five Year Plana, and the underdeveloped eastern
pari; of U.P. did receive a share of the economic advancement.
Undoubtedly, a substantial progress in the field of agriculture,
industry, education, health facilities* transport and coinaunica-
tion has been made and measures have been taken for the uplift
of the weaker sections of the society but the region s t i l l
remains backward both in absolute and in relative terns.
2» genera} tact ion and salient Physical features
The Trans-Ghagbara plain comprising the districts of Deorla,
Saati, Gonda and Bahraich, covers an area of about 33,227 sq.kta,12
12 the area of the Trans-chaghara plain have been worked out by adding the total area of the five districts* namely, Deorla* Corakhpur, Basti, Gonda and Bahraich as laid down by the Board of Revenue, U.P., Uicknov, Census of India, 1971, Pihel Population Tables.

24

25
which constitutes 11.3 per cent of the to t a l area of u t t a r
Pradesh, I t l i e s between 26°5* and 2804S* N lat i tude, and
between 81°31* ana 64°40' B longitude. The eastern limit of
th i s region i s formed by the interstate boundary between Uttar
Pradesh and Bihar white the northern limit i s marked by the
mdo-Nepal international boundary and the southern and western
l imits by the Ghaghara I t se l f (F lg . l ) .
Salient Physical Features
( i ) structure and Relief
The region forms the northeastern part of the Ganga Plain
and i s a well demarcated physical unit* hemmed ID between the
Himalayas and i t s Tarai in the north and the Ganga-Ghaghara Doab
in the south. The al luvial plain is a part of the trough between
the Himalayas In the north and the Vindhyan Uplands in the south.
Structurally, the region l ies in the Ganga Plain which has been
f i l led up with al luvial sediments brought down by the Himalayan
r ivers t o form a riverine t rac t with Khadar and Sanoar lands,
t a l s , ox-bow lakes, deserted channels and a generally high
water t ab le , from the viewpoint of physiography, the whole region
represents an almost level appearance and i s homogeneous In
character. The land surface at places is differentiated by
several depressions and elevations. The lowlying t rac t along the
r ivers , I . e . , the Khadar. are regularly Inundated by streams,
which form natural l ine of drainage. The elevated t r ac t s of the
plain, known as the Bandar l i e above the flood level of the

26
rivers and have been formed by fluvial action. The geological
evolution of the region is a matter of controversy. Eduard Suess
propounded that it was a 'fore-deep' between the Himalaya© in
the north and the Peninsular India in the south. This depression
was filled tip since Pleistocene by a vast amount of detritus
brought down by the Himalayan rivers and thus the plain came
13 into existence.
Burrard put forward a different hypothesis* He postulated
the origin of this depression similar to that of the Great Rift
Valley of Africa and probably of the same age. The plain
occupied a deep rift valley bounded by parallel faults on its
two sidee, with a maximum downthrow of 32 km, and the valley was
subsequently filled up by detrital deposits. This hypothesis
IS has few geological facts in its support.*"
A third and the recent view considers this region as a *3ag*
in the crust formed between the northward drifting Indian continent
in the south and the comparatively soft sediments accumulated in
the Tethyan sea as well as in the connected basins in the south.
AS the sediments in the Tethyan sea were being crumpled up and
lifted up into a mountain system, the rivers were filling up this
16 'sag* and finally the plain came into existence.
13 Krishnan, M.S., Geology of India and Burma (Madras, I960), p. 5 73.
14 Burrard, S.S., "On Origin of the Himalayan Mountain*, Geological Survey of India, paper No.12 (Calcutta, 1912), p.11.
15 Wadia, D„N. and Auden, J.B., "Geology and structure of North India", Memoirs of the Geological Survey of India. Vol, 73 (Delhi, 1939), p. 134.
16 Krishnan, M.S., op.cit., p. 511.

27
28
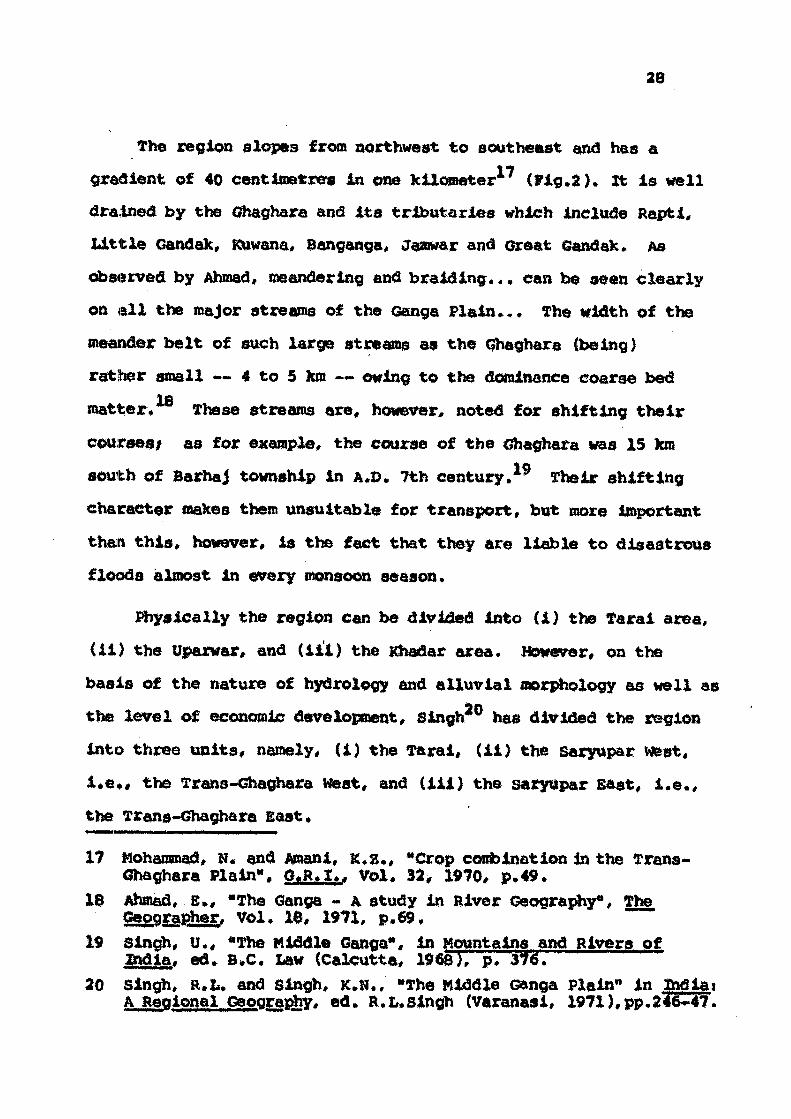
The region slopes from northwest to southeast and has a
gradient of 40 centimetres in one kilometer*7 (Fig .2) . It i s well
drained by the Ghaghara and i t s tributaries which include Rapti,
Litt le Gandak, Kuwana, Banganga, Jaanwar and Great Gandak. As
observed by Ahmad, meandering and braiding. . . can be seen c learly
on a l l the major streams of the Gangs Pla in . - . The width of the
meander be l t of such large streams as the Ghaghara (being)
rather small - - 4 t o 5 to — owing to the dominance coarse bed 16
matter,*^ These streams are, however, noted for shift ing the ir
courses; as for example, the course of the Ghaghara was 15 km
south of Barhaj township in A.D. 7th century.*9 Their shift ing
character makes them unsuitable for transport, but more Important
than t h i s , however, i s the fact that they are l iable t o disastrous
floads almost in every monsoon season.
Physically the region can be divided into (i> the Tarai area,
( l i ) the Uparwar, and ( i l l ) the Khadar area. However, on the
basis of the nature of hydrology and a l luvia l morphology as well as
the l eve l of economic development, Singh20 has divided the region
into three units , namely* U ) the Tarai, ( i i ) the saryupar west,
i . e . , the Trans-Ghaghara West, and ( i i i ) the saryupar East, i . e . ,
the Trans-Ghaghara East.
17 ttohammad, N« and Amani, K.z., "Crop combination in the Trans-Ghaghara Plain", G.R.I., Vol. 32, 1970, p,49.
18 Ahmad, E», "The Ganga - A study in River Geography", The Geographer, Vol. 16, 1971, p.69,
19 Singh, o . , "The Middle Ganga", in Mountains and Rivers of India, ed. B*C, Law (Calcutta, 1968), p. 376. """"""""
20 Singh, R.L. and Singh, K.H., "The Middle Ganga Plain" in India a A Regional Geography, ed. R.L.Singh (Varanasi, 1971),pp.246-47.

29
(11) Climatic conditions
The region enjoys a sub-humid climate having three well
marked seasons, namely, cold season; hot season and rainy
season. During the winter months the temperature averages 16°C;
while in the summer (Hay an*3 June) i t r i ses to 38°c. The
re lat ive ly heavy rainfal l (125 to ISO cm) leading to "tarai"
conditions in the north produces an environment which i s generally
unsuitable for health. Over 93 per cent of the t o t a l annual
rainfal l i s received in the four rainy months, i . e . , from mid-June
to mid-October, with the result that the region Is l iable t o
floods and droughts following each other.
( i l l ) Natural vegetation
In 1961, only about 14,5 per cent of the to ta l area of the
Trans-Ghaghara Plain was under forest . The flora Is that of sub-
Himalayan types. Along the Nepal border, there are large tracts
of reserved forests but even southwards there some patches of
such forests* The rest of the region i s a lso fa ir ly wooded, and
groves of Kahua (Baasla l a t i f o l i a ) , shisham (Dalberqia s issoo)
and other trees are not uncommon. The percentage of the forest
t o the to ta l area of the d i s t r i c t s show that Bahralch, Gonda and
Gorakhpur have larger shares of forests than the other two
d i s t r i c t s •
( lv ) s o i l characteristics
The s o i l of the region i s a l luvia l and f a l l s into two
21 N.C.A.E.R., Techno-Economic survey of Uttar Pradesh (Sew Delhi, 1965), p.10.

30
divisionst Banqar and Khadar. The former is older alluvium
and covers the upland tracts beyond the flood limits and Generally
contains patches of user. The latter, newer in age, covers the
flood plains, and contains a large amount of humus and requires
less irrigation* Besides this broad division, a number of types
are recognised. The main factors governing the system of classifica
tion are texture* colour* availability of water and level of
22 land. Thus each type of soil is given a local name in the region.
The soil of the region are often grouped under two distinct types*
locally known as Bhat and Banqar. with a third type, known as Dhab*
which occurs near the river banks* The Bhat soil* which is generally
lowlying* calcareous, retentive of moisture and does not require
irrigation in normal years* covers the eastern parts of the region.
It is very suitable for the sugarcane crop for which this area
is noted. The Banqar soil* on the other hand* is generally
highlying, less calcareous* and has light texture varying from
loam to sandy loam. Its irrigation is necessary for growing
sugarcane.
In general the soil of the northern part of the region are
richer in nitrogen while the Dhab is poorest in nitrogen.
<v) Drainage
The drainage of the entire Trans-Ghaghara Plain discharges
i t se l f into the Ghaghara* an exception being the Great Gandak
22 Raychandhury* s .P. and Mukerjee, s.K., * Present Position of so i l Survey in India"* Journal of Scientific and industrial Research* Vol. 6, Ho. 10* (Calcutta* 1947)* p, 406.

31
- 8
? -K • -
—. J s J
<
a. <
<
oil < * X < at O ©
I
z < (X
5
X
r
•a-
JSL '«L

32
which falls into the Ganga at a considerable distance from the
Ganga-Ghaghara confluence. The courses of the rivers and their
tributaries generally take a south-easterly direction. There
are a number of perennial and seasonal rivers noted for shifting
their courses leading to the formation of t a la, ox-bow lakes and
deserted channels. The principal rivers of the region are the
Ghaghara, the Rapti, the Kuwana, the Sarju and the little
Gancak which bear the situation of most of the towns and are
responsible for the origin and evolution of the towns. These
rivers shall be discussed in the following pages to their behaviour
and characteristics (Fig.3).
(a) The Ghaghara
The Ghaghara, which is known in the Pali literature as
Sarabhu (Sarayu) Is a great river of northeastern Uttar Pradesh
with no less than five major tributaries including Kauriala,
Girva and Chauka, all of which have their sources in the Himalayan
ranges. The Gharhara is sometimes known as Kauriala in Bahraich
district but is definitely known as Ghaghara after its junction
with Chauka near Bahramghat* It is also known as sarju or Saryu
at a short distance from the sacred city of Ayodhya.
It is a tolghty river flowing in a wide and sandy bed, fully
six and half kilometres in width, During the rainy season, it
carries a huge amount of water but has much reduced flow in the
dry season. However, upto the Can go-Ghaghara confluence, the
discharge of the Ghaghara is one and a half time greater than that
of the Ganga which its catchment area (53,354 km) is even greater
33
than that of the Gangs (23,050 m km) and the Yamuna (11,605 sg JOB) 23
taken together. This river is notorious for shifting its courses
during monsoon season and when in spate, it causes great havoc,
wiping out the villages which come in its course* Due to the
shifting of the river course, large tracts are transferred from
time to time from one affected district to another. The important
towns that are situated on the bank of this river are Nawabganj,
Barhalganj and Gaura BarhaJ. All these towns have declined
considerably in importance since the diversion of river-borne
trade to the railways. In earlier periods the river was navigated
by the country boats and later on also by steamers of India General
Steam Navitation Company which maintained a regular service up
and down the stream. Until about fifty years ago, steamers plied
as far as Ayodhya on the Ghaghara river, a distance of 320 km above
its confluence with the Ganga.
There are only two railway bridges and two road bridges over
this river. The two railway bridges are not used as means of road
communication thus the total of only two road bridges is obviously
insufficient to connect this region with the adjoining Ganga-
Ghaghara Doab region. Tenuity of transport is thus the major cause
of the backwardness of the region and its towns.
<*>> The ftapti
The second important river of the region is the Rapti, which
23 Hyden, H.H., Burrard, s.G. and Heron, A.M., A sketch of the Geography and Geology of the Himalayan Mountain and Tibet, Part III (Delhi, 1934), p. 175,
24 Anand, B.D., "Usability of Indian Rivers" in Mountains and Rivers of India, ed. B.C. Law (Calcutta, 1968), p. 299.

34
was originally known as iravati and la ter corrupted t o Ravati and
Rapti. I t s source l i es in the Nepal h i l l s to the north of
lahraich. I t traverses the d i s t r i c t s of Bahraich, Gonda, Basti
and Oorakhpur and joins the Ghaghara west of Gaura Barhaj - a
confluence town in the d i s t r i c t of Deoria. It has no less than
three major t r ibutar ies on i t s left and one small t r ibutary on i t s
right* There is a t radi t ion that the r iver formerly flowed in what
i s now the bed of the Barar, the tr ibutary of the Ami; i t i s
probable that the la t te r represents an abandoned course of the
Rapti. &t times, the Rapti has assumed a more northerly channel, 25 as i s evident from the very name the Burhi Rapti or Old Rapti,
The Rapti i s known for bringing down an immense quality of
s l i t* locally known as Bhat, which, as ea r l i e r said, i s very good
for sugarcane cultivation* In former days, i t was a navigable
river through which tinker, foodgrains, Xhanfl&ari and other
commodities were transported,
<c) The Kuwana
The Kuwana is a direct affluent of the Ghaghara* Its name is
frequently prononuced as Kuano. ft rises in the east of Bahraich
and flows through Gonda and Basti districts before Joining the
Ghaghara near Shahpur, Throughout its course, it has a sandy bed
with fairly steep and high banks. The stream has a considerable
depth of water in all seasons and is generally navigable. Basti
is the only important town on the bank of this river.
2 5 District Gasetteer of Basti (Allahabad, 1926), p.12.
35
(d) The Little Gandak
The little Gandak represents an old channel of the Great
Gandak. It originates from the Baghban forest in Nepal and takes
a southernly direction in Deoria district. In the ancient literature*
this river is known as Hiranyatri and also as Ajitavati. Yuan
Chwang Called it shi-la-na-fa-ti (the river with gold). It flows
at a distance of about 13 km west of the Great Gandak and falls
into the Ghaghara. Being a seasonal river* it has had rather
little significance in the evolution of towns* However, it was on
the bank of this river that the salavana of the Mallas of Kuainara
stood..
There are many other important rivers such as the Sarju, the
Terhi and the Ami which have played an important role in the
evolution of urban centres. Besides, the region possesses a
number of perennial lakes, formed in most cases in the abandoned
channels of rivers. There Is also a large number of temporary
swamps and Ihlls such as Ramgarh Tal, Narhi Tal, Domingarh Tal,
Nandaur Tal, Amiar Tal, Bhenri Tal, Chiilua Tal, Ramabhar Tal,
Baghel jhil and Bakharn.
Since times immemorial rivers and lakes have been used for
drinking water supply, bathing, irrigation and navigation* In
modern times they have become a very valuable economic multi
purpose resources providing large scale irrigation and water
power, besides being sources of domestic and industrial water
26 Digna, II, 193?,

36
supply, fishing and navigation, the new dlamensiona in harnessing
the rivers such as measures for soil reclamation, flood control
ana afforestation further generate considerable economic development.
Hence the water resource planning for the betterment of agricultural
and industrial economy has become a necessity.
• • •
As remarked earlier, the Trans-Ghaghara Plain is an under
developed region of Uttar Pradesh. Its low urban development is
due to various factors such as high density of population, high
birth rate, low level of literacy, a very low percentage of
population in secondary and tertiary activities, low yield of
crops, traditional and primitive forming practices, small and
fragmented holdings, landless agricultural workers and loss of
sown and standing crops due to the natural clamities such as floods
and droughts.
The fact cannot be ignored that the countryside plays a
significant role in the development of urban centres and the
development of urban centre in turn leads to the development of
the regional economy* Hence, efforts should be made towards the
planned development of the urban centres as well as the
establishment of new growth,centres, the planning of urban fields
for the maximum utilisation of agricultural resources and the
maintenance of agronomic balance amongst agriculture, forestry
greasing, human habitation and means of communication emphasized
the need for a comparative study of the region*

3?
It may further be added that the functions of the towns
would also need alteration to a lesser or greater extent. The
11 observation made by Myrdal regarding the towns of the poor
countries of Asia that "much of the urbanisation i s a reaction
against weak economic growth11 may well apply to the towns of
the Trans-Ghaghara region. The question i s not only "How many
are there?" but also *What they are?*
in the next chapter we may take note of certain important
features of urban lam and urbanisation in the region.
27 Myrdal, 6 , , Asian Pramai An Inquiry into the Poverty of Hat ion s, Vol. X, (London, 19©8), p. 471.

Chapter XX
URBAN PARAMETERS
1 . Population Character1stlea of the Region
The Trane-Ghaghara Plain, occupying the northeastern portion
of uttar Pradesh, la a densely populated region. According to 1971
Census, the total population of the region was 12,863,618* which
wee about 14.56 per cent of the total population of Uttar Pradesh.
The region shows a high density of population, 38? persons per
sq. toe* which exceeds the state** average of 900 persons per sq.Joa.
It has 95.10 per cent rural population and 4*9 per cent urban
population, while the male population constitutes 52.47 per cent,
the female population i s 47*53 per cent* The region i s characterised
by a vide range of variations in growth, distribution* density, age
and sex structure and occupational structure which we shall
briefly take note of in the following pages.
<i> ffgpulsMpa 6*oyfrh
During a period of seventy years (1901-1971), the population
of the region grew from 7.238,077 to 12,663,616, showing an increase
of 5,525,541, i . e . , 77.7 per cent* The trend of population growth
shows that this i s the only region in the state of tfttar Pradesh
where the growth has been continuous and has not fluctuated as i t
has in the Ganga-Yauuna Doab and other regions. However, so far as
36

39
the urban population growth Is concerned. It has not been steady*
During the 1901-1911 census decade, the urban population declined
by 10.6 per cent on account of widespread of epidemics followed
by two successive years of droughts and floods. There was a
further decline end the troubles were a l l the more accelerated by
famines. . . which "affected the age and sex structure and the
depletion of reproductive ages brought down the birth rate." m
the two census decades of 1931*1941 and 1941*1951* the percentage
of urban population declined because the non-cooperation movement 2
tended to produce sub-normal returns for c i t i e s * However, the
increase in 1951*1961 decade was 27*8 per cent which was almost
equal to that in 1921-31. The increase in 1961-71 decade was
substantially much more* showing a percentage of 36. The net
Increase was recorded as 210*3 per cent during 1901-1971. The
pattern of population growth from 1901 to 1971 for both rural and
urban sectors are summarised in Tables X and II*
(11) Distribution of Population and Density Pattern
The population of the Trans-Gheghara Plain i s very unevenly
distributed. It i s mostly concentrated In the eastern parts and
re lat ive ly dispersed In the northern parts of Gonda and Bahraich
d i s t r i c t s . In the Taral region* population concentration i s rather
sporadic but I t ta most marked along the Ghaghara and the Rapti
1 Singh. R.L. and Singh, K.N.,BThe Middle Gangs Plain", in India* A Regional Geography, ed. R.L.Singh, (Varanasi, 1971), pp. 208-213. ~*
2 Davis, K.# The Population of India and Pakistan (London, 1951), p. 127.

40
06
l »
*L J l
41
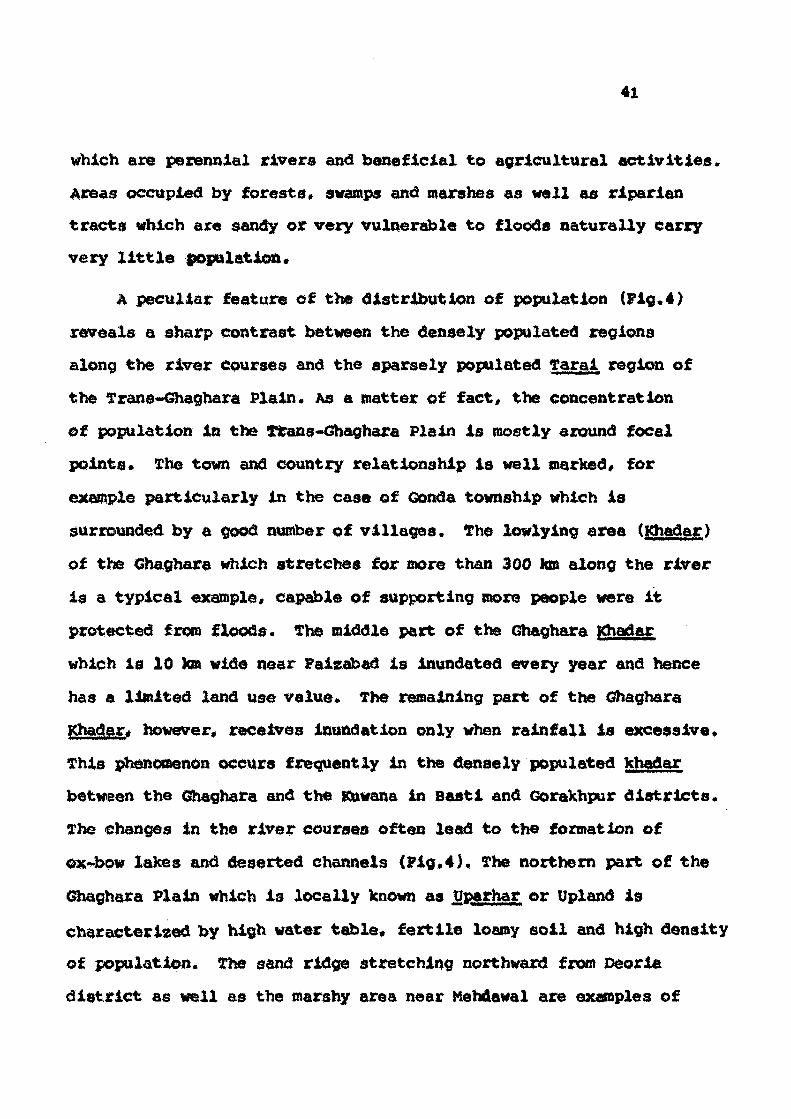
which are perennial rivers and beneficial to agricultural activities*
Areas occupied by forests, swamps and marshes as well as riparian
tracts which are sandy or very vulnerable to floods naturally carry
very little population.
A peculiar feature of the distribution of population (Fig.4)
reveals a sharp contrast between the densely populated regions
along the river courses and the sparsely populated Tarai region of
the Trans-<3haghara Plain, AS a matter of fact, the concentration
of population in the Trans-Ghaghara Plain is mostly around focal
points. The town and country relationship is well narked, for
example particularly in the case of Gonda township which is
surrounded by a good number of villages. The lowlying area (Khadar)
of the Ghaghara which stretches for more than 300 km along the river
is a typical example* capable of supporting more people were it
protected from floods. The middle part of the Ghaghara Khadar
which is 10 km wide near Falzabad is inundated every year and hence
has a limited land use value* The remaining part of the Ghaghara
Khadar* however, receives Inundation only when rainfall is excessive.
This phenomenon occurs frequently in the densely populated khadar
between the Ghaghara and the Kuwana in Bastl and Gorakhpur districts.
The changes in the river courses often lead to the formation of
ox-bow lakes and deserted channels (Fig*4}. The northern part of the
Ghaghara Plain which is locally known as Pparhar or Upland is
characterized by high water table* fertile loamy soil and high density
of population. The sand ridge stretching northward from Deorle
district as well as the marshy area near Mehdawal are examples of

43
this population. Besides, the northern portion of Gorakhpur
district is forested and supports little population. The population
in the western part of Bahreich district is much scattered due to
large patches of scrub jungle* imbalances of population in the
Trana-Ghaghara region may be removed to a large extent if scrub
Jungles are cleared and agricultural and transport facilities are
provided«
In 1971* the urban population of the five districts of
the region was 631,164, i.e., only 4.9 per cent of the total
population of the region. This may be compared to the figure
for the state of uttar Pradesh as a whole, which stands at 14.02
per cent* It is interesting to note that the total urban population
of this region is almost equal to the population of Agra Municipal
Corporation Area, AS we shall see later, this meagre urbanisation
is of special interest in the comparative urban geography of the
area,,
Of the total population of the region, 95.1 per cent is rural . 4
while the remaining 4.9 per cent is urban. Agriculture is the
mainstay of the economy and engages 95 per cent of the total rural
population (See Table ill).
The arithmetic density for the whole region works out to be
38? persons per sq 1cm. The average density increases from west
to east and is high along the rivers (Ghaghara and Rapti) in spite
of recurring floods. The Tarai region has less density* The
highest density of population is found in Deoria district and
the lowest in the Bahraich district. The density, district by

43
• t RHP.
f i l l {!••;{; M
« « ' • " • ' • m m
4,-^n:-;'••••:;'H¥( n» l i t F,, ; : . ' . . | .' tl <tihi .11* j ilM?
"(:•••. ;.. J .jv'.::ihj;.lt | [ l ife

44
district, works out to be 251 (Bahraich), 314 (Gonda), 408 (Basti),
481 (Gorakhpur) and 512 (Deoria), These nay be compared to the
average density of Uttar Pradesh which is only 300 persons per
s<5* Ian (Wig. 5). The distribution and the density of population
in rural and urban sectors and their percentage values against
the total population of the districts and of the regions are
summarised in Table 111),
(iii) Sex Ratio
According to 1971 census, there are f05 females per thousand
males in the region. The rat io has sl ightly gone down since the
census of 1961 which recorded 956 females per thousand males. The
general variation in the growth of sex ra t io shows that in 1901-1941,
the sex ra t io recorded a declining trend, i . e . , from 977 females
per thousand males in 1901 to 941 females per thousand males in
1941* However, the sudden increase in the sex ra t io increased
markedly in 1951 Census and was 960 per thousand. A substantial
decrease was, however, recorded in 1971 when i t came down to 905
per thousand (see Table i v ) .
The imbalance in the sex ra t io in urban population i s markedly
greater than in the rural population, for whereas, there are only
816 females per thousand males in urban areas, rural areas have
910 females per thousand males. The urban sex ra t io for the
d i s t r i c t s ranges between 785 and 853 ( i . e . , the highest figure
being for Bahraich d i s t r i c t and the lowest for Basti d i s t r i c t ) ,
Deoria d i s t r i c t has the highest female ra t io (950 females per
thousand males) and Bahraich d i s t r i c t has the lowest (841 females

45
per thousand males).
A glance at Table IV shows that the number of females in
urban areas is l iable to much fluctuation in decadlal census growth,
AS for example, the sex ra t io in 1901 was recorded as 938
females per thousand of males, declining to 606 in 1911 and
i t r ising t o 833 in 1921. In 1931, i t again declined to 779 and
then r is ing to 852 in 1941. It again declined to 612 in 19S1 and
rose to 797 in 1961. 3h the last census decade i t further rose
to 816. However, in urban areas during 1961*1971, the sex ra t io
gone up while in rural areas i t came down substantially from 963
to 910* This declining trend may also be examined from 1901 to
1921 during which sex ra t io declined from 938 to 816 in urban
areas and from 981 to 910 in rural areas. The sex ra t io in rural
and urban areas for each d i s t r i c t has been summarised in Table W.
Uv) Literacy
While the percentage of l i t e ra ry in u t t a r Pradesh i s 21.7,
the Trans-Ghaghara Plain has only 16.36 per cent of i t s population
in the l i t e r a t e group* The rural areas of the region have a lower
percentage of the l i t e r a t e population (14*9 per cent) as compared
to the figure (18.1 per cent) for the s ta te as a whole. On the
contrary, the urban areas have a s l ightly higher percentage (44.73
par cent) as compared to the figure (43*6 p&r cent) for the s ta te
as a whole, m urban areas, the rate of l i t e ra ry i s higher because
they have more f ac i l i t i e s for education. There appears to be a
spat ial distribution in the percentage of over-all l i teracy, which
i s highest (L9»8) in Gorakhpur d i s t r i c t and lowest (12.2) in

46
Bahraich d is tr ic t* {literacy thus shows an increase from west to
east , the districtwise figures being Bahraich (12.2), Gonda (14.0),
Baoti (15,6), Gorakhpur (19.8) and Deoria (16.0) . The same pattern
i s observed i f we take rural end urban areas separately.
The percentage of l i teracy among the males i s higher than
that among the females in both the rural and urban population•
the percentage of urban l i teracy ranges from 35.6 in Bahraich t o
51.8 in Gorakhpur while these percentages for rural areas range
from 10.7 in Bahraich to 17.2 in Deoria* As revealed by Table V,
the Gorakhpur-Deoria region has a higher percentage of l i teracy
than found in the other three d i s tr ic t s* Bahraich d i s t r i c t has
the lowest percentage of l i teracy both in urban and rural areas.
The causes of low l i teracy in female population are self-evident,
for the womenfolk suffer from several handicaps in education such
as domestic chores and duties , seclusion and general soc io
economic dependence*
There are certain generalisations which can be madei
First ly , l i teracy i s comparatively higher both for males and
females in urban areas. Secondly, d i s t r i c t leve l differences in
rural areas are small* ranging from 10*7 per cent in Bahraich t o
17.2 per cent in Deoria, while in urban areas they are large,
(35.7 per cent in Bahraich, 40*2 per cent in Gonda, 43.0 per cent
in Basti, 44 per cent in Deoria and 51.8 per cent in Gorakhpur}*
Fourthly, the rural-urban differential in both males and females
shows much variation.

4?
(v) Age and Sex structure
The structure of age group i s an important aspect of
population analysis . In the planning of different types of
programmes in any society, different age groups assume different
social and economic significance. Moreover, the exist ing
structure determines the demographic trends and helps in making
population projections for the future years. Generally, demogra
phers recognise three broad age groups t ( i ) Pre-adult Age
Group, i . e . , below 15 years, ( i i ) Super-annuated Age Group, i . e . ,
above 60 years, and ( i l l ) Reproductive Age Group, i . e . , 15-60
years. However, the Census of India, 1971, recognise nine age
groups as against the four age groups of the previous census
years•
Table VI gives a detailed and comprehensive percentages of
age and sex structure for the t o t a l population of the Trans-
Ghaghara Plain both for the rural as well as urban areas* It
also gives a clear picture of comparative percentages of Sahraich,
Gonda, Basti, Gorakhpur and Deoria d i s t r i c t s . It can be seen
that in the combine to ta l of males and females population, the
pre-adult age group (0-14) claims the largest proportion than
the other groups. It claims about 40 per cent of the to ta l
population while (15-19), (20*24) and (25-29) age groups constitute
7.73. per cent, 7.34 per cent and 7,68 per cent respectively.
The age group of 30*39 constitutes a s l ight ly higher percentage,
l#e,», 13.76 per cent, while the remaining age groups constitute
10.4 per cent, 6.74 per cent and 6.99 per cent respectively. In
48
urban areas, pre-adult age group and active reproductive age
groups axe sl ightly bigger than those in the rural areas while
superannuated age group i s s l ightly smaller in urban areas than
that in rural areas. I t i s also noteworthy that the male popula
tion i s always higher as compared to that in the rural areas.
Generally speaking, persons who are more than sixty years or
less than fifteen years of age do not earn their livelihood and are
therefore called "Dependent Age Group", m comparison, those who
are able to earn the i r livelihood ere called "productive Age
Group".
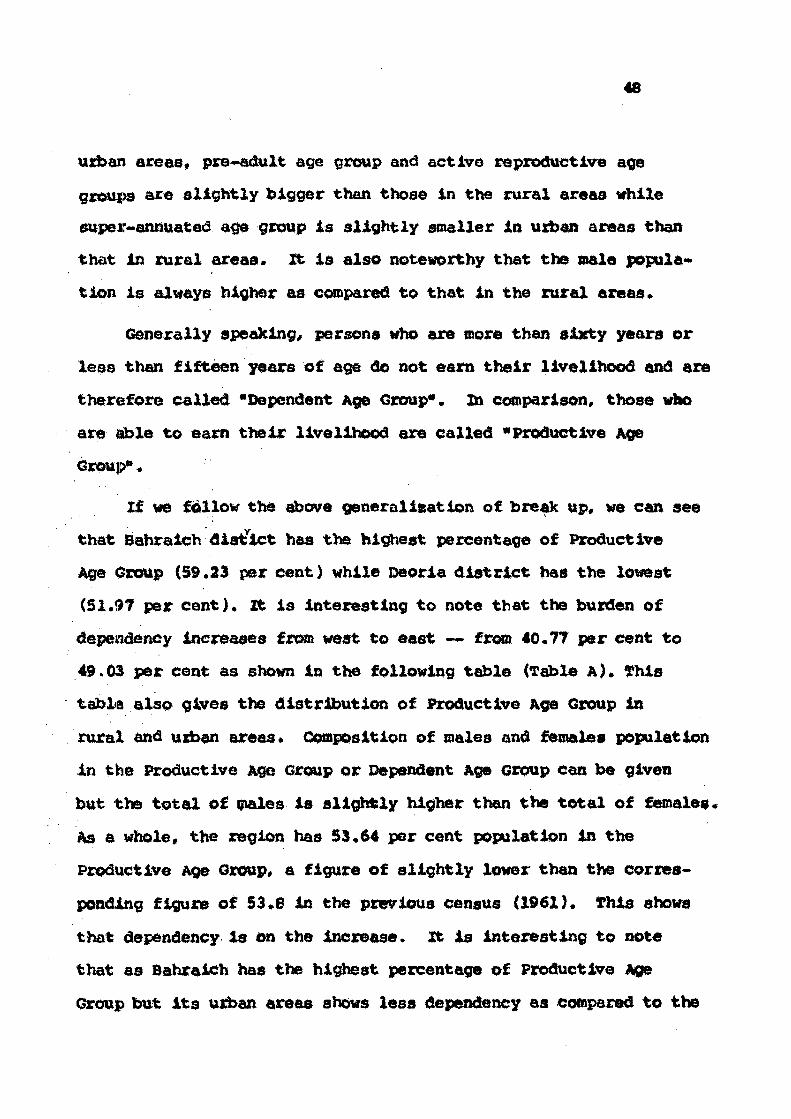
If we follow the above generalisation of break up, we can see
that Bahraich district has the highest percentage of Productive
Age Group (59.23 per cent) while Deoria d i s t r i c t has the lowest
(51.97 per cent} . It i s Interesting to note that the burden of
dependency increases front west to east — from 40.77 per cent to
49.03 per cent as shown in the following table (Table A). This
table also gives the distribution of Productive Age Group in
rural and urban areas* Composition of males and females population
in the Productive Age Group or Dependent Age Group can be given
but the t o t a l of males i s s l ightly higher than the t o t a l of females.
As a whole, the region has 53.64 per cent population in the
Productive Age Group, a figure of s l ight ly lower than the corres
ponding figure of 53.6 in the previous census {1961}, This shows
that dependency la on the increase. I t i s interesting to note
that as Bahraich has the highest percentage of Productive Age
Group but i t s urban areas shows less dependency as compared to the

49
TABI£ (A)
Distr ict T.OEAI. RUItAL PRBAK Dependent Productive Dependent Productive Dependent Reduct ive *ff-OT»P ^ r f f D t t p A^^yt t ipA^e^fyc^p, Age-groty AaeTgroui>
Bahraich 40.7? 59.23 40,36 59.64 47.24 52.76 Gonda 45.13 54.87 45.17 54.63 44.S2 SS.46 Basti 46,57 53.43 46.70 53.30 45.29 54.71 Gorakhpur 47.79 52.21 47.96 52.04 45.78 54.22 Deorla 49.01 51.97 49.12 50.86 46.42 53.58
Trans-Ghaghara 46.36 53.64 46.39 53.61 45.77 54.23
J&filS .
(vi ) Occupational Structure
In 1961 Census, about 45 per cent of the to ta l population of
the region was registered as Active workers while the remaining 55
per cent was registered as Non-Workers. But in 1971, these figures
had changed drastically# showing a very fast growth of dependency,
for in that year 33.4 per cent were Active Workers while the
remaining 66.6 per cent were Non-workers. Of the 33.4 per cent
Active Workero, about 32 per cent were in rural areas and only 1.4
per cent in urban areas. It i s interesting to compare the Ganga-
Yerouna Doab with the Trana-Ghaghara Plain. In 1961, the former
(with a f e r t i l e a l luvial s o i l and a congenial climate for primary and
secondary a c t i v i t i e s , and with three of the five (KAVAL0 towns of
U.P.) had only 33 per cent of i t s tota l population l i s t ed as Active
workers as against 45 pes: cent in the Trans-Chaghara Plain. But in
1971, the percentage of Active Workers in the Trana-Ghaghara Plain
3 shsf i , M.# "Ganga-Yamuna Doab* in Dadlat Regional studies (ed. R.L.Singh), (Calcutta, 1966), p.52.

so
had come down to 33*4 per cent, almost level with the figure
for the Ganga-Yamuna Doab (Tables VII and VIII).
In the region under study, most of the people are dependent
on agricultural activities. In fact, 86,9 per cent of the total
Active workers are agricultural workers. Only 3 per cent to
the total Active workers obtain their livelihood from household
industries allied with manufacturing, 0.25 per cent from construc
tion, 2*20 per cent from trade and commerce, 0.67 per cent
from transportation activities and the remaining 4.29 per cent
from other activities* the percentage in transportational
activities is very low when seen against the percentage in uttar
Pradesh taken as a whole (table IX). the reason for this is
that the region is isolated from the neighbouring regions by the
flow of the Ghaghara. there are very few bridges over the
Ghaghara to provide linkage with the adjoining region and their
capacity is insufficient to generate an adequate net of regional
transport system. Moreover, the various tributaries of the
Ghaghara which traverse this region, cause ravines, marshes and
such features which produce structural problems in the building
up transport facilities* the greatest hinderanee is caused by the
fact that the rivers are liable to disastrous floods in almost
every monsoon season*
After analysing the general features of occupational
structure, we may now examine this structure according to
rural-urban and male-female populations*

si
(a) Rural and Urban Occupational Structure
In the proceeding.paragraphs, we have seen that majority
of population l ives in rural areas and only a very nominal
percentage of population lives in urban areas. Me have also
taken note of the fact that about 90 per cent of the to ta l of
Active workers are engaged in agricultural ac t iv i t i e s , although
if we take the region as a whole the percentage i s reduced to
29.7, mainly because a very large percentage consists of non-
Active population. The rural scene i s certainly vast and over
whelming so much so that even the character of urban centres
i s much affected by i t and Davis* amongst many others, has
observed that many towns and even c i t i e s are dominated by a rural 4
economy.
According to 1971 census, in rural areas 39.7 per cent were
Active workers while in urban areas this percentage was even
leas, i.e., 27.5 per cent. The fact that urban areas have so
little working population is a matter of concern and indicates
the need for broadening the economic base. Comparative figures
for nine broad categories of occupations in rural and urban
areas have been shown in table VII. This table also gives a
comparison of statistics for the years of 1961 and 1971 which
reveals that unemployment is on the increase,
(b) Rural and urban Occupational Structure by Male and Female population
According to 1971 census, amongst the Active workers in
A Davis, K,, The Population of India and Pakistan (London, 1951), p. 139.

52
rural areas, 56.6 per cent were male and only 8*6 per cent were
female. As compared to this, In urban areas, 47 per cent were
male and 3*3 per cent were female. Hale and female participation
in the nine broad occupations in rural as well as urban areas
has been summarised in Table VIII. As this table is quite
elaborate and comprehensive it presents several aspects for
further demographic research. Here, only the main points related
to demographic features of the town may be taken into account,
A comparative analysis of male and female employment in
rural and urban areas shows that both the male and female
population of the rural areas have many more Active workers than
their urban counterparts, it seems natural because rural areas
offer a good deal of employment in the agricultural sector* By
the same measure* females of the rural areas represent a high
percentage of employment in occupation as compared to their urban
counterparts* It may be noted that in agricultural activities
on a whole, females constitute a slightly higher percentage (93*9
per cent) than the males (88.2 per cent). It is also noteworthy
that the female participation in various occupations comes
down by SO per cent. This is mainly because the population is
large and growing fast and unemployment is much and increasing*
The scarcity of occupation is also indicated by the fact that
urban females are employed to a great degree in agricultural
activities in the form of labourers, for example, in 1961.
urban females constituted 3*63 per cent of agricultural labourers
but in 1971, this percentage had risen to IS.2 per cent, in 1961,

53
21.5 per cent of females mere employed in household industries
but in 1971, this percentage came down to 8,5 per cent* All
these figures show that occupational opportunities are very
limited in urban areas* In 1961, female agricultural labourers
constituted 23.3 par cent of the total working population but in
1971 they constituted 66.2 per cent. As regards the ratio of
males and females in unemployment, we find that 96.7 per cent
females are unemployed and 53 per cent males are unemployed.
Whatever employment available to the females is mainly in the
agricultural sector*
we have given three more tables (XX, X, XI) related to
occupational structure of population. They provide a comprehensive
analysis of occupational structure; sex ratio (i.e., females
per 1,000 males); and number of total workers in each occupational
groups in rural and urban areas. Moreover, these tables also
give a comparative distribution (females per thousand of males)
in nine broad categories of occupation in both rural and urban
areas*
2. process of Urbanisation in the Region
Urbanisation, in a demographic sense, is an increase in
thei proportion of urban population to the total population over
a period of time. It is a process which involves demographic,
economic, social, political, administrative and even psychological
factors.
Although at present the urbanization in the Trans-Ghaghara

54
Plain i s rather meagre, i t la a very old phenomenon in th i s
region, irfhen the Aryans advanced on to the region, they found
the non-Aryans had a well developed c iv i l i za t ion , well ordered
v i l l ages and towns. However, they themselves established a
number of towns of rel igio-cultural s ignificance. In the ancient
period, Sravastl, Kapilvastu and Kushinagar were developed towns.
m early medieval period, Gorakhpur and Bahralch became po l i t i co -
economic centres. In the late medieval period* the foundation
of modern urban centres were largely the result of the whims of
rulers .
As stated earl ier , at present the process of urbanisation
in the region i s very meagre and tardy. There are several other
problems relating to urbanism in the region. First ly , the
concentration of urban centres in certain region i s much greater
than in others. Secondly, there ex i s t s a wide gulf between the
development of lower c lass towns and higher c lass towns. Thirdly,
large urban centres are rapidly growing as they attract rural
population from their neighbouring areas* Fourthly, small towns
are e i ther very slowly growing or are s t a t i c and stagnant.
vio shall now deal and analyse these factors of the process
of urbanization in the Trans-Ghaghare Plain under the following
headst ( i ) Distribution of towns, (11) Growth of urban population,
and ( i l l ) characteristics of urban growth.
(i) Distribution of Towns
Although there are as many as 18 towns in the region, the

55
1
'"kf-i
r Yf
° o ° o m rSK
O O O
\^Y" ̂ 0 Of
A.. " O
e
o
o
w.

56
urban population remains small. Out of a to t a l of 12*863,618
in 1971, only 631,164 persons (4*9 per cent) were living in the
towns. These urban centres vary greatly in size and are also
very unevenly distributed (dee fable B).
TAB1£ (B)
Percentage to Percentage to foun total urban Town total urban
population population
1 Gorakhpur 36.56 10 Khalilabad 2.15 2 Bahralch 11*71 11 Utraula 2.00 3 Gonda 6.34 12 Ban s i 1.92 4 Basti 7.66 13 ColonelganJ 1*86 5 Deo r la 6.OS 14 Bhinga 1.36 6 Balrampur 5.73 IS Tulsipur 1.52 7 Pa<3rauna 3.08 16 Sarhaiganj 1,47 8 Nan para 2,97 17 Sivarhi 1.19 9 Gaura Barhaj 2.84 18 ftawabganj 1.15
•• IIIM<P»WWW^JI IIIIII -II *mm*mmmmmmmmmmBmmmmi*<*mmmmMmmmm*Mmmm*m*mm*m<mm&mmmmiM*mmmmmmmmmm*m»m^
\
From the above table, i t may be seen that three-fourths of
the t o t a l urban population i s contained in six towns while the
remaining only one-fourth of the population l ives in twelve
towns* These twelve towns are stagnant and have a very slow rate
of growth.
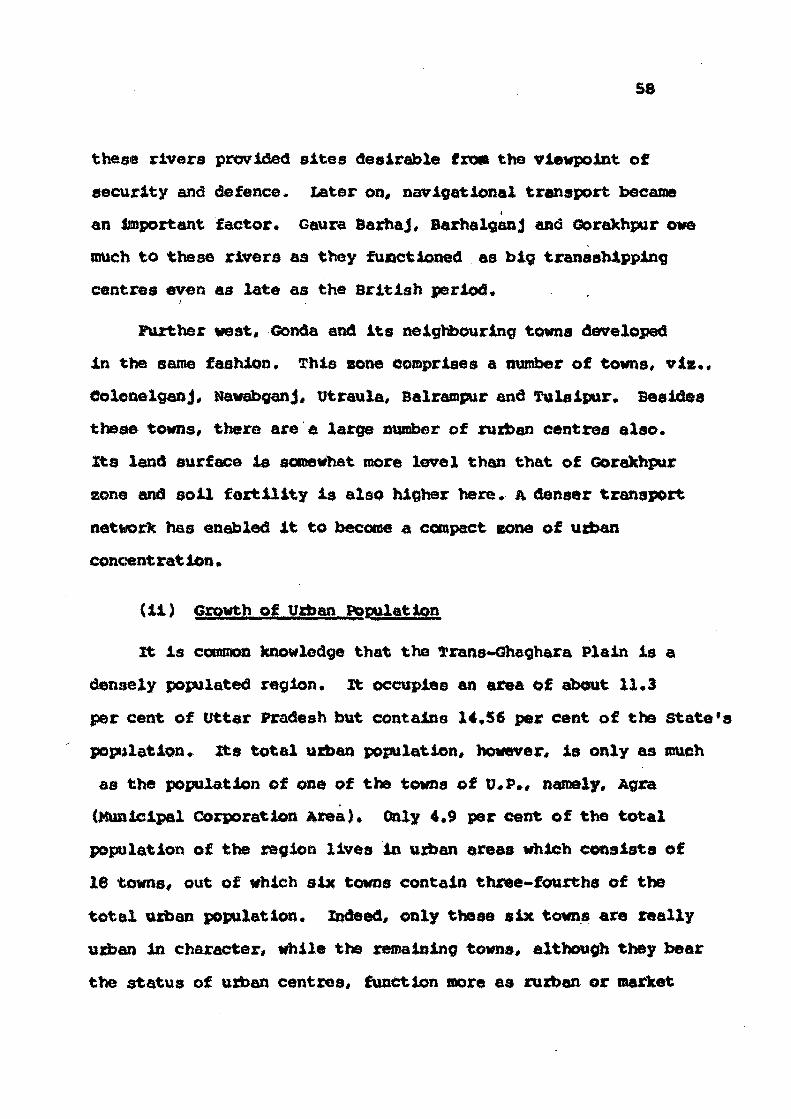
I t will be seen from the Fig. 6 that In general the degree
of urbanisation increases from west to eas t . The reason of t h i s
variation l i es in several factors such as physiography (more
broken topography and presence of numerous deserted channels in
the west), climatic conditions (undesirably moist and malarial

57
conditions in the west) and soil fertility (less productive
soil in the west}. There are infect two well marked zones of
urban concentration! (a) Gorakhpur and the neighbouring towns,
and (b) Gonda and the neighbouring towns*
These two eones are characterised by politico-economic
significance, for example, in the past Gorakhpur and its
neighbouring towns have been the strongholds of the Rajputs,
Bhars, Dome and Domkatars. In the late medieval period, these
towns were in the possession of the Muslins* In the historical
development, however, the struggle for the possession of the towns
resulted to the origin of compact villages for considerations of
security and defence* some of the bigger or more strategic
villages became rurban centres, market villages, which later on
turned into mandi (wholesale market) centres or towns, similarly,
Gonda and its neighbouring towns developed in the same fashion.
The two ssones of urban concentration became more differentiated
as a result of the advent of railways and the construction of
road net works and the provision of irrlgational facilities,
electricity, institutional establishments and so on.
The Gorakhpur sone of urban concentration lies in the eastern
part of the region, it comprises a number of towns, viz., Deoria,
Gaura Barhaj, Barhalganj, Padrauna, siwarhi and Khalilabad.
Besides these towns, there are a large number of rurban centres,
market villages and mandis which are situated in this eone. Zh
the demarcation of this eone of urban concentration, the Ghaghara
and the Rapti have played a very significant role. Originally,
58
these rivers provided s i t es desirable frofft the viewpoint of
security and defence. la ter on, navigational transport became
an Important factor* Gaura Barhaj, BarhalganJ and Gorakhpur owe
much to these rivers as they functioned as big transshipping
centres even as la te as the Brit ish period*
Further west, Gonda and i t s neighbouring towns developed
in the same fashion, This zone comprises a number of towns* v iz , ,
ColcnelganJ, NawabganJU utraula, Balrampur and Tulaipur. Besides
these towns, there are a large number of rurban centres also*
I t s land surface i s somewhat more level than that of Gorakhpur
zone and so i l f o r t u i t y i s also higher here, a denser transport
network has enabled i t to become a compact eone of urban
concent ra t ion •
<ii) Growth of urban Population
I t i s common knowledge that the Trans-Ghcghara Plain i s a
densely populated region. I t occupies an area of about 11,3
per cent of Utter Pradesh but contains 14.56 per cent of the s t a t e ' s
population, i t s to ta l urban population, however, i s only as much
as the population of one of the towns of U.P., namely, Agra
(Municipal Corporation Area), Only 4.9 per cent of the to t a l
population of the region l ives in urban areas which consists of
16 towns, out of which six towns contain three-fourths of the
t o t a l urban population. Indeed, only these six towns are really
urban in character, while the remaining towns, although they bear
the s ta tus of urban centres, function more as rurban or market

59
v i l l a g e s . Hence, i t la obvious that even though the region has
a considerable pressure of population, i t i s very l i t t l e
urbanised in comparison to many other regions of similar s ire
in India. It i s hardly surprising that the economy of the region
i s predominantly agrarian*
The to ta l population of the region has grown by 77.7 per cent
during 1901*1971* while the percentage of growth of urban popula
t ion in the same period i s 210*3* During the recent decade
(1961*1971)* the urban population of the region has grown by
36 per Cent, indicating that the rate of urbanisation has been
def in i te ly much more rapid in recent decade than in the ear l i er
decades* This i s s t a t i s t i c a l l y revealed by Table C
TABIS (C)
Decade Variation (per cent)
Census Year Population Decade
Variation
1901 1911 1921 1931 1941 1931 1961 1971
203* 351 181,735
196,012 248,798 308,328 362,964 464,167 631,164
-
* 21,616
• 16,277 * 50,786
+ 59,530 • 54,636
+ 101,203 • 166,997
-
- 10*6 + 8 .8 • 25 .6 • 23.9 • 17.7 • 27 .8 • 35.9
1901-71 + 427,813 +210.3
In 1901, there were 33 towns and unt i l 1951 there were
l i t t l e changes in th i s number. In 1961, the number of towns

60
changed drastically due to the "Census Definition of Towns".
But by 1971, the number of towns had risen due to greater
urbanisation. It may be said that the number of towns have been
varying not wholly because of urbanisation but due to the changes
in the census definitions from time to time, for example, Dcauna
in Bahraich district! Tulsipur, Khargupur and Katra in Gonda
district; Menhdawal in Dasti districtt Nautanwa, Siswa Bazar,
Pipraich, Gola urf Mandi, Banageon and C-orakhpur Railway Colony
(which was a separate town in 1951 but is merged with Gorakhpur
K.B.) in Gorakhpur district! and Lar, Rudrapur, Rampur and
Captainganj in Deoria district were classified as 'Urban Centres*
in 1951 Census but in 1961 Census these came to be classified
as 'rural*. In 1971 Census, sivarhi in Deoria district* Khalllabad
and Banal in Basti district and Tulsipur in Gonda district were
given the status of town. Some other such settlements are
Khalllabad, Sivarhi and Bansi, all previously classified as 'rural*
but have now become urban. The following table reveals the
pattern of changes in the number of towns.
TABLE (D)
Progress in the number of towns (1901-1971)
District 1971 1961 1951 1941 1931 1931 1911 1901
Bahraich Gonda Basti Gorakhpur Deoria
Trans-Ghathara Plain
3 6 3 2 4
18
3 5 1 2 3
14
4 8 2 8 7
29
3 9 2 9 7
30
3 8 3
110 7
31
3 8 3 e 9
31
3 8 4 7 8
30
3 8 4 8
10
33
U.P. 325 467 486 458 452 448 424 461

61
( i l l ) Characteristics of Urban Growth
The ent i re period covered by Census years 1881*1971 may be
divided Into five generalised periods of urban growth, These
periods may be distinguished as ( i) The period of slow growth
(1681*1891), U i ) The period of fluctuation, stagnation and slow
growth (1891*1901), (111) The period of decline (1901*1921),
Uv) The period of recovery and slight Increase (1921-1931), and
(v) The period of rapid growth (1931*1971).
te> The Period of slow Growth (1881*1891)
This period recorded a slow increase In the urban population.
This i s probably explained by the fact that population began t o
grow after the Revolution of 1857 as a result of peaceful
conditions and due to a number of developmental programmes,
however rudimentary, by the British administration. The towns did
s t a r t growing in the early period of the census years but the
rate of growth remained meagre un t i l the end of the century
and af ter t h i s the towns actually began to stagnant and even
decline. The factors which led to the growth of towns up to the
end of the century were the extention and improvement of roads;
the Introduction of railways; the establishment of c i v i l bodies
which led to a general improvement of c i ty conditions such as
drainage, sewerage, drinking-water fac i l i t ies* The set t ing up
of administrative and inst i tu t ional establishments, e .g . ,
d i s t r i c t hospitals, j a i l s , schools, post offices, railway stations,
courts, municipalities, clubs and parks gave a great impetus t o
5 Singh, 0.P,, "Growth of Population in disable Towns of Uttar Pradesh*, Geographical Outlook, Vol.XI, 1975-76, pp.113-14.

62
the growth of towns both in number and s i r e . The attraction of
better urban l i f e attracted a large number of rural population
to the towns.
(b) The Period of Fluctuation. Stagnation and slow Growth (1891-1901)
This period stay also be characterised by a wavering growth
of urban population, for whereas some towns experienced fast
growth, quite a large number of towns experienced only slow
growth and some even stagnanted and declined.
(c) The Period of Decline (1901-1921)
This period i s noted for the decline of urban population
throughout India* The urban population of the region in 1901
was 203,351 but by 1911 i t was 181-735 which meant a decline of
10*6 per cent . By 1921 i t rose to 198,012 but waa s t i l l lower
as compered to 1901. The factors which were responsible for the
decline of the urban population were the irregulari t ies in the
monsoon and consequent drought* floods, crop fai lures and famines?
wide-spread epidemic, diseases, and the adverse e f fect of
world war 1.
(d) The Period of Recovery and s l ight increase (1921-1931)
m t h i s period, the towns recovered as a result of improved
health services; more public u t i l i t i e s ; greater public f a c i l i t i e s ;
more ef fect ive control of epidemic diseases such as cholera,
influence; and establishment of various administrative and welfare
ins t i tu t ions .

63
(e) The Period of Rapid Growth (l?31*1971)
3% will be observed that since 1931 the urban population
of the region has been ©rowing rapidly* Better transportation
and general socio-economic development of the region has attracted
a large of migratory flow of rural population, part icularly to
the d i s t r i c t headquarters, the developmental programmes of the
post-independence period have gonerated a new urban growth similar
to the growth in the early period of Brit ish administrator*
I t may be concluded that the factors responsible for urban
growth include larger migration, greater politico-adroiniatrative
impetus, greater influence of transport routes and widening of
the socio-economic base* Deoria, a fast growing town, i s a
unique example of how a vil lage could grow into an important town
owing to the extention of transport l ines, particularly the
railways and increased administrative functions.
(3) Rural-Urban Relationship
there are no l»9B than 18 towns spread over the region in
such a manner that they provide a good example of rank-3ize re la
tionship, hierarchic pattern and rural-urban relationship* the
vi l lages which l i e around the towns are 17,293 in number and
hence give an average relationship of 960 per town* the very
large number of vi l lages associated with each town not only
indicates the meagreness of urbanisation but also the dominance
of the agrarian economy so much so that the urban centres
themselves assume some of the prevailing rural character* t h i s

$4
shows the need to enhance the urban economy by establishing
economic bases, e .g. , industries, trade, commerce, transport
and provision of infrastructures a t a l l levels*
The most fundamental relationship between the rural and
urban economies is that while the urban people do not grow the i r
own food and depend upon the farmer for sustenance, the fanners
depend on to the towns for sel l ing the i r produce and for obtaining
manufactured goods and technical services. On the whole* however,
urban or market f ac i l i t i e s ere parasi t ical to an extreme degree
which (Deans that even though the urban population i s dependent
on the farmers, the productive goods which they offer in return
i s much l e ss . The two sones of urban concentration which we have
described ear l ie r , bear closer rural-urban relationship. In the
same manner, six out of the eighteen towns, which are really
urban in character and contain three-fourth of the urban population,
bear closer rural-urban relationship as compared to the other
twelve towns which represent a vast scene of rura l i ty and have
one-fourth of the urban population of the region, these twelve
towns do not substantially serve the needs of the rural areas
although the rural areas provide foodgrains, vegetable, milk,
fuel (firewoods) and other agricultural products t o them. The
rural-urban relationship of the six towns, vie*, Gorakhpur,
Bahraich, Gtonda, Basti, Deoria and Balrasnpur, wil l be dealt in
Chapter IXunder the head "Comparison of urban Fields".
It may be concluded that the urban conditions, in terms of
both relat ive and absolute, are very poor, the towns have l i t t l e

65
resources to support the large number of villages. The number of
towns are also Inadequate In relation with the large size of
rural population. Hence, it is advisable that urban centres,
whether big or small, with adequate industrial and commercial
activities should be provided to enable a speedier growth of
rural economy. The region centrality requires a greater number
of new towns and new mandls to fill up the wide gap in the rural-
urban relationship.
(4) Functional Classification of Towns
Towns have been classified by social scientists such as
geographers, economists, sociologists and others, each adopting
different criteria of classification*
Hi geography, earlier attempts at non-statistical classifica
tions included the work done by Aurroueseau {1921), McKenzie
(1925), Hall (1934), Ogburn (193?) and several others* Later on,
statistical classification on the basis of functional speciali
zations were effected by several geographers such as Harris,
Kncedler, Povmall, Hart, Duncan, Relss and smith. The purpose of
6 Harris, CO., "A Functional Classification of Cities in the United states. Geographical Review, Vol.33, 1943, pp.86-99# Kneed ler, G.M., "Functional Types of Cities", Public Management, VOl.27, 1945, pp.!97-203i Pownall, L.L#, "The Functions of New Zealand Towns", A.A.A.G.. Vol.43,1953, pp.332-50; Hart, J.F., "Functions and Occupational Structure of Cities in the American South", A.A.A.G., Vol.45, 1955, pp.269-69; Duncan, 0.D. and Reiss, A.J., "Social Characteristics of Urban and Rural Communities, Part XV, "Functional Specialisation of Communities", London, 1956i smith, R.H.T., "Methods and Purpose in the Functional Town Classification, A.A.A.G., Vol.55, 1965, pp.539-48; Smith, R*H.T., The Geographical Relevance of Functional Town Classification (Mimeographed}, 1964.

66
these authors was to determine the intensity of specialisation of
the various functions of a city. The earlier methods of classifi
cation of cities (Harris, Kneed ler, Jones, Hart) were that a
percentage was chosen above which a city was considered to be
specializing in a particular function* The later methods (e.g.*
Pownail, Nelson) gave more precise measures to determine the degree
of specialisation in a function, Fownall followed the simple devia
tion formula while Seison used the standard deviation formula to 7
measure the intensity of specialisation in a function.
m India, one of the earliest workers regarding the functional
8
c l a s s i f i c a t i on of c i t i e s i s tha t of Lai, who in h i s doctora l t h e s i s
followed an approach s imilar t o t ha t of Duncan and Reiss . Ha,
however followed a di f ferent method which involved the determination
of functional spec ia l i sa t ions of c i t i e s on the bas i s of "location
Quotient" (LQ). The LQ for c i t y x in industry Y i s Percent of a l l workers in c i t y x in industry Y
The median per cent of a l l workers in industry X in a l l the c i t i e s
The c i t i e s with LQ value between 90-109 in any industry o r
service i s considered a "normal** spec ia l i sa t ion in t h a t function.
7 Wei son, H . J .^A service Class i f ica t ion of American Cities'*, Economic Geography. Vol.31, 1955. pp.169-210.
8 Lai, A., Some cha rac t e r i s t i c s of Indian C i t i e s of Over 100.000 inhabitants in 1951, with specia l reference t o t h e i r occupational s t ruc tu re and functional specia l iza t ion (unpublished Ph.D. t h e s i s , Department of Geography, Indiana University, 1958). Also see Lai, A.,"Some Aspects of Functional Class i f ica t ion of C i t i e s and a Proposed scheme for Classifying Indian C i t i e s " , K.G.J . I . . Vol, 5, 1959, pp. 12-24.
9 Quoted by Ahmad, Q., Indian C l t i a s i Charac ter i s t ics and Correla tes (Chicago, 1965), p . I s .

67
Thus, the re are four a rb i t a ra ry posi t ive values which are
derieved with reference t o the median for measuring the s p e c i a l i
zation in major industry groups, while the minor values are
c l a s s i f i e d in to normal and above normal In tens i ty c l a s s e s .
Another attempt was tha t of Singh, who c l a s s i f i ed the towns
of Cfttar Pradesh by working out the percentage of working popula
t ion in d i f ferent groups of occupation. The towns appeared
t o have high percentages of working population in more than one
occupation. Therefore the method of standard deviat ion as used
by kelson was followed t o c lass i fy towns in d i f ferent categories
such as i ndus t r i a l , commercial, t r anspor ta t iona i , a g r i c u l t u r a l ,
service-type and d ivers i f ied type .
Ahmad c l a s s i f i ed the Indian c i t i e s on the bas i s of mul t i -
factor o r mult ivarlable deriving the r e su l t through the use of
mul t ivar ia te s t a t i s t i c a l techniques. Ha argued t h a t t h i s method
could minimise the area of human judgement and decision and may
guarantee the use of standard measures and help in comparing 11 r e s u l t s obtained a t two di f ferent points in time* Furthermore,
i t could " f a c i l i t a t e optimal a l locat ion of newly observed 12 individuals t o ex is t ing groups". Ho b u i l t upon the tfoser and
13 Scott methodology, and selected sixtytwo var iab les t o cover
10 Singh, K.N., "Functions and Functional Class i f ica t ion of Towns in y t t a r Pradesh*, H.G.J . I . . Vol.5, 1959, p.121-41.
11 Ahmad, Q.t o p . c l t . , p .16. 12 Berry, B.J.L., "A Note Concerning Methods of Classification",
A.A.A.G., Vol. 48, 1958, p. 300.
13 Moser, C.A., and Scott, w.# British Townsi A Statistical Study of Their social and Economic Differences, Centre for urban studies, Report, No. 2 (Edinburgh, 1961).

68
a va r i e ty of the relevant aspects of urban s t ruc tu re such as
physical , socio-economic, c u l t u r a l and so on*
Amongst other Indian geographers and scholars who have
made a few attempts towards the problem of c l a s s i f i c a t i o n are
Janki , Prakasha Rao, Rafi l lah, Kukherjee and Singh and s inghs .
Jariki c l a s s i f i ed towns of Kerala, showing the impact of physical 14
and economic factors on their functions and growth, Prakasha
Rao criticised the method of Kelson which he considered
unsuitable for towns having a large range of population size.
He, however, suggested a least square linear regression method
in which the two axes respectively show population size of the
towns and proportion of persons to total in a particular function IS
and a line of central value is determined. Rafiuilah modified Weaver's formula and developed a new technique for the functional
classification of towns which he applied to the towns of the
16
Upper Ganga-Yanaina Doab. Kukherjee followed Webb's method
and devised s t a t i s t i c a l l y a functional index and a spec ia l i sa t ion
index for a l l the towns of Bihar, al thouth she combined the
two methods* i . e . , the *surplus* method of Matt i la and Thomson 17
and the functional index of specialization index method of Webb. 14 Janki, V.A., "Functional Classification of Urban Settlements in
Kerala", Journal of Maharaja Savali Rao University of Baroda, Vol.3, 1954, pp. 91-90.
15 Prakasha Rao, V.L.S., Presidential Address, Council of Geographers, Cuttack, 1962.
16 Rafiuilah, s.tt., *h New Approach to Functional Classification of Towns", The Geographer, Vol. 12, 1965, pp. 40-53.
17 Kukherjee, M., Functions and Functional Classification of Towns in Bihar (Unpublished Ph.D. thesis). Department of Geography, university of Patna, 1966.

69
Singh attempted t o use a double-Index method t o determine
the quant i ta t ive functional significance (or rank)of each cont ro l
place in Uttar Pradesh. Two types of indices ~- Functional
Special izat ion Index ( F . s . I . ) and Functional Cent ra l l ty index
( F . c . i . ) — were selected t o represent the spec ia l i sa t ion and
heirarchy of cen t ra l p ieces . The various c lasses of spec ia l i za
t i on such as l e s s special ized, special ised, very much special ized,
highly specia l ised and extremely special ised, s t a t i s t i c a l l y
denoted as SO*, SD^, StL* SD3, S©4 and above, were weighted
against t he mean functional percentage. This was ca l led Functional
Special izat ion Quotient, tha t i s t he r a t i o of functional share
and s ize share of a c en t r e . Six functional ca tegor ies , namely,
( i ) household industry, ( i i ) manufacturing, ( i i i ) commerce, 18
( iv) t r anspor t , (v) service and (vi> diverse were d is t inguished.
The same method was followed by singhs who c l a s s i f i ed the service
cent res of the saryupar Plain (The Trans-Ghaghara P l a i n ) . They
se lec ted 109 service cent res (16 towns and 91 rurban cent res o r
market v i l l a g e s ) t o find out the functional s t ruc tu re , h i e r a rc i ca l
order and degree of functional spec i a l i s a t i on . They arr ived a t
the conclusion t h a t household industry cent res were uniformly
d i s t r i bu t ed over most of the region. However, as many as 8 out
of 11 specia l i sed centres were s i tua ted between Gorakhpur and
Bas t i . Manufacturing centres (sugar fac to r ies ) were sca t te red
along the railway l i n e . Transport centres were confined in the
c e n t r a l par t of the region and centres of miscellaneous services 16 Singh, O.P., "Functions and Functional Classes of Central
Places in Uttar Pradesh", N.G.J.I., Vol, 15, 1968, pp.83-127.

70
were well dispersed, while 44 centres of d ivers i f i ed type had 19 no spec i a l i s a t i on .
The r e s u l t s obtained by Singhs were as followst (The
abbreviations used being (H) household, (M) manufacturing,
<C) Comae rce , (T) t ranspor t , (S) services and (0) d iverse ;
nuicber in pref ix signifying the functional hierarchy while the
number in suffix indicat ing the level of spec ia l i sa t ion and
the syrrfool (*} indicat ing near the SD^ l eve l of spec ia l iza t ion) ,
1 Gorakhpur 1 By 1 M , I T ? / 1 D. 2 Bahralch 2 M^ 3 Ty 2 S^ 3 Gonda 2 M , 2 T^, 2 3 , , 2D1
4 Bas t i 3 T? , 2 S2
5 Deoria 3 T , 2 S2# 2 P .
6 Balrampur, 2 ***, 3 T r 2S2 , 2D2
7 Padrauna 2M2, 3Tl# 2s , 2D2
6 Nanpara 3M , 2S^, 2D2
9 Gaura Barhaj 2D,
10 Khalilabad %viy 2C*, 3Sy 2D2
11 Utraula 3M r 4S2
12 Bans! 4s , 3D2
13 Co lone lgan J 3M1# 3C«, 4S , 3D2
14 Bhinga, 3M2, 4S , 3D2
15 Tulsipur 3M-, 2C,, 4?^ 38^
16 Barhalganj 3D3
17 Slwarhi 2M-, 3C^
16 Nawabganj 3M^, 43^
19 Singh, R.B. and Singh, C.B., "Functional Classification of service Centres in saryupar Plain, Uttar Bharat Bhooqol Patrlka, Vol. 13, 1977, pp. 45*66.

71
The above functional classification of towns, purposeful
as they are, suffer from lack of uniformity in the choice of
measures of the degree of specialization of the functions of a
city. Most of the authors themselves acknowledged that the
choice was largely arbitrary,
Vet another problem in the following double index method
is that of conceptual limitation. For example, the towns of the
region like other hundreds of Indian towns are very much rurban
or agroville centres bearing their own typical functions. To
work out the specialisation of functions at this stage seems to be
merely a quantification exercise. It may be more meaningful to
find out whether a town is monofunctional, or bifunctional or
trifunctional and so on to develop in a more planned basis. For
this purpose, we may apply the formula given by Rafiullah which
is as followsi
° o / :>©* - £ D 2
^- P n
where o i s the deviat ion; Dp i s the pos i t ive difference; Dn
i s the negative difference, and N i s the number of functions.
The r e s u l t s we have thus obtained for the functional c l a s s i f i c a t i on
of the towns of the Trans-Ghaghara Plain are as followst
1* Gorakhpur (cuad Afunct iona l ) , Diversified, Transport, Trade and Comrrerce, Manufacturing.
2 . Bahraich (Quadrifunctional), Diversif ied, Trade and Commerce, Primary a c t i v i t i e s (Agriculture), Manufacturing.
3 . Gonda (Quadrifunctional), Diversified, Trade and Commerce, Transport, Manufacturing.

7a
4. Basti (Trifunctional), Diversified, Trade and Commerce, Primary Activities (agriculture).
5. Deoria (Trifunctional), Diversified, Trade and Commerce, Primary activities (agriculture).
6. Balrampur (Trifunctional), Diversified, Trade and Commerce, Primary activities (agriculture).
7. Padrauna (CMadrifunctional), Trade and Commerce, Diversified, Manufacturing, Primary activities (agriculture).
8. Nanpara (Quadrifunctional), Diversified, Primary activities (agriculture). Trade and Commerce, Manufacturing.
9. Gaura Barhaj (Trifunctional)* Primary activity (agriculture). Trade and Commerce, Diversified.
10. Khalllabad (Quadrifunctional), Primary activity (agriculture). Trade and Commerce, Diversified, Manufacturing.
11, Utraula (Trifunctional), Diversified, Trade and commerce. Manufacturing.
4
12* Bans! (Blfunctlonal), Primary activities (agriculture). Trade and Commerce.
13. Colonelganj (trifunctional)* Trade and Commerce, Primary activities (agriculture). Diversified.
14. Bhinga (Quadrifunctional)* Primary activities (agriculture). Manufacturing, Diversified, Trade and Commerce.
15. Tulsipur (Quadrifunctional)* Diversified* Trade and Commerce, Manufacturing, Primary activities (agriculture).
i
16. Barhalganj (Quadrifunctional)* Trade and Commerce, Diversified, Household* Primary activity (agriculture).
17. siwarhi (Trifunctional)* Trade and Commerce, Manufacturing, Primary activities (agriculture).
18. Nawabganj (Quadrifunctional)* Primary activities. Trade and Commerce, Diversified, Manufacturing.
•Diversified' here is used to denote the characteristics
of all functions.
This classification may be compared with that of Slnghs*
classification given before. Gonda, Basti, Deoria, and so on

73
are classified by Slnghs as manufacturing, transport, and trans
port respectively, AS can be seen, our results are totally
different.
(5) Hierarchy of Towns
The hypothesis regarding hierarchy of towns denotes the
ranking and grading of towns into various groups on the basis
of size or some other selected basis. These groups of urban
centres are supposed to be functionally organised in a nesting
pattern and arranged in such a manner that the lower order
urban centres occur within the catchment areas of higher order
urban centres. The higher order urban centres are believed to
occur at a greater distance from each other than the lower order
urban centres*
The region under study is peculiar in the sense that it is
surrounded by either political boundaries (national-international)
or by natural features (the Ghaghara and the Gandak). This region
therefore presents some contrasting features in the spatial
arrangement of urban centres and in the location of central
places and rank-size relationship.
To begin with, we may classify the towns according to their
population size. The first and the most fundamental grading
of the towns may be made by the 1971 census. Thus we obtain
the following hierarchy of townst
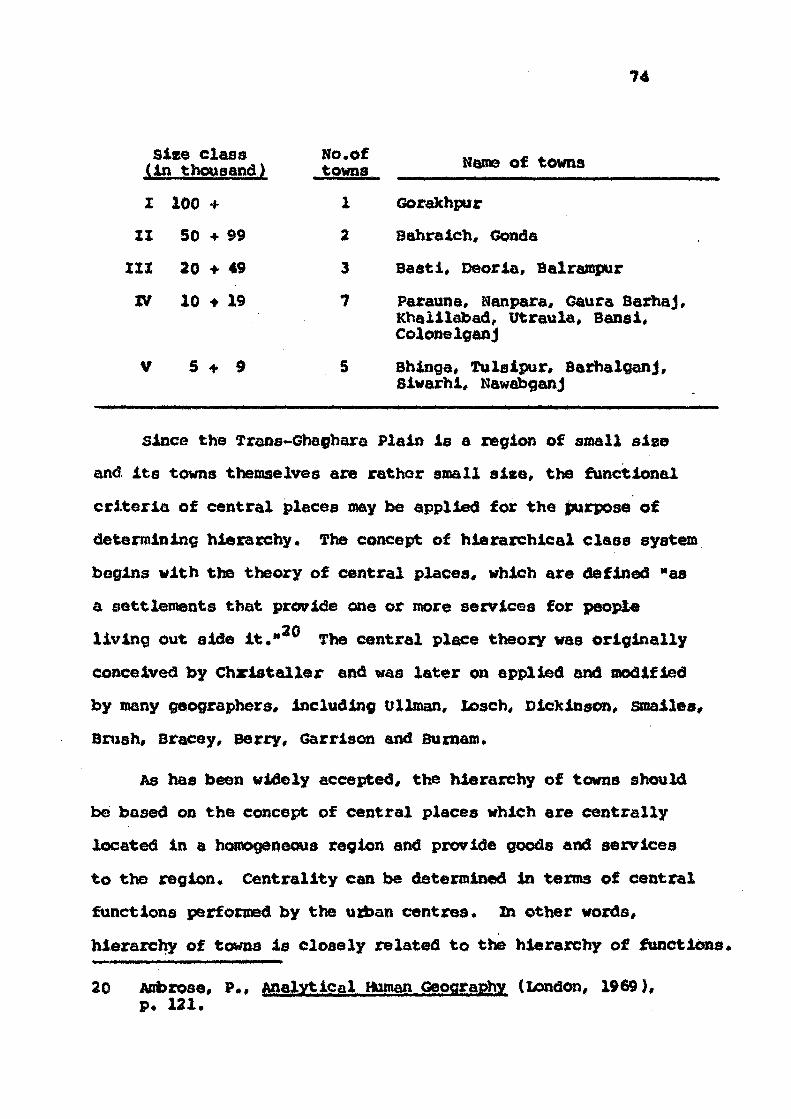
74
Size class No.of (in thousand) towns Name of towns
I 100 + 1 Gorakhpur
II 50 + 99 2 Bahralch, Gonda
III 2 0 + 4 9 3 Basti, Deoria, Balrampur
IV 10 + 19 7 Parauna, Nanpara, Gaura BarhaJ, Khaillabad, Utraula, Banal, ColonsleanJ
V 5 + 9 5 Bhinga, Tulsipur, Sarhalganj, Siwarhl, Hawabganj
Since the Trans-Gheghara Plain is a region of small size
and its towns themselves are rather small slse, the functional
criteria of central places may be applied for the purpose of
determining hierarchy. The concept of hierarchical class system
begins with the theory of central places, which are defined "as
a settlements that provide one or more services for people
20 living out side it." v The central place theory was originally
conceived by Chriataller and was later on applied and modified
by many geographers, including Ullman, Losch, Dickinson, smailes.
Brush, Bracey, Berry, Garrison and Burnam.
As has been widely accepted, the hierarchy of towns should
be based on the concept of central places which are centrally
located in a homogeneous region and provide goods and services
to the region. Central it y can be determined in terms of central
functions performed by the urban centres, Zn other words,
hierarchy of towns is closely related to the hierarchy of functions.
20 Ambrose, P., Analytical Human Geography (London, 1969), p. 121.

75
The functions which are common in a l l the towns of the Trans*
Ghaghara Plain* are for example, trade and commerce, adminis
tration and transport. These nay be taken into account and
functional welghtages nay be given according to rank-size as
well as urban fields* However, keeping t h i s in view, we may
group the towns into four hierarchical ordersi (1) Regional
town, (11) sub-regional towns (or District towns), ( i l l ) large
market towns (or Tahsil towns), and (Iv) small market towns
(or Block Towns).
(I) Regional Town
In the Trans-Ghaghara Plain, there i s only one regional
centre, namely* Gorakhpur. It Is the divis ional headquartsrs,
the d i s t r i c t headquarters and the tahs i l headquarters. As far
as administration Is concerned* th i s town i s the f i r s t In the
rank of hierarchical order* It i s a big centre of trade and
commerce* transport* education (university) and so on. Zt i s
the regional centre, par excellence.
( II ) sub-Regional Towns (or Dis tr ic t Towns)
There are four sub-regional centres. They are re lat ive ly
small insize and lesser in status in comparison with the
regional town* They are relat ively evenly distributed over the
region. The towns are Bahraich, Gonda, Bast! and Deoria* each
of which Is d i s tr i c t headquarters* These towns have Degree
Colleges* hospitals* courts and a considerable amount of trading
and coranerciai a c t i v i t i e s .

7€
( i l l ) Large Market Tovms (or Tahail Towns)
In t h i s group* there are seven towns, v i z . , Balrarapur,
Padrauna* Nanpara, Gaura Barhaj* Khaliiabad, tltraula and
Banai, All these towns are tahs i l headquarters except the town
o£ Gaura Barhaj, Thoy are evenly distributed in terms of
administration, but not in terms of other functional a c t i v i t i e s .
These centres Have generally Intermediate Colleges* High schools*
and in roost cases Degree co l leges . These towns a l so possess
small hospitals* post and telegraph of f ices , banks and so on*
Civ) small Market Towns (or Block Towns)
There are s i x towns in th i s category* These are Colonelganj,
Shlnga* Tulslpur, Barhalganj, Siwarhi and Nawabganj. Most of
the towns are the headquarters of Block ( i . e . , sub-division of
Tahsi l ) . These centres do not have many functions and urban
u t i l i t i e s and f a c i l i t i e s but generally possess educational
inst i tut ions such as Intermediate Colleges* High Schools and
Higher Secondary schools. These towns are fa ir ly well distributed
spat ia l ly .
To sum up* the towns of the region may be c lass i f i ed into
an hierarchy according t o the ir administrative and commercial
functions as a lso on the basis of extant industries, transport
and other services , AS can be BB&n, industrial and transportational
a c t i v i t i e s are rather meagre in th i s region* As for commerce,
i t i s the most evenly distributed urban function* while adminis
trat ive services are arbitrarily distributed owing t o the

11
preferential pol ic ies of the government. Hence, two functions
(trade end commerce, administration) may be taken as the hases
of a hierarchic pattern of c las s i f i ca t ion . Hierarchy of towns,
thus studied, may be of great valise for the pJbai)fUu$, a«4^
development of the region, / ^ " "" ^ C ^ . /fit r Ace No. X^^X
y T^oao d l&) Siee and Spacing of Towns \ ^ ^^\^y
Several terms are used to denote the demc%rlpl̂ i«-, 3̂patial
relations among towns* These include "network", "pattern",
"spacing*, •complex** "heirarchy*, and "system*. Following
Browning and Gibbs, we stay use the term "system*. The size and
spacing of towns is an important aspect of their locatlonal
analysis for towns exhibit a certain order in their distributional
pattern over the space* the bigger towns being spaced widely and
smaller towns being,somewhat closer together. Regional urban
systems and territorial town associations of towns differing in
sisce* scale, functions and degree of maturity as well as the
extent to which they have shaped up, have been studied by
researchapff using different approaches and techniques. The idea
of siee and spacing relationship among the towns of a region
was first mooted by Chrlstallor in 1933. Later came 3l$f*s
"Rank-Size Rule" in 1941 and "Nearest Neighbour Analysis",
followed by a number of studies In different countries - to 21 22
mention few, Losch , Brush and sracey, Berry and
21 Loach, A., The Economica Of Location (New Haven, 1954).
22 Brush, J.e. and Bracey, H.E., "Rural Service Centres in South Western Wisconsin and Southern England", Geographical Review, Vol. 45, 1955, pp. 559-69.

78
Garrison, Stewart, Browning and Gibbs, and Dacoy. m
India, the re appears t o be only few s tud ies made so far in which
attempt has been made t o apply rank-s ise ru le and the neares t 27 neighbour analysis*
The 33#227 sq . k» area of the Trans-Ghaghara Plain has as
many as eighteen urban cent res of d i f ferent s ixes , the town
ranging from c l a s s I t o c l a s s V. tie f i r s t apply the rank-size
ru le t o these towns, and l a t e r on do the nearest neighbour
analys is*
(1) Rank-Size Rule
Although in 1913 Auerbach had indicated tha t there i s some
regular r e l a t ionsh ip between rank and s ize , the concept was
systematized by Zipf through h is empirical f indings . He ca l led
i t the "rank-s ize ru le" (now a l so known as "zipf*a rule**). This
ru le s t a t e s t h a t i f a l l towns in a region a r e arranged according t o
23 Berry, 8 . J .L . and Garrison, v?.L., "Alternative Explanations of Urban Rank-size Relationships*, A.A.A.G., Vol. 48, 1958, pp* 63-91*
24 Stewart, C.T. J r . , "The Size and spacing of Cities*1, Geographical Review. Vol. 46, 1956, pp. 222-45.
25 Browning, H.L. and Gibbs, J . P . , "Some treasures of Demographic and Spat ia l Relationships Among Cities**, Urban Research Methods, ed. J«P* Gibbs, (Raw Delhi, 1961), pp. 436-59.
26 Dacey, M.F., "Analysis of Central Place and Point Pat terns by a Nearest Neighbour Method", Lund s tud ies in Geography, ed.K. Norborg, 1962, pp* 55-75.
27 Reddy, N.B.K., -a Comparative Study of the Urban Rank Siee Relationship in the Krishna and Godavari Deltas and south Indian states'*, N .G.J . I . , Vol, 15, 1969, pp. 69-90f Kisra, H.N., The Size and spacing of Towns in the Umland of Allahabad*, The Geographer, Vol. 22, s o . l , 1975, pp. 45-55*

79
the i r population in a descending order, the size of the r i s
1/r the sisse of the largest town, according t o the series 1, l/%,
1/3, 1/4 . . . 1/r. I t may s t a t i s t i ca l ly be represented ast
P » r rq
where *> P i s the population of a given c i t y .
« r i s the rank of the sice of the c i t y . q
« P, i s the population of the largest c i t y .
Stewart has conaaented that the rank-sise rule i s an empirical
finding and not a theoretical or logical s t ructure. The rule
i s a be t te r description of real i ty for large heterogenous areas
than for small homogeneous areas, where town size, spacing and
functions are most closely interconnected* Ha has further
cautioned that the region to which i t applies must be complete
and self-sufficient , i . e . , not a part of a larger region or 28
greatly overlapping another region.* Berry and Garrison have
presented a valuable discussion of the applicabil i ty of r&nk-
sirce rule and they, amongst others, have not found i t up t o the
mark.
Application of the Rank-Size """ Rule
The rank-size relationship of the towns has been shown on
the log graph with size class as the ordinates and town rank
as the abscissa (Pig. 6A}. I t may be seen that the curve i s
not in conformity with the rank-size rule . It does not show any
28 Stewart, C.T. J r . , op. c l t . , p. 223.

60
mA
RANK- SIZE RELATIONSHIP
1971
S 4 9 4 7 • t K> II I t l» M 19 U H> • ANK
F.3.6A

ei
l inear relationship, i t has no resemblance with Berry's inter*
mediate "distribution type". There i s a largo gap in the
curve of the hierarchy of population s i s e s . The s i ze ratios of
towns show great deviations from the theoretical rat ios , 1.00,
0.50, 0.33, 0.25, 0.20, e t c . , as postulated by the rank s ire
rule. For example, s ize ratios of Gorakhpur, Bahraich, Gonda,
Basti, Deoria and Balrampur do not correspond with the theoretical
ratios given above. The degree of deviation increases further
in the case of a l l small s ize towns. Therefore the rank-size
rule evolved by Zipf here i s not suitable .
Hence* we have followed the method given by Browning and
Gibbs. In th i s way, the application of the rank-sise rule to
the towns of the Trans-Ghaghara Plain has been shown in Table E.
The figures (Column 5) , though hypothetical, represent the
alze of each urban centre in accordance with the reciprocal of
rank (Column 3 ) . h comparison of figures in Columns 4 and S
shows that the expected and the actual distribution are not the
sense. The overall index of deviation, i . e . , the measure of lack
of conformity to rank e l se rule for the region i s 10*7 per cent
(the greater the percentage, the l e s s the conformity) which wi l l
have t o move frcn on© town to the other for a perfect correspondence
between the expected and the actual e l s e . But as Gorakhpur with
about a s l i ght ly l e s s t o the half of the to ta l deviation of a i l
tovTis dominates the region, the movement of population according
to t h i s rule should go to other towns from Gorakhpur.
29 Berry, D.J.L., "City Size, Distributions and Economic Development", Economic Development and Cultural Chance. Vol.9, 1961, PP* 575-88.
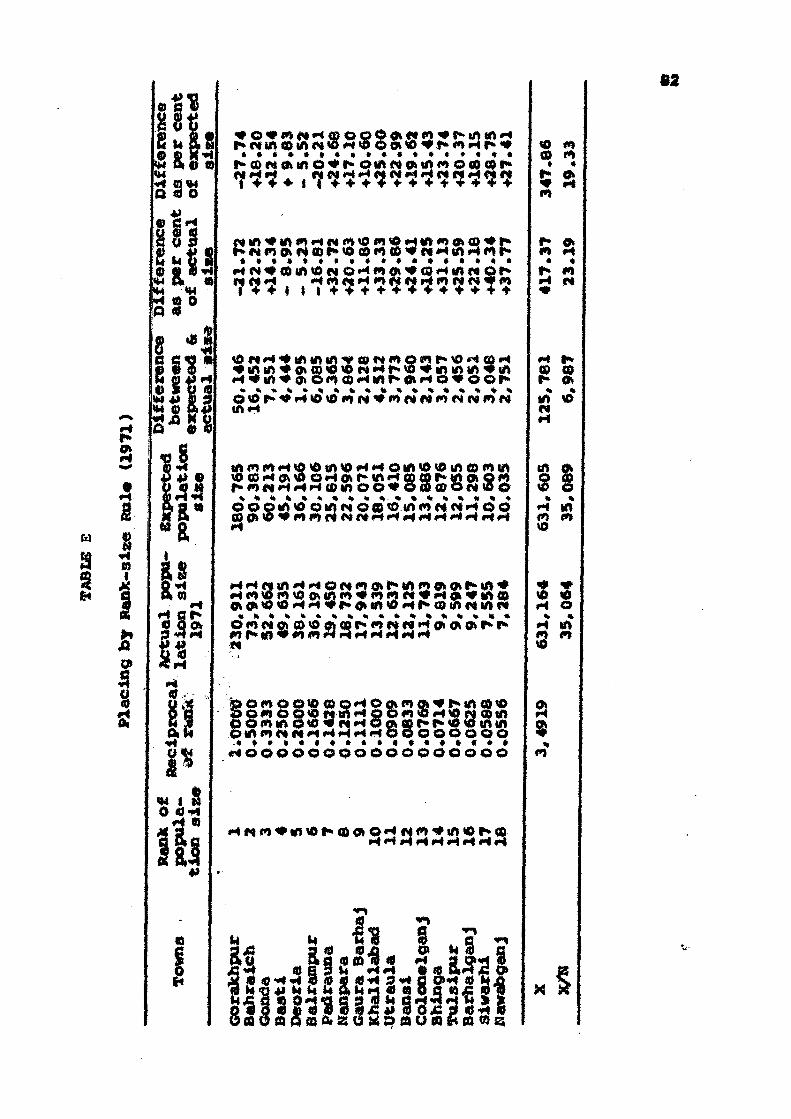
s
J5 i
IS I
X
I
9 3 2!
5S5T,::?55s353?355?5
3i5mi3S3tt3S*S!8
to m
m « • *
ft H
• «
4 w
» % * V
mtoo*inm«<n<*t*t*f-t0t<«tf»a
» » » » » » »
IPgs^^ssssna^0*01^^^
go n o o v a o H O A n 0 « O 0 * M t f » H Q O «
O O r t « 0 » " » « H O » f
_ ) Ok <* !•* if) CO tO o o * M i r t H o b n 4 H O N « i i n
w »- - . tf> O « • «M H © (ft CO f* I * <0 « «f» III O l A m t l N i H H H H H O O O O O O O O
H O O O O O O O O d O O O O O O O O
0>
013
ihl u
# B 3 w «•* H = -- — • • T -
ttu»ftn«st
*« CO f % trt f* H
tfl
8 *
^ m to
<# to H % H «5 tO
S 3 * «
i* CD Ot « to
s » tn «*»
^
to o • tft <**
X

•3
To establish the average discrepancy between the actual
and expected s i s e of individual towns independent of their
size* we may u t i l i s e column 1 of Table A. The average number
i s .23.19 t o f i t the rank-size rule of the towns of the region
which would have t o increase or decrease, the figures in Colusa 8
are more useful for describing the correspondence between urban
hierarchy and the rank-size rule. These figures Indicate the
error percent in predicting the population which i s 19*3 on an
average for the region as a whole.
Table F in support of Table E. shows the pattern and the
direction of deviation. Columns 2 and 5 (Table D) have been
narked with positive and negative signs t o show the extent and
the direct ion. The sinus signs in Column 2 show that Gorakhpur,
Baati, Deoria and Balrampur would have t o decrease and the
remaining towns would have t o increase by percentage with plus
signs noted against them t o conform t o the rank-size expectation.
For example, the maximum increase wi l l be in case of siwarhi
(40.34 per cent) and the minimum in case of Gaura Barhaj (11*66
per cen t ) . Similarly* the minus signs in Column S Indicates
that the actual s i s e exceeds the expected s ise* For example,
the expected s i ze of Gorakhpur (27.74 per cent} , Balrampur
(20.21 per cent) , Basti (9.83 per cent} and Deoria (5.52 per cent}
are very low. Positive signs indicate that the expected s ize
exceeds the actual s i s e .
since the towns of varying e l se c lasses have been considered,
no def inite pattern i s discernible. The rank given in Columns 3

64
fa
a
* w »* tA r* o» <Mn *n <c * r» o <* «o ® w H #*>
*> o an)1
ib™ H f ^^l i u
• 4 3 8 2 Mx> ft*} a 8*
ffl 0 0 «s
1"!
1 * 4 - 1 I I + + 4- + + 4 -4 -+ + + + *'
H Ollrt f* CO ** + ** *> <*> <0 00 rt trt P» © H W
»-* M * © m <0 ci o H <n c* "* ® H to w o h f + • I I ! + • • + • • + • • • + •
it j8 fi<o *»
i 0>
SQ Q 0 0 ID Q i OX! Bi O 05 Q » 0. 55 0 «
M H H 0 0 S n i : i*
(4
0
§>
3
o
&
I 0 4*
2 " * s H «
i «
M o 3
P w 0
ie if
ci
+»o «3*»
4U *4*« 0
w
s i. * t !
ss 0 ft
Is t»
* >
S3
4g
&*S £ *

m
and 8j 4 and 8 and 7 and 8 show the reverse relationship, the
rank-order coefficient of correlation being -0.60, -0.66,
-0-66 respectively. It i s evidently c lear that the large towns
have actual size greater than the expected size while the
reverse i s true for small towns. The rank size order i s
disturbed due t o the dominance of Gorakhpur the index of 31 primary being 3 .1 . Besides low level of urbanisation, tardy
and meagre growth of towns which bear the characterist ic of
rujcban or agroville centres are the other important factors
to disrule the rank-size relationship. Hence i t may be said
that the "Law of Primate city* postulated by Mark Jefferson i s
somewhat t ruer than the rank-size rale in the case of the
Trans-Ghaghara Plain,
( l i ) spacing of Towns
It i s obvious that in urban geography the spatial relations
am important and should be able t o see the arrangement of
towns, the distribution of location points over the space, and
the concentration or dispersion of urban settlements, As in
the case of the population s i te ranking, so here also the
guestion arises as to whether there i s any identifiable pattern
in the spat ia l distr ibution of towns. This query has led a
number of geographers t o deduce that locational patterns in . il ] .in «. imninlii i i n in < i iiiimin.uiii—i
2 30 r * 1- 6 d /K(N2-1) where d is difference between each
pair of ranks and N is the number of cases (Eighteen in this Instance J.
31 two town Index of Primacy * P1/P2 where PI is population of the largest town and P2 is the population of the next order town*

8*
some way reflect and condition the functional relations among
towns, with the explosion of the use of quantifications in
geography, various models, schemes and explanations have been
32 put forward. * For example, Gibbs used the formula to calculate
the hypothetical distance which is as followst
Hd • 1.11/ ~f~
where US i s the hypothetical dis tance, A i s the area in sg> km, 33 and N i s the number of towns. King calcula ted the r a t i o s of
'aggregate*, random and uniform spacing by using the formula
R m \JSpi%/* f o r exP*esslng the pat tern of urban se t t lement .
These theor iza t ions are based on the concept of *Near neighbour
Analys is ' •
Near Neighbourhood Analysis
The fact t h a t the idea of Near Neighbour Analysis was f i r s t
formulated by plant ecologis t s who were concerned chief ly with
explaining the d i s t r i bu t iona l pa t tern of various species of 35 p lants on the ea r th surface . The concept of the neares t
32 Thomas, E.N,, " s t a b i l i t y of Distance-Populat ion-si ie Relat ionships*, Proceeding of the iund s tudies in Geooraphy, ed . K.Norborg, 1965, pp. 13-29; King, L .J . , The Spacing of Urban Places in the united s t a t e s . Unpublished Ph.D. Thesis , Department of Geography, S ta te Universi ty of Iowa, I960; Vuicich,G., "An Analysis of the Spacing of the Small Towns in Iowa, unpublished Fb.D. t h e s i s , Department of Geography, Sta te University of Iowa, I960*
33 Browning, H.L. and Gibbs, J . P . , o p . c i t . , p . 453. 34 King, L.J . , "A Quantitative Expression of the Pattern of
Urban set t lements in selected Areas of united s t a t e s " , in Analytical Human Geography, ed.P.Ambrose (London, 1969), pp. 69-102.
35 Clark, P .J . and Evan a, F.C., "Distance t o nearest Neighbour as a measure of s p a t i a l r e la t ionsh ip in populations", Ecology, Vol. 35, Ho.4, 1954, pp. 445-53.

8?
neighbourhood analysis refers In urban geography to the measure
ment of distance of straight l ine separating town from i t s
nearest neighbour town in space. However, mere measuring the
distance i s not the whole purpose but the idea i s t o analyse the
dlistance-size relationship*
Spatial Arrangement of Towns
As stated by Brush, *2» any given area small towns are
c lose ly spaced and more numerous; large centres, offering 36
greater services, are more widely spaced and l e s s numerous."
This version comes truer in case of the Trans-Ghaghara Plain
which leads us in hypothesising that there i s a posit ive
relationship between the distance separating a given c i t y from
i t s nearest neighbour of the same population-size and the
population-sixe of the given c i t y .
fable G I l lustrates the distance between a town and i t s
'nearest neighbour* regardless of the s i c e . It i s evidently
clear that there i s much variation in distances of towns and
their nearest neighbour* The range of distance varies from
53 km between Basti and Bansi t o 19 km between Deoria and Gaura
Barhaj while the average distance spacing of the region i s 33 km*
But under the ideal condition of even spat ial distribution, the
hypothetical distance as computed from 1.11/ & i s 48 km.
A comparison of average distance of 33 km with that of the
hypothetical distance of 48 km reveals that the la t ter exceeds by
36 Brush, J .E. , "The Hierarchy of Central Places in southwestern Wisconsin0, Geographical Review, Vol. 43, 1953, p.380.

0»
«0
oomomoifloif looomoooiflo *«i *«» rt r4 «>4»-l«HI HI H Hi
«M,
H
P» HJ M
> •* •»
0«M
H HI M
m HI
o $
A « C
ID
* I1 I* g «J m %
% 9 "4m mm **4 3** § o»*t Q**ja
8

8f
45 per cent from the former. The percentage of the average to
the hypothetical distance i s 70 and i s an indicator of the degree
of concentration, the higher the percentage* the greater wi l l
be concentration and vice versa* It shows that the spat ial
pattern of towns in the region i s largely irregular because the
degree of concentration i s more than the half (70 per cent ) . The
degree of deviation of regular spacing i s 30 per cent only.
The above fact may further be tested by Ambrose's formula
R « 2C / -~~ which is simplified version of King's formula
R * iy2P~i/a' * ** t h e iomer *onaula
0 « Observed mean distance N » Nuirber of towns A e Area of the region
the ratio works out to be It66.
This ratio of 1 J 6 6 suggests that the towns of the region
are not approaching uniform spacing. For perfect uniform spacing
according to King, the ratio should be 2 t l 5 . It i s s ignificant
to point out that for a perfect uniform spacing, i t i s necessary
that the factors (physical, economic and cultural) responsible
in the distributional patterns should be balanced. The
density of population (367 sq. km) and the low f e r t i l i t y and the
productivity of the land are the factors which come in the
way of imbalance in the spacing of towns.
Dlstance»siae Relationship
In an spatial organisation* the variation in the s i ee of
37 Ambrose, P. (eds. ) , Analytical Human Geography (London, 1969)* p. 119.
90
population of the towns I s a noteworthy phenomenon. But l i ke
rank-size ru le , the spacing shows a c lose associat ion of
d is tance with s ize In the d i s t r i b u t i o n a l pat tern of towns, the
rank-order coeff ic ient of cor re la t ion between rankings according
t o s i ze and those according t o dis tance (Columns $ and 6)
Table C i s -0.22 the magnitude of coeff ic ient i s low and the
co r re l a t ion has the negative d i rec t ion of r e l a t i o n s h i p . The
s i z e of t he town a l so s e t s a l imi t on the s p a t i a l p a t t e r n . The
dis tance va r i e s with the va r ia t ion in the s ize c l a s s , i . e . ,
large urban cent res are spaced widely while the small urban
cent res a re spaced somewhat c lose ly . The average d is tance of
spacing among the towns of nine (1,700 and above) i s 30 tea whereas
the remaining nine towns (7,000 t o 13,000) have the average
spacing d is tance of 24 km, The difference of d is tance depends
on the functional complex and the spec ia l i sa t ion of towns, t h e
large s i z e towns, namely* Corakhpur, Sahraich, Gondo, Bas t i ,
Deoria and so on have g rea te r functional concentration than the
small towns* namely Bhinga, Tulsipur, Barhalganj, Siwarhi and
Nawabganj. each of which has l e s s e r cen t r a l s e rv i ce s .
I t may be concluded tha t the rank-size ru le which shows some
cor re l a t ion with the socio-economic development of the region i s
not app l icab le . The law of primate c i t y i s somewhat more purposeful.
fh© region i s socio-economiealiy backward. If we follow the rank-
s iee ru le , then 10.7 per cent of the population from GoraXhpur
should be red is t r ibu ted among the towns a proposit ion which i s
impract icable, AS regards the s p a t i a l d i s t r i b u t i o n of towns, the
r a t i o of 1:66 suggests t h a t the towns are markedly concentrated.