PART VII – Production Area Monitoring and … 1 PART VII – Production Area Monitoring and...
24
Page 1 PART VII – Production Area Monitoring and Inspections and Land Application Requirements General The permittee’s approved manure management (MMP) plan shall be developed and implemented in accordance with the best management practices contained within this permit. PRODUCTION AREA REQUIREMENTS Table 1. Monitoring/Inspection Requirements Action Frequency Record Keeping Requirements Grab samples shall be taken of all discharges from the production area. Clean storm water that has been diverted does not need to be sampled. Each time they occur Date and time of sample, results of analysis, and the information required in Part III, 5 and 6. See Part I, A, 1, e. All discharges from the production area and land application area shall be recorded in the operating record. Each time they occur Cause, volume, and duration of discharge and any corrective actions needed and the dates those actions were taken. See Part I, A, 1, e and Part I, A, 2, d. In accordance with Part VII, B, 5 of this permit, grab samples shall be taken of discharges from land application areas where manure was applied on frozen and/or snow covered ground. Each time they occur Date and time of sample, results of analysis, and the information required in Part III, 5 and 6. See Part VII, B, 5. Representative samples of the manure to be land applied shall be taken from each source (e.g., each lagoon, storage tank, or permanent stockpile area must be sampled). 1/year The information required in PART III, 5 and 6. See Part VII, A, 2. (See note below.) Representative soil samples of the manure land application fields. Every 3 years The information required in Part III, 5 and 6. See Part VII, A, 3. (See note below.) Monitor operating level of all manure storage or treatment facilities. 1/week Date and time of observation, manure level in each structure. See Part II, E. (See note below.) Inspect manure storage or treatment facilities, including devices channeling contaminated storm water to the manure storage or treatment facility for evidence of erosion, leakage, animal damage, overflow, or discharge. 1/week Date and time of inspection, structural integrity, vegetation condition, and any corrective actions needed and the dates those actions were taken. (See note below.) Inspect storm water diversion devices or runoff diversion structures. 1/week Date and time of inspection, observations of flow quantity and color, structural integrity (e.g. signs of cracks, sparse or stressed vegetation, erosion, etc.), any corrective actions needed and the dates those actions were taken. Inspect drinking and cooling water lines that are located above ground, readily visible or accessible for daily inspections. Daily Date and time of inspection, number of leaks, any corrective actions needed and the dates those actions were taken. Monitor forecast at the CAFO location. Every land application event Date, weather conditions (including percentage chance of rain) 24 hours prior to application, at the time of application, and 24 hours after application. See Part VII, A, 5 and Part VII, B, 2, e. Inspect land application fields. In accordance with MMP Date and signs of discharge or runoff into surface waters and/or conduits to surface waters of the State. Inspect land application equipment. In accordance with MMP List of equipment, date of inspections, corrective actions, calibration dates. (See note below.)
-
Upload
vuongduong -
Category
Documents
-
view
215 -
download
1
Transcript of PART VII – Production Area Monitoring and … 1 PART VII – Production Area Monitoring and...
Page 1
PART VII – Production Area Monitoring and Inspections and Land Application Requirements General The permittee’s approved manure management (MMP) plan shall be developed and implemented in accordance with the best management practices contained within this permit. PRODUCTION AREA REQUIREMENTS
Table 1. Monitoring/Inspection Requirements
Action Frequency
Record Keeping Requirements
Grab samples shall be taken of all discharges from the production area. Clean storm water that has been diverted does not need to be sampled.
Each time they occur
Date and time of sample, results of analysis, and the information required in Part III, 5 and 6. See Part I, A, 1, e.
All discharges from the production area and land application area shall be recorded in the operating record.
Each time they occur
Cause, volume, and duration of discharge and any corrective actions needed and the dates those actions were taken. See Part I, A, 1, e and Part I, A, 2, d.
In accordance with Part VII, B, 5 of this permit, grab samples shall be taken of discharges from land application areas where manure was applied on frozen and/or snow covered ground.
Each time they occur
Date and time of sample, results of analysis, and the information required in Part III, 5 and 6. See Part VII, B, 5.
Representative samples of the manure to be land applied shall be taken from each source (e.g., each lagoon, storage tank, or permanent stockpile area must be sampled).
1/year The information required in PART III, 5 and 6. See Part VII, A, 2. (See note below.)
Representative soil samples of the manure land application fields.
Every 3 years The information required in Part III, 5 and 6. See Part VII, A, 3. (See note below.)
Monitor operating level of all manure storage or treatment facilities.
1/week Date and time of observation, manure level in each structure. See Part II, E. (See note below.)
Inspect manure storage or treatment facilities, including devices channeling contaminated storm water to the manure storage or treatment facility for evidence of erosion, leakage, animal damage, overflow, or discharge.
1/week Date and time of inspection, structural integrity, vegetation condition, and any corrective actions needed and the dates those actions were taken. (See note below.)
Inspect storm water diversion devices or runoff diversion structures.
1/week Date and time of inspection, observations of flow quantity and color, structural integrity (e.g. signs of cracks, sparse or stressed vegetation, erosion, etc.), any corrective actions needed and the dates those actions were taken.
Inspect drinking and cooling water lines that are located above ground, readily visible or accessible for daily inspections.
Daily Date and time of inspection, number of leaks, any corrective actions needed and the dates those actions were taken.
Monitor forecast at the CAFO location.
Every land application
event
Date, weather conditions (including percentage chance of rain) 24 hours prior to application, at the time of application, and 24 hours after application. See Part VII, A, 5 and Part VII, B, 2, e.
Inspect land application fields. In accordance
with MMP
Date and signs of discharge or runoff into surface waters and/or conduits to surface waters of the State.
Inspect land application equipment. In accordance
with MMP List of equipment, date of inspections, corrective actions, calibration dates. (See note below.)

Page 2
Note: Much of this information is required in the operating record for the Review Compliance Certificate or Permit to Operate issued by the Director of ODA. The operating record form provided by ODA is an acceptable format for maintaining records for the purposes of complying with this permit as well. However, make sure that additional records required by this permit are added to those record keeping forms. 1. Any deficiencies found as a result of these inspections must be corrected as soon as possible. Deficiencies not corrected within 30 days must be accompanied by an explanation of the factors preventing immediate correction. 2. Records of mortalities management and practices used by the CAFO shall be maintained to ensure compliance with Part I, A, 1, f. 3. Records documenting the current design of any manure storage structures, including volume for solids accumulation, design treatment volume, total design volume, and approximate number of days of storage capacity must be maintained at the CAFO. LAND APPLICATION REQUIREMENTS A. CONTENTS OF THE MMP
1. Nutrient Budget: The manure management plan shall include a total nutrient budget for the operation, based on 1) targeted crop yields based on actual crop yields, 2) soil productivity information, 3) historical yield data, 4) realistic potential yield, or 5) combinations of yield data. The plan shall consider all potential sources of nutrients including quantity of manure and manure nutrients, organic by-products, wastewater, commercial fertilizer, crop residues, legume credits, and irrigation water and a summary of the total acres of land to be used for land application.
2. Manure Characterization: At a minimum, manure from each manure storage or treatment facility shall
be analyzed annually for the following: total nitrogen, ammonium nitrogen, organic nitrogen, phosphorus, potassium, and percent total solids. Procedures for the collection and analysis of the samples shall be in accordance with Publication A3769, “Recommended Methods of Manure Analysis; Published by the Board of Regents of the University of Wisconsin System, University of Wisconsin-Extension”.
3. Soil Characterization: At a minimum, soil samples shall be taken to a uniform depth and the fertility
analysis shall include: pH, phosphorus, potassium, calcium, magnesium and cation exchange capacity.
a. Soil fertility analysis shall be conducted in accordance with Publication 221, "Recommended Chemical Soil Test Procedures for the North Central Region; Published by the North Central Regional Committee on Soil Testing and Plant Analysis (NCR-13), North Dakota Agricultural Experiment Station". See Part VII, A, 3, e, below.
b. Sample shall be representative of a land application site with one composite soil sample
representing no more than twenty-five acres or one composite soil sample for each land application site, whichever is less. A sample depth of 8 inches shall be used unless justified otherwise in the plan.
c. The manure management plan shall specify the soil sampling frequency in accordance with the
following requirements:
(1) A site that receives manure shall be soil tested, at a minimum, once every three years.

Page 3
(2) For any land application site used by the owner or operator the land application site shall be sampled at least six months following application.
d. Results of the soil sampling events shall be recorded and shall include the location of the soil
sample collection site, the depth of the sample collected and the analysis.
e. In developing appropriate manure application rates for land application methods, the owner or operator shall use the Bray P1 soil test level or equivalent appropriate phosphorus soil test, (Mehlich III, Olsen, Phosphorus Retention Test). The owner or operator shall choose a phosphorus soil test method and identify the selected method in the manure management plan.
4. Land Application Methods – Methodology for Determining Manure Application Rates
a. Determine if the land application site has soils that are prone to flooding and when the expected
flooding seasons are according to Table 3. For timing restrictions, see Part VII, B, 2, c. b. The manure application rate shall be based on the land application site's soil tests that are no
older than three years. See Part VII, A, 3, above.
c. The manure application rate shall be based on the most current manure test results. The manure test results expressed as a nutrient percentage shall be converted into either pounds per ton of dry manure or pounds per one thousand gallons of liquid manure.
d. Determine if a solid or liquid manure application will be performed. The manure application rate
shall be based on the most limiting factor (i.e., most restrictive factor for the purpose of protecting surface water quality) of the following:
(1) For liquid manure (less than 20% solids):
i. The crop nitrogen requirements or removal expressed in thousands of gallons of manure per acre, as determined in accordance with g., below;
ii. The crop phosphorus requirements or removal expressed in thousands of gallons of
manure per acre, as determined in accordance with h., below;
iii. The restrictions on the volume of liquid manure application, in accordance with Part VII, B and Part VII, C, Tables 21 and 22, with volume expressed as a measure of gallons per acre or inches per acre, with twenty seven thousand two hundred gallons equal to one acre/inch;
iv. The application rate shall not exceed the available water capacity in the upper eight
inches of the soil for both subsurface and nonsubsurface drained sites in accordance with Part VII, C, Table 4; and
v. The application rate shall be adjusted to preclude surface ponding and/or runoff from a
land application site. See Part VII, B, 2. (2) For solid manure (greater than or equal to 20% solids):
i. Either the crop nitrogen requirements or removal of nitrogen expressed in pounds per ton of dry manure per acre, as determined in accordance with g., below;

Page 4
ii. The crop phosphorus requirements or removal expressed in pounds per ton of dry manure per acre, as determined in accordance with h., below; or
iii. The restrictions on the volume of solid manure applied, taken from Part VII, B and Part
VII, C, Tables 21 and 22, with volume expressed as a measure of tons/acre. e. Determine if solid manure will be stockpiled at the land application site. Stockpiles shall meet the setbacks in Part VII, B, Table 2. f. For liquid manure applications, determine restrictions based on Part VII, C, Table 4 Available Water Capacity and Tables 21 and 22 Most Limiting Manure Application Rates (for Tiled Fields and Non-Tiled Fields). For solid manures, determine restrictions based on Part VII, C, Tables 21 and 22 Most Limiting Manure Application Rates Charts (for Tiled Fields and Non- Tiled Fields). g. The manure application rate for nitrogen shall be the most restrictive value (i.e., most restrictive factor for the purpose of protecting surface water quality) determined after considering the following:
(1) The application rate for nitrogen shall be based on utilization of crops at the recommended
agronomic rates (using the Ohio Agronomy Guide, OSU Bulletin 472) and based on minimum runoff and leaching to waters of the state, as determined in accordance with (3) below.
(2) In determining the agronomic rate for nitrogen, the owner or operator shall do the following:
i. Determine the nitrogen requirements (based on Part VII, C, Tables 6, 7, and 8) or
removal rates (based on Part VII, C, Table 5) for a realistic yield goal of planned crops; Determine the nutrient removal for the expected cropping sequence using Part VII, C, Table 5 Nutrient removed in Harvested Portions of Crops. Determine residual nitrogen credits for the expected cropping sequence using Part VII, C, Table 8 Residual Nitrogen Credits Based on Previous Crops.
ii. Subtract the nitrogen credit to be given to the next crop in accordance with values for
previous crops, subtract credits for crop residues and legumes grown in previous years, and subtract nitrogen that will be added in other forms including commercial fertilizer and organic by-products (see Part VII, C, Table 8); and
iii. When applying nitrogen to a grass or legume cover crop that is growing or being
established immediately after manure application, manure can be applied at the recommended nitrogen rate (using the Ohio Agronomy Guide, OSU Bulletin 472) for the next non-legume crop or the nitrogen removal rate for the next legume crop.
(3) In determining how to minimize nitrogen leaching to waters of the state, the owner or
operator shall do the following:
i. Assess each land application site with the Ohio nitrogen leaching risk assessment procedure in Part VII, C; and
ii. If the nitrogen leaching risk assessment procedure completed in accordance with i
above, demonstrates that the land application site has a high nitrogen leaching potential and no growing cover crop, then application of manure shall be limited to fifty

Page 5
pounds per acre as applied nitrogen calculated at the time of application (by adding ammonia-nitrogen to one third of organic nitrogen) from June to October first.
(4) Use the current manure analysis and the relevant sections of the following tables in Part VII, C to determine the amount of manure nutrient available for crop production: Table 10 Calculating Available Nitrogen of Manure, Table 11 Nitrogen Sufficiency ranges for Corn, Soybeans, Alfalfa and Wheat, and Table 12 Sidedress N Fertilizer Rates for Corn.
(5) When using legumes as a nitrogen removal source, the maximum legume nitrogen removal must be less than or equal to one hundred and fifty pounds per acre. h. The manure application rate for phosphorus shall be the most restrictive value (i.e., most
restrictive factor for the purpose of protecting surface water quality) determined after considering the following:
(1) The application rate for phosphate applications shall be based on the following:
i. Estimated plant uptake by crops at the recommended agronomic rates (using the Ohio
Agronomy Guide, OSU Bulletin 472);
ii. Soil test analysis;
iii. Subsequent phosphorus removal in plant biomass (see Part VII, C, Table 5); and
iv. Minimum runoff to waters of the State.
(2) In determining the agronomic rate for phosphate application, the owner or operator shall do the following:
i. Determine the phosphorus requirements for a realistic yield goal of planned crops and/or
crop rotations (see Part VII, C, Tables 13, 14, 15, 16, and 17);
ii. Subtract phosphorus that will be added in other forms including commercial fertilizer and organic by-products; and
iii. The application rate for phosphorus shall not exceed the removal rates for a realistic
yield goal of planned crops, unless following the procedures in h, (3) below.
(3) In determining how to minimize phosphorus runoff to waters of the State, the owner or operator shall do the following:
i. Prior to the land application of manure, a land application site shall be assessed with
either the phosphorus index risk assessment procedure or the phosphorus soil test risk assessment procedure in Part VII, C. This risk assessment shall be used in the determination of manure application rates and the results shall be documented as required in Part VII, A, 5. Use the phosphorus index risk assessment procedure if the Bray P1 value of the soil test is over one hundred and fifty parts per million. The phosphorus index risk assessment procedure shall only be relied upon for a transitional period of time to allow the owner or operator an opportunity to find other fields or other methods to distribute nutrients from the facility in order to achieve less than one hundred and fifty parts per million Bray P1 soil test method;

Page 6
ii. There shall be no multi-year phosphorus applications on fields where either the phosphorus index risk assessment procedure produces a high rating or the phosphorus soil test risk assessment procedure produces a high potential rating. There shall be no phosphorus applications on fields where either the phosphorus index risk assessment procedure produces a very high rating or the phosphorus soil test risk assessment procedure produces a very high potential rating; and
iii. Phosphate manure application rates above two hundred and fifty pounds per acre are
not recommended. However, if phosphate concentrations in liquid manure exceed sixty pounds of phosphate per one thousand gallons or eighty pounds phosphate per ton for solid manure, rates higher than two hundred and fifty pounds per acre may need to be applied due to limitations of the application equipment. In no case shall manure application exceed the rates specified in Part VII, A, 4, g and Part VII, A, 4, h, (3), ii. In no case shall phosphate applications exceed five hundred pounds per acre of phosphate during one year. When phosphate applications exceed two hundred and fifty pounds per acre the following additional criteria applies:
Phosphate applications exceeding two hundred and fifty pounds per acre in any one
year shall not be applied on fields with a phosphorus soil test exceeding 100 ppm Bray P1 or equivalent, results of a phosphorus index risk assessment procedure notwithstanding.
The manure shall be immediately injected or incorporated 3 to 5 inches deep.
The manure shall not be applied on either frozen or snow covered ground.
There shall be no further phosphate applications for a minimum of three years on
land with a phosphorus soil test level below 40 ppm (80 pounds per acre) Bray P1 or equivalent and no additional phosphate applications for a minimum of five years on land with a phosphorus soil test level above 40 ppm (80 pounds per acre) Bray P1 or equivalent.
i. A comparison shall be made of all the manure land application requirements. The selected rate shall be documented in accordance with the record keeping requirements in Part VII, A, 5.
5. Record Keeping Requirements: At a minimum, the following records must be kept by the permittee:
a. Expected crop yields.
b. The date(s) manure is applied to each field.
c. Weather conditions at the time of application and for 24 hours prior to and following application. See Part VII, B, 2, e.
d. Test methods used to sample and analyze manure and soil.
e. Results from manure and soil sampling.
f. Explanation of the basis for determining manure application rates, as provided by Part VII, A, 4.
g. Calculations showing the total nitrogen and phosphorus to be applied to each field, including
sources other than manure.
Page 7
h. Total amount of nitrogen and phosphorus actually applied to each field, including documentation
of calculations for the total amount applied.
i. The method used to apply the manure.
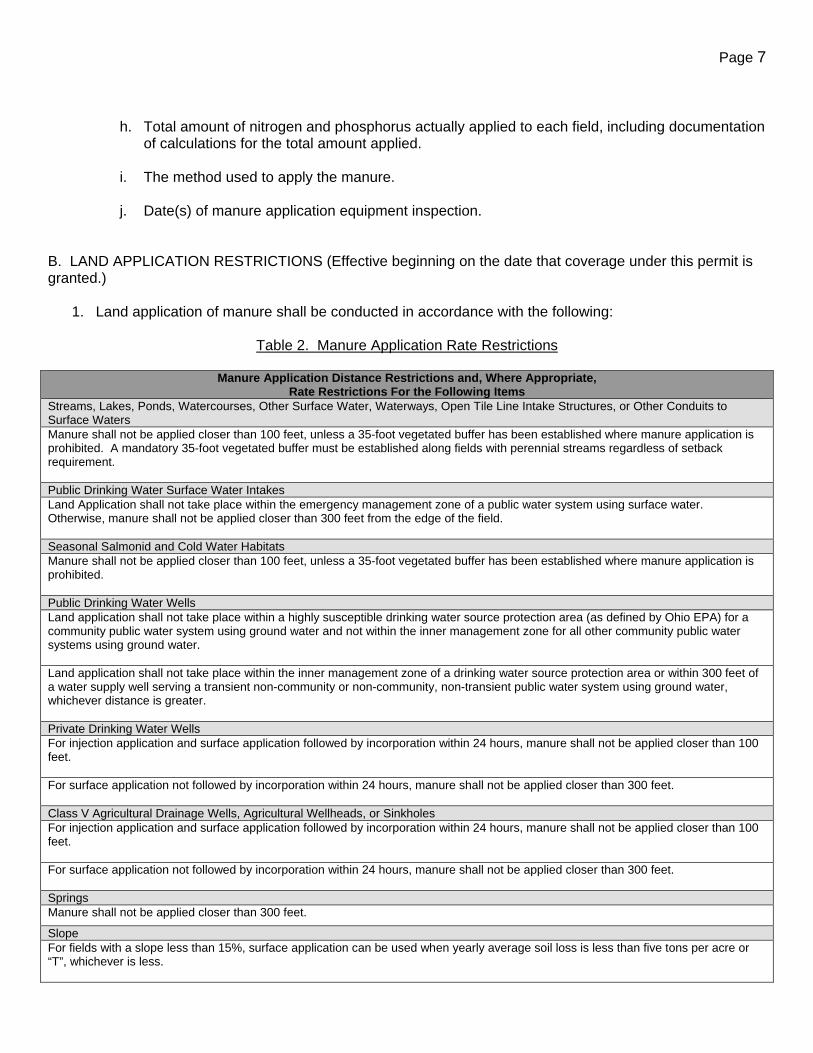
j. Date(s) of manure application equipment inspection. B. LAND APPLICATION RESTRICTIONS (Effective beginning on the date that coverage under this permit is granted.)
1. Land application of manure shall be conducted in accordance with the following:
Table 2. Manure Application Rate Restrictions
Manure Application Distance Restrictions and, Where Appropriate, Rate Restrictions For the Following Items
Streams, Lakes, Ponds, Watercourses, Other Surface Water, Waterways, Open Tile Line Intake Structures, or Other Conduits to Surface Waters Manure shall not be applied closer than 100 feet, unless a 35-foot vegetated buffer has been established where manure application is prohibited. A mandatory 35-foot vegetated buffer must be established along fields with perennial streams regardless of setback requirement. Public Drinking Water Surface Water Intakes Land Application shall not take place within the emergency management zone of a public water system using surface water. Otherwise, manure shall not be applied closer than 300 feet from the edge of the field. Seasonal Salmonid and Cold Water Habitats Manure shall not be applied closer than 100 feet, unless a 35-foot vegetated buffer has been established where manure application is prohibited. Public Drinking Water Wells Land application shall not take place within a highly susceptible drinking water source protection area (as defined by Ohio EPA) for a community public water system using ground water and not within the inner management zone for all other community public water systems using ground water. Land application shall not take place within the inner management zone of a drinking water source protection area or within 300 feet of a water supply well serving a transient non-community or non-community, non-transient public water system using ground water, whichever distance is greater. Private Drinking Water Wells For injection application and surface application followed by incorporation within 24 hours, manure shall not be applied closer than 100 feet. For surface application not followed by incorporation within 24 hours, manure shall not be applied closer than 300 feet. Class V Agricultural Drainage Wells, Agricultural Wellheads, or Sinkholes For injection application and surface application followed by incorporation within 24 hours, manure shall not be applied closer than 100 feet. For surface application not followed by incorporation within 24 hours, manure shall not be applied closer than 300 feet. Springs Manure shall not be applied closer than 300 feet.
Slope For fields with a slope less than 15%, surface application can be used when yearly average soil loss is less than five tons per acre or “T”, whichever is less.

Page 8
Manure shall not be applied to cropland over 15% slope or to pasture/hay land over 20% slope unless one of the following precautions are taken: a. Immediate incorporation or injection with operations done on the contour, unless the field has 80% ground cover (residue or canopy); b. Applications are timed during periods of lower runoff and/or rainfall (May 20 to October 15); c. Split applications are made (separated by rainfall events) with single applications not exceeding 5000 gallons per acre for liquid manure or 10 wet tons per acre for solid manure; d. The field is established and managed in contour strips with alternated strips in grass or legume. Stockpiling of Manure Streams, Lakes, Ponds, Watercourses, Waterways, Open Tile Line Intake Structures, or Other Conduits to Surface Waters, minimum 300 feet. (Stockpiling within waterways or concentrated flow areas is prohibited.) Public and Private Wells/Springs, minimum 300 feet. Flooding/flood plains/floodways, prohibited. Public drinking water surface intakes, minimum 1500 feet. Class V agricultural drainage wells and sinkholes, minimum 300 feet. Slope, 0-6% only.
2. Timing/Site Restrictions:
a. Prior to land applying manure, the permittee shall inspect the land application area to determine the suitability of the site for land application (considerations shall include tile location and depth, soil type, evidence of soil cracking, available water capacity of the soil, crop maturity, prior precipitation, forecasted precipitation, etc.) and document field conditions at the time of the inspection. See Part VII, A, 5. Broken tiles or blow out holes shall be repaired prior to land application.
b. For fields with soil cracks greater than six inches deep, the soil must be tilled before the land
application of liquid manure or the application must be delayed until the cracks are sealed. However, liquid manure applications may be made on tiled fields with growing crops if the application rate is less than or equal to a quarter of an inch or six thousand seven hundred gallons per acre and tile plugs are used or tile stops closed prior to application. See Part VII, B, 3 below.
c. For fields that are prone to flooding, floodplains, or floodways, manure must be injected or
incorporated within 24 hours of application. No manure application shall occur during periods of expected flooding. See USDA, NRCS Field Office Technical Guide.
d. Land application of manure shall not cause ponding or runoff. For liquid manure applications,
the land application shall not exceed the available water capacity in the upper eight inches of the soil in the application field.
e. Land application shall not occur on saturated soils or during rain or runoff events, and shall not
occur if the forecast contains a greater than fifty per cent chance of precipitation as determined in “Managing Manure Nutrients at Concentrated Animal Feeding Operations, Appendix M, United States Environmental Protection Agency, EPA-821-B-04-006, August 2004,” exceeding an amount of one-quarter inch for hydrologic soil group D soils and one-half inch for hydrologic soil group A, B, and C soils, for a period extending twenty-four hours after the start of land application. Record weather conditions in the operating record for conditions at the time of

Page 9
application and for twenty-four hours prior to and following application. For determining hydrologic soil groups, refer to USDA-NRCS Engineering Field Manual, Chapter 2 – Ohio Supplement (1989), Table 2.1, pages 2-42 through 2-83.
f. If solid manure is applied on conventionally tilled bare soil, the manure shall be incorporated into
the soil within two days after application on the land. This requirement does not apply to no-till fields, pasture, or fields where crops are actively growing.
g. Manure application shall not take place on fields where soil loss exceeds “T” (Tolerable Soil
Loss, See USDA, NRCS Field Office Technical Guide).
3. For land application sites with subsurface tile drainage, the permittee shall visually monitor all field tile outlets before, during and after application of manure to the site and record the results of that monitoring. The permittee shall have access to or methods/devices to stop or capture subsurface drain flow. If manure reaches the subsurface drain outlet to waters of the State, the application of manure shall cease and the flow stopped or captured. If land application has caused manure laden water to be discharged from a field tile, Ohio EPA shall be notified by calling 1-800-282-9378 as soon as possible, but in no case later than 24 hours following first knowledge of the occurrence. See Part I, A, 2, d.
4. For the land application of liquid manure to sites with subsurface tile drainage, the following criteria
must be followed: a. Application rates shall be less than or equal to half an inch or thirteen thousand gallons per acre per application event; b. A tool shall be used that can disrupt and/or close the preferential flow paths in the soil using horizontal fracturing, or the surface of the soil shall be tilled three to five inches deep to a seedbed condition to soak up the liquid manure and keep it out of preferential flow channels; c. If injection is used, manure shall only be injected deep enough to cover manure with soil. The soil shall be tilled at least three inches below the depth of injection prior to application; and d. For fields with growing crops or continuous no till fields where tillage is not an option, all tile outlets from the application area are to be plugged/tile stops closed prior to application.
5. Manure shall be managed in such a manner to prevent land application on frozen or snow covered
ground. Every attempt shall be made by the permittee to avoid land application during the frozen or snow covered ground conditions because of lack of agronomic benefit and high risk of pollution of surface waters. As stated in Part II, failure to take appropriate action to avoid land application on frozen and/or snow covered ground is a violation of this permit and subject to enforcement. The nutrients in the manure applied on frozen and/or snow covered ground shall be included in the manure application rate calculations for the next crop.
If practical, manure should be injected and/or incorporated within 24 hours to minimize surface manure runoff. Where manure is not injected or incorporated within 24 hours, the following frozen and/or snow covered ground restrictions are mandatory.
Other locations for manure disposal shall be investigated prior to the land application (i.e., transfer of manure to another waste treatment or storage facility, wastewater treatment plant, rental or acquisition of a storage tank, etc.).

Page 10
Stockpiling of solid manure, in accordance with this permit, shall be utilized rather than spreading on the field. Only limited quantities of manure shall be applied to address manure storage limitations until non-frozen or non-snow covered soils are available for manure application. Records must be maintained for all instances of application on frozen or snow covered ground that include: date, amount applied, location, acres applied to, weather and soil conditions including depth of snow cover, surface residue cover, and reason for applying manure at that time. In addition to all of the above land application restrictions (restrictions on fields prone to flooding, not causing ponding or runoff, restrictions on saturated soils, and requirements for tiled fields), the following criteria must also be met for surface manure application on frozen or snow covered ground per application event per field per winter season: a. The field must have greater than or equal to ninety percent surface residue cover at the time of application, and vegetation/residue shall not be completely covered by ice and/or snow at the time of application; b. The maximum manure application rate is five thousand gallons per acre for liquid manure, ten wet
tons per acre for solid manure with more than fifty percent moisture, and five wet tons per acre for solid manure with less than fifty percent moisture. Depending on soil hydrologic group and surface residue cover, the liquid manure application rate on frozen soils may need to be lowered to prevent manure ponding or runoff;
c. Manure shall not be applied on more than twenty contiguous acres. Contiguous areas for application are to be separated by a break of at least two hundred feet. Areas used for application are to be the furthest from surface waters and present the least potential for runoff; d. Setbacks from surface waters and conduits to surface waters (including grassed waterways and surface drains) must be a minimum of two hundred feet. This setback shall also have at least 90 percent surface residue cover, and vegetation/residue shall not be completely covered by ice and/or snow at the time of application. This distance may need to be further increased due to local conditions and other setback restrictions in Part VII, B, 1; e. For fields with slopes greater than six percent, manure shall be applied in alternating strips sixty to two hundred feet wide generally on the contour, or in the case that the field is managed in contour strips with alternative strips in grass or legume, manure shall only be applied on alternative strips. Note that the application rate shall be determined for each separate application strip area, not area of entire field; f. Manure phosphate applications exceeding two hundred and fifty pounds per acre are prohibited. If the permittee surface applies manure on frozen or snow covered ground, concentrated field surface drainage and tile outlets shall be visually monitored at the conclusion of the manure application, and periodically afterwards when weather is likely to produce manure runoff including when temperatures rise, snow melts, and in conjunction with rainfall, etc., until the manure has been assimilated into the field and is no longer likely to discharge into waters of the State. If the land applied manure discharges to waters of the State, then the permittee shall notify Ohio EPA within two hours of detection of the runoff event. In accordance with Part I, A of this permit, a discharge of manure to waters of the State from land application on frozen and/or snow covered ground that is not the result of a precipitation event is prohibited and a violation of the permit.

Page 11
If the ammonia nitrogen level in a water quality sample is determined to be 26 mg/L or greater in the discharge at the point it enters waters of the State, then any additional surface application of manure to frozen and/or snow covered ground is prohibited on the field where the runoff event occurred. In the event that the permittee follows the permit requirements and runoff from frozen or snow covered fields discharges to waters of the State with an ammonia nitrogen content of 26 mg/L or greater in a total of three surface land application events, then surface application of manure on any frozen and/or snow covered ground is prohibited for that permittee from that point on. In the event that a permittee fails to comply with the land application requirements for frozen or snow covered ground (including notification of discharges, monitoring and record keeping requirements) more than two times, then land application on any frozen or snow covered ground will be prohibited for that permittee upon receipt of the third notice of violation by Ohio EPA. In addition to the visual monitoring and reporting requirements stated above, the permittee shall collect representative grab samples from discharges of land applied manure into waters of the State at the point that the discharge enters waters of the State (i.e., concentrated field surface runoff or field tile outlet discharge prior to entrance to surface water) and have the sample analyzed for, at a minimum, the following parameter: 00610 – Nitrogen, Ammonia (NH3) – mg/L The permittee shall: (a) collect the sample within 30 minutes of the first knowledge of the discharge; or (b) if the sampling in that period is inappropriate due to dangerous weather conditions, collect the sample as soon as possible after suitable conditions occur, and document the reason for delay. The permittee shall report the results of the discharge sample(s) to Ohio EPA, Central Office, Division of Surface Water, within 14 days of occurrence. The report shall, at a minimum, contain the sample results, describe the reason for the discharge, the location, estimate of quantity and duration of the discharge, and duration of the precipitation leading up to the event, as well as any measures taken to clean up and eliminate the discharge and required land application records stated above. Laboratory results not available at the time of the report submittal shall be submitted to Ohio EPA within five days of receipt.
6. The permittee is responsible for complying with this permit for land application activities conducted on each site where the permittee, or anyone employed by the permittee, owns, operates, or land applies manure generated from the CAFO or determines timing and amount of manure to be applied on fields not otherwise owned, rented, or leased by the CAFO.
C. Tables and Procedures for Manure Application Rate Determination Note: Much of the information contained in this section is consistent with ODA rule in OAC 901:10-2-14 and associated appendices.
Table 3. Soils Prone to Flooding Soils Prone to Flooding
Months Comment Soils Prone to Flooding
Months Comment
Abscota Variant Feb-Jun Medway Variant Nov-May Adrian Nov-May Medway, limestone
substratum Nov-Dec
Aetna Dec-Jun Melvin Sep-May Frequently flooded, long

Page 12
Soils Prone to Flooding
Months Comment Soils Prone to Flooding
Months Comment
duration Algansee Nov-May Melvin Dec-May Algiers Dec-Jun Frequently flooded Mentor Jan-Dec Alluvial land Nov-Dec Occasionally flooded Millgrove Nov-Jun Alluvial land Jan-Dec Long duration Montgomery Nov-May Ashton Dec-May Very long duration Moshannon Dec-May Beaucoup Mar-Jun Muskego Nov-May Bonnie Oct-Jun Newark Dec-Apr Brookston Dec-May Newark Variant Jan-Apr Carlisle Nov-May Nolin Feb-May Ceresco Mar-May Nolin Variant Feb-Apr Chagrin Nov-May Olentangy Nov-Dec Chavies Nov-Mar Orrville Nov-May Clifty Nov-May Otego Nov-Dec Coblen Nov-Jun Papakating Nov-Jun Cohoctah Nov-Apr Patton Jan-Dec Cuba Jan-May Peoga Jan-Dec Defiance Jan-May Pewamo Mar-Apr Edwards Sep-May Philo Dec-May Eel Oct-Jun Piopolis Mar-Jun Eel Variant Jan-May Pope Nov-Apr Elkinsville Jan-Dec Rockmill Sep-Jun Euclid Dec-Jun Romeo Mar-Jun Fitchville Dec-Jun Ross Nov-Jun Flatrock Dec-Apr Rossburg Nov-Jun Flatrock, limestone substratum
Nov-Apr Sarahsville Dec-May
Fluvaquents Nov-Jun Saranac Nov-May Genesee Oct-May Scioto Nov-Jun Genesee Variant Jan-May Sebring Nov-Jun Occasionally
flooded Gessie Oct-May Senecaville Dec-Apr Glendora Jan-Dec Shoals Oct-Jun Grigsby Dec-Apr Shoals Variant Nov-May Used in Miami,
Putnam, and Richland Counties
Hackers Jan-Apr Shoals Variant Oct-Jun Used in Champaign County
Harrod Nov-Jun Shoals, Till Substratum
Nov-Dec
Hartshorn Nov-May Skidmore Dec-May Haymond Dec-May Sligo Mar-Apr Holly Sep-May Frequently flooded, very
long duration Sloan Nov-Jun
Holly Nov-May Sloan, Till Substratum Nov-Dec Holton Dec-Jun Stanhope Nov-Dec Huntington Dec-May Stendal Jan-May Joliet Apr-Jun Stone Nov-Jun Jules Mar-Jun Stonelick Nov-Jun Kerston Mar-May Stringley Nov-Jun Killbuck Jan-Dec Taggart Jan-Dec Kinn Dec-Apr Tioga Nov-May Knoxdale Dec-Apr Tioga Variant Jan-Apr Kyger Nov-May Toledo Nov-May Landes Jan-Jun Tremont Jan-Dec Landes Variant Nov-Jun Wabash Nov-May Lanier Nov-Jun Wabasha Sep-Jun Latty Jan-May Wakeland Jan-May

Page 13
Soils Prone to Flooding
Months Comment Soils Prone to Flooding
Months Comment
Lenawee Mar-May Wallkill Sep-Jun Lindside Dec-Apr Wappinger Jan-Dec Linwood Nov-Jun Warsaw Variant Jan-May Lobdell Jan-Apr Frequently flooded Wayland Nov-Jun Lobdell Nov-Apr Wick Oct-Jun Martinsville Jan-Apr Wilbur Oct-Jun Martisco Mar-Jun Willette Nov-Dec McGary Variant Jan-Dec Seperick Nov-Jun Medway Nov-Jun Zipp Dec-May
Available Water Capacity (AWC) This table shall be used to determine the AWC at the time of application and the liquid volume in gallons that can be applied not to exceed the AWC. To determine the AWC in the upper 8 inches use a soil probe or similar device to evaluate the soils to a depth of 8 inches. For land application, liquid manure application may also be calculated by converting acres per inch to gallons per acre. This conversion is based on the following formula: 1 acre – inch equals 27,156 gallons per acre.
Table 4. Available Water Capacity Available Moisture in the
Soil Sands, Loamy Sands Sandy Loam, Fine Sandy Loam
Very Fine Sandy Loam, Loam, Silt Loam, Silty
Clay Loam
Sandy Clay, Silty Clay, Clay, Fine & Very Fine
Textured Soils <25% Soils Moisture Amount to Reach AWC
Dry, loose and single-grained; flows through fingers. 20,000 gal/ac
Dry and loose; flows through fingers. 27,000 gal/acre
Powdery dry; in some places slightly crushed but breaks down easily into powder. 40,000 gal/acre
Hard, baked and cracked; has loose crumbs on surface in some places. 27,000 gal/acre
25-50% or Less Soil Moisture Amount to Reach AWC
Appears to be dry; does not form a ball under pressure. 15,000 gal/acre
Appears to be dry; does not form a ball under pressure. 20,000 gal/acre
Somewhat crumbly but holds together under pressure. 30,000 gal/acre
Somewhat pliable; balls under pressure. 20,000 gal/acre
50-75% Soil Moisture Amount to Reach AWC
Appears to be dry; does not form a ball under pressure. 10,000 gal/acre
Balls under pressure but seldom holds together. 13,000 gal/acre
Forms a ball under pressure; somewhat plastic; slicks slightly under pressure. 20,000 gal/acre
Forms a ball; ribbons out between thumb and forefinger. 13,000 gal/acre
75% to Field Capacity Amount to Reach AWC
Sticks together slightly; may form a weak ball under pressure. 5,000 gal/acre
Forms a weak ball that breaks easily, does not stick. 7,000 gal/acre
Forms ball; very pliable; slicks readily if relatively high in clay. 11,000 gal/acre
Ribbons out between fingers easily; has a slick feeling. 7,000 gal/acre
100% Field Capacity On squeezing, no free water appears on soil, but wet outline of ball on hand.
On squeezing, no free water appears on soil, but wet outline of ball on hand.
On squeezing, no free water appears on soil, but wet outline of ball on hand.
On squeezing, no free water appears on soil, but wet outline of ball on hand.
Above Field Capacity Free water appears when soil is bounced in hand.
Free water is released with kneading.
Free water can be squeezed out.
Puddles; free water forms on surface.
NOTE: Liquid manure applications to tiled fields must be less than or equal to 13,576 gal/acre.

Page 14
Table 5. Nutrients Removed in Harvested Portions of Crops
Crop (Yield) Nutrients Removed For Given Yieldsa Nutrients Removed for Unit Yieldsb
N P2O5 K2O P2O5 K2O Pound/Acre Pound/Bushel or Ton
Alfalfa (6 T) 340c 80 360 13.3 lb/T 60 lb/T Corn (150 Bu) Grain 135 55 40 0.37 lb/bu 0.27 lb/bu Stover 100 25 160 Corn-Silage (26 T) 235 80 235 3.1 lb/T 9.0 lb/T Grass – Cool season (3.5 T), Tall grasses and/or Forage legumes (established)
140 45 175 13.0 lb/T 60.0 lb/T
Oats (100 Bu) Grain 65 25 20 0.25 lb/bu 0.20 ib/bu Straw 35 15 100 0.15 lb/bu 1.0 lb/bu Sorgum-grain (7,600 lb)
Grain 105 30 30 0.39 lb/100 lb 0.39 lb/100 lb Stover 80 50 230 Soybean (50 Bu) 190c 40 70 0.80 lb/bu 1.4 lb/bu Sugar Beets – roots (25 T) 100 50 250 2.0 lb/T 10.0 lb/T
Tobacco – Burley and Cigar filler
Leaf (3000 lb) 105 25 185 Stems and Suckers (2000 lb) 55 15 65
Leaves and Stalks 1.3 lb/100 lb 8.3 lb/100 lb Wheat (55 Bu) Grain 70 35 20 0.64 lb/bu 0.36 lb/bu Straw 30 5 50 0.90 lb/bu 0.91 lb/bu aSource: National Plant Food Institute and others. bSource: Ohio Agronomy Guide, 12th Edition. cInculated legumes fix nitrogen from the air.
Table 6. Nitrogen Ratesa for Corn Based on Yield Potential
Corn Yield Potential (bu/acre) Previous Crop 80 100 120 140 160 180+ Corn, small grains 80 110 140 160 190 220 aN fertilizer rates are based on the following relationship: N (lb/acre) = -27 + (1.36 * yield potential) – N credit or 110 + [1.36 * (yield potential – 100)] – N credit
Table 7. Nitrogen Rates for Wheat Based on Yield Potential
Yield Potential (bu/acre) Nitrogen Rate (Pounds N to Apply/acre) 50 40 70 75
90+ 110 1. N rate is based on the following relationship: N (lb/acre) = 40 + [1.75 * (yield potential – 50)] 2. No nitrogen credits are made based on previous crop.

Page 15
Table 8. Residual Nitrogen Credits Based on Previous Crop
Previous Crop Nitrogen Credits Pounds of N
Corn, small grains 0 Soybeans 30 Grass sod 40 Established forage legume Average stand (3 plants/ft2) b
Good stand (5 plants/ft2) b
Annual legume cover crop 30 bN credits for established forage legume = 40 + 20 * (plants/to maximum of 140/ft2)
Ohio Nitrogen Leaching Assessment Procedure Soils are classified as having a high, medium or low nitrogen leaching potential with relative index ratings from 0 - 10+ for their potential to leach nitrates below the root zone. The leaching potential is rated as high, medium or low by combing the soil’s hydrologic soil grouping (A, B, C or D), the local county’s annual rainfall, and the local county’s season rainfall (October 1 to March 1). To determine the soil’s nitrogen leaching potential, use the following procedure: 1. Determine the soils hydrological soil grouping – A, B, C or D. For this information, refer to USDA-NRCS Engineering Field Manual, Chapter 2 – Ohio Supplement (1989), Table 2.1, pages 2-42 through 2-83. 2. Determine the local county’s annual rainfall and the local county’s season rainfall (October 1 to March 1). For this information, refer to USDA-NRCS Engineering Field Manual, Chapter 2 – Ohio Supplement (1989), Exhibit OH2-3, Supplement pages 1 through 4 and USDA-NRCS Engineering Field Manual, Chapter 2 – Ohio Supplement (1989), Exhibit OH2-1 and Sheets 1 though 3. 3. Refer to Table 9 below for the respective county to determine the soils relative leaching index rating. (a) Soils with a rating of 0-2 have a low potential to leach nitrates below the root zone. (b) Soils with a rating of 3-10 have a medium potential to leach nitrates below the root zone. (c) Soils with a rating of 10+ have a high potential to leach nitrates below the root zone. (d) All soils with systematic subsurface drains (tile) are rated high potential.
Table 9. Ohio (By County) Leaching Index Ratings for Soils by Hydrologic Groups (A, B, C, D) County A B C D County A B C D Adams 15 10 6 4 Licking 15 8 6 4 Allen 10 6 4 2 Logan 15 8 4 4 Ashland 15 8 4 4 Lorain 15 8 4 2 Ashtabula 15 10 4 4 Lucas 10 6 4 2 Athens 15 10 6 4 Madison 15 8 6 4 Auglaize 10 8 4 2 Mahoning 15 8 4 4 Belmont 15 10 6 4 Marion 15 8 4 4 Brown 15 10 6 4 Median 15 8 4 4 Butler 15 10 6 4 Meigs 15 10 6 4 Carroll 15 8 4 4 Mercer 10 8 4 2 Champaign 15 8 4 4 Miami 15 8 4 4 Clark 15 8 6 4 Monroe 15 10 6 4 Clermont 15 10 6 4 Montgomery 15 10 6 4 Clinton 15 10 6 4 Morgan 15 8 6 4 Columbiana 15 8 4 4 Morrow 15 8 4 4

Page 16
County A B C D County A B C D Coshocton 15 8 4 4 Muskingum 15 8 6 4 Crawford 15 8 4 2 Noble 15 8 6 4 Cuyahoga 15 8 4 4 Ottawa 10 6 4 2 Darke 15 8 4 4 Paulding 10 6 4 2 Defiance 10 6 4 2 Perry 15 8 6 4 Delaware 15 8 4 4 Pickaway 15 8 6 4 Erie 10 8 4 2 Pike 15 10 6 4 Fairfield 15 8 6 4 Portage 15 8 4 4 Fayette 15 10 6 4 Preble 15 10 6 4 Franklin 15 8 6 4 Putnam 10 6 4 2 Fulton 10 6 4 2 Richland 15 8 4 4 Gallia 15 10 6 4 Ross 15 10 6 4 Geauga 15 10 4 4 Sandusky 10 6 4 2 Greene 15 10 6 4 Scioto 15 10 6 4 Guernsey 15 8 6 4 Seneca 10 6 4 2 Hamilton 15 10 6 4 Shelby 15 8 4 4 Hancock 10 6 4 2 Stark 15 8 4 4 Hardin 10 8 4 2 Summit 15 8 4 4 Harrison 15 8 6 4 Trumbull 15 8 4 4 Henry 10 6 4 2 Tuscarawas 15 8 4 4 Highland 15 10 6 4 Union 15 8 4 4 Hocking 15 10 6 4 Van Wert 10 6 4 2 Holmes 15 8 4 4 Vinton 15 10 6 4 Huron 10 8 4 2 Warren 15 10 6 4 Jackson 15 10 6 4 Washington 15 10 6 4 Jefferson 15 8 6 4 Wayne 15 8 4 4 Knox 15 8 4 4 Williams 10 6 4 2 Lake 15 10 4 4 Wood 10 6 4 2 Lawrence 15 10 6 4 Wyandot 10 8 4 2
Calculating Available Nitrogen of Manure1 Use the following table to calculate available nitrogen based on time of year and type of application. Determine available nitrogen by multiplying the percent available for ammonia N and organic N and adding them together (i.e., 0.5 * NH4N + 0.33 * Organic N).
Table 10. Available Nitrogen
Manure Applied Manure
Available Nitrogen
Poultry Manure Available Nitrogen
Available Nitrogen % Time of Application
Days Until Incorporation2
Tons Pounds Pounds NH4 Organic Date Days 50 33 Nov-Feb <5 25 33 Nov-Feb >3 50 33 Mar-Apr <3 25 33 Mar-Apr >3 75 33 Apr-Jun <1 25 33 Apr-Jun >1 75 15 Jul-Aug <1 25 15 Jul-Aug >1 25 33 Sep-Oct <1 15 33 Sep-Oct >1 1The calculations are for all animal manures. It is assumed that 50% of the organic N in poultry manure is converted to NH4 rapidly and is therefore included in the NH4 column for calculating available N. 2Incorporation is the mixing of manure and soil in the tillage layer. Disking is usually enough tillage for conserving N availability.
Page 17
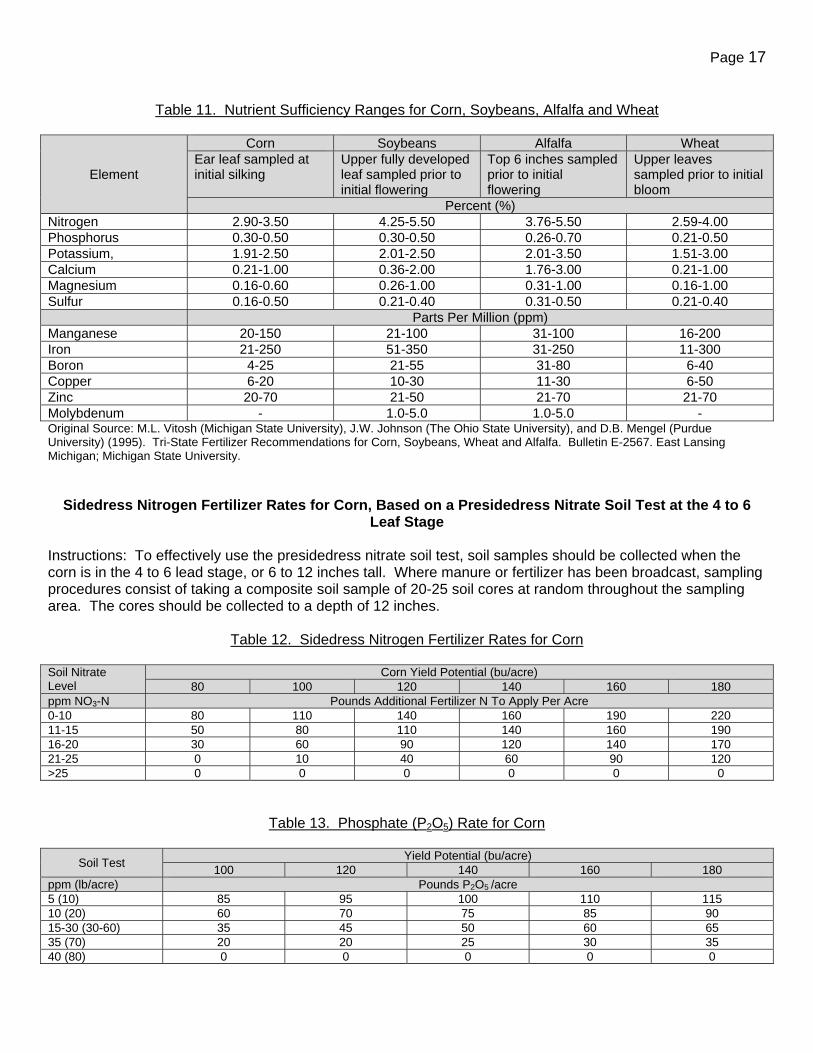
Table 11. Nutrient Sufficiency Ranges for Corn, Soybeans, Alfalfa and Wheat
Element
Corn Soybeans Alfalfa Wheat Ear leaf sampled at initial silking
Upper fully developed leaf sampled prior to initial flowering
Top 6 inches sampled prior to initial flowering
Upper leaves sampled prior to initial bloom
Percent (%) Nitrogen 2.90-3.50 4.25-5.50 3.76-5.50 2.59-4.00 Phosphorus 0.30-0.50 0.30-0.50 0.26-0.70 0.21-0.50 Potassium, 1.91-2.50 2.01-2.50 2.01-3.50 1.51-3.00 Calcium 0.21-1.00 0.36-2.00 1.76-3.00 0.21-1.00 Magnesium 0.16-0.60 0.26-1.00 0.31-1.00 0.16-1.00 Sulfur 0.16-0.50 0.21-0.40 0.31-0.50 0.21-0.40 Parts Per Million (ppm) Manganese 20-150 21-100 31-100 16-200 Iron 21-250 51-350 31-250 11-300 Boron 4-25 21-55 31-80 6-40 Copper 6-20 10-30 11-30 6-50 Zinc 20-70 21-50 21-70 21-70 Molybdenum - 1.0-5.0 1.0-5.0 - Original Source: M.L. Vitosh (Michigan State University), J.W. Johnson (The Ohio State University), and D.B. Mengel (Purdue University) (1995). Tri-State Fertilizer Recommendations for Corn, Soybeans, Wheat and Alfalfa. Bulletin E-2567. East Lansing Michigan; Michigan State University.
Sidedress Nitrogen Fertilizer Rates for Corn, Based on a Presidedress Nitrate Soil Test at the 4 to 6 Leaf Stage
Instructions: To effectively use the presidedress nitrate soil test, soil samples should be collected when the corn is in the 4 to 6 lead stage, or 6 to 12 inches tall. Where manure or fertilizer has been broadcast, sampling procedures consist of taking a composite soil sample of 20-25 soil cores at random throughout the sampling area. The cores should be collected to a depth of 12 inches.
Table 12. Sidedress Nitrogen Fertilizer Rates for Corn Soil Nitrate Level
Corn Yield Potential (bu/acre) 80 100 120 140 160 180
ppm NO3-N Pounds Additional Fertilizer N To Apply Per Acre 0-10 80 110 140 160 190 220 11-15 50 80 110 140 160 190 16-20 30 60 90 120 140 170 21-25 0 10 40 60 90 120 >25 0 0 0 0 0 0
Table 13. Phosphate (P2O5) Rate for Corn
Soil Test Yield Potential (bu/acre) 100 120 140 160 180
ppm (lb/acre) Pounds P2O5 /acre 5 (10) 85 95 100 110 115 10 (20) 60 70 75 85 90 15-30 (30-60) 35 45 50 60 65 35 (70) 20 20 25 30 35 40 (80) 0 0 0 0 0

Page 18
Table 14. Phosphate (P2O5) Rate for Corn Silage
Soil Test Yield Potential (tons/acre)
20 22 24 26 28 ppm (lb/acre) Pounds P2O5 /acre 5 (10) 115 125 130 135 140 10 (20) 90 100 105 110 115 15-30 (30-60) 65 75 80 85 90 35 (70) 35 40 40 45 45 40 (80) 0 0 0 0 0
Table 15. Phosphate (P2O5) Rate for Soybeans
Soil Test Yield Potential (bu/acre) 30 40 50 60 70
ppm (lb/acre) Pounds P2O5 /acre 5 (10) 75 80 90 100 105 10 (20) 50 55 65 75 80 15-30 (30-60) 25 30 40 50 55 35 (70) 10 15 25 25 30 40 (80) 0 0 0 0 0
Table 16. Phosphate (P2O5) Rate for Wheat
Soil Test Yield Potential (bu/acre) 50 60 70 80 90
ppm (lb/acre) Pounds P2O5 /acre 5 (10) 80 90 95 100 105 10 (20) 55 65 70 75 80 15-30 (30-60) 30 40 45 50 55 35 (70) 15 20 20 25 30 40 (80) 0 0 0 0 0
Table 17. Phosphate (P2O5) Rate for Alfalfa
Soil Test Yield Potential (tons/acre) 5 6 7 8 9
ppm (lb/acre) Pounds P2O5 /acre 5 (10) 115 130 140 185 165 10 (20) 90 105 115 130 140 15-30 (30-60) 65 80 90 105 115 35 (70) 35 40 45 50 60 40 (80) 0 0 0 0 0

Page 19
Phosphorus Index (P Index) Risk Assessment Procedure The P Index is a procedure that combines well-established factors that influence the runoff of phosphorus to surface waters. Each of the factors is evaluated based on site-specific data and weighted according to its overall effect on phosphorus transport. Each of the site subvalues are added together to establish an overall site rating of low, moderate, high, or very high risk. In most cases the use of the P Index will allow higher rates of phosphorus application than the Phosphorus Soil Test Risk Assessment Procedure. The use of the P Index should be viewed as a continuous measure until other alternatives can be developed to utilize excess phosphorus produced on the farm. Purpose: The P Index is a planning tool designed to help identify fields or areas of fields on a farm that have a higher or lower risk of phosphorus runoff from manure or other organic materials. Based on the risk assessment the appropriate land treatment and nutrient application treatments can be planned to minimize phosphorus transport from the site. Procedure: Use the P Index Assessment Procedure Worksheet to determine the site’s overall P Index. Use the following guidance to determine each of the site’s subvalues. The subvalues are added together to determine the overall site P Index. The worksheet can be photocopied as needed. A “Field Summary Worksheet” is also available with this procedure to record a series of site/field values for a given farm. It can be photocopied as needed. 1. SOIL EROSION – Sheet and rill erosion as measured by the Revised Universal Soil Loss Equation (RUSLE) [USDA-NRCS (2001) National Soil Survey handbook, Section 618.55] or Wind Erosion Prediction Procedure (where wind erosion is the primary concern) [USDA-NRCS (2001) National Soil Survey handbook, Section 618.72]. Determine the predicted soil loss and multiply by (1) to determine the “soil loss” site subvalue. 2. CONNECTIVITY TO WATER – Defines the vulnerability of P to be transferred from the site to a perennial stream or water body. The more closely connected the runoff is from the field via concentrated flow (from a defined grassed waterway or surface drain) to a perennial stream or water body the higher the vulnerability of P transport. To determine the “connectivity to water” site subfactor ask the question: Does concentrated flow (via a defined waterway, tile inlet, or surface drain) leave the site? Read the value definitions to determine the site’s “connectivity to water” subvalue. 3. RUNOFF CLASS – This represents the effect of the Hydrologic Soil Group (A, B, C, D) combined with the effect of slope. This factor represents the site’s runoff vulnerability. Use the table below to determine the runoff class. The runoff class is the site’s subvalue.
Table 18. Runoff Class Matrix – Phosphorus Index Values
Slope Range Hydrologic Soil Group
A B C D <1% 0 1 3 6 1-3% 1 2 4 7 4-6% 2 3 5 8 7-10% 3 5 7 10 11-15% 4 6 9 12 >15% 6 8 11 15
Page 20
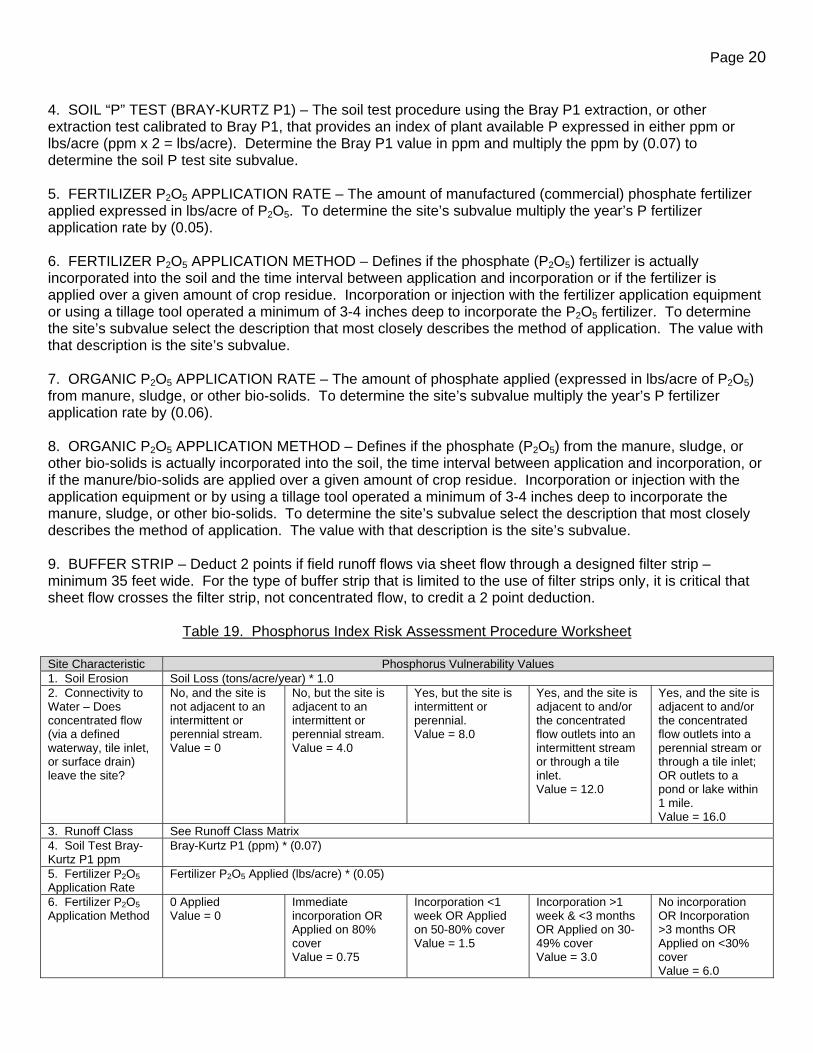
4. SOIL “P” TEST (BRAY-KURTZ P1) – The soil test procedure using the Bray P1 extraction, or other extraction test calibrated to Bray P1, that provides an index of plant available P expressed in either ppm or lbs/acre (ppm x 2 = lbs/acre). Determine the Bray P1 value in ppm and multiply the ppm by (0.07) to determine the soil P test site subvalue. 5. FERTILIZER P2O5 APPLICATION RATE – The amount of manufactured (commercial) phosphate fertilizer applied expressed in lbs/acre of P2O5. To determine the site’s subvalue multiply the year’s P fertilizer application rate by (0.05). 6. FERTILIZER P2O5 APPLICATION METHOD – Defines if the phosphate (P2O5) fertilizer is actually incorporated into the soil and the time interval between application and incorporation or if the fertilizer is applied over a given amount of crop residue. Incorporation or injection with the fertilizer application equipment or using a tillage tool operated a minimum of 3-4 inches deep to incorporate the P2O5 fertilizer. To determine the site’s subvalue select the description that most closely describes the method of application. The value with that description is the site’s subvalue. 7. ORGANIC P2O5 APPLICATION RATE – The amount of phosphate applied (expressed in lbs/acre of P2O5) from manure, sludge, or other bio-solids. To determine the site’s subvalue multiply the year’s P fertilizer application rate by (0.06). 8. ORGANIC P2O5 APPLICATION METHOD – Defines if the phosphate (P2O5) from the manure, sludge, or other bio-solids is actually incorporated into the soil, the time interval between application and incorporation, or if the manure/bio-solids are applied over a given amount of crop residue. Incorporation or injection with the application equipment or by using a tillage tool operated a minimum of 3-4 inches deep to incorporate the manure, sludge, or other bio-solids. To determine the site’s subvalue select the description that most closely describes the method of application. The value with that description is the site’s subvalue. 9. BUFFER STRIP – Deduct 2 points if field runoff flows via sheet flow through a designed filter strip – minimum 35 feet wide. For the type of buffer strip that is limited to the use of filter strips only, it is critical that sheet flow crosses the filter strip, not concentrated flow, to credit a 2 point deduction.
Table 19. Phosphorus Index Risk Assessment Procedure Worksheet Site Characteristic Phosphorus Vulnerability Values 1. Soil Erosion Soil Loss (tons/acre/year) * 1.0 2. Connectivity to Water – Does concentrated flow (via a defined waterway, tile inlet, or surface drain) leave the site?
No, and the site is not adjacent to an intermittent or perennial stream. Value = 0
No, but the site is adjacent to an intermittent or perennial stream. Value = 4.0
Yes, but the site is intermittent or perennial. Value = 8.0
Yes, and the site is adjacent to and/or the concentrated flow outlets into an intermittent stream or through a tile inlet. Value = 12.0
Yes, and the site is adjacent to and/or the concentrated flow outlets into a perennial stream or through a tile inlet; OR outlets to a pond or lake within 1 mile. Value = 16.0
3. Runoff Class See Runoff Class Matrix 4. Soil Test Bray-Kurtz P1 ppm
Bray-Kurtz P1 (ppm) * (0.07)
5. Fertilizer P2O5 Application Rate
Fertilizer P2O5 Applied (lbs/acre) * (0.05)
6. Fertilizer P2O5 Application Method
0 Applied Value = 0
Immediate incorporation OR Applied on 80% cover Value = 0.75
Incorporation <1 week OR Applied on 50-80% cover Value = 1.5
Incorporation >1 week & <3 months OR Applied on 30-49% cover Value = 3.0
No incorporation OR Incorporation >3 months OR Applied on <30% cover Value = 6.0
Page 21
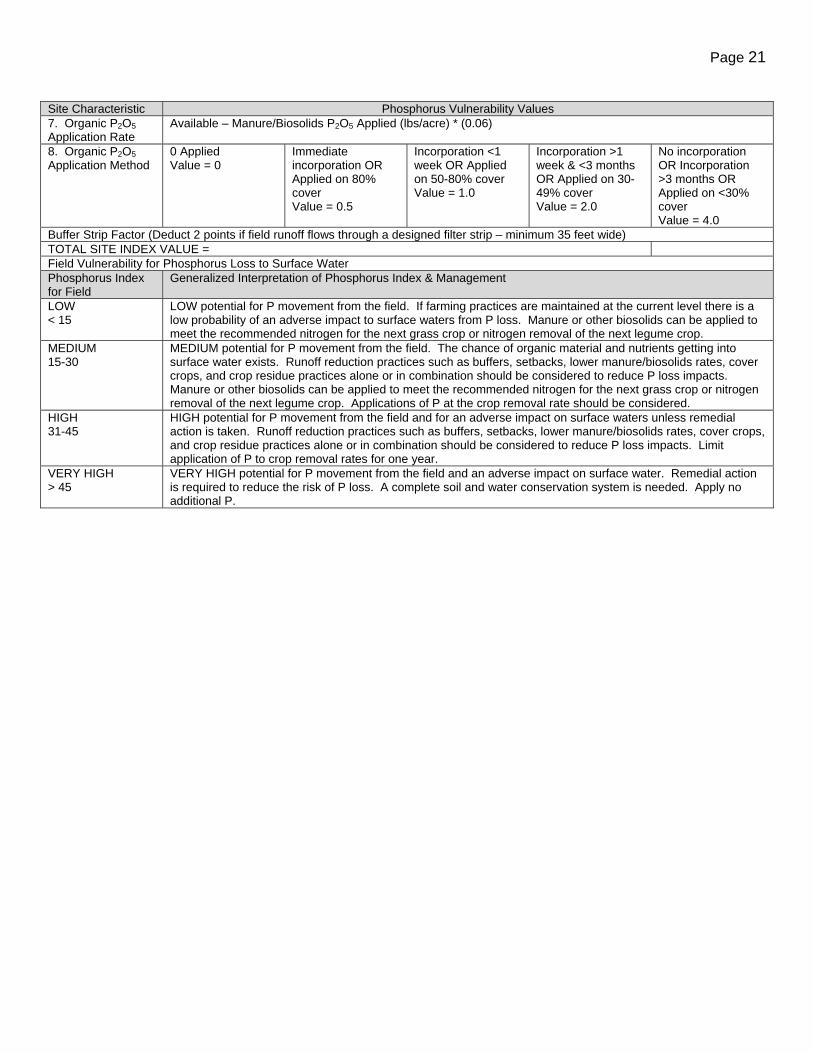
Site Characteristic Phosphorus Vulnerability Values 7. Organic P2O5 Application Rate
Available – Manure/Biosolids P2O5 Applied (lbs/acre) * (0.06)
8. Organic P2O5 Application Method
0 Applied Value = 0
Immediate incorporation OR Applied on 80% cover Value = 0.5
Incorporation <1 week OR Applied on 50-80% cover Value = 1.0
Incorporation >1 week & <3 months OR Applied on 30-49% cover Value = 2.0
No incorporation OR Incorporation >3 months OR Applied on <30% cover Value = 4.0
Buffer Strip Factor (Deduct 2 points if field runoff flows through a designed filter strip – minimum 35 feet wide) TOTAL SITE INDEX VALUE = Field Vulnerability for Phosphorus Loss to Surface Water Phosphorus Index for Field
Generalized Interpretation of Phosphorus Index & Management
LOW < 15
LOW potential for P movement from the field. If farming practices are maintained at the current level there is a low probability of an adverse impact to surface waters from P loss. Manure or other biosolids can be applied to meet the recommended nitrogen for the next grass crop or nitrogen removal of the next legume crop.
MEDIUM 15-30
MEDIUM potential for P movement from the field. The chance of organic material and nutrients getting into surface water exists. Runoff reduction practices such as buffers, setbacks, lower manure/biosolids rates, cover crops, and crop residue practices alone or in combination should be considered to reduce P loss impacts. Manure or other biosolids can be applied to meet the recommended nitrogen for the next grass crop or nitrogen removal of the next legume crop. Applications of P at the crop removal rate should be considered.
HIGH 31-45
HIGH potential for P movement from the field and for an adverse impact on surface waters unless remedial action is taken. Runoff reduction practices such as buffers, setbacks, lower manure/biosolids rates, cover crops, and crop residue practices alone or in combination should be considered to reduce P loss impacts. Limit application of P to crop removal rates for one year.
VERY HIGH > 45
VERY HIGH potential for P movement from the field and an adverse impact on surface water. Remedial action is required to reduce the risk of P loss. A complete soil and water conservation system is needed. Apply no additional P.

Page 22
Phosphorus Soil Test Risk Assessment Procedure
Nitrogen and Phosphorus Application Criteria for Manure Criteria Application to All Soil Test Levels: 1. Nitrogen application rates from manure shall be based on Total Ammonium Nitrogen content plus 1/3 of the Organic Nitrogen content calculated at time of application when applied during the summer, fall, or winter for spring planted crops. When applied in the spring for spring planted crops the nitrogen application rate can be adjusted to apply the recommended nitrogen within the P2O5, K2O, and other limitations. 2. Nitrogen rates are not to exceed the succeeding crop’s recommended Nitrogen for non-legume crops or the Nitrogen removal in the crop’s biomass for legume crops. 3. All applications are based on current soil test results (not more than 3 years old). 4. No manufactured P2O5 applied above 40 ppm Bray P1 or equivalent test, unless recommended by appropriate industry standards or the land grant universities for specialty crops, vegetable crops, etc. 5. Manure shall be applied in accordance with the restrictions and setbacks in this permit.
Table 20. Phosphorus Soil Test Risk Assessment
“P” Soil Test Level Application Criteria Bray P1 < 40 ppm (<80 lbs/acre) OR Other equivalents (e.g., Mehlich 3)
Recommended N or P2O5. Manure can be applied to meet the succeeding crop’s recommended nitrogen requirements for non-legume crops or the nitrogen removal for legume recommended P2O5 but not to exceed the nitrogen needs of the succeeding crop.
Bray P1 40-100 ppm (80-200 lbs/acre) OR Other equivalents (e.g., Mehlich 3)
Recommended N or P2O5 Removal whichever is less. The field shall have >30% ground cover at the time of application or the manure shall be incorporated within one week. The manure can be applied to meet the succeeding crop’s recommended nitrogen requirements for non-legume crops or the nitrogen removal for legume crops; or P2O5 removal (annual or multiple year applications) whichever is less.
Bray P1 100-150 ppm (200-300 lbs/acre) OR Other equivalents (e.g., Mehlich 3)
Recommended N or P2O5 Removal whichever is less. Manure shall be applied so as not to exceed the succeeding crop’s recommended nitrogen requirements for non-legume crops or the nitrogen removal for legume crops. In addition, a multiple year application of Phosphorus is not authorized.
Bray P1 > 150 ppm (> 300 lbs/acre) OR Other equivalents (e.g., Mehlich 3)
1. No additional P2O5 – Use P2O5 draw-down strategies; or 2. Shall use the Phosphorus Index Risk Assessment Procedure in Part VII, C.
Page 23
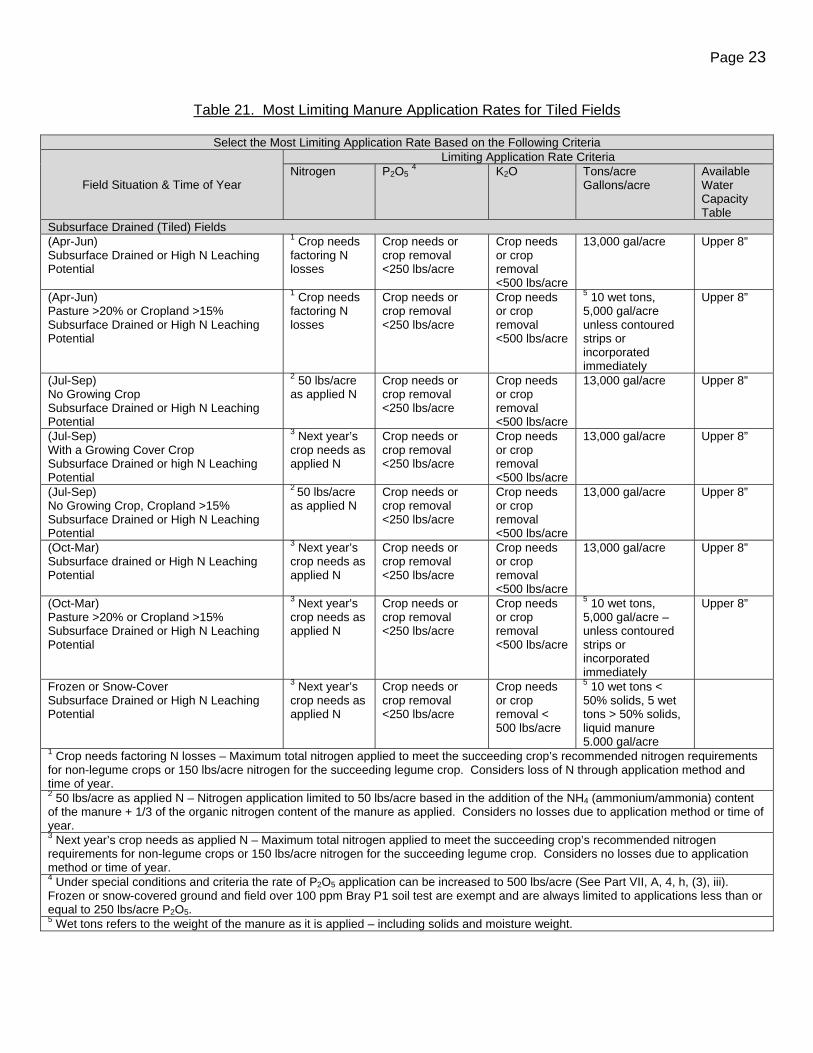
Table 21. Most Limiting Manure Application Rates for Tiled Fields
Select the Most Limiting Application Rate Based on the Following Criteria
Field Situation & Time of Year
Limiting Application Rate Criteria Nitrogen P2O5 4 K2O Tons/acre
Gallons/acre Available Water Capacity Table
Subsurface Drained (Tiled) Fields (Apr-Jun) Subsurface Drained or High N Leaching Potential
1 Crop needs factoring N losses
Crop needs or crop removal <250 lbs/acre
Crop needs or crop removal <500 lbs/acre
13,000 gal/acre Upper 8”
(Apr-Jun) Pasture >20% or Cropland >15% Subsurface Drained or High N Leaching Potential
1 Crop needs factoring N losses
Crop needs or crop removal <250 lbs/acre
Crop needs or crop removal <500 lbs/acre
5 10 wet tons, 5,000 gal/acre unless contoured strips or incorporated immediately
Upper 8”
(Jul-Sep) No Growing Crop Subsurface Drained or High N Leaching Potential
2 50 lbs/acre as applied N
Crop needs or crop removal <250 lbs/acre
Crop needs or crop removal <500 lbs/acre
13,000 gal/acre Upper 8”
(Jul-Sep) With a Growing Cover Crop Subsurface Drained or high N Leaching Potential
3 Next year’s crop needs as applied N
Crop needs or crop removal <250 lbs/acre
Crop needs or crop removal <500 lbs/acre
13,000 gal/acre Upper 8”
(Jul-Sep) No Growing Crop, Cropland >15% Subsurface Drained or High N Leaching Potential
2 50 lbs/acre as applied N
Crop needs or crop removal <250 lbs/acre
Crop needs or crop removal <500 lbs/acre
13,000 gal/acre Upper 8”
(Oct-Mar) Subsurface drained or High N Leaching Potential
3 Next year’s crop needs as applied N
Crop needs or crop removal <250 lbs/acre
Crop needs or crop removal <500 lbs/acre
13,000 gal/acre Upper 8”
(Oct-Mar) Pasture >20% or Cropland >15% Subsurface Drained or High N Leaching Potential
3 Next year’s crop needs as applied N
Crop needs or crop removal <250 lbs/acre
Crop needs or crop removal <500 lbs/acre
5 10 wet tons, 5,000 gal/acre – unless contoured strips or incorporated immediately
Upper 8”
Frozen or Snow-Cover Subsurface Drained or High N Leaching Potential
3 Next year’s crop needs as applied N
Crop needs or crop removal <250 lbs/acre
Crop needs or crop removal < 500 lbs/acre
5 10 wet tons < 50% solids, 5 wet tons > 50% solids, liquid manure 5.000 gal/acre
1 Crop needs factoring N losses – Maximum total nitrogen applied to meet the succeeding crop’s recommended nitrogen requirements for non-legume crops or 150 lbs/acre nitrogen for the succeeding legume crop. Considers loss of N through application method and time of year. 2 50 lbs/acre as applied N – Nitrogen application limited to 50 lbs/acre based in the addition of the NH4 (ammonium/ammonia) content of the manure + 1/3 of the organic nitrogen content of the manure as applied. Considers no losses due to application method or time of year. 3 Next year’s crop needs as applied N – Maximum total nitrogen applied to meet the succeeding crop’s recommended nitrogen requirements for non-legume crops or 150 lbs/acre nitrogen for the succeeding legume crop. Considers no losses due to application method or time of year. 4 Under special conditions and criteria the rate of P2O5 application can be increased to 500 lbs/acre (See Part VII, A, 4, h, (3), iii). Frozen or snow-covered ground and field over 100 ppm Bray P1 soil test are exempt and are always limited to applications less than or equal to 250 lbs/acre P2O5. 5 Wet tons refers to the weight of the manure as it is applied – including solids and moisture weight.

Page 24
Table 22. Most Limiting Manure Application Rates for Non-Tiled Fields
Select the Most Limiting Application Rate Based on the Following Criteria
Field Situation & Time of Year
Limiting Application Rate Criteria Nitrogen P2O5 4 K2O Tons/acre
Gallons/acre Available Water Capacity Table
Non Subsurface Drained (Tiled) Fields (Apr-Jun) Not Subsurface Drained Pasture >20% or Cropland >15%
1 Crop needs factoring N losses
Crop needs or crop removal <250 lbs/acre
Crop needs or crop removal <500 lbs/acre
5 10 wet tons, 5,000 gal/acre unless contoured strips or incorporated immediately
Upper 8”
(Jul-Sep) Not Subsurface Drained
1 Crop needs factoring N losses
Crop needs or crop removal <250 lbs/acre
Crop needs or crop removal <500 lbs/acre
Upper 8”
(Jul-Sep) Not Subsurface Drained Pasture >20% or Cropland >15%
1 Crop needs factoring N losses
Crop needs or crop removal <250 lbs/acre
Crop needs or crop removal <500 lbs/acre
Upper 8”
(Oct-Mar) Not Subsurface Drained
1 Crop needs factoring N losses
Crop needs or crop removal <250 lbs/acre
Crop needs or crop removal <500 lbs/acre
Upper 8”
(Oct-Mar) Not Subsurface Drained Pasture >20% or Cropland >15%
1 Crop needs factoring N losses
Crop needs or crop removal <250 lbs/acre
Crop needs or crop removal <500 lbs/acre
5 10 wet tons, 5,000 gal/acre – unless contoured strips or incorporated immediately
Upper 8”
Frozen or Snow-Cover Not Subsurface Drained
1 Next year’s crop needs factoring N losses
Crop needs or crop removal <250 lbs/acre
Crop needs or crop removal < 500 lbs/acre
5 10 wet tons < 50% solids, 5 wet tons > 50% solids, liquid manure 5,000 gal/acre
1 Crop needs factoring N losses – Maximum total nitrogen applied to meet the succeeding crop’s recommended nitrogen requirements for non-legume crops or 150 lbs/acre nitrogen for the succeeding legume crop. Considers loss of N through application method and time of year. 4 Under special conditions and criteria the rate of P2O5 application can be increased to 500 lbs/acre (See Part VII, A, 4, h, (3), iii). Frozen or snow-covered ground and field over 100 ppm Bray P1 soil test are exempt and are always limited to applications less than or equal to 250 lbs/acre P2O5. 5 Wet tons refers to the weight of the manure as it is applied – including solids and moisture weight.