Le crowdfunding et les banques: menace, complément et enjeux

1
PART VI – FINANCIAL SERVICES

2
15. MONEY AND BANKING
Central Bank of Lebanon
Central Bank of Lebanon balance sheet Assets and liabilities of the Central Bank of Lebanon are equal to 94,381 billion LBP in December 2010.
Table 15.1 – Central Bank of Lebanon balance sheet. December 2010 Assets % Liabilities %
Foreign assets 66.5 Currency in circulation outside BDL 3.3
Claims on the private sector 0.4 Deposits 63.1
Loans to banks 1.2 Public sector accounts 9.9
Claims on public sector 0.2 Valuation adjustment 11.8
Securities portfolio 18.7 Securities other than shares 3.2
Fixed assets 0.4 Foreign liabilities 0.4
Unclassified assets 12.6 Capital accounts 4.5
Unclassified Liabilities 1.1
Total assets. Billion LBP 94,381 Total liabilities. Billion LBP 94,381
Table made by CAS based on Central Bank of Lebanon data (2010)
Commercial banks balance sheet Assets and liabilities of commercial banks are equal to 194,355 billion LBP in December 2010, thus 2.1 times the Central Bank of Lebanon assets and liabilities.
Table 15.2 – Commercial banks consolidated balance sheet. December 2010
Assets % Liabilities %
Reserves 31.5 Resident private sector deposits 68.8
Claims on the private sector 23.5 Public sector deposits 1.1
Claims on the public sector 22.7 Foreign liabilities 17.8
Foreign assets 20.0 Bonds 0.2
Fixed assets 2.2 Capital accounts 7.2
Unclassified assets 0.2 Unclassified Liabilities 4.9
Total assets. Billion LBP 194,355 Total liabilities. Billion LBP 194,355
Table made by CAS based on Central Bank of Lebanon data (2010)
Money and banking deals with the Central Bank of Lebanon and the commercial banks statistics
The Central Bank of Lebanon part deals with the balance sheet of the bank of Lebanon, the consolidated balance sheet of commercial banks, the monetary situation, the banks clearings, the treasury bills in circulation,
the exchange rate, the private sector deposits in commercial banks, the financing of foreign trade, the geographic distribution of ATMs, the payment cards and the bank loans to economic sectors.

3
Monetary situation Monetary situation consists of money and its counterparts evolution.
Table 15.3 – Monetary situation. December 2010 Money supply Billion LBP
Money and quasi-Money in LBP and foreign currencies (M3) 138,910
Counterparts Billion LBP
Net foreign assets 66,536 Net claims on public sector 37,708 Claims on the private sector 47,829 Other items (net) (13,163)
Table made by CAS based on Central Bank of Lebanon data (2010)
Banks clearing The clearings are in LBP, in USD, in Euros and in Sterling.
Table 15.4 – Bank clearings. Value and % in 2010 Clearings Value Peak Month. % Peak region. %
LBP clearings. Thousands 3,512 December (9.2) Beirut (84.1) LBP clearings. Billion LBP 20,374 December (9.5) Beirut (90.2) USD clearings. Thousands 9,286 July (9.1) USD clearings. Million USD 52,558 March (9.8)
Euro clearings. Thousands 103 All year months except for January, April, August,
and November (9.0)
Euro clearings. Million Euros 1,268 March (10.3) Sterling clearings. Thousands 3 May and October (9.5) Sterling clearings. Million Sterling 73 June (11.9)
Table made by CAS based on Central Bank of Lebanon data (2010)
Treasury bills in circulation Treasury bonds in 2010 in billion LBP: Issues peak month: December (3,821).
Reimbursment peak month: December (2,028).
In circulation at the end of period peak month: December (47,237).
Table 15.5 – Treasury bills. End of period in 2010
By pay-day
Type Peak month. Billion LBP
3 months – Issue August (171) 3 months – Reimbursment November (171) 3 months – In circulation at the end of period September (349) 6 months – Issue November (711) 6 months – Reimbursment April (350) 6 months – In circulation at the end of period December (2,141) 12 months – Issue December (680) 12 months – Reimbursment October (441) 12 months – In circulation at the end of period January (2,170) 24 months – Issue September (369) 24 months – Reimbursment September (305) 24 months – In circulation at the end of period October (3,460) Over 3 years – Issue December (2,487) Over 3 years – Reimbursment December (1,618) Over 3 years – In circulation at the end of period December (39,592)
By subscriber
Banque du Liban December (12,762) Banks February (27,775) Financial institutions March and April (135) Public administrations October (1,191) Public December (1,519)
Total December (47,237)
Table made by CAS based on Central Bank of Lebanon data (2010)

4
Exchange rate This part displays the foreign bills medium exchange rate in LBP. USD is always equal to LBP 1507.50.
Table 15.6 – Medium exchange rate. LBP in 2010 By pay-day
Currency and metal Peak month. LBP
Euro January (2,152.35) Sterling Pound January (2,440.16) Swiss Franc October (1,557.90) Japanese Yen October (18.43) Canadian Dollar April (1,501.64) Saudi Rial February, March, October, and November (401.98) Egyptian Pound January (276.76) Emirates Dirham March and November (410.45) Special Drawing Rights October (2,365.44) Gold December (2,098,863) Silver December (44,130)
Table made by CAS based on Central Bank of Lebanon data (2010)
Private sector deposits in commercial banks This part details the private sector deposits in commercial banks.
Table 15.7 – Private sector deposits in commercial banks. Billion LBP in December 2010 Deposits Billion LBP %
Residents' deposits 133,743 82.8 Non residents' deposits 27,866 17.2
Total 161,610 100.0
Total deposits in LBP 59,410 36.8 Total deposits in foreign currencies 102,199 63.2
Total 161,610 100.0
Table made by CAS based on Central Bank of Lebanon data (2010) Other peaks in 2010: Dollarization rate peak month: February (67.9%).
Requests for information at Centrale des Risques peak month: March (19,654 units).
Financing foreign trade
This part displays documentary L/Cs and bills for collection.
Table 15.8 – Financing foreign trade. Billion LBP in 2010 Type December 2010. Billion LBP Peak month. Billion LBP
Documentary L/Cs
Opened credits
Imports 635.7 April (755.5) Exports 500.4 January (576.0)
Used credits
Imports 582.4 June (744.1) Exports 705.7 Deccember (705.7)
Outstanding credits at the end of period
Imports 1412.3 April (1615.6) Exports 1698.1 September (2263.9)
Bills for collection
Inward bills
Imports 260.9 August (387.1)
Outward bills
Exports 620.1 July (661.5)
Outstanding bills at the end of period
Imports 231.6 November (252.8) Exports 588.4 December (588.4)
Table made by CAS based on Central Bank of Lebanon data (2010)
5
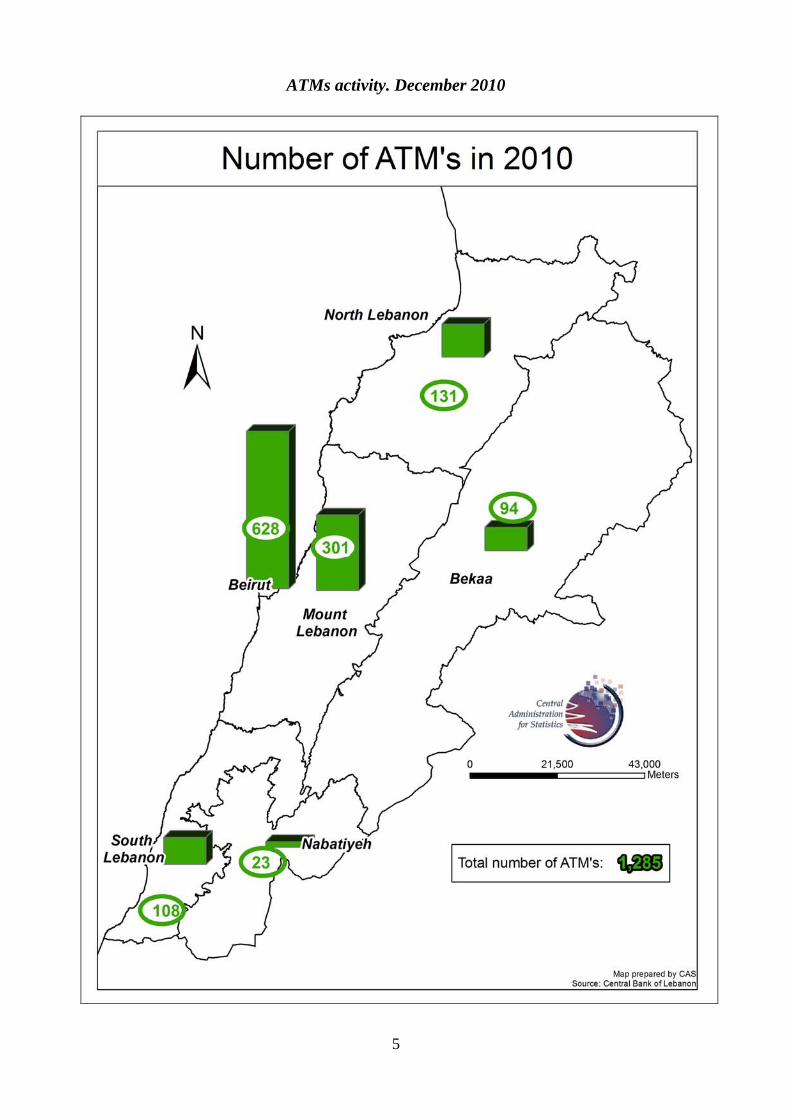
ATMs activity. December 2010

6
ATMs in Lebanon: Number: 1,285 ATMs. Peak Mohafazat: Beirut and Suburbs (48.9%).
Payment cards points of sale in Lebanon: Number: 91,016points of sale.
Peak type: Number of contracts signed with merchants (53.4%).
Payment cards. LBP payments & drawings inside Lebanon by residents: Share of LBP payments out of total payments in LBP & USD in December: 12.3%.
o Share of LBP payments out of total payments in LBP & USD: Peak month: November (12.6%).
Share of LBP withdraws out of total drawings in LBP & USD in December: 69.8%. o Share of LBP withdraws out of total drawings in LBP & USD: peak month: December (69.8%).
Outstanding payment cards in December Number: 1,676,372 cards.
Peak month: November (1,677,404 cards).
Peak type: Resident cardholders (97.2%).
Payment Cards. Purchases and Cash Withdrawals: POS Purchases inside Lebanon by Residents in December: USD 161,026,314.
o Peak month: December (USD 161,026,314).
POS Purchases inside Lebanon by Non-Residentsin December: USD 2,526,791. o Peak month: December (USD 2,526,791).
POS Purchases & ATM Cash Withdraw- Outside Lebanon by Residents in December: USD 79,616,387. o Peak month: September (USD 84,777,517).
ATM Cash Withdrawals inside Lebanon by Residentsin December: USD 538,087,014. o Peak month: December (USD 538,087,014).
ATM Cash Withdrawals inside Lebanon by Non-Residents: USD 6,958,817. o Peak month: July (USD 9,069,521).
Bank loans to economic sectors Bank loans are given to all economic sectors. Trade and services (39.7%) are the peak sector in 2009.
Table 15.9 – Bank loans to economic sectors Activity December 2004. Billion LBP December 2010. Billion LBP Change. %
Trade and services 11,867 21,046 77.3
Construction & transactions 4,620 9,494 105.5
Industry 3,837 6,564 71.1
Personal loans 4,330 13,723 216.9
Financial Intermediation 933 4927 428.1
Agriculture 292 554 89.7
Other sectors 983 2,036 107.1
Total 26,862 58,344 117.2
Table made by CAS based on Central Bank of Lebanon data (2010)

7
Commercial banks in Lebanon
Commercial banks main characteristics: Number in 2010: 67 banks.
o Commercial banks: 80.6%. o Investment banks: 19.4%.
Bank agencies in 2010: 912 agencies. o Peak region: Beirut and suburbs: 54.3% of agencies. o Agencies number: December 2005: 825 agencies. o Agencies number: December 2010: 912 agencies. o Change (2005-2010): 10.5%.
Beneficiaries by credit range: o End of period 201: 223,492 beneficiaries. o End of period 2010: 356,532beneficiaries. o Change (2008-2010): 59.5%
Expenditures, products, and net profits of banks: o Expenditures:
Year 2004: 5,928 billion LBP. Year 2010: 10,414 billion LBP. Change (2004-2010): 75.7%.
o Products: Year 2004: 6,624 billion LBP. Year 2010: 12,888 billion LBP. Change (2004-2010): 94.6%.
o Net profits: Year 2004: 696 billion LBP. Year 2010: 2,474 billion LBP. Change (2004-2010): 255.5%.
Credits by sector: o End of period 2005: 27,145 billion LBP. o End of period 2010: 58,344 billion LBP. o Change (2005-2010): 114.9%.
Employees: o Year 2005: 15,993 employees. o Year 2010: 21,337employees. o Change (2005-2010): 33.4%
Employees wages and allowances: o Year 2005: 719 billion LBP. o Year 2010: 1,210 billion LBP. o Change (2005-2010): 68.2%.
The commercial banks section studies their distribution, expenditures and revenues, consolidated accounts of profit and loss, distribution of deposits, bank credits, and credits beneficiary. It also deals with geographic distribution of
bank agencies, employees' salaries and allowances and average salary of a bank employee.

8

9
Banks regional activities Banks regional activity deals with concentration and credits. The peak region is Beirut and its suburbs.
Table 15.10 – Bank regional activities (2008-2010) Beirut and suburbs December 2008. % December 2010. % Change. %
Concentration
Region 67.6 69.3 2.5
Depositors 50.1 49.5 (1.2)
Credits
Region 82.4 80.6 (2.2)
Depositors 60.4 56.4 (6.6)
Table made by CAS based on Association des Banques du Liban data (2010)
Beneficiaries by credit range The credit less than LBP 5,000,000 showed the highest increase (108.9%) of beneficiaries for the period 2008 – 2010.
Table 15.11 – Beneficiaries by credit range. Number (2008-2010)
Range. LBP Number
Change. % 2008 2010
< 5000,000 7,119 14,869 108.9%
5000,000 - 25,000,000 121,654 211,484 73.8%
25,000,000 - 100,000,000 69,543 87,899 26.4%
100,000,000 - 500,000,000 18,234 32,914 80.5%
500,000,000 - 1,000,000,000 2,569 3,797 47.8%
1,000,000,000 - 5,000,000,000 3,110 3,939 26.7%
5,000,000,000 - 10,000,000,000 601 797 32.6%
> 10,000,000,000 662 833 25.8%
Total 223,492 356,532 59.5%
Table made by CAS based on Association des Banques du Liban data (2010)
Banks expenditures and revenues The difference between banks expenditures and revenues gives the net profit which shows an increase of 159.2% between 2004 and 2009.
Table 15.12 – Bank expenditures and revenues. Billion LBP (2008-2010)
Billion LBP
Category 2004 2005 2006 2007 2008 2009 2010 Change (2004-2010). %
Expenditures 5,928 6,468 7,459 8,103 8,467 9,548 10,414 75.7
Products 6,624 7,250 8,466 9,384 10,076 11,352 12,888 94.6
Net profits 696 782 1,007 1,281 1,609 1,804 2,474 255.5
Table made by CAS based on Association des Banques du Liban data (2010)

10

11
Credits by sector
Bank human resources Total employees of banks were 15,993 in 2005. They increased of 33.4% to reach 21,337 employees in 2010. The increases peaks for the period (2005-2010) are registered for the following categories according to: Sex: females (37.9%).
Age: less than 25 years (112.7%).
Status: Single (54.l%).
Educational level: University degree (66.6%).
Bank category: Lebanese commercial banks Sal (35.4%).
Table 15.13 – Banks expenditures and revenues. Period (2008-2010)
Billion LBP Change.
% Year 2004 2010
Expenditures 5,928 10,414 75.7
Paid interests 4,202 7,295 73.6
Net provisions 155 70 (54.8)
Staff expenses 722 1,383 91.6
General operating expenses 728 1,213 66.6
Income tax 121 453 274.4
Products 6,624 12,888 94.6
Received interests 5,889 10,970 86.3
Net commissions received and other banking
investment revenues 758
1,890 149.3
Other revenues -23 28 (221.7)
Net profits 696 2,474 255.5
Table made by CAS based on Association des Banques du Liban data (2010)
Increase / Decrease peaks for the period 2004-2010: Expenditures: income tax
increase: 274.4%.
Products: Other revenues decrease: (221.7%).
Net profits increase: 255.5%.
Table 15.14 – Credits by sector. Period (2005-2010)
Economic sector Billion LBP
Change. % 2005 2010
Agriculture 344 554
61.0
Industry 4,027 6,564
63.0
Construction 4,206 9,494
125.7
Trade and services 11,537 21,046
82.4
Financial intermediation 1,131 4,927
335.6
Others 1,172 2,036
73.7
Individuals 4,728 13,723
190.2
Total 27,145 58,344 114.9
Table made by CAS based on Association des Banques du Liban data (2010)
Credits by sector are given to agriculture, industry, construction, trade and services, financial intermediation, others, and individuals. Total credits in 2010 reached 58,344 billion LBP. The sector which benfited the most of credits is trade and services (36.1%). Financial intermediation registered the highest increase for the period 2005-2010: 335.6%.

12
Table 15.15 – Banks human resources (2005-2010)
2005 2010 Change. %
Employees 15,993 21,337 33.4
According to sex
Male 9,013 11,715
30.0
Female 6,980 9,622
37.9
According to age
Less than 25 years 1,133 2,410 112.7
[25-40[ years 7,661 10,156 32.6
[40-60[ years 6,730 7,998 18.8
60 years and more 469 773 64.8
Status
Single 5,586 8,610 54.1
Married 10,407 12,727 22.3
Number of children 16,535 19,121 15.6
According to the educational level
Less than Bac. 2,810 2,588 (7.9)
Bac. 2nd part or equivalent 4,263 3,888 (8.8)
University degree 8,920 14,861 66.6
According to bank's category
Lebanese commercial banks Sal 14,639 19,823
35.4
Foreign commercial banks 1,097 771
(29.7)
Investment banks 257 743
189.1
Table made by CAS based on Association des Banques du Liban data (2010)
Bank employees’ wages and allowances Total banks employees’ wages and allowances were 719 billion LBP in 2005. They increased of 68.2% to reach 1,210 billion LBP in 2010. The increases peaks for the period (2005-2010) are registered for the following categories according to: Salaries: family benefits (70.2%).
Allowances of end of service: NSSF (80.8%).
NSSF: other benefits (95.2%).

13
Table 15.16 – Banks employees’ wages and allowances. Billion LBP (2005-2010)
Billion LBP Change. %
2005 2010
Salaries
Family benefits 437.2 744.2 70.2
NSSF 14.7 20.9 42.2
Surplus 10.2 11.0 7.8
Allowances of end of service
NSSF 39.0 70.5 80.8
Provisions 61.9 80.2 29.6
Health allowances 19.3 26.7 38.3
NSSF
Surplus 18.5 25.2 36.2
Other benefits 118.3 230.9 95.2
Total 719 1,210 68.2
Table made by CAS based on Association des Banques du Liban data (2010)