
Part of celiac population still at risk despite current ... · of celiac population still at risk...
17
Accepted Manuscript Part of celiac population still at risk despite current gluten thresholds I.D. Bruins Slot, M.G.E.G. Bremer, R.J. Hamer, H.J. van der Fels-Klerx PII: S0924-2244(15)00053-9 DOI: 10.1016/j.tifs.2015.02.011 Reference: TIFS 1634 To appear in: Trends in Food Science & Technology Please cite this article as: Bruins Slot, I.D, Bremer, M.G.E.G., Hamer, R.J., van der Fels-Klerx, H.J., Part of celiac population still at risk despite current gluten thresholds, Trends in Food Science & Technology (2015), doi: 10.1016/j.tifs.2015.02.011. This is a PDF file of an unedited manuscript that has been accepted for publication. As a service to our customers we are providing this early version of the manuscript. The manuscript will undergo copyediting, typesetting, and review of the resulting proof before it is published in its final form. Please note that during the production process errors may be discovered which could affect the content, and all legal disclaimers that apply to the journal pertain.
Transcript of Part of celiac population still at risk despite current ... · of celiac population still at risk...
Accepted Manuscript
Part of celiac population still at risk despite current gluten thresholds
I.D. Bruins Slot, M.G.E.G. Bremer, R.J. Hamer, H.J. van der Fels-Klerx
PII: S0924-2244(15)00053-9
DOI: 10.1016/j.tifs.2015.02.011
Reference: TIFS 1634
To appear in: Trends in Food Science & Technology
Please cite this article as: Bruins Slot, I.D, Bremer, M.G.E.G., Hamer, R.J., van der Fels-Klerx, H.J., Partof celiac population still at risk despite current gluten thresholds, Trends in Food Science & Technology(2015), doi: 10.1016/j.tifs.2015.02.011.
This is a PDF file of an unedited manuscript that has been accepted for publication. As a service toour customers we are providing this early version of the manuscript. The manuscript will undergocopyediting, typesetting, and review of the resulting proof before it is published in its final form. Pleasenote that during the production process errors may be discovered which could affect the content, and alllegal disclaimers that apply to the journal pertain.

MANUSCRIP
T
ACCEPTED
ACCEPTED MANUSCRIPT
1
Part of celiac population still at risk despite current gluten 1
thresholds 2
3
I.D. Bruins Slota, M.G.E.G. Bremera, R.J. Hamerb, H.J. van der Fels-Klerxa 4
5
a RIKILT – Wageningen UR, Wageningen, The Netherlands 6
b Laboratory of Food Chemistry, Wageningen University and Research Centre, Wageningen, The Netherlands 7
8
Address correspondence to H.J. van der Fels-Klerx, RIKILT – Wageningen University and Research Centre, 9
Akkermaalsbos 2, 6708 WB Wageningen, The Netherlands. 10
Telephone: +31 317 481963 Email: [email protected] 11
12
Key words: Celiac disease, gluten, thresholds, food safety 13
14
Abstract 15
In order to assist celiac disease (CD) patients in making safe food choices, gluten-free food products are labelled 16
as such. The exact meaning of the gluten-free label differs throughout the world. This paper discusses the 17
different thresholds that are currently used to label products gluten-free and compares tolerable gluten levels to 18
the gluten levels CD patients can be exposed to with these thresholds in place. Currently, the most applied gluten 19
threshold to label products gluten-free does not protect the most vulnerable patients. Therefore, we propose to 20
lower the threshold for products with a gluten-free label to 3 ppm gluten. 21
22
Introduction 23
Approximately 1% of the world population is afflicted with celiac disease (Lionetti & Catassi, 2011; Reilly & 24
Green, 2012). These persons have an intolerance to gluten, a group of storage proteins found in wheat, rye and 25
barley. When a CD patient ingests gluten, an inflammatory response is triggered in the intestinal tract. This 26
inflammation can lead to atrophy of the mucosal villi and, as a consequence, to malabsorption and malnutrition. 27
The symptoms of CD vary between persons. Symptoms in a typical manifestation are mainly gastrointestinal, 28
whereas atypical manifestations have mostly extra-intestinal symptoms. Furthermore, CD can manifest 29
asymptomatic. In this case, the patient does not show symptoms other than villous atrophy or serological 30
changes. Especially in the asymptomatic cases, CD can remain undetected for a long period of time (Lionetti & 31

MANUSCRIP
T
ACCEPTED
ACCEPTED MANUSCRIPT
2
Catassi, 2011). A wrong interpretation of biopsy results can also lead to a delay in CD diagnosis (Marsh, 2013). 32
When left untreated, CD can lead to serious complications. In the worst case scenario, these can include 33
lymphomas and intestinal adenocarcinoma (Green & Cellier, 2007). Although multiple new therapies are 34
investigated, at this moment the only treatment is to adhere to a strict lifelong gluten-free diet. 35
In order to make safe food choices, CD patients rely heavily on the correct labelling of food products. 36
This is not an easy task for the patient. Gluten are often added to foodstuffs which are naturally gluten-free, in 37
order to improve product quality and stability (Day, Augustin, Batey, & Wrigley, 2006). Ingredients on the label 38
are sometimes difficult to interpret for gluten presence, since gluten can be hidden in names as, for instance, 39
‘flavourings’ or ‘hydrolysed vegetable protein’. A gluten-free label on a product makes finding the right 40
products for a gluten-free diet much easier. However, labels can be confusing too. Gluten-free labelling 41
legislations differ throughout the world and, as a result, the acceptable gluten content of a product labelled 42
gluten-free can differ per country. 43
According to the Dutch Celiac Disease Association (NCV), CD-related complaints are still often 44
reported by CD patients who have been following a gluten-free diet. Sometimes, the supposedly gluten-free 45
product is found to be contaminated with gluten above the legal threshold, but often the reason for these 46
complaints remains unknown as the products seem to comply with the current European legislation for gluten-47
free foods. The aim of this literature study is to investigate whether the currently applied gluten thresholds are 48
suitable to protect CD patients, or adjustments should be considered. 49
50
Literature selection 51
Systematic literature searches were performed in order to investigate the gluten content of foods and the amounts 52
of gluten tolerated by CD patients. The following databases were included: Medline, Cochrane Library and 53
Scopus. Studies had to be written in the English language to be included 54
Search terms for the gluten contents of food were “gluten traces” OR “gluten content” AND “gluten-55
free” AND “food”. Subsequently, the reference lists of the studies identified by the electronic databases were 56
searched to identify additional studies. Results were filtered to include only original research articles. Full 57
manuscripts were obtained for all potentially relevant articles. Studies had to be performed in the last 10 years to 58
be included. Studies that estimated instead of quantifying the gluten content of foods were excluded, as were 59
studies that did not specify if the tested products were intended for CD patients to use. Furthermore, studies that 60
only assessed the gluten content of raw materials such as flour were excluded, as for this study the gluten content 61
MANUSCRIP
T
ACCEPTED
ACCEPTED MANUSCRIPT
3
of final products is most relevant to determine exposure. Finally, studies assessing the gluten content of beer 62
were excluded. Beer contains mostly hydrolysed gluten, which are known to be overlooked by the most 63
commonly applied method to detect gluten in food; the sandwich format enzyme-linked immunosorbent assay 64
(ELISA). 65
Search terms for the tolerated amounts of gluten were “coeliac disease OR celiac disease” AND 66
“gluten” AND “threshold OR gluten challenge” NOT “in vitro”. Again, the reference lists of the studies 67
identified by the electronic databases were searched to identify additional studies. Results were filtered to only 68
include original research articles and case reports describing effects on humans. Full manuscripts were obtained 69
for all potentially relevant articles. Since only a limited amount of gluten threshold studies has been performed in 70
total, the time frame for including these studies was increased compared to the studies evaluating the gluten 71
content of food products. Studies had to be performed in the last 20 years to be included. Dietary recall studies 72
concerning wheat starch intake were included if they made at least an estimation of the gluten content of the 73
wheat starches. These dietary recall studies do not give an exact gluten content that CD patients are exposed to, 74
due to their retrospective set-up. However, they do give relevant information on a different approach to gluten 75
exposure; the effect of smaller doses of gluten spread over several meals per day, as compared to the effect of a 76
single, larger dose. Studies concerning gluten challenges given in combination with pharmacological treatment 77
were excluded. 78
The current applied legislations concerning gluten-free labelling of food products were retrieved for the 79
European Union, the United States of America, Canada and Australia and New Zealand. For this, the websites of 80
government authorities responsible for food standards and regulations were consulted. 81
82
Current thresholds for gluten-free labelling of food products 83
For the European Union, the United States of America and Canada, products with a gluten-free label cannot 84
contain more than 20 mg/kg (ppm) gluten. However, there are some differences in legislation between these 85
countries. In Europe, the definition of gluten-free products and the recommended limits of the Codex 86
Alimentarius standard 118-1979 were implemented in Commission Regulation 41/2009 in 2012 (The 87
Commission of the European Communities, 2009) and later the new Commission Regulation 1169/2011 in 88
December 2014 (The European Parliament and the Council of the European Union, 2011). Gluten is defined as 89
“the protein fraction from wheat, rye, barley, oats or their crossbred varieties and derivatives thereof, to which 90
some persons are intolerant and which is insoluble in water and 0.5 M sodium chloride solution”. According to 91

MANUSCRIP
T
ACCEPTED
ACCEPTED MANUSCRIPT
4
this legislation, in order to label a product gluten-free, the ingredients derived from gluten-containing cereals 92
must have been processed to reduce the gluten content or these ingredients must have been replaced by gluten-93
free cereals. There is a specific addition for the use of oats. Oats must have been specially produced and 94
processed in a way that avoids contamination by gluten-containing cereals and the maximum of 20 ppm gluten is 95
still valid. The US adopted a legislation on gluten and gluten-free products in 2013. According to this legislation 96
and contrary to the European legislation, the gluten-free label may also be applied to food that does not contain a 97
gluten-containing grain, including naturally gluten-free foods, as long as the gluten content of the final product 98
does not exceed 20 ppm (U.S. Food and Drug Administration, 2013). The Canadian legislation differs from both 99
the European and American legislation by stating that gluten-free products can not contain wheat, including spelt 100
and kamut, or oats, barley, rye, triticale, or any part thereof (Canadian Food and Drug Regulations, 2013). In this 101
case, the 20 ppm threshold is used to set a maximum level of allowed cross-contamination with gluten. 102
The gluten legislation of Australia and New Zealand is very different from the abovementioned 103
legislations and is considered to be most strict worldwide. Their definition of gluten is the main protein in wheat, 104
rye, barley, oats, triticale and spelt, relevant to the medical conditions CD and dermatitis herpetiformis (Australia 105
New Zealand Food Standards Code, 2011). A product can be labelled gluten-free if it contains no detectable 106
gluten. This means that the tolerable amount of gluten in these products is decreasing over time as the detection 107
methods become more sensitive. At this moment, the type I method R5 as recommended by Codex Alimentarius 108
has a limit of detection (LoD) of 3 ppm. 109
110
Other thresholds concerning the gluten content of food products 111
Apart from the thresholds that are used to define gluten-free, the European Union, Australia and New Zealand 112
have a second category for products that are low in gluten, yet exceed the threshold to be labelled gluten-free. In 113
the European Union, a product may be labelled ‘very low in gluten’ if the gluten-containing cereals have been 114
processed to reduce the gluten content, and the product does not contain more than 100 ppm gluten (The 115
European Parliament and the Council of the European Union, 2011). In Australia, products with a gluten content 116
that does not exceed 200 ppm may be labelled ‘low in gluten’ (Australia New Zealand Food Standards Code, 117
2011). 118
119
The differences between worldwide legislations imply that the same product can have different labels, depending 120
on the country it is brought on the market. A product with wheat as one of its ingredients that contains 10 ppm 121

MANUSCRIP
T
ACCEPTED
ACCEPTED MANUSCRIPT
5
gluten after processing could be labelled gluten-free in the US and in Europe, but not in Canada and Australia. A 122
naturally gluten-free food such as milk can be labelled gluten-free in the US, but not in Europe. In addition to 123
gluten-free labels, ‘low in gluten’, ‘very low in gluten’ and ‘may contain’ labels are used as well. For CD 124
patients, these different labels can be confusing as all that really matters to them is whether or not a product is 125
safe for them to eat. The gluten thresholds have been and still are under much debate. The bottom line is that 126
these labels should allow CD patients to make safe food choices. When looking at the legislations above, four 127
different thresholds can be distinguished: (a) No detectable gluten (which currently translates into < 3 ppm 128
gluten), (b) ≤ 20 ppm gluten, (c) ≤ 100 ppm gluten and (d) ≤ 200 ppm gluten. The remaining sections discuss 129
whether these thresholds are suitable to protect the CD patients, or adjustments should be considered. 130
131
Exposure 132
The gluten-free diet consists of a combination of naturally gluten-free foods such as fruits, vegetables, meat, fish, 133
eggs and dairy products with gluten-free substitutes for cereal-based foods such as bread and pasta. For most 134
naturally, non-processed gluten-free foods such as fruit and eggs, the chance of cross-contamination with gluten 135
is small. Cross-contamination of gluten-free cereals and, as a result, products made from these cereals is much 136
more common. Also naturally gluten-free foods that are processed, such as lunch meats, are often prone to cross-137
contamination if gluten-containing products are processed on the same locations. The total amount of gluten that 138
CD patients are exposed to depends on both the gluten contents of the products that they consume and the 139
amount of product consumed. 140
141
Gluten content of foods 142
Thompson and Grace evaluated the gluten content of 112 food products labelled gluten-free, using a R5 ELISA 143
(Thompson & Grace, 2013). Four products (i.e. bread, hot cereal, tortilla, cookie) contained 20 ppm gluten or 144
more, although the exact gluten contents above 20 ppm were not reported. Gibert et al used a R5 ELISA to 145
determine the gluten content of 205 commercially available products labelled gluten-free (Gibert, et al., 2013). 146
One pastry product contained more than 20 ppm gluten; namely 27.8 ppm. In 191 of the 205 products, no gluten 147
could be detected above the limit of quantification (LOQ) of 5 ppm. Agakidis et al determined the gluten content 148
of 41 processed food products that are on the safe lists of either the Greek National Food Intolerance Database, 149
the local Celiac Association, or both, chosen according to the preference of the patients (Agakidis, et al., 2011). 150
These products included flours, dairy products, cereals, pasta, sweets, processed meat, sausage, cakes and tomato 151

MANUSCRIP
T
ACCEPTED
ACCEPTED MANUSCRIPT
6
sauce. The analysis was performed with an ELISA targeted against ω-gliadin. Of these 41 products, 13 did not 152
contain any detectable gluten at all. Two dairy products and two flour products contained gluten ranging from 21 153
to 39 ppm. The gluten content of the remaining products was below 20 ppm. Catassi et al performed a 154
prospective trial to establish a safe gluten threshold and did a background analysis on the gluten-free products 155
consumed by the patients in their study (Catassi, et al., 2007). A total of 42 commercially available gluten-free 156
products, randomly chosen from the dietary assessment of the patients, was analysed with a R5 ELISA. The 157
gluten content of these products was found to range from < 3-50 ppm, with an average of 5.2 ppm. 158
Unfortunately, the exact number of products with a gluten content above 20 ppm is not given. Collin et al 159
compared the gluten content of 46 naturally gluten-free flours and 13 naturally gluten-free products with 17 160
wheat starch-based flours and 7 wheat starch-based products (Collin, Thorell, Kaukinen, & Mäki, 2004). 161
Analysis was performed with a R5 ELISA. In the naturally gluten-free group, 35 flours (76%) and 11 products 162
(85%) contained less than 20 ppm gluten. The remaining flours and products contained gluten in the 20-200 ppm 163
range. For the wheat starch-based group, 11 flours (65%) and 3 products (43%) contained less or equal than 20 164
ppm gluten. The remaining flours and products contained 30-150 ppm gluten. The results from these studies 165
show that in most cases, food products that are labelled gluten-free do not contain more than 20 ppm gluten and 166
many of them contain less than 3 ppm gluten. Wheat-starch based flours and foods exceed the threshold of 20 167
ppm gluten relatively more often. 168
169
Consumption 170
Gluten exposure for CD patients is not only dependent on the amount of gluten present in their foods, but also on 171
the amount of products consumed by these patients. Catassi et al kept records of the daily consumption of 172
commercially available gluten-free products consumed by the patients in their study (Catassi, et al., 2007). The 173
type of products were not specified, but the average daily consumption of the CD patients was 332 g (range 177-174
574). Collin et al estimated the use of gluten-free flours from 4-day food records of 76 adults and 16 children 175
with CD and found a daily median of 80 g (range 10-300) flour in adults and 60 g (range 20-140) in children 176
(Collin, et al., 2004). Gibert et al compared the gluten-free food consumption in Italy, Spain, Germany and 177
Norway (Gibert, et al., 2006). Gluten-free bread was the most consumed gluten-free product in all four countries 178
and together with pasta this made up to 64%, 56%, 71% and 71% of the total daily intake, respectively. Other 179
gluten-free substitute products that were consumed often included pastry, biscuits and breakfast cereals. The 180
total daily intake of gluten-free products at the 90th percentile of the studied population was 400-411 g/day in 181
MANUSCRIP
T
ACCEPTED
ACCEPTED MANUSCRIPT
7
Spain, Germany and Norway, and 531 g/day in Italy, the latter mainly due to a higher pasta consumption than in 182
the other included countries. 183
184
Tolerable levels 185
In order to set a proper threshold for gluten, the amount of gluten that is tolerated by CD patients needs to be 186
known. These exact amounts can differ per person, but in general three groups of CD patients with different 187
needs can be distinguished: the average CD population; the sensitive CD population; and the recovering CD 188
population. Table 1 gives an overview of the studies included in this paper. Specific information on the tolerable 189
levels of gluten intake derived from these studies is given in Table 2. 190
Depending on the study, the gluten contents were assessed differently. This influences the accuracy of 191
the reported amounts of gluten to which the patients were exposed. The studies performed by Chartrand et al, 192
Collin et al, Biagi et al and Greco et al have determined gluten content by ELISA, which is currently the most 193
applied detection method in food. Gluten ELISAs are sensitive enough to detect gluten in the mg/kg range. Both 194
studies performed by Catassi et al made use of a purified gluten standard. The studies performed by Kaukinen et 195
al and Lohiniemi et al calculated gluten content based on the amount of wheat starch consumed, assuming that 196
the gluten content of this wheat starch was the maximum amount allowed by European legislation. This method 197
is less accurate than detection with ELISA or using a gluten standard. Overestimation is likely, since not all 198
wheat starches will contain the maximum allowed amount of gluten. However, it is also possible that the wheat 199
flour in these studies contained more than the maximum allowed amount of gluten, which would lead to an 200
underestimation of the total gluten content. Troncone et al and Laurin et al calculated gluten content based on 201
food records. With this method, underestimation of the total amount of gluten is likely, as underreporting is a 202
known problem with collecting food records. Finally, the study performed by Srinivasan does not specifically 203
mention how the gluten content of their challenge was assessed. This means the reported amount of gluten could 204
be an estimation and could either be over- or underestimated. 205
206
Average CD population 207
Greco et al found that the 8 ppm gluten that remains in wheat flour after full hydrolysation, does not cause 208
mucosal atrophy or lead to clinical complaints in CD patients if they consume 200 g flour per day (Greco, et al., 209
2011). This is in agreement with the study performed by Catassi et al, who found that a consumption of 10 mg 210
gluten/day can be tolerated by most CD patients (Catassi, et al., 2007). In the same study, a dose of 50 mg 211
MANUSCRIP
T
ACCEPTED
ACCEPTED MANUSCRIPT
8
gluten/day was found to cause mucosal atrophy. Troncone et al saw a histological relapse in some patients who 212
were exposed to 60 mg gluten/day (Troncone, Mayer, Spagnuolo, Maiuri, & Greco, 1995). Studies examining 213
the effects of 200 mg gluten/day or more, all found that these amounts are harmful to CD patients (Catassi, et al., 214
1993; Greco, et al., 2011; Laurin, Wolving, & Fälth-Magnusson, 2002; Srinivasan, et al., 1996). Several groups 215
determined the gluten content of wheat starch, which is already used in the gluten-free diet of many patients. 216
Some wheat starch products contain up to 200 ppm gluten. An estimation of the gluten exposure for CD patients 217
using these products can be made by looking at the average and maximum intake. In three separate studies, the 218
average intake of gluten via these contaminated wheat starch products was below 50 mg/day (Collin, et al., 2004; 219
Kaukinen, et al., 1999; Lohiniemi, Mäki, Kaukinen, Laippala, & Collin, 2000). Although all three studies 220
reported some CD patients with histological changes, these changes could not be correlated to the amount of 221
wheat starch used. These results would suggest that the tolerable level of gluten for most CD patients lies 222
between 10-50 mg/day. 223
224
Sensitive CD population 225
For part of the CD population however, a gluten intake of 10 mg/day seems to be too much. In the study by 226
Catassi et al, one participant out of a group of fifteen receiving 10 mg gluten/day quit the study due to relapse 227
symptoms (Catassi, et al., 2007). In the study of Chartrand et al, 17 CD patients were exposed to 0.75-3.38 mg 228
gluten/day (Chartrand, Russo, Duhaime, & Seidman, 1997). Within 8 months, 11 (65%) patients experienced 229
clinical symptoms, including those who consumed 0.75 mg gluten/day. Apparently, some CD patients are very 230
sensitive to gluten, but it is currently unknown what part of the celiac population they represent. Gluten 231
challenge studies trying to establish a gluten threshold might be biased, as sensitive CD patients are probably 232
less likely to accept exposure to gluten. Furthermore, they might drop out early as a result of relapse symptoms 233
or their values might be seen as outliers and are therefore not considered. This makes it difficult to establish a 234
threshold for this group, as available data is limited. According to the results of Chartrand, the tolerable level of 235
this group lies below 0.75 mg/day. 236
237
Recovering CD population 238
Recovering from previous gluten intake is a very different challenge as compared to remaining gluten-free. In 239
the study by Catassi et al, half of the 13 subjects being exposed to 10 mg gluten/day did not worsen their villous 240
height/crypt depth ratio, but also did not improve (Catassi, et al., 2007). Also, half of the subjects showed an 241
MANUSCRIP
T
ACCEPTED
ACCEPTED MANUSCRIPT
9
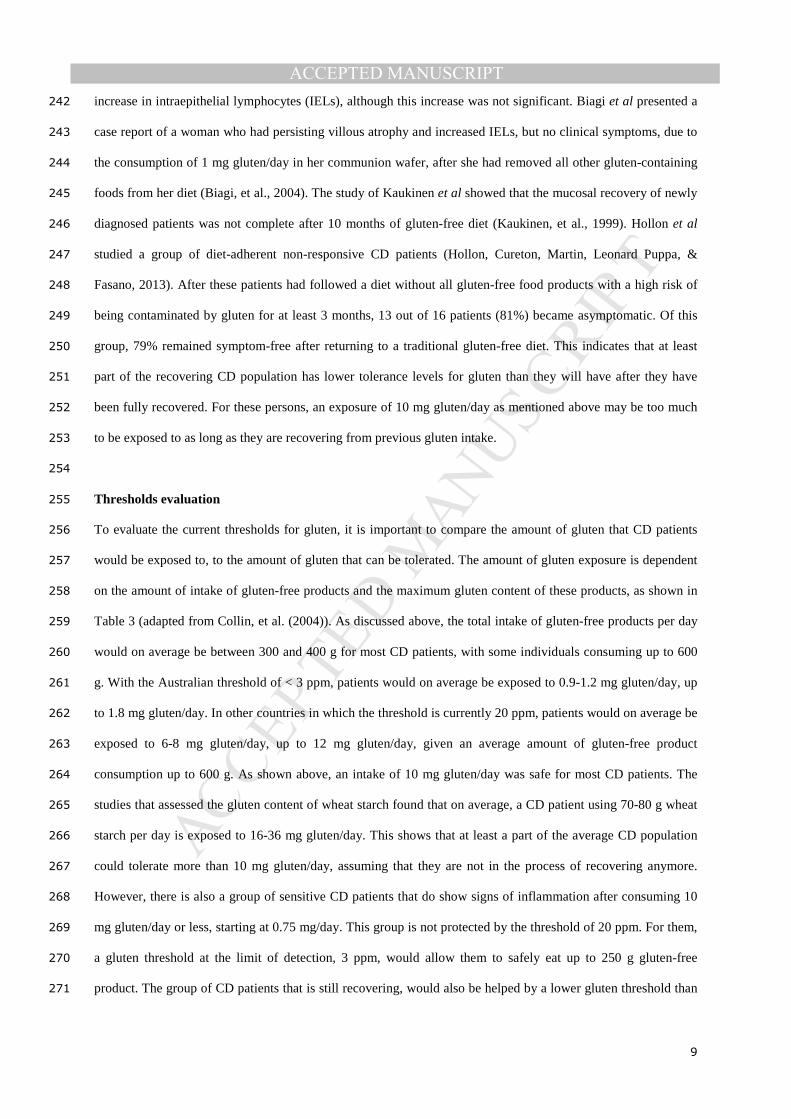
increase in intraepithelial lymphocytes (IELs), although this increase was not significant. Biagi et al presented a 242
case report of a woman who had persisting villous atrophy and increased IELs, but no clinical symptoms, due to 243
the consumption of 1 mg gluten/day in her communion wafer, after she had removed all other gluten-containing 244
foods from her diet (Biagi, et al., 2004). The study of Kaukinen et al showed that the mucosal recovery of newly 245
diagnosed patients was not complete after 10 months of gluten-free diet (Kaukinen, et al., 1999). Hollon et al 246
studied a group of diet-adherent non-responsive CD patients (Hollon, Cureton, Martin, Leonard Puppa, & 247
Fasano, 2013). After these patients had followed a diet without all gluten-free food products with a high risk of 248
being contaminated by gluten for at least 3 months, 13 out of 16 patients (81%) became asymptomatic. Of this 249
group, 79% remained symptom-free after returning to a traditional gluten-free diet. This indicates that at least 250
part of the recovering CD population has lower tolerance levels for gluten than they will have after they have 251
been fully recovered. For these persons, an exposure of 10 mg gluten/day as mentioned above may be too much 252
to be exposed to as long as they are recovering from previous gluten intake. 253
254
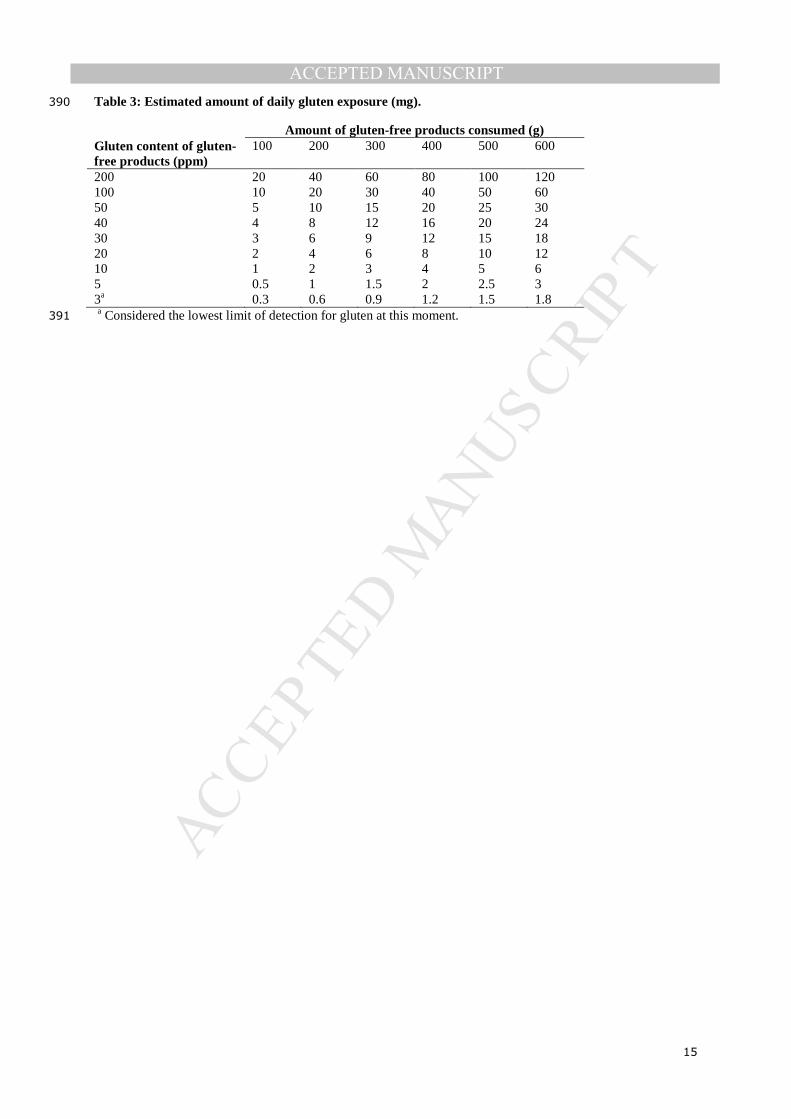
Thresholds evaluation 255
To evaluate the current thresholds for gluten, it is important to compare the amount of gluten that CD patients 256
would be exposed to, to the amount of gluten that can be tolerated. The amount of gluten exposure is dependent 257
on the amount of intake of gluten-free products and the maximum gluten content of these products, as shown in 258
Table 3 (adapted from Collin, et al. (2004)). As discussed above, the total intake of gluten-free products per day 259
would on average be between 300 and 400 g for most CD patients, with some individuals consuming up to 600 260
g. With the Australian threshold of < 3 ppm, patients would on average be exposed to 0.9-1.2 mg gluten/day, up 261
to 1.8 mg gluten/day. In other countries in which the threshold is currently 20 ppm, patients would on average be 262
exposed to 6-8 mg gluten/day, up to 12 mg gluten/day, given an average amount of gluten-free product 263
consumption up to 600 g. As shown above, an intake of 10 mg gluten/day was safe for most CD patients. The 264
studies that assessed the gluten content of wheat starch found that on average, a CD patient using 70-80 g wheat 265
starch per day is exposed to 16-36 mg gluten/day. This shows that at least a part of the average CD population 266
could tolerate more than 10 mg gluten/day, assuming that they are not in the process of recovering anymore. 267
However, there is also a group of sensitive CD patients that do show signs of inflammation after consuming 10 268
mg gluten/day or less, starting at 0.75 mg/day. This group is not protected by the threshold of 20 ppm. For them, 269
a gluten threshold at the limit of detection, 3 ppm, would allow them to safely eat up to 250 g gluten-free 270
product. The group of CD patients that is still recovering, would also be helped by a lower gluten threshold than 271

MANUSCRIP
T
ACCEPTED
ACCEPTED MANUSCRIPT
10
20 ppm. Therefore, for this group a gluten threshold of 3 ppm would also be more suitable. Once full recovery 272
has been achieved, most of these patients will be able to consume the same kind and amount of products as the 273
average CD population. 274
‘Very low in gluten’ products can contain up to 100 ppm gluten, which implies that CD patients with a 275
total product consumption of 300-400 g/day would be exposed to 30-40 mg gluten/day. Patients with a high 276
product intake would be exposed to 60 mg/day. No data is available for the 30-50 mg/day range, but intake of 50 277
mg gluten/day caused villous atrophy in the majority of CD patients (Catassi, et al., 2007). Therefore, patients 278
with a high consumption of ‘very low in gluten’ products would be exposed to unsafe amounts of gluten. 279
Patients consuming products ‘low in gluten’ would be exposed to even higher amounts of gluten, as the 280
thresholds for these products is 200 ppm gluten. In that case, patients with an average product intake of 300-400 281
g/day would be exposed to 60-80 mg gluten/day, up to 120 mg/day for patients daily consuming up to 600 g 282
products. This is more than twice the amount known to cause villous atrophy. These results show that the current 283
thresholds of both the ‘very low in gluten’ and ‘low in gluten’ products are too high for CD patients to safely 284
consume these products. The ‘low in gluten’ label is irrelevant and harmful for CD patients when misinterpreted 285
and should, therefore, be withdrawn. To make the ‘very low in gluten’ label meaningful again, it should be based 286
on gluten content that is safe for CD patients to consume after the mucosa has been recovered from previous 287
gluten intake. Unfortunately, very little literature on tolerable doses of gluten is available, especially in the range 288
10-50 mg gluten/day. When looking at the average gluten concentrations in wheat starch products that are 289
tolerated by CD patients, exposure up to 36 mg gluten/day might still be well tolerated. By halving the threshold 290
for ‘very low in gluten’ products to 50 ppm, CD patients with an average product intake would be exposed to 15-291
20 mg gluten/day, well below the average gluten exposure from wheat starch. Even CD patients consuming up to 292
600 g ‘very low in gluten’ products per day would not exceed 30 mg gluten/day. More randomized, placebo-293
controlled trials, such as performed by Catassi, et al. (2007), are needed to come up with a safe threshold for 294
‘very low in gluten’ products. 295
296
Conclusions and recommendations 297
With the current legislations in place, a product can be labelled gluten-free in the European Union, the United 298
States of America and Canada if the gluten content does not exceed 20 ppm gluten. In Australia and New 299
Zealand, this label is only given if gluten cannot be detected in the product, which – with our current detection 300
methods – implies a threshold of 3 ppm gluten. When looking at the average gluten-free product intake of CD 301

MANUSCRIP
T
ACCEPTED
ACCEPTED MANUSCRIPT
11
patients, these thresholds are safe for a large part of the celiac population. However, the 20 ppm threshold does 302
not protect the sensitive and recovering patients. These patients are exposed to amounts of gluten that can 303
prevent mucosal recovery, cause relapse of symptoms and progress the disease. Thus, patients that are most 304
reliant on gluten-free labelling are still at risk when consuming products that are labelled gluten-free. Especially 305
for this group, the gluten-free label for products containing up to 20 ppm gluten is misleading. If 3 ppm were to 306
be set as the threshold for foods to carry the gluten-free label, like Australia and New Zealand do, this would 307
allow the vulnerable and recovering group to consume up to 250 g/day gluten-free products in a safe manner. 308
Furthermore, the label would no longer be deceptive, as gluten-free would then really implicate ‘free of gluten’, 309
at least as far as can be detected. 310
Currently, in Europe, products with a gluten content of 20-100 ppm can be labelled ‘very low in gluten’ 311
and Australia allows products that contain less than 200 ppm gluten to be labelled ‘low in gluten’. It is 312
questionable what purpose the ‘very low in gluten’ and ‘low in gluten’ labels serve, as they hold little to no value 313
for CD patients. The majority of CD patients can, after mucosal recovery, tolerate a small daily amount of 314
gluten. Therefore, an extra threshold apart from the 3 ppm for gluten-free products would be very useful and this 315
could give the ‘very low in gluten’ label meaning again. More research on disease-eliciting doses of gluten is 316
needed, especially in the 10-50 mg gluten/day range, in order to come up with a safe threshold for ‘very low in 317
gluten’ products. 318
By setting the gluten-free threshold to 3 ppm and the ‘very low in gluten’ threshold to a value relevant 319
for CD patients worldwide, these labels will be informative and safe for all CD patients again. 320
321
Acknowledgements 322
This study was financed by the Netherlands Food and Consumer Product Safety Authority (NVWA). The 323
financer had no involvement in the study design; in the collection, analysis and interpretation of data; in writing 324
the report; or in the decision to submit the article for publication. 325
MANUSCRIP
T
ACCEPTED
ACCEPTED MANUSCRIPT
12
References 326
327
Agakidis, C., Karagiozoglou-Lampoudi, T., Kalaitsidou, M., Papadopoulos, T., Savvidou, A., Daskalou, E., & 328 Dimitrios, T. (2011). Enzyme-linked immunosorbent assay gliadin assessment in processed food 329 products available for persons with celiac disease: a feasibility study for developing a gluten-free food 330 database. Nutr Clin Pract, 26, 695-699. 331
Australia New Zealand Food Standards Code. (2011). Standard 1.2.8 Nutrition Information Requirements. In. 332 Biagi, F., Campanella, J., Martucci, S., Pezzimenti, D., Ciclitira, P. J., Ellis, H. J., & Corazza, G. R. (2004). A 333
milligram of gluten a day keeps the mucosal recovery away: a case report. Nutr Rev, 62, 360-363. 334 Canadian Food and Drug Regulations. (2013). B.24.018. In. 335 Catassi, C., Fabiani, E., Iacono, G., D'Agate, C., Francavilla, R., Biagi, F., Volta, U., Accomando, S., Picarelli, A., 336
De Vitis, I., Pianelli, G., Gesuita, R., Carle, F., Mandolesi, A., Bearzi, I., & Fasano, A. (2007). A 337 prospective, double-blind, placebo-controlled trial to establish a safe gluten threshold for patients with 338 celiac disease. Am J Clin Nutr, 85, 160-166. 339
Catassi, C., Rossini, M., Rätsch, I. M., Bearzi, I., Santinelli, A., Castagnani, R., Pisani, E., Coppa, G. V., & 340 Giorgi, P. L. (1993). Dose dependent effects of protracted ingestion of small amounts of gliadin in 341 coeliac disease children: a clinical and jejunal morphometric study. Gut, 34, 1515-1519. 342
Chartrand, L. J., Russo, P. A., Duhaime, A. G., & Seidman, E. G. (1997). Wheat starch intolerance in patients 343 with celiac disease. J Am Diet Assoc, 97, 612-618. 344
Collin, P., Thorell, L., Kaukinen, K., & Mäki, M. (2004). The safe threshold for gluten contamination in gluten-345 free products. Can trace amounts be accepted in the treatment of coeliac disease? Aliment Pharmacol 346 Ther, 19, 1277-1283. 347
Day, L., Augustin, M. A., Batey, I. L., & Wrigley, C. W. (2006). Wheat-gluten uses and industry needs. Trends 348 Food Sci Tech, 17, 82-90. 349
Gibert, A., Espadaler, M., Canela, M. A., Sánchez, A., Vaqué, C., & Rafecas, M. (2006). Consumption of gluten-350 free products: should the threshold value for trace amounts of gluten be at 20, 100 or 200 p.p.m.? Eur 351 J Gastroen Hepat, 18, 1187-1195. 352
Gibert, A., Kruizinga, A. G., Neuhold, S., Houben, G. F., Canela, M. A., Fasano, A., & Catassi, C. (2013). Might 353 gluten traces in wheat substitutes pose a risk in patients with celiac disease? A population-based 354 probabilistic approach to risk estimation. Am J Clin Nutr, 97, 109-116. 355
Greco, L., Gobbetti, M., Auricchio, R., Di Mase, R., Landolfo, F., Paparo, F., Di Cagno, R., De Angelis, M., 356 Rizello, C. G., Cassone, A., Terrone, G., Timpone, L., D'Aniello, M., Maglio, M., Troncone, R., & 357 Auricchio, S. (2011). Safety for patients with celiac disease of baked goods made of wheat flour 358 hydrolyzed during food processing. Clin Gastroenterol H, 9, 24-29. 359
Green, P. H. R., & Cellier, C. (2007). Celiac disease. N Engl J Med., 357, 1731-1743. 360 Hollon, J. R., Cureton, P. A., Martin, M. L., Leonard Puppa, E. L., & Fasano, A. (2013). Trace gluten 361
contamination may play a role in mucosal and clinical recovery in a subgroup of diet-adherent non-362 responsive celiac disease patients. BMC Gastroenterology, 13. 363
Kaukinen, K., Collin, P., Holm, K., Rantala, I., Vuolteenaho, T., & Mäki, M. (1999). Wheat starch-containing 364 gluten-free flour products in the treatment of coeliac disease and dermatitis herpetiformis. Scand J 365 Gastroenterol, 34, 163-169. 366
Laurin, P., Wolving, M., & Fälth-Magnusson, K. (2002). Even small amounts of gluten cause relapse in children 367 with celiac disease. J Pediatr Gastroenterol Nutr, 34, 26-30. 368
Lionetti, E., & Catassi, C. (2011). New clues in celiac disease epidemiology, pathogenesis, clinical 369 manifestations, and treatment. Int Rev Immunol., 30, 219-231. 370
Lohiniemi, S., Mäki, M., Kaukinen, K., Laippala, P., & Collin, P. (2000). Gastrointestinal symptoms rating scale 371 in coeliac disease patients on wheat starch-based gluten-free diets. Scand J Gastroenterol, 35, 947-372 949. 373
Marsh, M. N. (2013). Defining 'coeliac': Oslo Accord - or not? Gut, 62, 1669-1670. 374 Reilly, N. R., & Green, P. H. R. (2012). Epidemiology and clinical presentations of celiac disease. Semin 375
Immunopathol, 34, 473-478. 376 Srinivasan, U., Leonard, N., Jones, E., Kasarda, D. D., Weir, D. G., O'Farrelly, C., & Feighery, C. (1996). 377
Absence of oats toxicity in adult coeliac disease. Brit Med J, 313. 378 The Commission of the European Communities. (2009). Commission Regulation (EC) No 41/2009. In. 379 The European Parliament and the Council of the European Union. (2011). Regulation (EU) No 1169/2011. In. 380 Thompson, T., & Grace, T. (2013). Gluten content of selected labeled gluten-free foods sold in the US. Pract 381
Gastroenterol, 37, 10-16. 382 Troncone, R., Mayer, C., Spagnuolo, F., Maiuri, L., & Greco, L. (1995). Endomysial antibodies as unreliable 383
markers for slight dietary transgressions in adolescents with celiac disease. J Pediatr Gastroenterol 384 Nutr, 21, 69-72. 385
386
MANUSCRIP
T
ACCEPTED
ACCEPTED MANUSCRIPT
13
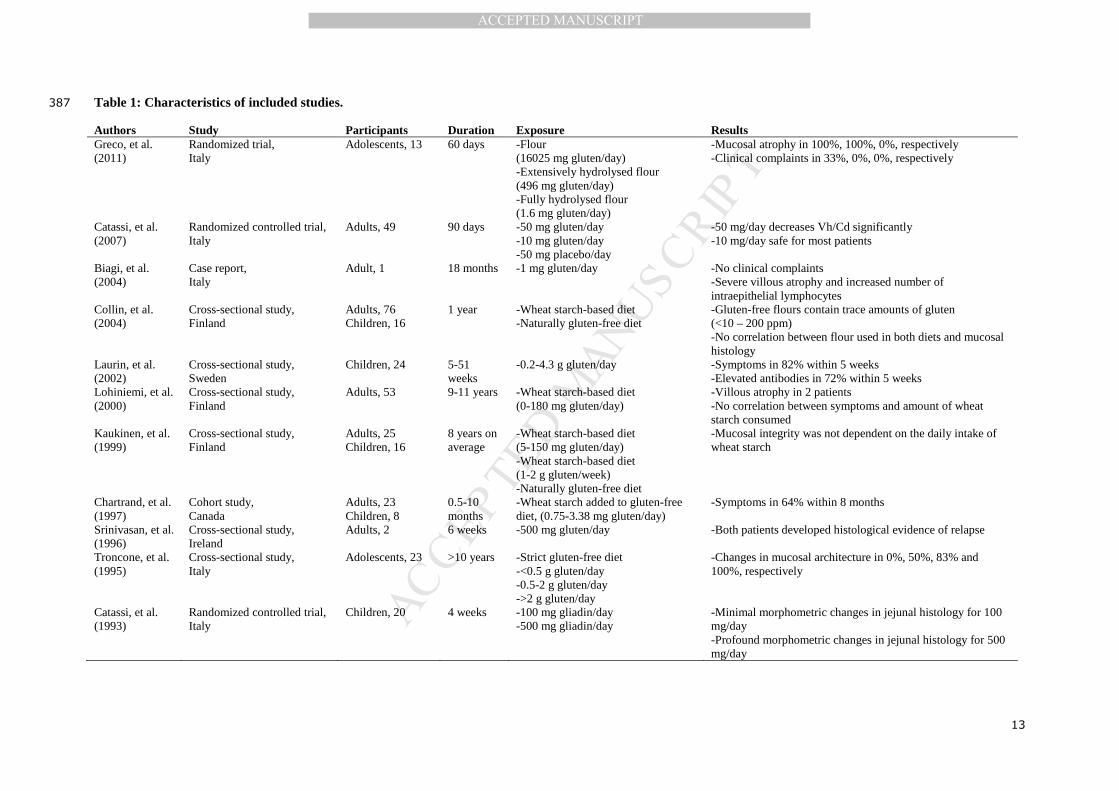
Table 1: Characteristics of included studies. 387
Authors Study Participants Duration Exposure Results Greco, et al. (2011)
Randomized trial, Italy
Adolescents, 13
60 days -Flour (16025 mg gluten/day) -Extensively hydrolysed flour (496 mg gluten/day) -Fully hydrolysed flour (1.6 mg gluten/day)
-Mucosal atrophy in 100%, 100%, 0%, respectively -Clinical complaints in 33%, 0%, 0%, respectively
Catassi, et al. (2007)
Randomized controlled trial, Italy
Adults, 49
90 days -50 mg gluten/day -10 mg gluten/day -50 mg placebo/day
-50 mg/day decreases Vh/Cd significantly -10 mg/day safe for most patients
Biagi, et al. (2004)
Case report, Italy
Adult, 1 18 months -1 mg gluten/day -No clinical complaints -Severe villous atrophy and increased number of intraepithelial lymphocytes
Collin, et al. (2004)
Cross-sectional study, Finland
Adults, 76 Children, 16
1 year -Wheat starch-based diet -Naturally gluten-free diet
-Gluten-free flours contain trace amounts of gluten (<10 – 200 ppm) -No correlation between flour used in both diets and mucosal histology
Laurin, et al. (2002)
Cross-sectional study, Sweden
Children, 24 5-51 weeks
-0.2-4.3 g gluten/day -Symptoms in 82% within 5 weeks -Elevated antibodies in 72% within 5 weeks
Lohiniemi, et al. (2000)
Cross-sectional study, Finland
Adults, 53 9-11 years -Wheat starch-based diet (0-180 mg gluten/day)
-Villous atrophy in 2 patients -No correlation between symptoms and amount of wheat starch consumed
Kaukinen, et al. (1999)
Cross-sectional study, Finland
Adults, 25 Children, 16
8 years on average
-Wheat starch-based diet (5-150 mg gluten/day) -Wheat starch-based diet (1-2 g gluten/week) -Naturally gluten-free diet
-Mucosal integrity was not dependent on the daily intake of wheat starch
Chartrand, et al. (1997)
Cohort study, Canada
Adults, 23 Children, 8
0.5-10 months
-Wheat starch added to gluten-free diet, (0.75-3.38 mg gluten/day)
-Symptoms in 64% within 8 months
Srinivasan, et al. (1996)
Cross-sectional study, Ireland
Adults, 2 6 weeks -500 mg gluten/day -Both patients developed histological evidence of relapse
Troncone, et al. (1995)
Cross-sectional study, Italy
Adolescents, 23 >10 years -Strict gluten-free diet -<0.5 g gluten/day -0.5-2 g gluten/day ->2 g gluten/day
-Changes in mucosal architecture in 0%, 50%, 83% and 100%, respectively
Catassi, et al. (1993)
Randomized controlled trial, Italy
Children, 20 4 weeks -100 mg gliadin/day -500 mg gliadin/day
-Minimal morphometric changes in jejunal histology for 100 mg/day -Profound morphometric changes in jejunal histology for 500 mg/day

MANUSCRIP
T
ACCEPTED
ACCEPTED MANUSCRIPT
14
Table 2: Tolerable levels of gluten intake. 388
Study Outcome Greco, et al. (2011) -496 mg gluten/day results in mucosal atrophy
-1.6 mg gluten/day is safe Catassi, et al. (2007) -50 mg gluten/day results in mucosal atrophy
-10 mg gluten/day is safe for most CD patients Biagi, et al. (2004) -1 mg gluten/day leads to persisting villous atrophy Collin, et al. (2004) -in the worst case scenario, CD patients are already exposed up to 60 mg gluten/day
-on average, CD patients are already exposed up to 16 mg gluten/day Laurin, et al. (2002) -200 mg gluten/day results in CD symptoms Lohiniemi, et al. (2000) -in the worst case scenario, CD patients are already exposed to 180 mg gluten/day
-on average, CD patients are already exposed to 36 mg gluten/day Kaukinen, et al. (1999) -in the worst case scenario, CD patients are already exposed to 150 mg gluten/day
-on average, CD patients are already exposed to 34 mg gluten/day Chartrand, et al. (1997) -0.75 mg gluten/day results in CD symptoms Srinivasan, et al. (1996) -500 mg gluten/day results in histological relapse Troncone, et al. (1995) -60 mg gluten/day results in histological relapse in some Catassi, et al. (1993) -200 mg gluten/day results in histological relapse
389
MANUSCRIP
T
ACCEPTED
ACCEPTED MANUSCRIPT
15
Table 3: Estimated amount of daily gluten exposure (mg). 390
Amount of gluten-free products consumed (g) Gluten content of gluten-free products (ppm)
100 200 300 400 500 600
200 20 40 60 80 100 120 100 10 20 30 40 50 60 50 5 10 15 20 25 30 40 4 8 12 16 20 24 30 3 6 9 12 15 18 20 2 4 6 8 10 12 10 1 2 3 4 5 6 5 0.5 1 1.5 2 2.5 3 3a 0.3 0.6 0.9 1.2 1.5 1.8 a Considered the lowest limit of detection for gluten at this moment. 391
MANUSCRIP
T
ACCEPTED
ACCEPTED MANUSCRIPTHighlights
• The threshold of 20 ppm does not protect sensitive and recovering celiac patients.
• A threshold of 3 ppm would be more suitable to protect these vulnerable groups.
• Labels “low in gluten” and “very low in gluten” hold no value for celiac patients.


