Part IV / Chapter 11 /11.1 Agricultural policies from ... · cates a net subsidy. Agricultural...
46
265 Part IV / Chapter 11 / 11.1 Agricultural policies from independence through the mid-1980s: A state-led development approach Chapter 11 This chapter analyses the evolution of Agricultural development policies in West Africa over the past 50 years, both at the national and the regional levels. It first briefly examines the early post-independence strategies designed primarily to extract resources from agriculture to finance growth in other sectors of the economy. Next, the chapter analyses the reasons why, partly as a consequence of the shortcomings of these strategies, West African governments were forced to adopt structural adjustment programmes (SAPs); it also examines the impacts of those programmes on Agriculture. Beginning in the early 2000s, as countries began to emerge from the SAPs, African governments and their development partners “rediscovered” the importance of Agricultural development, and the chapter discusses how this rediscovery led to the CAADP process and support for programmes through WAEMU and ECOWAS to promote greater regional agricultural integration in West Africa. The bulk of the chapter then examines the strengths and weaknesses of the national and regional policies and investment plans that emerged from the ECOWAS-led CAADP programme in West Africa, known as ECOWAP/CAADP. The focus of this chapter is primarily on Agricultural investment and market development strategies, while Chapter 12 focuses on trade policy. e chapter seeks to answer the following questions: 1. How has the Agricultural policy environment in West Africa changed over the past 50 years in terms of content and process and what were the key drivers of those changes? 2. How effective were these different policy ap- proaches in achieving their stated objectives? 3. How well do recent policies, as embodied in CAADP, respond to the structural challenges facing West Africa’s agrifood system described earlier in this study? Finally, the chapter turns to the vital question of programme implementation, identifying key challenges in moving the national and regional CAADP programmes from design to reality. 11.1 Agricultural policies from independence through the mid-1980s: A state-led development approach 11.1.1 Main elements of the approach In the period immediately after independence, the main concern of most West African govern- ments was to achieve rapid progress in industri- alization through import substitution. Agriculture was regarded as provider of cheap food, foreign exchange and labour to fuel growth in the non- agricultural sectors, and policies were designed to extract resources to contribute to non-agricultural growth. Agricultural policies in the immediate post-independence era were also conditioned by a small urban population, which made consumer subsidies fiscally manageable, and relatively abun- dant land that allowed growth of agricultural out- put by simply expanding the area under cultiva- tion using existing technologies. In the CFA franc countries, a third factor influencing agricultural policies was the need to hold down government budget deficits to meet conditions imposed by the French treasury for guaranteeing the parity of the currency with the French franc. Since wages of National and Regional Agricultural Policies: Evolution and Current Challenges
Transcript of Part IV / Chapter 11 /11.1 Agricultural policies from ... · cates a net subsidy. Agricultural...

265
Part IV / Chapter 11 / 11.1 Agricultural policies from independence through the mid-1980s: A state-led development approach
Chapter 11
This chapter analyses the evolution of Agricultural development policies in West Africa over the past 50 years, both at the national and the regional levels. It first briefly examines the early post-independence strategies designed primarily to extract resources from agriculture to finance growth in other sectors of the economy. Next, the chapter analyses the reasons why, partly as a consequence of the shortcomings of these strategies, West African governments were forced to adopt structural adjustment programmes (SAPs); it also examines the impacts of those programmes on Agriculture. Beginning in the early 2000s, as countries began to emerge from the SAPs, African governments and their development partners “rediscovered” the importance of Agricultural development, and the chapter discusses how this rediscovery led to the CAADP process and support for programmes through WAEMU and ECOWAS to promote greater regional agricultural integration in West Africa. The bulk of the chapter then examines the strengths and weaknesses of the national and regional policies and investment plans that emerged from the ECOWAS-led CAADP programme in West Africa, known as ECOWAP/CAADP. The focus of this chapter is primarily on Agricultural investment and market development strategies, while Chapter 12 focuses on trade policy.
The chapter seeks to answer the following questions:
1. How has the Agricultural policy environment in West Africa changed over the past 50 years in terms of content and process and what were the key drivers of those changes?
2. How effective were these different policy ap-proaches in achieving their stated objectives?
3. How well do recent policies, as embodied in CAADP, respond to the structural challenges facing West Africa’s agrifood system described earlier in this study?
Finally, the chapter turns to the vital question of programme implementation, identifying key challenges in moving the national and regional CAADP programmes from design to reality.
11.1 Agricultural policies from independence through the mid-1980s: A state-led development approach
11.1.1 Main elements of the approach
In the period immediately after independence, the main concern of most West African govern-ments was to achieve rapid progress in industri-alization through import substitution. Agriculture was regarded as provider of cheap food, foreign exchange and labour to fuel growth in the non-agricultural sectors, and policies were designed to extract resources to contribute to non-agricultural growth. Agricultural policies in the immediate post-independence era were also conditioned by a small urban population, which made consumer subsidies fiscally manageable, and relatively abun-dant land that allowed growth of agricultural out-put by simply expanding the area under cultiva-tion using existing technologies. In the CFA franc countries, a third factor influencing agricultural policies was the need to hold down government budget deficits to meet conditions imposed by the French treasury for guaranteeing the parity of the currency with the French franc. Since wages of
National and Regional Agricultural Policies: Evolution and Current Challenges

266
Part IV / Chapter 11 / 11.1 Agricultural policies from independence through the mid-1980s: A state-led development approach
government employees were a major component of the budget, this constraint meant holding down wages, which in turn led to pressures to hold down urban food prices.
In the context of one-party states that prevailed in most countries, policies were developed by central governments, with little input from farmer groups or the private sector. There were certainly excep-tions to this generalization, such as Côte d’Ivoire’s policies to promote cocoa and cocoa development, which reflected President Houphouet-Boigny’s political base among the middle- and large-scale producers of these crops, and agricultural policies in Liberia, where foreign-owned rubber companies had a strong influence in the “Firestone Republic.” Despite the creation of ECOWAS in 1972, each country defined its policies largely independently of its neighbours.
Agricultural marketing policies in many coun-tries were driven by a general perception that markets for agricultural inputs and outputs were volatile, unreliable, and characterized by uneven bargaining power between farmers and traders, leading to exploitation of both farmers and con-sumers. Governments therefore frequently tried to supplant private marketing agents with state structures, such as marketing boards, often with legal monopolies. Again, West Africa was not monolithic in its approach, as epitomized by the contrast between the approaches taken soon after independence by Côte d’Ivoire, which was much more open to foreign (primarily French) and do-mestic private investment, and the more state-dominated approach of Ghana under Kwame Nkrumah.
Government views about existing agricultural marketing systems often had some basis in fact, as frequently markets operated in a context of weak transport and communication infrastructure, leading to poor market integration; information asymmetries that led to missing markets (particu-larly for inputs and credit) and uneven bargain-ing power; and strong seasonal and year-to-year price fluctuations characteristic of thin markets. The government-created marketing structures of-ten tried to address these problems by purchasing
produce at fixed, pan-territorial prices, attempting to stabilize consumer prices through public stor-age, and providing subsidised inputs and support services. Marketing boards and agricultural devel-opment banks played important roles in providing inputs and finance and in assuming marketing risks. They principally supported cash crops but also supported some food crops, particularly in government-supported irrigation zones, such as the Senegal River valley and Mali’s Office du Niger. In West Africa, however, the degree of state control over staple-crop marketing never reached the levels experienced in the Southern and Eastern African countries that had large-scale European settler farms and whom the state marketing systems were designed to protect.
11.1.2 Impacts of the approach
The impacts of these policies were reflected in:
》》 Declining farm-level prices, especially for cash crops but sometimes for food crops as well. These lower prices reduced incentives to produce and led to a flow of resources out of agriculture to finance non-agricultural sectors, including government services and import-substituting industrialization;
》》 Growth in illegal cross-border trade in the region;
》》 Lagging agricultural growth rates and falling per capita incomes; and
》》 Shortages of foreign exchange and fiscal deficits.
》》 Reduction in agricultural incentives and in-creased intersectoral transfer of resources.
The transfer of resources out of agriculture to other sectors of the economy was achieved by turn-ing the terms of trade against agriculture. This im-plicit taxation of agriculture was achieved through low official producer prices for many commodities (especially export crops) relative to world prices. In part, the low prices farmers received resulted from highly overvalued exchange rates. Farm-level prices were further depressed by the inefficiency of

267
Part IV / Chapter 11 / 11.1 Agricultural policies from independence through the mid-1980s: A state-led development approach
some of the parastatals, which, lacking a market mechanism to discipline their behaviour, frequent-ly experienced bloated operating costs. Although West African governments and donors promoted agricultural growth during this period through state-led schemes and projects, these often faltered due the depressed farm-level prices that undercut farmers’ incentives to produce.
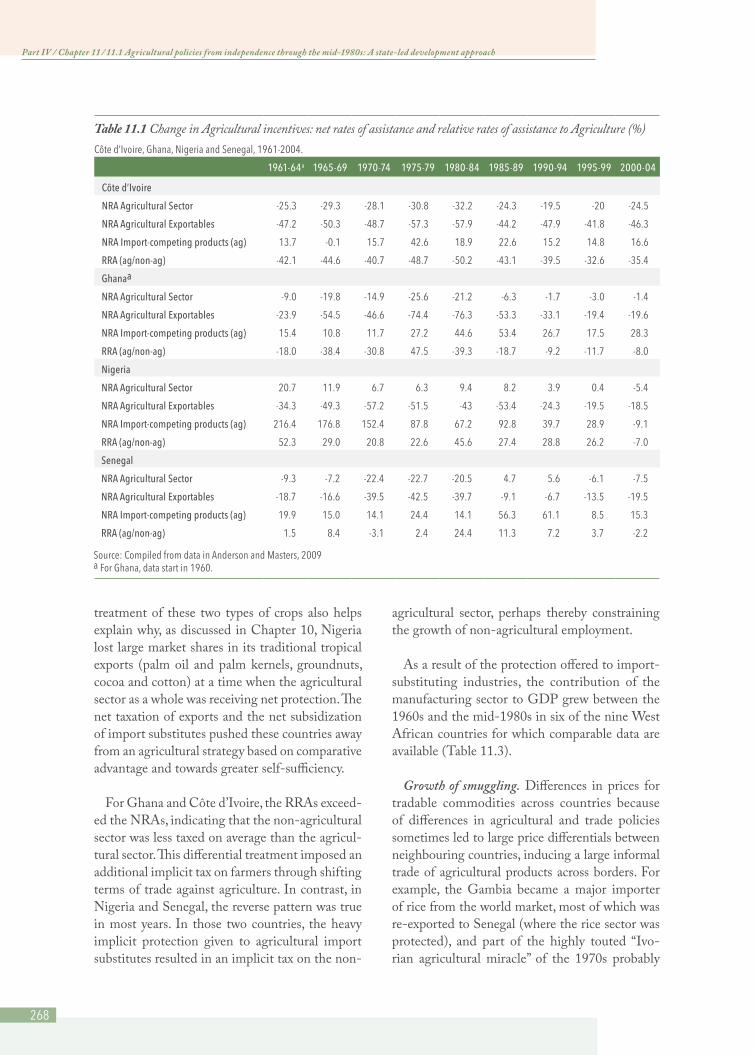
Studies of policy-induced impacts on agricultural incentives in Côte d’Ivoire, Ghana, Nigeria, and Senegal and more focused studies of such incentives on the cotton sector in Benin, Burkina Faso, Mali and Togo reveal that implicit taxation of the agri-cultural exports increased sharply in most of these countries from independence in the 1960s through the early 1980s (Anderson and Masters, 2009). Two key indicators used in these studies to measure the change in agricultural incentives are the Nomi-nal Rate of Assistance (NRA) and the Relative Rate of Assistance (RRA). The NRA measures the percentage by which government policies (in-cluding, among others, those affecting exchange rates, marketing board pricing, export taxes, input subsidies, and taxes on competing imports) changed the gross returns to farmers relative to what they would have been in the absence of those policies. An NRA of less than zero signifies net taxation of the agricultural sector, while a positive NRA indi-cates a net subsidy. Agricultural producers, however, are affected not only by the rate of taxation or subsidy on the products they produce but also by the rate of taxation or subsidy on non-agricultural products that they buy. The RRA measures the relative degree of protection given to agriculture versus non-agriculture in the economy and hence is a measure of the intersectoral terms of trade fac-ing farmers (and thus the extraction of resources from agriculture to other sectors). An RRA that is greater than zero signifies that agriculture receives net protection once the NRA for agriculture has been adjusted for the taxation or subsidy facing the non-agricultural sector; a negative RRA represents net taxation once the intersectoral terms of trade are also taken into account.
Table 11.1 and Table 11.2 summarise infor-mation on the evolution of net taxation rates on agriculture for several West African countries from
the 1960s through 2004. For Côte d’Ivoire, Ghana, Nigeria and Senegal (Table 11.1), the analysis cov-ered all major agricultural products (those account-ing for at least 70% of agricultural GDP), while for Benin, Burkina Faso, Mali and Togo (Table 11.2) the analysis focused solely on the cotton sector.
Several key points emerge from the tables:
Overall rates of net taxation for the agricultural sector (Table 11.1) and for the cotton sector (Ta-ble 11.2) were high through 1984 for all countries except Nigeria, as countries used a range of policies to extract resources from the agricultural sector for use elsewhere in the economy. The extreme case was Côte d’Ivoire, where in 1975-79, policies imposed implicit and explicit taxation equivalent to US$1 072 per person engaged in farming. The four countries shown in Table 11.2 all produced cotton under a similar institutional arrangement (national companies holding monopoly purchas-ing rights and linked to the French multinational CFDT/Dagris), so it is not surprising that the net rates of implicit taxation on cotton producers were nearly identical across these countries until 2000, when the countries began, at different speeds, to reform their cotton sectors. From the 1970s through 1984, shortly before the countries began implementing structural adjustment programmes (SAPs), the gross rates of taxation of cotton pro-ducers, as indicated by the NRAs, were on the order of 50% to 60%.
The one exception to the apparent taxation of agriculture in the pre-SAP era among the countries shown in Table 11.1 was Nigeria, where the NRAs were positive, indicating net subsidies to farmers. The overall NRA for agriculture, however, obscures very different patterns of net taxation for export crops and import substitutes such as rice, sugar, poultry, and milk. All four countries, including Ni-geria, implicitly taxed their exportable agricultural products, in some cases at very heavy rates (up to 76% for Ghana during 1980-84). In contrast, the agricultural import substitutes received net subsi-dies. Indeed, it was the very high rates of protection of these products in Nigeria (e.g. through tariff policies and trade bans) that made Nigerian agri-culture as a whole appear subsidised. The differential
268
Part IV / Chapter 11 / 11.1 Agricultural policies from independence through the mid-1980s: A state-led development approach
treatment of these two types of crops also helps explain why, as discussed in Chapter 10, Nigeria lost large market shares in its traditional tropical exports (palm oil and palm kernels, groundnuts, cocoa and cotton) at a time when the agricultural sector as a whole was receiving net protection. The net taxation of exports and the net subsidization of import substitutes pushed these countries away from an agricultural strategy based on comparative advantage and towards greater self-sufficiency.
For Ghana and Côte d’Ivoire, the RRAs exceed-ed the NRAs, indicating that the non-agricultural sector was less taxed on average than the agricul-tural sector. This differential treatment imposed an additional implicit tax on farmers through shifting terms of trade against agriculture. In contrast, in Nigeria and Senegal, the reverse pattern was true in most years. In those two countries, the heavy implicit protection given to agricultural import substitutes resulted in an implicit tax on the non-
agricultural sector, perhaps thereby constraining the growth of non-agricultural employment.
As a result of the protection offered to import-substituting industries, the contribution of the manufacturing sector to GDP grew between the 1960s and the mid-1980s in six of the nine West African countries for which comparable data are available (Table 11.3).
Growth of smuggling. Differences in prices for tradable commodities across countries because of differences in agricultural and trade policies sometimes led to large price differentials between neighbouring countries, inducing a large informal trade of agricultural products across borders. For example, the Gambia became a major importer of rice from the world market, most of which was re-exported to Senegal (where the rice sector was protected), and part of the highly touted “Ivo-rian agricultural miracle” of the 1970s probably
Table 11.1 Change in Agricultural incentives: net rates of assistance and relative rates of assistance to Agriculture (%)Côted’Ivoire,Ghana,NigeriaandSenegal,1961-2004.
1961-64a 1965-69 1970-74 1975-79 1980-84 1985-89 1990-94 1995-99 2000-04
Côte d’Ivoire
NRA Agricultural Sector -25.3 -29.3 -28.1 -30.8 -32.2 -24.3 -19.5 -20 -24.5
NRA Agricultural Exportables -47.2 -50.3 -48.7 -57.3 -57.9 -44.2 -47.9 -41.8 -46.3
NRA Import-competing products (ag) 13.7 -0.1 15.7 42.6 18.9 22.6 15.2 14.8 16.6
RRA (ag/non-ag) -42.1 -44.6 -40.7 -48.7 -50.2 -43.1 -39.5 -32.6 -35.4
Ghanaa
NRA Agricultural Sector -9.0 -19.8 -14.9 -25.6 -21.2 -6.3 -1.7 -3.0 -1.4
NRA Agricultural Exportables -23.9 -54.5 -46.6 -74.4 -76.3 -53.3 -33.1 -19.4 -19.6
NRA Import-competing products (ag) 15.4 10.8 11.7 27.2 44.6 53.4 26.7 17.5 28.3
RRA (ag/non-ag) -18.0 -38.4 -30.8 47.5 -39.3 -18.7 -9.2 -11.7 -8.0
Nigeria
NRA Agricultural Sector 20.7 11.9 6.7 6.3 9.4 8.2 3.9 0.4 -5.4
NRA Agricultural Exportables -34.3 -49.3 -57.2 -51.5 -43 -53.4 -24.3 -19.5 -18.5
NRA Import-competing products (ag) 216.4 176.8 152.4 87.8 67.2 92.8 39.7 28.9 -9.1
RRA (ag/non-ag) 52.3 29.0 20.8 22.6 45.6 27.4 28.8 26.2 -7.0
Senegal
NRA Agricultural Sector -9.3 -7.2 -22.4 -22.7 -20.5 4.7 5.6 -6.1 -7.5
NRA Agricultural Exportables -18.7 -16.6 -39.5 -42.5 -39.7 -9.1 -6.7 -13.5 -19.5
NRA Import-competing products (ag) 19.9 15.0 14.1 24.4 14.1 56.3 61.1 8.5 15.3
RRA (ag/non-ag) 1.5 8.4 -3.1 2.4 24.4 11.3 7.2 3.7 -2.2
Source: Compiled from data in Anderson and Masters, 2009a For Ghana, data start in 1960.

269
Part IV / Chapter 11 / 11.1 Agricultural policies from independence through the mid-1980s: A state-led development approach
reflected inflows of agricultural products from neighbouring countries which subsequently were counted as Ivorian production.122 Very large in-formal flows of agricultural products, inputs, and manufactured products developed between Nige-ria and its neighbours. While such trade did allow some exploitation of comparative advantage across countries and capturing of limited regional scale economies, in the absence of explicit policies to do so, because it was illegal, the trade involved high transaction costs and fostered corruption of customs and police officials.
122 Kamuanga, 1982, documents how the state-controlled marketing system for rice in Mali’s Office du Niger depressed farm-level prices in the late 1970s and led to smuggling of paddy from Mali to Côte d’Ivoire .
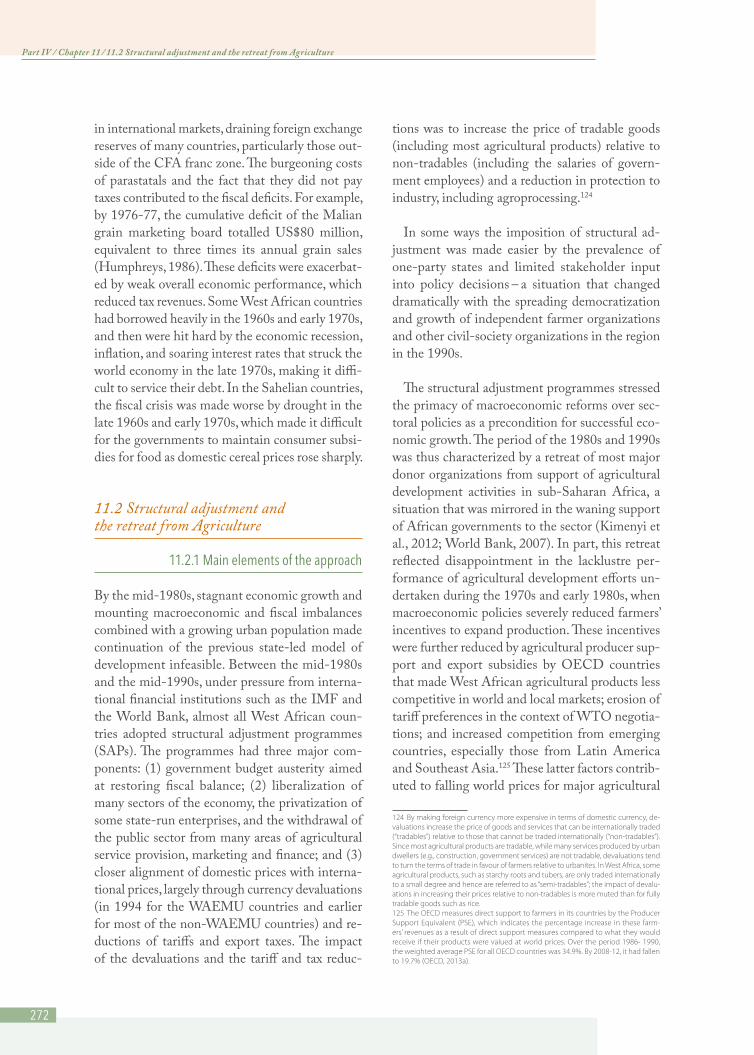
Lagging agricultural growth rates and falling per capita incomes. Figure 11.1 displays annual growth rates in production for several types of commodities over four periods: the immediate post-independence era (1961-69), the period lead-ing up to structural adjustment programmes in most countries (1970-85), the period of struc-tural adjustment and immediate post-structural adjustment (1986-2000), and the period from 2001 through 2011, when agriculture came back on the development agenda. The figure shows growth rates for two staples in which the re-gion is nearly self-sufficient (cereals and beef ), two import-substitutes (poultry and sugar), and two export crops (cocoa and cotton). Given the
Table 11.2 Net rates of assistance (%) for cotton farmers
Benin, Burkina Faso, Mali and Togo, 1970-2005
Country 1970–74 1975–79 1980–84 1985–89 1990–94 1995–99 2000–05
Benin -44 -49 -49 -5 -24 -22 -6
Burkina Faso -44 -48 -58 -8 -26 -28 1
Mali -56 -55 -59 -17 -25 -33 3
Togo -41 -46 -60 -14 -25 -24 -13
Unweighted average -46 -49 -56 -8 -24 -26 -5
Source: Baffes, 2009
Table 11.3 Manufacturing value added as a percent of GDPAnnual Averages, 1961-2011
Country 1961-69 1970-85 1986-2000 2001-11
Benin 9.6 7.8 7.8
Burkina Faso 13.9 17.0 15.2 10.8
Cape Verde 9.1
Côte d’Ivoire 10.3 11.0 18.7 18.9
The Gambia 3.0 4.4 7.2 6.0
Ghana 12.8 10.7 10.0 8.8
Guinea 4.2 6.3
Guinea-Bissau 21.2 8.0 10.4
Liberia 2.9 5.7 4.5 5.4
Mali 6.7 6.9 7.0 3.1
Niger 3.0 5.2 6.5 6.5
Nigeria 3.1
Senegal 13.9 15.5 14.9
Sierra Leone 6.0 5.9 6.0 2.8
Togo 9.1 7.3 8.8 8.6
Source: Calculated from data in World Bank Africa Development Indicators, 2013

270
Part IV / Chapter 11 / 11.1 Agricultural policies from independence through the mid-1980s: A state-led development approach
predominance of Nigeria in the production of most agricultural products in the region, Figure 11.1 shows annual growth rates both for the ECOWAS zone as a whole and for the region minus Nigeria. For cocoa, the figure displays ECOWAS with and without the production of Côte d’Ivoire, currently the world’s largest cocoa producer.
For almost all major categories of products shown in Figure 11.1, production growth rates fell from the 1960s to the period immediately preceding structural adjustment, but the patterns of change varied by type of product. The declines were most precipitous for the two export crops, cocoa beans and cotton lint, with the decline in the growth rate of cotton being greatest in the area outside of Nigeria (mainly the CFA franc countries). These declines reflected in part the heavy taxation of these crops. For cereals, the growth rate for the region as a whole actually in-creased, due entirely to an increased growth rate for Nigeria (the growth rate outside of Nigeria fell), and growth rates of poultry production also
increased for the region as a whole. The growth rate for beef declined sharply outside of Nigeria in the period 1970-85, and that of sugar for the region as a whole also declined from the very high rates of growth in the 1960s (from a small base).
The slowing growth in agricultural production, combined with a growing population, contributed to a slow-down in per capita incomes, although there was considerable variation across countries (Table 11.4). In the 1960s, 70% of the ECOWAS countries for which comparable data are available had positive growth in real per capita incomes, but this had fallen to 38% in the 1970-85 period, immediately before structural adjustment. The un-weighted average of real per capita income growth across the ECOWAS countries turned negative during the 1970-1985 period.
Growing shortages of foreign exchange and fiscal deficits.123 Overvalued exchange rates made im-ports artificially cheap and exports less competitive 123 For more details on the points discussed in this paragraph, see World Bank, 1981 .
Table 11.4 Growth rates of per capita GDPIn 2005 PPP, constant international dollars
1960-1969 1970-1985 1986-2000 2001-2010
Country (%)
Benin 1.4 0.5 0.5 0.8
Burkina Faso 1.4 1.5 1.6 1.8
Cape Verde 2.8 5.2
Côte d’Ivoire 4.0 -1.1 -1.1 -0.4
The Gambia 1.2 -0.7 2.3
Ghana -0.8 -3.0 1.6 3.8
Guinea 0.9 0.9
Guinea-Bissau -0.5 0.1 -0.2
Liberia 1.7 -2.4 -10.6 -1.8
Mali 0.8 1.6 1.6
Niger 0.0 -2.1 -1.5 0.6
Nigeria -1.1 -1.5 1.0 4.4
Senegal -1.4 -0.8 -0.3 1.7
Sierra Leone 2.9 0.1 -4.3 4.2
Togo 5.9 -0.2 -0.5 0.8
Unweighted mean 1.4 -0.6 -0.6 1.7
Unweighted mean excludingSierra Leone and Liberia 0.5
Source: Calculated from data in World Bank, World Development Indicators, 2011.

271
Part IV / Chapter 11 / 11.1 Agricultural policies from independence through the mid-1980s: A state-led development approach
Source: Calculated from FAOSTAT data.
Figure 11.1 Annual growth rates in production for selected commodities
4%
3%
2%
1%
1961 - 69
5%
0%
ECOWAS minus Nigeria
Cereals
ECOWAS Total
6%
7%
1970 - 85 1986 - 2000 2001 - 11
4%
3%
2%
1%
1961 - 69
5%
0%
ECOWAS minus Nigeria
Beef
ECOWAS Total
6%
7%
1970 - 85 1986 - 2000 2001 - 11
40%
30%
20%
10%
1961 - 69
50%
0%
ECOWAS minus Nigeria
Sugar
ECOWAS Total
1970 - 85 1986 - 2000 2001 - 11
8%
6%
4%
2%
1961 - 69
10%
0%
ECOWAS minus Nigeria
Poultry
ECOWAS Total
1970 - 85 1986 - 2000 2001 - 11
2%
0%
-2%
-4%
1961 - 69
4%
-6%
ECOWAS minus Nigeria
Cotton Lint
ECOWAS Total
8%
1970 - 85 1986 - 2000 2001 - 11 1961 - 69
ECOWASminusCôted’Ivoire
Cocoa
ECOWAS Total
1970 - 85 1986 - 2000 2001 - 11
6%
10%
2%
0%
-2%
-4%
4%
-6%
8%
6%
10%
272
Part IV / Chapter 11 / 11.2 Structural adjustment and the retreat from Agriculture
in international markets, draining foreign exchange reserves of many countries, particularly those out-side of the CFA franc zone. The burgeoning costs of parastatals and the fact that they did not pay taxes contributed to the fiscal deficits. For example, by 1976-77, the cumulative deficit of the Malian grain marketing board totalled US$80 million, equivalent to three times its annual grain sales (Humphreys, 1986). These deficits were exacerbat-ed by weak overall economic performance, which reduced tax revenues. Some West African countries had borrowed heavily in the 1960s and early 1970s, and then were hit hard by the economic recession, inflation, and soaring interest rates that struck the world economy in the late 1970s, making it diffi-cult to service their debt. In the Sahelian countries, the fiscal crisis was made worse by drought in the late 1960s and early 1970s, which made it difficult for the governments to maintain consumer subsi-dies for food as domestic cereal prices rose sharply.
11.2 Structural adjustment and the retreat from Agriculture
11.2.1 Main elements of the approach
By the mid-1980s, stagnant economic growth and mounting macroeconomic and fiscal imbalances combined with a growing urban population made continuation of the previous state-led model of development infeasible. Between the mid-1980s and the mid-1990s, under pressure from interna-tional financial institutions such as the IMF and the World Bank, almost all West African coun-tries adopted structural adjustment programmes (SAPs). The programmes had three major com-ponents: (1) government budget austerity aimed at restoring fiscal balance; (2) liberalization of many sectors of the economy, the privatization of some state-run enterprises, and the withdrawal of the public sector from many areas of agricultural service provision, marketing and finance; and (3) closer alignment of domestic prices with interna-tional prices, largely through currency devaluations (in 1994 for the WAEMU countries and earlier for most of the non-WAEMU countries) and re-ductions of tariffs and export taxes. The impact of the devaluations and the tariff and tax reduc-
tions was to increase the price of tradable goods (including most agricultural products) relative to non-tradables (including the salaries of govern-ment employees) and a reduction in protection to industry, including agroprocessing.124
In some ways the imposition of structural ad-justment was made easier by the prevalence of one-party states and limited stakeholder input into policy decisions – a situation that changed dramatically with the spreading democratization and growth of independent farmer organizations and other civil-society organizations in the region in the 1990s.
The structural adjustment programmes stressed the primacy of macroeconomic reforms over sec-toral policies as a precondition for successful eco-nomic growth. The period of the 1980s and 1990s was thus characterized by a retreat of most major donor organizations from support of agricultural development activities in sub-Saharan Africa, a situation that was mirrored in the waning support of African governments to the sector (Kimenyi et al., 2012; World Bank, 2007). In part, this retreat reflected disappointment in the lacklustre per-formance of agricultural development efforts un-dertaken during the 1970s and early 1980s, when macroeconomic policies severely reduced farmers’ incentives to expand production. These incentives were further reduced by agricultural producer sup-port and export subsidies by OECD countries that made West African agricultural products less competitive in world and local markets; erosion of tariff preferences in the context of WTO negotia-tions; and increased competition from emerging countries, especially those from Latin America and Southeast Asia.125 These latter factors contrib-uted to falling world prices for major agricultural
124 By making foreign currency more expensive in terms of domestic currency, de-valuations increase the price of goods and services that can be internationally traded (“tradables”) relative to those that cannot be traded internationally (“non-tradables”) . Since most agricultural products are tradable, while many services produced by urban dwellers (e .g ., construction, government services) are not tradable, devaluations tend to turn the terms of trade in favour of farmers relative to urbanites . In West Africa, some agricultural products, such as starchy roots and tubers, are only traded internationally to a small degree and hence are referred to as “semi-tradables”; the impact of devalu-ations in increasing their prices relative to non-tradables is more muted than for fully tradable goods such as rice .125 The OECD measures direct support to farmers in its countries by the Producer Support Equivalent (PSE), which indicates the percentage increase in these farm-ers’ revenues as a result of direct support measures compared to what they would receive if their products were valued at world prices . Over the period 1986- 1990, the weighted average PSE for all OECD countries was 34 .9% . By 2008-12, it had fallen to 19 .7% (OECD, 2013a) .

273
Part IV / Chapter 11 / 11.2 Structural adjustment and the retreat from Agriculture
staples, made even cheaper in the CFA franc countries by an increasingly overvalued currency (until the devaluation of 1994). During the 1980s and early 1990s, West African governments may therefore have viewed reliance on imports as a cheaper way of addressing their countries’ food needs than investing in efforts to increase produc-tivity throughout the agrifood system.
11.2.2 Impacts of the SAPs and of the retreat from agriculture
The impacts of structural adjustment programmes on the West Africa agrifood system were mixed. On the positive side, as shown in Tables 11.1 and 11.2, the price incentives facing farmers in West African countries, particularly for export crops, improved sharply in most countries. For exam-ple, taxation of cotton farmers (as measured by NRAs) in Benin, Burkina Faso, Mali and Togo fell from an average of 56% in 1980-84 to 24% by 1990-94. Taxation of export crops also fell sharply in Ghana, Nigeria and Senegal over the same period, but remained stable at almost 50% in Côte d’Ivoire. Most import-competing crops were protected during the entire period, although protection levels began to decrease in the early 1990s in Senegal and Nigeria.
Figure 11.1 illustrates the varying performance of different value chains during the SAP period. The most dramatic change was for cocoa, the re-gion’s most important export, where the growth rate of production turned sharply positive (espe-cially in Ghana) in the 1986-2000 period, after over 10 years of decline. Cotton growth rates increased for the region as a whole, reflecting mainly improved growth in Nigeria, although there was little change in the region outside of Nigeria, reflecting in part the continued overvalu-ation of the CFA franc until the devaluation of 1994. The exchange-rate reforms and liberaliza-tions also set the groundwork for the re-ignition of other export-oriented growth in some coun-tries, such as Ghana in the 1990s, and the expan-sion of production of non-traditional agricultural exports such as fresh horticultural products. In contrast, the declining protection for some of the import substitutes during the SAP period is
illustrated in the sharply falling growth rates for both poultry (which faced increasing competi-tion from the frozen chicken imports discussed in Chapter 10) and raw sugar. As for staples, the growth rate for cereal production also increased in the period 1986-2000 (a period also character-ized by generally favourable rainfall), as did that of beef production in the areas outside of Nigeria.
Table 11.4 shows that the period 1986-2000 was also characterized by better performance in terms of overall economic growth as measured by GDP per capita, with the notable exceptions of Liberia and Sierra Leone, where civil wars wracked their economies. Whereas only 38% of the ECOWAS countries for which data are available had positive growth in per capita GDP over the period 1970-85, this figure had grown to 60% for the period 1986-2000. Furthermore, when Sierra Leone and Liberia are excluded, the unweighted average of growth rates in GDP per capita for the zone as a whole turned positive during this period.
The emphasis of structural adjustment pro-grammes on growth based on comparative advan-tage also gave rise to a shift starting in the mid-1980s, particularly in the Francophone countries under the impetus of CILSS, from an emphasis on food self-sufficiency in official agricultural policy pronouncements towards more emphasis the no-tion of trade-based food security. This involved greater recognition of the role that regional trade could play as part of national food security strate-gies as well as a greater emphasis on the notion of income-based access to food as a critical compo-nent of food security rather than a single-minded focus on food production.
Despite some notable successes, however, the overall impact of the SAPs on Agriculture was often less than initially hoped ( Johnson, et al., 2008). In the initial phases of these reforms, insuf-ficient effort was made to address the structural problems that had partially motivated the creation of the parastatals in the first place. In addition, the budget austerity and currency devaluations that frequently accompanied the initial phases of the SAPs led to higher interest rates, increased transport and input costs (which have high import

274
Part IV / Chapter 11 / 11.2 Structural adjustment and the retreat from Agriculture
components) and reduced investments in public goods such as agricultural research and extension, all of which dampened the supply response to higher output prices. The removal of administered pan-territorial pricing resulted in more variable prices, increased uncertainty for farmers and dif-ferentiated spatial outcomes for those farmers who previously had access to the official mar-keting systems.126 The dismantling of parastatals such as marketing boards and public agricultural development banks sharply reduced the avail-ability of inputs and credit, including medium-term credit for agricultural equipment. Due to poorly developed infrastructure, high transaction costs, risks and uncertainty (including uncertainty among private-sector actors about whether the economic reforms would be maintained), private actors were slow in taking over the provision of inputs, finance and other support services (Shep-herd and Farolfi, 1999).
Trade liberalization and privatization led in some cases to the emergence of oligopolistic market structures. In many of the smaller countries, the limited size of the domestic markets in combina-tion with scale economies in the cereal import business led to the domination of the import trade for key staples such as rice by a few firms that had substantial power to influence consumer prices. As discussed in Chapter 10, reduction of trade barriers for previously highly protected import substitutes also resulted in large influxes of low-priced im-ports of certain competing products, such as frozen chickens and milk powder, which undercut markets for local producers.
UNIDO (Yumkella, et al., 2011) argues that structural adjustment led to deindustrialization in many African countries, as protection fell for many import-substituting industries. While some manufacturing and food processing plants in West Africa undoubtedly did close during the SAP period, the overall picture, as indicated by World Bank data (Table 11.3), is ambiguous. For
126 See the discussion in Chapter 10 of the experience of Nigeria’s cocoa value chain following the abolition of the Cocoa Marketing Board . In many countries, however, financial constraints limited the coverage of official marketing systems, particu-larly for food products, and farmers and consumers who remained outside these systems had to rely on illegal parallel markets that were characterized by volatile prices and uneven product availability . For them, the removal of the state-domi-nated marketing system likely led to better market access and more stable prices .
the 12 countries for which comparable data are available, the share of manufacturing in GDP fell in 5 countries over the period 1986-2000 but remained stable or increased in the remaining 7. A big missing part of the picture, however, is Nigeria, for which the World Bank reports no data. As discussed in Chapters 8, there is evidence that modern retailing shrank in Nigeria follow-ing structural adjustment, and this likely also extended to some food processing.
Because the reforms turned the terms of trade against previously protected industries and the ur-ban population – including civil servants – which produces mainly non-tradables, there was often resistance to the new polices. This was exacerbated by the high social costs caused by the retrench-ment of employees and the downsizing of public services and subsidies. Consequently, implemen-tation of the reforms was uneven across countries and value chains and characterized by setbacks and policy inconsistencies, which further contrib-uted to mixed results from structural adjustment.
In hindsight, while macro-economic and sec-toral reforms were clearly needed, the adjustment programmes focusing almost exclusively on macro-economic reforms and a radical downsizing of the public sector led to high socio-economic costs, as discussed below. While SAPs established the basis for long term agricultural growth through improved producer incentives, they coincided with donors’ and governments’ retreat from agriculture. Hence, investments in building and reforming the critical institutions and infrastructures needed for the non-state sectors to take over many of the functions previously carried out by the government were grossly inadequate. Unfortunately, it took more than a decade after structural adjustment until the need for investments in agricultural and related institutions and stakeholders re-entered the policy agenda.
275
Part IV / Chapter 11 / 11.3 The initial policy response to structural adjustment
11.3 The initial policy response to structural adjustment
11.3.1 Social protection, poverty alleviation and environmentalism
Concerns about the costs borne by the individuals and industries forced to adjust under the SAPs spurred several responses in West Africa and in the North. Many expressed the view that the poor were bearing an unfair burden of adjustment due to the loss of social services, higher food prices resulting from currency devaluations, and an increased fo-cus on export-oriented production to help service external debt. These concerns led to calls for debt forgiveness, increased emphasis on social protec-tion measures, ensuring “basic needs”, and focusing development efforts on the poorest of the poor. This emphasis on “adjustment with a human face” also promoted the role of NGOs and civil-society organizations as an alternative to what many saw as dysfunctional government services.
By 1996, the concerns about debt-relief gave rise to the Highly Indebted Poor Countries (HIPC) initiative of the IMF and the World Bank, under which poor countries could qualify for debt relief under certain conditions, including the preparation of a Poverty Reduction Strategy Paper (PRSP). The PRSPs outlined how debt-relief savings would be used to reduce poverty, and the first generation of these papers had a heavy emphasis on strength-ening social services. These same concerns also inspired the formulation of the Millennium De-velopment Goals in 2000, which also had a strong poverty-alleviation focus.
The poverty alleviation focus was coupled with worries over the environmental costs of adjust-ment – e.g. deforestation resulting from expanded logging of tropical forests in order to generate foreign exchange. A growing environmental move-ment in the North pushed for an increased at-tention to the environmental costs of agricultural development efforts, which in turn focused more of these efforts on environmentally fragile areas. Regarding rural economic development, empha-sis was increasingly placed on the rural non-farm economy, but frequently without sufficient atten-
tion to strengthening the economic base in rural areas via broad-based agricultural growth to fully exploit linkages with the non-farm economy.
These shifts in policy emphasis in the 1990s and early 2000s also reflected in part the emergence of more open policy processes in many West Af-rican countries, as one-party regimes gave way to more pluralistic political systems and the blos-soming of independent civil-society and farmer organizations. A more diverse set of actors was now demanding a seat at the table during debates about development policy, which in turn resulted in policies having to try to address a more diverse set of objectives than in the past.
11.3.2 The rediscovery of Agriculture
By the early 2000s, the rhetoric regarding agri-cultural development in sub-Saharan Africa be-gan to change, as advocates in both Africa and the North argued that robust agricultural growth was necessary to drive poverty alleviation and fi-nance the expanded social investments called for in the Millennium Development Goals (see, for example, Partnership to Cut Hunger and Poverty in Africa, 2002). Such growth required explicit sectoral policies and investments focused on ag-riculture and agroprocessing as complements to the macro-level reforms. Nor could everything be done by NGOs – there was increased advocacy of rebuilding and expanding capacity of government agencies to design and implement policies as part of a broader programme to promote public-private partnerships in Agriculture.
In the late 1990s, when this “rediscovery of ag-riculture” began, West African countries varied widely with respect to the emphasis they gave to the agricultural sector in terms of budget alloca-tion and policy attention. Policies frequently were reactive – focusing on crash programmes that set very ambitious production goals in response to episodic food crises – and changed frequently. Ni-geria typified this approach, with frequent changes in both food and trade policies as exemplified by the periodic imposition of trade bans to protect domestic producers and processors, followed by their subsequent removal.

276
Part IV / Chapter 11 / 11.3 The initial policy response to structural adjustment
These policies were typically placed in the con-text of the World-Bank-supported Poverty Reduc-tion Strategy Papers (PRSPs), which set overall economic development strategies. The agricultural policies were frequently guided by national agri-cultural or rural development strategy plans (such as the Food and Agriculture Sector Development Policy – FASDEP – in Ghana) and, in some coun-tries, national food-security strategies. In some of the Francophone countries, national assemblies passed laws (typically called “agricultural orienta-tion laws”) that outlined a broad vision and strat-egy for the development of the agricultural sec-tor. Among their main purposes was to give legal recognition to farming as a profession, with farms to be registered so that they could more easily un-dertake formal-sector activities, such as applying for bank loans and entering into contracts. The laws also provided broader legal recognition to farmers’ organizations and interprofessional organizations that bring together actors from throughout a given value chain. In some cases, the laws proclaimed that these organizations would play a key role in agricultural development programme design and implementation. These laws, as well as economic development plans such as Nigeria’s Seven Point Agenda, often addressed the need for fundamental structural changes in the rural economy, such as land reform. Some countries also developed agri-cultural investment plans, such as Sierra Leone’s National Sustainable Agriculture Development Programme (NSADP), but these were often very broad, without clear prioritization, let alone fund-ing, and lacking a clear policy implementation arrangement.127
These basic documents were complemented by numerous sector or subsector development plans (for irrigation, key cash crops, rural infrastruc-ture, etc.), each with its own priorities. Some of these programmes, such as Ghana’s FASDEP were fairly comprehensive and, with minor chang-es, became the core of the country’s subsequent CAADP investment plan (discussed below). In many countries, however, agricultural strategies and priorities had been developed in piecemeal
127 A single component of the NSADP, focused on smallholder commercialization, later was refined and became the core of Sierra Leone’s CAADP national agricultural development plan .
fashion over time, often in response to funding opportunities dictated by the preferences of exter-nal donors and the desire to respond to multiple interest groups. For example, in 2009, the Malian Ministry of Agriculture commissioned a review of all rural development strategies in the country, as part of its effort to move to a more coherent sector-wide approach. The study found that Mali had 22 separate officially validated strategies for various aspects of rural development, which in turn established a total 117 different priorities for rural development (Centre d’Etudes pour le Développement au Sahel, 2009). A country with 117 different priorities has in reality no priorities at all, but likely faces large problems of duplica-tion of effort. The numerous official policies in the ECOWAS member states were complemented with ad hoc measures to deal with food crises, such as the reduction or elimination of import taxes on cereals during periods of high prices, the short-lived Presidential Initiatives on Agriculture in Nigeria and Ghana in the early 2000s, and Burkina Faso’s and Mali’s restrictions on grain exports during such periods in 2005 and 2008 in contravention of the ECOWAS treaty.128
11.3.3 New models of partnership and strengthened regionalism
Another reaction to structural adjustment was the move to stronger collective action by African gov-ernments to mediate their interactions with the world economy, international financial institutions and other development partners. At the continen-tal level, this was manifested in the conversion of the Organization of African Unity into the more tightly structured African Union (AU) in 2001 and the AU’s subsequent development of the New Partnership for Africa’s Development (NEPAD). As its title implies, NEPAD sought to redefine collaboration between African governments, donor agencies and international financial institutions into one characterized by a more equal partnership organized around mutually agreed-upon goals.
128 Article 26 of the ECOWAS treaty allows member states to restrict their trade with the Community for a maximum period of one year as a safeguard measure, but only if there is prior notification . The application of these measures is subject to review by the ECOWAS Council of Ministers . None of the countries in the Community that restricted exports during the 2008 crisis gave the required notification to the ECOWAS Commission .
277
Part IV / Chapter 11 / 11.3 The initial policy response to structural adjustment
In West Africa, this interest in stronger collective action led to attempts by regional organizations, such as the West African Economic and Monetary Union (WAEMU) and ECOWAS, to develop regional trade policy instruments such as a com-mon external tariff and regional free trade zones to regulate trade within West Africa as well as with the rest of the world. In the area of agriculture, specialized agencies such as CILSS and CORAF/WECARD promoted more fluid regional trade, expanded regional collaboration on agricultural re-search and the development of common procedures for seed and pesticide registration. In the broader area of Agricultural policy, WAEMU took the lead in developing a regional policy for its eight mem-ber states, starting in 2001, many of whose features presaged those later incorporated in the ECOWAS agricultural policy, known as ECOWAP. We first turn to a brief analysis of the WAEMU regional policy before discussing ECOWAP as part of the broader NEPAD/CAADP effort in West Africa.
The Agricultural policy of the West African Economic and Monetary Union (PAU)
WAEMU comprises the eight West African countries sharing the CFA franc (Benin, Bur-kina Faso, Côte d’Ivoire, Guinea-Bissau, Mali, Niger, Senegal and Togo), all of which are also members of ECOWAS. The agricultural policy of WAEMU, known as PAU (la Politique Agri-cole de l’UEMOA), was launched in December, 2001. It thus predates ECOWAP by four years and served as a model for many of the foci sub-sequently included in that programme.129
Major elements of the PAU. The PAU’s over-all aims are to contribute to satisfying the food needs of the population, the economic and social development of the member states and the reduc-tion of rural poverty. The programme is built around three axes (UEMOA, 2009):
》》 Improving the competitiveness of key agricul-tural value chains (rice, maize, meat, poultry and cotton) through preparing regional de-
129 Another element of WAEMU policies (but not part of PAU) that has been adopted by ECOWAS, with important implications for ECOWAP, is the common external tariff (CET) . As explained in Chapter 12, ECOWAS adopted the WAEMU CET in 2005, but then expanded it to include a fifth, higher tariff band (of 35%, compared to the top WAEMU rate of 20%) to cover particularly sensitive products, which are almost exclusively agricultural .
velopment plans for each value chain, iden-tifying key actions for national and regional investments, creating a regional investment fund to help finance such investments, pro-moting regional stakeholder consultations in these value chains, improving agricultural and market information, developing programmes to help member states deal with the threat of avian influenza, and undertaking specific actions to expand rice production in Senegal and Mali. In 2008, for example, WAEMU entered into an agreement with Mali to invest in the improvement of 11 000 ha in the Office du Niger irrigated rice area, with the intent of opening the area to farmers from any of the member states, as part of the effort to increase rice production within the Union.
》》 Deepening the common market of the Union within the agricultural sector and improving the management of shared resources through harmonization of standards for production, marketing, food safety, agricultural taxation and monitoring procedures; management of cross-border livestock transhumance; and the management of inland fisheries resources and shared water resources.
》》 Integrating agriculture in the WAEMU zone into the regional and international markets. The main emphasis under this axis has been on foster-ing consultation among member states as they prepare for international trade negotiations re-garding agriculture and creating an information and decision-support system for the negotia-tions. Such consultation is especially needed for WTO negotiations because WAEMU itself is not authorised by the WTO to negotiate on behalf of its member states. Therefore, if an issue arises that is important for the Union as a whole, all the member states have to agree in advance to take the same position in the WTO negotiations.
How effective has the PAU been in meeting its stated goals? WAEMU was created in 1994, after the CFA franc devaluation, but is built upon a monetary union (previously known as UMOA) that has existed among most of the member states

278
Part IV / Chapter 11 / 11.4 The emergence of ECOWAP/CAADP
since their independence in the 1960s. Hence, the history of collaboration among the member states of WAEMU is much longer than that of ECOWAS, which was created in 1975, and the PAU has been operational much longer than ECOWAP. Currently, the PAU is implemented in parallel with ECOWAP, with strong efforts at coordination between the two programmes. At the same time, the PAU has served as inspira-tion for some of the approaches and programmes adopted by ECOWAP, notably the focus on pri-ority value chains, the use of guiding principles such as subsidiarity and solidarity to determine which activities are included in a regional as opposed to a national programme, and the need to promote common standards for agricultural inputs and products as a precondition for creating a regional common market.
Despite the long history of cooperation among the WAEMU member states and their common currency, which facilitates trade within the Un-ion, the implementation of the PAU has taken much longer than originally planned. The PAU has been implemented thus far through two pro-grammes, beginning in 2002, that were origi-nally designed to cover 3 years each, but which in reality have extended over 11 years (UEMOA, 2011). The PAU has faced some notable con-straints in its effort to create an effective regional common market for agricultural products.
》》 First, it has been very dependent on the funding of external development partners, particularly the European Union and France (UEMOA Commision, 2012). This has limited the auton-omy of the Union in designing the programme and, according to WAEMU, affected the speed of implementation.130
》》 Second, while the PAU has focused heav-ily on developing regional processes for the harmonization of product and input stand-ards, implementation of these standards at the national level has been slow. National agen-cies frequently lack the budget and facilities to monitor compliance, and the private sec-
130 As the CFA franc has a fixed parity with the Euro, guaranteed by the French treas-ury, the autonomy of WAEMU is by its very nature more limited than that of ECOWAS .
tor sometimes complains that the proposed standards do not correspond to criteria that are valued in the local and regional markets. Furthermore, the maintenance of disparate na-tional standards creates opportunities for rent seeking. If each country has its own standards, markets in most countries remain small by in-ternational standards and tend to be dominated by local oligopolists, who lobby against moving towards regional standards that would increase competition.
》》 Third, despite the creation of regional frame-works for stakeholder consultation on PAU implementation, ROPPA argues that many de-cisions regarding which programmes to imple-ment were made without effective consultation with farmer organizations (ROPPA, 2012b).
》》 Fourth, there is some tension between the objectives of the PAU, in terms of promot-ing Agricultural growth in the region, and the adoption of the WAEMU common external tariff (CET), which has a maximum ad valorem rate of 20%. The adoption of the CET reduced tariff rates in several of the member countries led some producer groups to complain about decreased protection ( Johnson, et al., 2008).
》》 Fifth, to date, the PAU has no formal mon-itoring and evaluation system, which limits the ability to measure the impacts of the pro-gramme and make adjustment as necessary.
These are all challenges that ECOWAP will likely face, in some degree, in its implementation as well.
11.4 The emergence of ECOWAP/CAADP
11.4.1 Characteristics of the ECOWAP/CAADP approach
NEPAD’s Comprehensive African Agriculture De-velopment Programme (CAADP) was launched in 2003 and was part of a larger “rediscovery of agriculture” by African governments and their development partners. CAADP attempts to ad-dress the piece-meal way that agricultural develop-

279
Part IV / Chapter 11 / 11.4 The emergence of ECOWAP/CAADP
ment frequently has been promoted in Africa via a plethora of separate projects and initiatives. The development of NEPAD and the Maputo Declara-tion of 2003, in which African Heads of State and Government set a target of allocating a minimum of 10% of national budgets to agricultural develop-ment, marked major steps to raise the priority given to agriculture by African governments. Interna-tional donors also pledged increased attention to African agriculture, and by 2006 ODA levels to agriculture in Africa, which had fallen by over 50% in real terms between 1985 and 2005, had begun to increase (World Bank, 2007). The entry of the Bill and Melinda Gates foundation as a major donor focused on African agricultural development in 2007 and the world food crisis of 2008 accelerated the attention given to agriculture, putting it on the forefront of many countries’ development agendas, and most of the new efforts pledged to work within the framework of CAADP.
The overall aim of CAADP is “to help African countries reach a higher path of economic growth through agriculture-led development” and in so doing “to eliminate hunger and reduce poverty through agriculture” (CAADP, 2013). Thus, the Programme sees broad-agricultural growth as cen-tral to both overall economic growth and poverty alleviation. The Programme is built around four pillars (ibid.):
1. Extending the area under sustainable land management and reliable water control sys-tems.
2. Increasing market access through improved rural infrastructure and other trade-related interventions.
3. Increasing food supply and reducing hunger across the region by raising smallholder pro-ductivity and improving responses to food emergencies.
4. Improving agricultural research and extension systems in order to disseminate appropriate new technologies and boosting the support available to help farmers to adopt such new options.
Compared with previous efforts to increase ag-ricultural production in Africa, CAADP is distin-guished by the following characteristics:
》》 Advocacy of a country-led, sector-wide approach to agricultural development. This sector-wide approach involves stakeholders in each coun-try (national and local governments, the private sector including farmer organizations, civil society and development partners) agreeing on a comprehensive sector-wide programme to which all stakeholders subsequently align their actions. This is in contrast to the previ-ous project-led approach, where development priorities were often set in accordance with donor objectives and frequently there was lit-tle coordination across projects. CAADP thus represents an attempt to put in practice the principles laid out in the Paris Declaration on Aid Effectiveness (OECD, 2013b).
》》 Calls for national agricultural development strategies to be designed in a way that ex-plicitly recognises regional complementarities and trade. Regional Economic Communities (ECOWAS in West Africa) not only support the development of the national programmes but also undertake similar participatory pro-cesses to design regional programmes that complement the national programmes by tak-ing account of regional spillovers and econo-mies of scale in investments and policies. Fur-thermore, national programmes are designed using common design principles in order to facilitate regional collaboration.
》》 A pledge by African governments to devote at least 10% of budgetary resources and increased policy attention to agricultural development in order to achieve annual agricultural sector growth rates of 6%, which were deemed neces-sary to achieve the Millennium Development Goal of reducing poverty rates by half by 2015.
In 2002, ECOWAS initiated the design of a common agricultural policy, known as ECOWAP (ECOWAS Agricultural Policy) for its 15 mem-ber states. With the launching of CAADP in 2003, ECOWAS decided to merge CAADP into

280
Part IV / Chapter 11 / 11.4 The emergence of ECOWAP/CAADP
the ECOWAP process. The design of ECOW-AP was developed through a consultative process with member states and stakeholder groups. The programme that was adopted by the ECOWAS Heads of State in January 2005 envisages a high level of internal market integration with external protection levels for individual products to be de-fined on a case-by-case basis, depending on the importance, potential for expanded production, and specific challenges facing the value chains (ECOWAS Commission, 2009a).
ECOWAP/CAADP aspires to become a com-mon framework for agricultural policy and pro-grammes in the region. Its implementation hinges upon policy reforms and investment plans. The policy reforms involve harmonization in areas such as internal and external trade, taxation, in-vestment codes, regulatory frameworks, and in-dustrial and monetary policies. The investment plans are implemented at two levels: (1) at the national level through the formulation and im-plementation of National Agricultural Invest-ment Programmes (NAIPs) in each of the 15 member countries; and (2) at the regional level through the Regional Agricultural Investment Plan (RAIP) and the creation of new regional institutions and policies to implement and com-plement the plan.
11.4. Design of CAADP national programmes
Although CAADP was officially launched on a continental basis in 2003 and in West Africa merged with the development of ECOWAP in 2005, work on national-level CAADP plans only started in earnest in 2008. The process involved four steps: stock-taking, the holding of a stake-holder roundtable, the development of a national investment plan, and the holding of a “business meeting” of all stakeholders to validate the invest-ment plan.
Developing the National Agricultural Invest-ment Programmes (NAIPs)
The stock-taking was carried out by government-appointed national CAADP teams which included analysts from government and, in some countries, participants from the private sector and civil so-
ciety. The country teams each prepared two re-ports: (1) A diagnostic study that inventoried and analysed current and past agricultural develop-ment strategies and experiences in their respective countries;131 and (2) a computable general equilib-rium modelling exercise to look at the impact of different agricultural investments on agricultural and overall economic growth rates and on pov-erty alleviation. The aim of the modelling was to identify the types and levels of agricultural invest-ments (and subsequent agricultural growth rates) that would be necessary to achieve a sustained 6% annual GDP growth rate.
These reports served to identify a priority set of objectives and actions that were discussed with farmer organizations, other private-sector actors, government, development partners, and civil soci-ety in each country. The discussions culminated in a stakeholder roundtable meeting and the signing of a country-level CAADP Compact that spelled out the goals, strategies, and implementation principles that would guide the country’s sector-wide ap-proach to agricultural development. A key part of the stakeholder consultation was interaction with major donors, who were typically organised in a do-nor working group. At the regional level, ECOWAS launched a similar process to design its regional investment plan, policy instruments, and new im-plementing institutions, drawing on inputs from regional and international organizations such as CILSS and CORAF and from external consult-ants.
Fourteen of the fifteen ECOWAS countries signed their Compacts between July 2009 and July 2010, with the final agreement (Guinea-Bissau) being signed in January 2011. The regional Com-pact was signed in November, 2009.
Following the signing of the Compact, the country teams each developed a national agri-cultural investment plan (NAIP) that aimed to translate the objectives contained in the Compact into concrete programmes to be implemented over a period of five to ten years. These NAIPs
131 The diagnostic studies often drew on processes already under way in the indi-vidual countries, such as an agricultural sector review in Mali and the development of the Medium-Term Agricultural Investment Plan in Ghana .

281
Part IV / Chapter 11 / 11.4 The emergence of ECOWAP/CAADP
thus represented the implementation plans for short- and medium-term priority elements of each country’s broader agricultural development policy document (e.g. the agricultural orienta-tion law). The draft NAIPs were reviewed by a joint ECOWAS/African Union team and then again vetted by stakeholders at national “busi-ness meetings.” By the end of 2011, eleven of the fifteen ECOWAS countries had fully reviewed and validated investment plans (Taondyandé et al., 2013). West Africa has been far ahead of the other regions of Africa in the CAADP process and is the only region where all the countries have signed compacts and almost all have com-pleted investment plans.
The CAADP national plans generally involved a fair amount of repackaging of existing projects and programmes, notably the special initiatives that national governments had launched in re-sponse to the 2008 food price crisis. To the extent that national priorities had been reflected in pre-vious agricultural planning efforts, it is logical that previous projects and programmes would reappear in the new plans. However, some of the repack-aged elements represent the crash-programme approach of the past. As is inherent in any multi-stakeholder process, there was strong pressure to include many different activities and priorities.
The ECOWAS Commission for Agriculture in collaboration with IFPRI very much drove and coordinated the whole procedure thanks to their holding of workshops with all the national teams, providing technical assistance on the modelling and facilitating reviews of draft plans. This led many on the national teams initially to see the process as top-down, more owned by ECOWAS than by the country teams themselves.132 None-theless, although some international consultants were used to help prepare the programmes, the ECOWAP and the national CAADP process mo-bilized West African technical expertise to much a higher level than many previous agricultural plan-ning efforts (for example, the national agricultural mid-term investment plans, which were prepared by FAO for all the African countries), and this use
132 For more details on the CAADP process, see Kimenyi, et al ., 2012 and van Seters et al ., 2012 .
of local expertise eventually led to a greater sense of national ownership.
The NAIPs and the food price crises
The objective of ECOWAP/CAADP is to address the fundamental structural and policy problems that impede Agricultural productivity growth and competitiveness in the region (ECOWAS Com-mission, 2009b). The timing of its design, however, coincided with the rapid increase in world food prices. The timing had both positive and negative effects on the proposed programmes that emerged. On the positive side, the surge in world food prices and the belief by many analysts that the world had entered a new era of higher and more volatile food prices gave increased political impetus to boosting Agricultural production in the region. The global food crisis also helped mobilize donor funds to support the CAADP process.
On the negative side, the crisis led to a shift in emphasis at the time of programme design from long-term structural issues to more immediate actions aimed at lowering consumer prices and boosting Agricultural production. Most govern-ments undertook crash programmes to expand production rapidly, such as Senegal’s Grande Of-fensive Agricole pour la Nourriture et l’Abondance (GOANA) and Mali’s Initiative Riz. These ini-tiatives were designed quickly and generally out-side of the on-going CAADP process, so that, in practice, the national CAADP programmes that emerged had to be built around these initiatives which were absorbing significant amounts of the countries’ rural development budgets. This inclu-sion, plus pressure to achieve very high rates of agricultural growth in the short run in order to meet the MDG 1 by 2015, put greater emphasis in some of the NAIPs on short-term measures such as untargeted input subsidies to boost agricultural growth quickly than on longer-term investment in the building blocks of agricultural productiv-ity such as improved infrastructure, technology development and diffusion, institutional reform, and strengthened human capital.
The 2008 food crisis and subsequent price spikes in 2010 and 2012 also elicited strong responses from the international community, with pledges of

282
Part IV / Chapter 11 / 11.4 The emergence of ECOWAP/CAADP
increased support for African Agricultural devel-opment from the G8 and G20, the creation of the Global Agriculture and Food Security Programme (GAFSP) trust fund, and the launching of numer-ous bilateral and multilateral initiatives such as Grow Africa, the New Alliance for Food Security and Nutrition, and the African Agribusiness and Agro-industries Development Initiative (3ADI). All these programmes purport to align with the objectives of CAADP, and they bring important resources to help support the implementation of the NAIPs and the regional investment plan, which all depend heavily on external funding to cover the their investments (see discussion below). Yet all these external initiatives have their own deadlines and constituencies, and the need to meet these funding deadlines drove the timing of completion of the NAIPs and in some countries limited the involvement of non-state actors in the development of the plans (ROPPA, 2012b). The combination of these factors led some participants to believe that the ownership of the CAADP agenda was shifting away from West Africans and towards bilateral and multilateral organizations.133
Content of CAADP national programmes
Table 11.5 shows the shares of NAIP budget al-locations across different activities for 12 countries for which detailed information was available to the authors of this report.134 Because the different NAIPs do not use a standard classification system for budget line items, the placement of a planned expenditure in a particular category was sometimes arbitrary. For example, expenditures to promote sustainable soil management take place largely on individual farms and thus could also be classified under the farm-level production category, which includes mainly direct support to farmers in the form of subsidies on variable inputs, farm equip-ment and loans. Despite this difficulty in classify-ing some of the line items, Table 11.5 highlights some broad similarities as well as some striking differences across the different NAIPs.135
133 See the quote from the letter of the President of ROPPA to the President of the African Union Commission in the focus section below on stakeholder involvement in ECOWAP/CAADP .134 The versions of the NAIPs for Burkina Faso and Côte d’Ivoire included in Table 11 .5 were not yet validated at the time of this analysis .135 The NAIP for Nigeria summarized in Table 11 .5 represents a plan developed in 2010 . As discussed in Appendix 11 .1, in 2011 the new Goodluck Jonathan admin-istration developed an Agricultural Transformation Agenda for Nigeria, which the country now considers its new CAADP investment plan . The Transformation Agenda
》》 Agrifood-system orientation. The countries vary in the degree to which their NAIPs focus on the farm-level versus the entire food sys-tem. At one extreme, Senegal devoted over 59% of its budget to farm-level production investments, with an additional 11% going to sustainable resource management, mainly at the farm level, while less than 6% was de-voted to marketing and processing. On the other hand, Nigeria, Ghana and The Gambia have between 15% and 40% of their budg-ets devoted to off-farm parts of the agrifood system. In addition, Benin, Burkina Faso and Mali planned many of their investments on a value-chain basis that bridges both farm- and off-farm value-chain activities.
》》 Environmental concerns. Many of the NAIPs show a strong concern about sustainable natu-ral resource management, as one might expect given the increasing environmental stresses facing West African agriculture. In addition to the investments in sustainable soil man-agement shown in the table, there were also investments in sustainable water management (included under the infrastructure heading) and, for some countries, other sustainable re-source management investments included in the “other” category, including management of resources shared across countries, such as transhumance routes and grazing areas.
》》 Capacity strengthening is a cross-cutting ele-ment in CAADP, and all the NAIPs have explicit capacity-strengthening activities or such activities embedded in the actions tar-geted at the farm and market levels (as is true for Nigeria and Ghana). The bulk of these capacity-strengthening activities are directed towards farmer organizations and professional and interprofessional organizations within the various value chains. Most countries also in-clude some funds for strengthening the ca-pacity of the inistry of Agriculture structures that are involved in CAADP implementation,
has many similar elements to the NAIP shown in Table 11 .5, but also some important differences . Unfortunately, the Agricultural Transformation Agenda document (Nigeria Federal Ministry of Agriculture and Rural Development, 2011) does not provide a detailed breakdown of its budget, so the older NAIP budget is included in Table 11 .5 . See Appendix 11 .1 for details .

283
Part IV / Chapter 11 / 11.4 The emergence of ECOWAP/CAADP
monitoring and evaluation; for example, over half of Niger’s funding under this rubric is to improve the general governance capacity of lo-cal units of government in rural areas. Very few of the NAIPs allocate capacity-strengthening resources to the agricultural higher education that will be needed to produce the next genera-tion of agricultural scientists and policy mak-ers, and only some of the NAIPs plan invest-ments in vocational education to strengthen skills related to the agrifood system.
》》 Research and extension. The share of the NAIPs’ budgets dedicated to research and extension vary widely, from a low of less than 1 percent in Senegal to nearly 23% in Benin. In the majority of the countries, the bulk of the re-sources are budgeted for improved extension rather than research.
》》 Crisis prevention and management and social safety nets. Seven of the twelve NAIPs have programmes aimed at improving the countries’ capacity to prevent and manage food crises, improve nutrition, and provide social safety nets. The two countries with the largest shares of their NAIP budgets going to social safety nets are Sierra Leone and Liberia, while The Gambia’s largest share is dedicated mainly to the development of a disaster crisis manage-ment system. The inclusion of crisis preven-tion and management investments and social safety nets in many of the NAIPs seems to reflect a recognition that the CAADP agen-das need to deal with disaster risks and their consequences, as part of an agricultural growth strategy.
》》 Other expenses planned in the NAIPs vary by country, sometimes involving investments in improving the policy environment and some-times dealing with investments more specific to a particular country. For example, over half of the “other” budgeted expenses in the Ivorian draft NAIP deals with investments in the for-estry and fishing industries, while Niger has a substantial investment in environmental man-agement and management of water and grazing resources it shares with neighbouring countries.
A quarter of Nigeria’s total NAIP budget is dedicated to cadastral survey as part of a long-term programme to improve land records and improve tenure security in the country. Some of Liberia’s “other” line item is dedicated to a similar effort.
Funding gap
A striking feature of all the NAIPs is how de-pendent they are on additional funds that need to be raised beyond the amounts that West African governments already have in hand or project will be provided by the private sector, including farm-ers. The NAIPs all express the hope that bilateral and multilateral funding agencies will fill the gap, which ranges from a low of 31% of the total NAIP budget for Niger to 90% for The Gambia. Some of the lower figures are misleading, however, in terms of countries’ dependence on outsiders for financ-ing the NAIPs. For example, of the 69.8% of the NAIP budget that the Niger government reports it already has on hand, 90% comes from donor funds. Thus, if fully implemented, the NAIPs would be overwhelmingly dependent on donor funds, raising a question of who really owns the programmes.
While Table 11.5 gives a broad overview of the NAIPs, more detail can be seen by looking more closely at four of them, which illustrate some of the points raised above. Appendix 11.1 examines the NAIPs of Senegal, Mali, Ghana and Nigeria, countries which are diverse in terms of their size, income levels, Francophone/Anglophone heritage, and vision for their agrifood systems; all these differences are reflected in the structure of their NAIPs. For example, Senegal’s Loi d’Orientation Agro-Sylvo-Pastorale (LOASP) has a very strong import-substitution orientation and stresses a version of food sovereignty that approaches na-tional food self-sufficiency;136 the NAIP thus calls for the country to move quickly from being one of the largest rice importers in the region to a net rice exporter. In contrast, Mali’s Loi d’Orientation Agricole (LOA), Ghana’s FASDEP and Nigeria’s basic policy documents emphasize both import substitution and export commodities, and their
136 In a publication aimed at explaining the LOASP to stakeholders, the ministry of agriculture and Water Resources defines food sovereignty as “a situation in which the country depends to the least degree possible on the exterior for its food” (Ministère de l’Agriculture et de l’Hydraulique (Sénégal), 2005) .

284
Part IV / Chapter 11 / 11.4 The emergence of ECOWAP/CAADP
NAIPs have a balance between export-product production and import substitution. While all four countries’ policy documents emphasize that a key goal of agricultural development is to reduce poverty and increase food security, both Nigeria’s and Mali’s document also emphasize farming as a business and make specific mention (missing in Senegal’s LOASP) of the role of large-scale commercial agricultural enterprises, including those involving foreign investors. The Malian, Nigerian and Ghanaian policies also emphasize more the importance of post-harvest parts of the value chains than does the Senegalese LOASP. The Ghanaian NAIP also stresses, more than the other plans, the need for intersectoral and inter-ministerial coordination of investments to boost Agricultural growth.
11.4.3 ECOWAP regional plan137
The regional programme developed by ECO-WAS aims to complement the NAIPs by incor-porating regional dimensions, managing inter-
137 This section synthesizes material presented in ECOWAS Commission, 2009a; ECOWAS Commission, 2010b; ECOWAS Commission, 2010a, and République du Sé-négal, ECOWAS and NPCA . 2010 .
dependent relationships between countries and organising their cooperation on common issues in cases where the regional level allows capturing significant economies of scale. The programme combines an investment plan with policy and regu-latory reforms regarding trade, standards, and mar-ket interventions. The first generation of subpro-grammes is designed to cover the period of 2011 through 2014, after which they will be followed by a second generation of programmes.
ECOWAP’s vision is that of “a modern and sus-tainable agriculture based on effective and efficient family farms and the promotion of agricultural enterprises through the involvement of the private sector. Once productivity and competitiveness on the intra-community and international markets are achieved, the policy should be able to guaran-tee food security and secure decent incomes for agricultural workers” (ECOWAS Commission, 2009c). The three major themes of ECOWAP are the following:
1. Increasing the productivity and competitive-ness of West African agriculture.
Table 11.5 Percentage allocation of NAIP budgets by activity*
Country
Farm-level production
(crop + livestock +
aquaculture)
Output and input marketing
and processing
Sustainable soil manage-
ment Infrastructure
Capacity strength-
eningResearch and
extension
Crisis prevention
and manage-ment; safety
nets OtherFunding gap
(%)
Benin 29.7a 42.2 22.9 5.2 71.9
Burkina Faso 36.3b 6.8 31.0 5.3 10.3 3.9 10.3 56.7
Côte d’Ivoire 26.5 3.3 17.5 4.3 18.8 29.6 89.1
The Gambia 40.5 4.3 24.1 5.4 4.1 15.5 21.6 90.0
Ghana 21.1 14.7 1.8 48.1 3.4 1.8 10.9 66.3
Liberia 28.3 2.0 8.4 27.1 6.8 5.7 12.1 21.7 81.5
Mali 38.0b 45.0 12.0 3.9 2.0 0.0 65.0
Niger 23.5 1.3 31.9 11.7 1.3 30.3 31.2
Nigeria 31.5 22.6 2.7 14.9 1.8 26.5 61.0
Senegal 59.4 5.7 11.1c 19.9 1.1 0.6 2.2 48.0
Sierra Leone 7.0 39.0 16.0 2.0 35.0 36.0 N/A
Togo 36.3 3.6 33.7 6.7 9.3 2.3 10.4 84.1
Source:Authors’calculationsbasedonNAIPdocuments.aIncludes11.8%specifictofarm-levelproductionand18.3%formechanizationofbothfarmingandprocessingb Combined investment in farm-level and rest of value chainc Includes management of soil and other natural resources* The versions of the NAIPs for Burkina Faso and Côte d’Ivoire included in Table 11 .5 were not yet validated at the time of this analysis .
285
Part IV / Chapter 11 / 11.4 The emergence of ECOWAP/CAADP
2. Implementing a free-trade area within West Africa, thereby creating a truly regional mar-ket for Agricultural goods and services within the 15-member-state zone, in line with the principles established in the ECOWAS treaty.
3. Adopting a common trade regime with coun-tries outside the region. Taken together, themes 2 and 3 imply the creation of a West African customs union (see Chapter 12).
ECOWAP also establishes implementation guidelines that define the scope and limitations of regional versus national and local actions based on the principle of subsidiarity and calls for the use of participatory approaches and the adherence to principles of consultation and shared responsibility during its implementation.
ECOWAS’s original intent was to develop the regional component of the ECOWAP/CAADP programme after the NAIPs were completed in order to identify more clearly the areas where regional action was needed to complement na-tional actions and to capture regional economies of scale. In practice, delays in the development of the NAIPs, combined with funding deadlines from the development partners, led to the develop-ment of the regional agricultural investment plan (RAIP) simultaneously with the NAIPs.
The regional ECOWAP/CAADP programme is to be implemented under the guidance of ECOWAS’s Department of Agriculture, the En-vironment and Water Resources, referred to by its French acronym, DAERE. The programme in-volves three components:
1. Three “mobilising and federating programmes” focused on investments to (a) promote strate-gic products/value chains for food sovereignty, (b) help create an overall environment condu-cive to regional agricultural development and (c) reduce vulnerability to food insecurity and promote sustainable access to food.
2. A complementary set of policy measures to spur adoption of the programmes; and
3. The institutional implementation framework, including creation of the ECOWAS Devel-opment Fund (ECOWADF) to finance the programme, a new Regional Agency for Food and Agriculture, a Consultative Committee of stakeholders, an interdepartmental Com-mittee on Food and Agriculture within the ECOWAS commission, and a monitoring and evaluation system.
Unlike the NAIPs, the RAIP does not estab-lish specific agricultural production targets since the RAIP is intended to complement the NAIPs, which focus on production at the national level. The regional programme is heavily dependent on outside funding; of the US$900 million budget for five years, ECOWAS has pledged to contribute at least US$150 million (17%), with the remaining 83% to come from outside sources.
The three mobilizing programmes
Promotion of strategic products for food sovereignty.This mobilizing programme aims at enhancing on-farm productivity and reducing food imports for certain key food products deemed “strategic” to the region.138 It focuses on products that (1) demon-strate a significant production potential within the zone, (2) correspond to the changing dietary habits of ECOWAS consumers and (3) are subject to large imports from outside the region that can be substi-tuted by taking advantage of the complementarities of the production basins within the zone and pro-moting regional trade. Based on these criteria and on a concern to keep the number of commodities lim-ited so as not to overload ECOWAS’s managerial capacity, the programme focuses on six value chains for the initial five-year programme: rice, cassava, maize, livestock, meat and related products, and fish.
The regional actions envisioned under this pro-gramme include measures to enhance access to inputs and small-scale equipment and develop input markets critical to the production of these crops, enhance animal health, upgrade livestock markets and strengthen management of shared pasture and transhumance routes across countries.
138 ECOWAP documents never explicitly define what is meant by “food sovereignty”, but in practice this term implies some degree for regional production over imports . The policy debate among member states revolves over the degree of protection (e .g . under the CET) this preference implies .

286
Part IV / Chapter 11 / 11.5 Impacts of the “rediscovery of Agriculture” especially ECOWAP/CAADP
Among the inputs, improving access to fertilizer stands out both in terms of budget allocation and number of activities envisaged.
Promotion of an environment conducive to re-gional agricultural development. The main objec-tive of this programme is to enhance the overall policy environment so that it is more conducive to the development of agricultural and agrifood commodity chains. It seeks to do this through four programme components: (1) improving the busi-ness environment of agrifood value chains through promoting regional trade in food products; (2) adapting to climate change through strength-ened regional research networks to develop more drought-resilient varieties and through improved capacity to manage shared water resources; (3) operationalization of an information and decision support system (ECOAGRIS) on food and agri-culture in the region, including improved capac-ity to monitor production systems, the food and nutrition situation, environmental and macroeco-nomic conditions, and agricultural policies across the region; and (4) strengthening institutional and human capacity through regional support to national capacity-building efforts, strengthening the coherence of regional policies, and improving the management of ECOWAP.
The reduction of food vulnerability and the pro-motion of sustainable access to food. This programme aims to develop and test improved approaches for social safety nets in urban as well as rural areas, improve the current regional crisis-prevention and management systems – for example by extending the system currently in use in the Sahelian coun-tries to the entire ECOWAS zone and adapting it to deal more adequately with system-wide crises like the 2008 world food crisis – and promote re-gional food security instruments such as a regional food security reserve. The approach in many of these components is experimental, based on pilot testing of different approaches (e.g. to social safety nets) in different countries, drawing on previous national experiences, and creating platforms to share and learn from these experiences. The inclu-sion of this mobilizing programme in the RAIP implicitly recognises that an agricultural growth agenda, to be politically palatable, needs to address
not only how to improve production incentives for Agriculture but also how to improve the access of vulnerable populations to food. It also recognises that food insecurity in West Africa is not just a rural problem but is becoming increasingly an urban problem as well.
The implementation of the plans is to be fa-cilitated through a number of policy instruments, such as regional co-financing of certain national actions in exchange for harmonization of those actions across countries, and the creation of new institutions within ECOWAS to implement the programme, such as a Regional Technical Agency for Food and Agriculture. Boxes 11.1 and 11.2 dis-cuss these policy instruments and new institutions.
11.5 Impacts of the “rediscovery of Agriculture” especially ECOWAP/CAADP
The ECOWAP/CAADP process aims to give greater priority to Agricultural growth as a central pillar of the region’s economic growth strategy; de-velop a more coherent, sector-wide and inclusive process of strategy development and implementa-tion; increase the proportion of national budgets devoted to agricultural development; and improve incentives to farmers – all with the intent of spur-ring Agricultural growth. While the NAIPs and the RAIP are only beginning to be implemented and it is thus too early to provide much assess-ment of their long-term impact on long-term Agricultural growth, this section provides some preliminary assessment of the programme’s suc-cess in addressing these various objectives in the context of broader trends in the “rediscovery of Agriculture” era since 2000.
11.5.1 Raising the visibility, coherence and inclusive-ness of agricultural policy
The ECOWAP/CAADP process has been suc-cessful in giving Agricultural development greater visibility on the political agenda of many West African countries and moved them toward more sector-wide and regionally consistent Agricultural policy and programme development. For example, the diagnostic reviews carried out as part of the
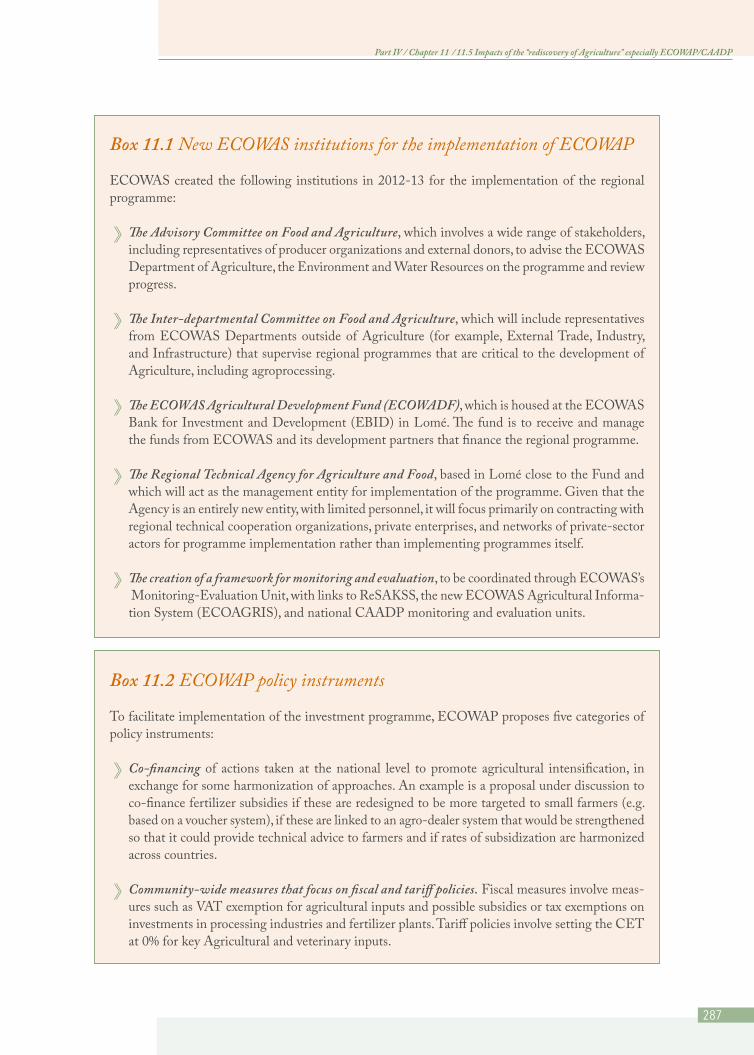
287
Part IV / Chapter 11 / 11.5 Impacts of the “rediscovery of Agriculture” especially ECOWAP/CAADP
Box 11.1 New ECOWAS institutions for the implementation of ECOWAP
ECOWAS created the following institutions in 2012-13 for the implementation of the regional programme:
》》 The Advisory Committee on Food and Agriculture, which involves a wide range of stakeholders, including representatives of producer organizations and external donors, to advise the ECOWAS Department of Agriculture, the Environment and Water Resources on the programme and review progress.
》》 The Inter-departmental Committee on Food and Agriculture, which will include representatives from ECOWAS Departments outside of Agriculture (for example, External Trade, Industry, and Infrastructure) that supervise regional programmes that are critical to the development of Agriculture, including agroprocessing.
》》 The ECOWAS Agricultural Development Fund (ECOWADF), which is housed at the ECOWAS Bank for Investment and Development (EBID) in Lomé. The fund is to receive and manage the funds from ECOWAS and its development partners that finance the regional programme.
》》 The Regional Technical Agency for Agriculture and Food, based in Lomé close to the Fund and which will act as the management entity for implementation of the programme. Given that the Agency is an entirely new entity, with limited personnel, it will focus primarily on contracting with regional technical cooperation organizations, private enterprises, and networks of private-sector actors for programme implementation rather than implementing programmes itself.
》》 The creation of a framework for monitoring and evaluation, to be coordinated through ECOWAS’s Monitoring-Evaluation Unit, with links to ReSAKSS, the new ECOWAS Agricultural Informa-tion System (ECOAGRIS), and national CAADP monitoring and evaluation units.
Box 11.2 ECOWAP policy instruments
To facilitate implementation of the investment programme, ECOWAP proposes five categories of policy instruments:
》》 Co-financing of actions taken at the national level to promote agricultural intensification, in exchange for some harmonization of approaches. An example is a proposal under discussion to co-finance fertilizer subsidies if these are redesigned to be more targeted to small farmers (e.g. based on a voucher system), if these are linked to an agro-dealer system that would be strengthened so that it could provide technical advice to farmers and if rates of subsidization are harmonized across countries.
》》 Community-wide measures that focus on fiscal and tariff policies. Fiscal measures involve meas-ures such as VAT exemption for agricultural inputs and possible subsidies or tax exemptions on investments in processing industries and fertilizer plants. Tariff policies involve setting the CET at 0% for key Agricultural and veterinary inputs.

288
Part IV / Chapter 11 / 11.5 Impacts of the “rediscovery of Agriculture” especially ECOWAP/CAADP
CAADP stock-taking exercise helped to identify many policy incoherencies and duplications of ef-fort. The ECOWAP regional programme and the PAU also represent important efforts to deal with issues that can be most effectively addressed at the regional rather than national level. In the process, they helped to mobilize and coordinate many do-nors’ support around a common set of objectives as laid out in the NAIPs and RAIP.
ECOWAP also constitutes an important step towards harmonising the objectives of various intergovernmental organizations in the region, which have been characterized by a prolifera-tion and duplication of policies and programmes. For example, in the mid-2000s, there were 45 different organizations, with overlapping man-dates, working on regional economic integration in West Africa, leading to what Broadman et al. describe as a “spaghetti bowl of regional organiza-tions” (Broadman, et al., 2007).
In many cases ECOWAP/CAADP processes involved a broader group of stakeholders than had
previously participated in the formulation of ag-ricultural policies and programmes. The degree of stakeholder engagement varied considerably by country, with farmer groups probably having had greater voice in the design of the regional pro-grammes than many of the national programmes (van Seters, et al., 2012; see also focus section B). In addition, by frequently bringing together the national CAADP teams for joint workshops during the process of developing the NAIPs, the ECOWAS Commission helped to create a com-munity of practice across the countries that shared experiences and learned from each other. This probably not only improved individual NAIP de-sign but also has laid a foundation for on-going learning from each other as the national and re-gional programmes are implemented.
11.5.2 Impacts on the level of public expenditures on Agriculture
As part of the Maputo Declaration of 2003, Afri-can governments pledged to move towards allocat-ing a minimum of 10% of government budgets to
》》 Value-chain coordination measures. Examples include creating a joint public-private committee to run the regional programme for co-financing the measures for agricultural intensification, pushing for harmonization of investment codes to foster greater private-sector investment in irrigation, and supporting the creation of regional associations of interprofessional committees that would address ways of improving coordination within individual value chains.
》》 Regulatory instruments for agricultural markets within the Community, including implementa-tion of the CET and safeguard measures (discussed in Chapter 12) and storage instruments. The latter include such measures as creating incentives for greater private storage through creation of regionally certified warehouses, from which traders would be allowed to move product to any member state; promotion of private warehousing systems and tradable warehouse receipts (war-rantage); encouragement of banks to lower interest rates for inventory credit; and harmonization of national standards for private storage. The storage initiative would also involve promotion of the mutualization of at least some portion of national security stocks to serve as a regional food security reserve, linked to safety-net programmes operated by the member states. The food security reserve initiative would also involve greater contracting with private-sector warehouse operators for the management of public stocks and the improvement of statistics on inventory levels throughout the zone (see the discussion of price volatility in Chapter 12).
》》 Improved information systems on food security to help inform the design and management of the programme focused on reducing food insecurity in both urban and rural areas.

289
Part IV / Chapter 11 / 11.5 Impacts of the “rediscovery of Agriculture” especially ECOWAP/CAADP
agricultural development. These investments were to be part of an effort to achieve a sustained 6% annual growth rate in the agricultural sector on av-erage across the continent in order to meet MDG poverty reduction goals. The individual growth rates needed per country vary depending on its extent and depth of poverty.
Data on the levels of public expenditures on Agriculture in recent years are available from ReSAKSS and from public expenditure reviews carried out for Ghana, Mali and Burkina Faso in 2013. The latter also provide information, discussed in the next section, on the quality of those expenditures. In assessing the level of spending on Agriculture, one first needs to de-fine what qualifies as Agricultural spending. The CAADP reporting of budget expenditures on Agriculture uses the UN’s Classification of the Functions of Government (COFOG), which covers expenditures through Ministries of Ag-riculture, Fisheries, Livestock, and Forestry, but not expenditure that contribute to broader rural development like rural education, health, and roads if those are financed through other ministries (Komorowska et al., 2012). Thus, the CAADP 10% target may not be an entirely reli-able indicator of national governments’ com-mitment to Agricultural development. In con-trast, the FAO’s Monitoring African Food and Agricultural Policies (MAFAP) project reports both on expenditures that are consistent with the COFOG method (which MAFAP terms “agriculture-specific” expenditures) and addi-tional spending on rural education, rural health and rural infrastructure including roads, energy and potable water, which it terms “agriculture-supportive” expenditures. The combination of agriculture-specific and agriculture-supportive expenditures is sometimes referred to in the litera-ture as COFOG+ expenditures. Under this broader definition, for example, Burkina Faso devoted 14% of its budgetary expenditures to rural development in 2010, in contrast to just under 10% to Agricul-ture as defined by COFOG (MAFAP, 2013). Al-though in theory CAADP has officially adopted the COFOG approach, in practice many ECOWAS countries include some agriculture-supportive ex-penditures in their CADAP reporting, and in
2013 the head of NEPAD publicly endorsed moving CAADP to using the COFOG+ ap-proach in evaluating countries’ performance rela-tive to the Maputo target.
Using the COFOG definitions, by 2010, three of the eight ECOWAS countries for which com-plete data are available (Mali, Niger, and Sen-egal) allocated at least 10% of their government budgets to agriculture over the period 2008-10; Burkina Faso fell just under the 10% target after having met it in the period 2003-07 (Figure 11.2). Yet for Burkina Faso, Niger and Senegal (three of the four highest performers with respect to the Maputo target shown in Figure 11.2), the share of the budget going to agriculture actu-ally fell between the two periods. Looking at a longer period from 2003 to 2009 for a larger set of countries (Appendix Table 11.4, p.309), one also notes an increasing share of the budget going to Agriculture for the powerhouses of Ni-geria and Ghana, but an declining share in Côte d’Ivoire. Indeed, a 2013 public expenditure study for Ghana (World Bank, 2013a) reports that Ghana met the 10% guideline in 2010 and 2011, although this figure seems to include at least some COFOG+ expenditures.
Thus, the increased rhetorical attention to Ag-riculture in the post 2000 era, including the CAADP period, has translated into increased relative budget allocations to agriculture in some key countries. The pattern, however, has been very inconsistent, with only a few ECOWAS countries meeting the 10% Maputo target and several decreasing their budget shares to agricul-ture over the period 2003-09 (Benin et al., 2010; Appendix table A11.4, p.309).
11.5.3 The quality of public expenditures
At least equally important to the budget share that ECOWAS countries devote to Agriculture is the quality of those expenditures – i.e., the allocation of the agriculture budget and actual expenditures among different activities. FAO’s global review of evidence regarding returns to different types of public investments in agriculture shows that investments with public-good characteristics such

290
Part IV / Chapter 11 / 11.5 Impacts of the “rediscovery of Agriculture” especially ECOWAP/CAADP
as agricultural research and development and rural infrastructure have much higher impacts on ag-ricultural growth and poverty reduction than do investments in private goods such as subsidies for inputs and productive assets (FAO, 2012a).
The analysis of NAIP planned expenditures (Table 11.5, p.284) indicates considerable varia-tion across countries with respect to broad cat-egories of planned expenditures, but with a strong emphasis in most countries on various types of in-frastructure, particularly for water control. Some countries, however, appear to be tilting actual ex-penditures, particularly in the high-price environ-ment since 2008, towards on-farm subsidies, per-haps to try to offset trade policies that have been tilted towards consumers to try to ensure their access to cheaper staples (MAFAP, 2013). For ex-ample, the MAFAP public expenditure studies for Mali and Burkina Faso indicate that while both countries have been close to or exceeded the 10% CAADP budget target throughout the 2000s, in 2009 (the last year for which comparable data are available), the countries only allocated between 4% (Mali) and 5% (Burkina Faso) of their agri-cultural expenditures to agricultural research and under 2% to extension. Payments to producers (largely subsidies on capital and variable inputs)
absorbed the largest share of any item in the budget (33% in Mali and 27% in Burkina Faso) (Yameogo et al., 2012; Komorowska, et al., 2012). In Ghana, fertilizer subsidies constituted 16.8% of the total budget of the Ministry of Food and Agriculture (MOFA) in 2010, equivalent to over three-quarters of MOFA’s investment budget for that year (World Bank, 2013a). While farm-level capital investments (as in Burkina Faso and Mali) certainly contribute to growth, one can pose the question of whether the relative allocation of resources to farm-level subsidies versus research and extension is likely to lead to the long-term sustained agricultural growth rates and structural transformation of the agrifood system called for in the NAIPs.
Planned expenditures in Senegal, as outlined in the budget of the NAIP, illustrate the same point, with less than 6% of its budget its allo-cated to strengthening marketing and process-ing compared to nearly 60% to boost farm-level production, largely through input subsidies (see Appendix Table A11.1, p.303). The NAIPs are generally silent about any strategy to phase out such subsidies over time to allow a shift to support more of the post-harvest elements of the food system that will need to evolve rapidly to meet the
Figure 11.2 Share of government budget allocated to Agriculture (%)
Source: Taondyandé, et al., 2013
25%
20%
15%
10%
0Benin
5%
Mean 2003 - 2007
Mean 2008 - 2010
Burkina Faso Côted’Ivoire Mali Niger Nigeria Senegal Togo
Target
291
Part IV / Chapter 11 / 11.5 Impacts of the “rediscovery of Agriculture” especially ECOWAP/CAADP
changing food demand in the region. The RAIP advocates a movement to more targeted, voucher-based approaches to input subsidies, yet even such programmes often have faced problems in other parts of the world (see Focus Section C, p.315).
Almost all of the NAIPs and the RAIP iden-tify the problems of access to financing as a se-rious constraint to farmers, traders, and input providers. While some of the plans propose ex-penditures on loan guarantees and other meas-ures to reduce the risk of such lending, several of the plans (e.g. those of Côte d’Ivoire and Sierra Leone) put primary emphasis on interest-rate subsidies. Global and regional experience has shown limited effectiveness of interest-rate sub-sidies in terms of targeting, sustainability and efficiency. Subsidised credit tends to be captured mainly by better-off farmers (and non-farmers) and repayment rates are usually low. Politically motivated lending decisions and frequent debt forgiveness programmes have created a culture of non-repayment in rural areas that increases the reluctance of financial institutions to lend to ag-riculture. Subsidised credit may also undermine rural savings mobilization and encourage the substitution of capital for labour in farming and processing (Adams et al., 1984; FAO and GTZ, 1998; Nagarajan and Meyer, 2005).
Loan guarantees also have a chequered history, mainly due to poor design and implementation (Meyer, 2011). Nevertheless the RAIP proposes some improvements to such tools relative to how they have been used previously in the region (e.g. limiting the amount of loan guarantees to reduce incentives for default). Overcoming the finance challenge in agricultural value chains requires a co-ordinated and coherent approach with broader policies and programmes of financial sector devel-opment and the respective key stakeholders.
11.5.4 Impacts on farmer incentives
Table 11.1 shows that in the early period of the “rediscovery of Agriculture” (2000-2004), the price incentives facing farmers in Ghana, Nigeria, and Senegal overall remained close to the trade-neutral position to which they had moved in 1995-99, but
farmers remained strongly taxed, especially for export crops, in Côte d’Ivoire. In the other three countries, export crops also were taxed, and im-port-competing agricultural products received net subsidies in all the countries except Nigeria, where they shifted from being subsidized in the previous period to being modestly taxed in 2000-04. For the four cotton-producing countries shown on Table 11.2, the changes were much more dramatic, with net taxation rates, as indicated by the NRAs, com-ing down dramatically (and in two cases becoming slight subsidies) during the 2000-05 period.
Data for 2005 through 2010 on farmers’ price incentives are available from the FAO’s MAFAP project for four West African countries – Nigeria, Ghana, Burkina Faso and Mali. At the time this AGWA report was being written, MAFAP had completed calculations of agricultural incentives using nominal rates of protection (NRPs), which measure the degree of implicit taxation or subsidy based on differences between domestic output prices and a reference price (typically the world price). The NRPs do not, however, take into ac-count taxes and subsidies on inputs, as do the nominal rate of assistance measures (NRAs) cited in Tables 11.1 and 11.2.139 The “observed NRPs at the farm level”, presented in Table 11.6, also do not take into account effects of any overvalu-ation of exchange rates, which for the CFA franc countries may have been as high as 20% during the period under review (MAFAP, 2013). Thus, the figures in Table 11.6 are not strictly compa-rable to the NRA figures in Tables 11.1 and 11.2, but they do illustrate trends in policy-induced implicit and explicit taxation of producers, based on output prices, of selected commodities in the four countries.
Table 11.6 reveals an overall pattern of net taxa-tion of farmers, based on policy-induced distor-tions of output prices, for most of the commodities in most of the countries. Furthermore, there is no broad trend across all countries towards lower taxation over time, as had been the case from the mid-1980s to the early 2000s. In Burkina Faso, for example, the net taxation fell for six commodities
139 MAFAP intends to calculate NRAs in these countries at a later stage in its analysis .

292
Part IV / Chapter 11 / 11.5 Impacts of the “rediscovery of Agriculture” especially ECOWAP/CAADP
between 2005 and 2010, rose for three and was unchanged for one; while in Mali it increased for six and declined for only two. Similarly diverse pat-terns were seen for Ghana and Nigeria. Looking across commodities, cotton was highly protected in both Mali and Burkina Faso during this period, continuing the shift noted in the earlier tables from heavy taxation towards subsidization. In these two countries, state-dominated cotton companies
pushed domestic prices above the equivalent world prices as world prices fell in the mid-2000s. In Burkina Faso, rice was also protected, as was palm oil (an import substitute). In contrast, most exports (gum Arabic, cattle and onions) in Burkina Faso were heavily taxed by existing policies. In Mali, all the cereal crops were implicitly taxed, a result, according to MAFAP, of export bans the country imposed at various times during this period to
Table 11.6 Observed nominal rates of protection at the farm level, 2005-10Country Commodity 2005 2006 2007 2008 2009 2010 Average 2005-10
Burkina Faso Arabic gum -35.7 -33.7 -29.2 -23.5 -25.7 -23.5 -28.5
Cattle -41.0 -49.0 -37.1 -31.2 -28.2 -30.1 -36.1
Cotton (Seed cotton) 0.6 6.5 41.1 45.8 61.3 65.5 36.8
Groundnuts (with shell) 19.5 13.2 -16.1 -47.5 33.4 -5.3 -0.5
Maize all -16.4 -34.6 -15.8 -15.8 -13.9 -23.0 -19.9
Onions (incl. shallots) -78.9 -41.0 -8.1 -47.3 -47.4 -65.2 -48.0
Palm oil 19.1 20.6 32.1 57.0 22.5 34.9 31.0
Rice (paddy) 30.6 14.9 38.3 34.0 15.5 29.0 27.1
Sesame 31.6 25.9 -15.8 -32.1 -15.1 -9.1 -2.4
Sorghum 0.1 39.6 36.2 3.0 -16.5 16.0 13.0
Ghana Cassava (fresh) -56.0 -38.9 -54.8 -46.3 -9.0 -39.9 -40.8
Cocoa beans -0.1 -0.2 -0.1 -0.1 -0.1 -0.1 -0.1
Groundnuts (with shell) -21.1 -12.4 -53.4 -50.3 -12.8 1.5 -24.8
Maize -10.5 -30.6 -54.6 -22.9 10.5 -57.0 -27.5
Palm oil -15.3 -10.2 -22.6 -15.5 -20.8 -18.3 -17.1
Rice (paddy) 49.7 82.9 85.1 81.1 3.3 -10.2 48.6
Sorghum -21.0 -43.4 -32.7 -7.6 -3.4 -31.9 -23.3
Yam -53.1 -62.1 -56.4 -52.7 -48.7 -29.6 -50.4
Mali Cattle 10.2 0.1 -21.9 -12.6 -19.1 -20.3 -10.6
Cotton (Seed cotton) 68.5 23.3 63.8 54.1 212.9 31.7 75.7
Cow milk 0.8 -6.6 -13.8 -23.0 11.5 -11.2 -7.1
Groundnuts (with shell) 31.3 6.1 -0.5 -20.9 -17.2 -32.0 -5.5
Maize all -8.1 35.1 -24.9 8.3 -20.3 -27.8 -6.3
Millet 23.9 -34.7 -53.8 -31.0 -61.6 -11.1 -28.1
Rice (paddy) 3.0 -4.5 -3.8 -17.1 -12.3 -32.4 -11.2
Sorghum -37.9 -41.7 -2.2 -26.5 -57.8 -13.0 -29.9
Nigeria Cassava (fresh) -0.4 -0.2 1.0 0.7 1.8 0.6
Cocoa beans -28.3 -14.6 -15.8 -27.1 -63.5 -29.8
Maize all -6.8 -9.3 -8.9 -22.0 -11.7
Palm oil -68.7 -64.6 -60.9 -24.2 -31.9 -40.6 -48.5
Rice (paddy) 30.1 -44.9 -74.4 -75.1 -68.1 -46.5
Sorghum -49.3 -58.8 -47.3 -45.2 -65.1 -66.1 -55.3
Source: MAFAP data base.

293
Part IV / Chapter 11 / 11.5 Impacts of the “rediscovery of Agriculture” especially ECOWAP/CAADP
hold down domestic consumer prices. In Ghana, rice (an import substitute) was strongly subsi-dised, while cocoa (the largest export among the products listed) faced a trade-neutral policy. In Nigeria, among the commodities listed, only cas-sava faced trade-neutral policies. It appears that net taxation of palm oil declined over the period in Nigeria but that of cocoa, another important export, increased. Paddy rice faced increasing lev-els of taxation over the period, perhaps reflecting Nigeria’s policy, discussed in Chapter 10, of fos-tering imports of rough and brown rice to allow domestic rice mills run closer to capacity.
If data were available to take into account the rise over the period of input subsidies (i.e. to allow for the calculation of NRAs rather than NRPs), the levels of taxation as shown in Table 11.6 would likely be less. Yet it is not evident from the data available that farmer incentives have strongly im-proved during the 2005-10 period. Nor is it clear that, in contrast to the earlier period, there is a uniform pattern of protecting import substitutes and taxing exports. The net taxation of producers of the commodities shown in Table 11.6 likely re-flects in part the political need for governments to hold down food prices for the growing number of the urban poor, particularly during the post-2008 period when the prices of both food and other basic
necessities such as energy rose rapidly on inter-national markets. As noted earlier, it appears that governments may have tried to compensate farm-ers for this use of trade policy to favour consumers by instituting the programmes of input subsidies.
11.5.5 Impacts on production and per capita incomes
The ultimate objective of increased government expenditures and improved policies are to increase production and incomes, thereby contributing to improved food security and poverty reduction. Figure 11.1 (p.271) indicates that over the period 2000-11, when agriculture came back on the de-velopment agenda of most West African countries, growth rates (in physical terms) of several key commodities have been positive but under 6% per year. In more recent years, however, the value of agricultural production in the region has increased, due to both greater physical output and higher prices. For example, 7 of the 15 ECOWAS coun-tries achieved the 6% growth rate in 2009; how-ever only four were able to maintain that rate in 2010 (Taondyandé, et al., 2013). Yet to achieve the CAADP poverty reduction goals, the agricultural growth rate needs to exceed 6% every year, while a characteristic of most West African countries is strong year-to-year fluctuations in the growth
30
5
0
-5
-10
Figure 11.3 Agricultural growth rates in 2008-10 in the ECOWAS countries (%)
Source: Taondyandé, et al., 2013.
10
20
15
25
Benin
Burkina Faso
Cape Verde
Côted’Ivoire
The GambiaGhana
Guinea
Guinea Bissau
Liberia Mali
Niger
Nigeria
Senegal
Sierra Le
oneTogo
ECOWAS
Coastal
Sahelian
2009
2008
2010
6% CAADP target

294
Part IV / Chapter 11 / 11.5 Impacts of the “rediscovery of Agriculture” especially ECOWAP/CAADP
rate, linked in part to variable weather conditions (Figure 11.3).
Per capita income growth in the region has also improved markedly since 2000. Table 11.4 shows that the annual growth rate of GDP per capita in the period 2000-10 improved relative to the 1986-2000 period in 13 of the 15 ECOWAS countries, was unchanged in two and fell only in one (Guinea-Bissau). Particularly strong perfor-mance was registered in Nigeria, Ghana, Cape Verde and Sierra Leone, while the poorest per-formers were Liberia and Côte d’Ivoire, countries undergoing civil wars. Like agricultural growth, per capita growth has also increased sharply in recent years (Table 11.7). Yet only in Ghana is income growing fast enough to meet the MDG 1 goal by 2015 (ibid).
While performance with respect to agricultural output and average per capita GDP has clearly improved in recent years, the average growth rate targets for CAADP mark a very strong break with the historical pattern. The 6% sustained ag-ricultural growth target is particularly ambitious. For example, the NAIPs of Senegal, Mali, and Nigeria (see Appendix to Chapter 11, p.303) call for the countries to achieve, almost instantane-ously, rates of growth in selected commodities or value chains that the countries have never before attained, and then to sustain those rates over time in a region where year-to-year production vari-ability is the norm. While some of these rates may be technically feasible, the past record gives little confidence that the institutional and incentive structures in place in these countries will lead to their achievement.
The setting of production targets in most cas-es appears to have involved working backwards from externally imposed constraints of meeting the MDG 1 poverty reduction goal. Analysts used computable general equilibrium (CGE) modelling first to calculate the overall economic growth rate needed to meet MDG 1 by 2015 or in some cases, when that seemed impossible, by 2020. Once that required economic growth rate was established, the analysts then calculated the agricultural growth rate needed to achieve the overall economic growth tar-
get. The CGE models were then used to determine the growth rates needed in the target value chains to achieve the desired overall agricultural growth rate. This “working backwards” approach is in contrast to starting with the current state of the existing value chains, then estimating, based on an inventory of available technologies and possible institutional in-novations, what would be a feasible future growth rate and finally calculating the implications of that growth rate for growth of the agricultural sector and the whole economy as well as achievement of MDG 1.140 As discussed below, setting these very ambitious production targets had major implica-tions for the structure of public spending on agri-culture. While setting ambitious targets can be part of a strategy to mobilize increased efforts to boost production, there is a danger that setting overly ambitious targets can create unrealistic expecta-tions among African governments, donors, and the general public. The expectations, if unmet, can in turn lead to disillusionment with an agriculture-led development agenda, engendering yet another set of policy reversals.
140 As noted in Appendix 11 .1, the production increases called for in Ghana’s NAIP are more modest than those in the NAIPs of Senegal, Mali and Nigeria . This may have resulted from Ghana already being on track to meet the MDG 1 goal by 2015 and thus not needing to set unrealistic goals in its NAIP to try to achieve that target .
Table 11.7 Average annual growth rates of GDP/capita, 2008-11
Country Average growth rate (%)
Benin 0.5
Burkina Faso 2.1
Cape Verde 4.1
Côte d’Ivoire -1.0
The Gambia 0.8
Ghana 6.2
Guinea 0.4
Guinea-Bissau 2.6
Liberia 6.5
Mali 1.4
Niger 0.9
Nigeria 4.4
Senegal 0.4
Sierra Leone 2.6
Togo 1.5
Source: World Bank, Africa Development Indicators, 2013

295
Part IV / Chapter 11 / 11.6 Do the CAADP policies and investments address the key demand and structural challenges facing West African Agriculture?
11.6 Do the CAADP policies and investments address the key demand and structural challenges facing West African Agriculture?
This section analyses the degree to which the CAADP programme addresses the key challenges posed by the changing nature of consumer de-mand and the structural changes needed to elicit a stronger supply response to that changing demand.
11.6.1 Responding to shifting consumer demand
On the demand side, are the policies and pro-grammes consistent with:
》》 The changing mix of commodities demanded in the region?
》》 The demand from consumers (both in the re-gion and the export market) for higher quality and safer products?
》》 The demand from processors and exporters for reliable volumes at consistent quality?
》》 The need to address the growing number of low-income consumers whose food security is endangered by food price volatility?
Commodity mix. The commodity focus of the initial ECOWAP Mobilizing Programmes of the Regional Programme (rice, maize, cassava, and livestock, meat and related products, and fish) re-flects well both the broad priorities of many of the national programmes and the changes in consump-tion and trade patterns discussed in Parts I and II of this report. One might argue that the regional programme ignores other commodities, such as fruits and vegetables, where demand is likely to rise rapidly and where regional trade opportunities exist, but keeping the focus on a small number of staples during the first phase of the programme makes sense from an implementation standpoint. The orientation at the regional level is clearly to-wards import substitution, consistent with regional concerns about reducing import dependence, but the focus solely on import-substituting products
raises the question of whether the implicit taxation of export crops to subsidize import-substituting agricultural products seen in the past will continue or even accelerate. Some of the national investment programmes, however, such as those of Nigeria and Ghana, give some emphasis to export crops in cases where the countries have an apparent compara-tive advantage and where export demand remains strong.
Quality and food safety. While the commodity focus responds well to shifting consumer demand patterns, it is less clear that the programmes put sufficient emphasis on the shifting quality de-mands emerging in the subregion – particularly for higher levels of food safety and product qual-ity. Ensuring food safety, for example, will be a growing challenge as urban consumers increas-ingly count on others to grow and prepare their foods and as they shift to eating more perishable products like vegetables and dairy products as their incomes increase. The focus-group interviews dis-cussed in Chapter 7 revealed that urban consumers in Ghana and Nigeria are increasingly concerned about food safety and the lack of reliable labelling and other information about the healthfulness of the food they consume. Food safety and quality are important from a public health and from an agri-cultural market development perspective. However, although most of the NAIPs make passing refer-ence to food safety, actions to address it receive few resources from the agriculture budgets. A few NAIPs, such as that of Ghana, set up mechanisms for interministerial coordination to address such issues, but many do not spell out how they will link with health departments to address food safety. Similarly, most NAIPs allocate only a small share of their investments to strengthening the ability of small- and medium-scale agroprocessors to meet public and private standards, e.g. through improved packaging, quality assurance and market develop-ment or discuss how the NAIPs will coordinate with other programmes that aim to do so.
Ensuring product quality and quantity – the role of wholesaling. An important element in improving consistent quality, both for consumers and proces-sors, will be strengthening the agrifood wholesal-ing system, as aggregation of raw product and its
296
Part IV / Chapter 11 / 11.6 Do the CAADP policies and investments address the key demand and structural challenges facing West African Agriculture?
segregation into lots of homogeneous quality is a key role of wholesalers. Wholesale modernization has played a key role in transforming the food sys-tems in Asia over the past ten years (Reardon, et al., 2012). In West Africa, rapid urbanization and rising incomes are putting tremendous pressures on food systems to deliver reliably the quantities and quali-ties of foods demanded by the growing cities. Agro-processors, modern retailers, and food service firms increasingly are demanding consistent and reliable supplies of foods for their operations. While the overall CAADP programme has an element (“Pillar 2”) devoted to market development, in practice, the regional CAADP plan and many of the national plans put most of their market development empha-sis on farmer-first handler relationships and the role of cooperatives in marketing farmers’ products. At the regional level, however, the proposed programme to develop regionally certified warehouses could contribute to strengthening the wholesaling func-tion and quality control for selected staples. Greater attention to public-private partnerships to foster in-creased public and private investment in wholesaling infrastructure and in innovative business practices (e.g. as called for in Ghana’s METASIP) are needed in many NAIPs to help to address what is likely to be increasingly congested urban food marketing systems in the coming ten years.
Safety nets. Several of the NAIPs and the RAIP include components to address food crisis preven-tion and management and/or the development of improved social safety nets. Their inclusion in the plans represent recognition that in an envi-ronment in which consumers spend 38% to 61% of their income on food, an Agricultural growth strategy cannot be designed independently of the need to develop sustainable safety nets. If such safety nets are not in place, governments will face strong presure from consumers during periods of hig prices to take actions that are inimical to ag-ricultural growth (imposing export bans and price controls, subsidising imports, etc.). The RAIP, in particular, has a component aimed at learning from the many different approaches to national safety nets and crisis management that have been used or are planned in the region as well as in other parts of the world in order to develop more widely ap-plicable approaches in West Africa.
11.6.2 Structural challenges of supply
Previous chapters have highlighted the need for policies to (1) capture regional economies of scale in order to drive down input costs to farmers and agroprocessors and develop more efficient research and outreach systems; (2) support collective action by actors throughout the value chains to foster more cost-effective raw-product assembly and im-prove vertical coordination; (3) pay adequate atten-tion to off-farm constraints in the agrifood system as well as farm-level constraints; and (4) strike a balance between addressing short-run constraints to expanding production and resolving longer-term structural constraints. A key element in addressing the longer-term structural constraints is develop-ing clearly articulated links with policies and pro-grammes in other sectors that affect Agricultural development but that fall outside the mandates of agricultural ministries (e.g., those captured in the COFOG+ expenditures). This section briefly as-sesses how well the ECOWAP/CAADP processes address these needs.
Capturing regional economies. The regional pro-grammes and some of the national programmes do identify some of the key issues needed to develop more reliable regional markets and better coordi-nated systems to supply agroprocessors and retail-ers. These include programmes aimed at promoting harmonization or mutual recognition of national grades and standards across countries for key prod-ucts and inputs and harmonized product registra-tion processes. The RAIP’s use of co-financing to improve the incentives for member states to coordinate their national actions in certain areas (e.g. input supply-chain development and fertilizer subsidies) is an attempt to develop a more effective way of bringing about harmonization than the previous reliance on appeals to regional solidarity. As discussed below, the main constraint here is not programme design, but implementation of regional initiatives at the national level.
Supporting collective action. The PAU and the ECOWAP/CAADP programmes all provide sup-port for the strengthening of both producer groups and interprofessional organizations. The producer organizations have the potential to improve aggre-

297
Part IV / Chapter 11 / 11.7 Missing or underemphasized policies and missing links with other policies
gation and quality control at the initial marketing levels, while interprofessional organizations offer the opportunity to improve vertical coordination through providing a platform for stakeholders throughout a value chain to come together to diagnose system-wide problems and develop tech-nical and institutional solutions (Adekunle et al., 2012; Shepherd, et al., 2009; Staatz and Ricks, 2010). To date, Senegal has had the most extensive experience in the region with interprofessional organizations, and that experience has been mixed (Duteurtre and Dieye, 2008). Whether they suc-ceed in improving vertical coordination depends on a host of characteristics, including how gov-ernment relates to them, the vision and quality of their leadership and the incentives they face to improve overall system coordination versus de-fending the short-term syndicalist interests of their members.
Balancing specific investments versus broad objec-tives. In designing their agricultural investment strategies, West African governments face the challenge of striking a balance between broad-based investments in public goods (transport in-frastructure, research and extension, market in-frastructure, information systems, etc.) and trying to target specific value chains that are deemed strategic to the country or region. The analysis of the NAIPs (Table 11.5) shows that different countries have come to different decisions regard-ing this balance. A similar question of balance arises at the policy level between broad-based reforms to improve the business climate, enhance land-tenure security, improve access to and qual-ity of financial services, etc., versus specific trade or fiscal policies aimed at specific industries or value chains. While many of the broad objectives lie outside the realm of RAIPS and the NAIPs, some (such as investment in improved agricul-tural extensions systems, vocational training in cross-cutting areas such as agricultural machinery repair, and improved market information systems) cut across value chains. MAFAP has noted in studies across Africa a tendency in recent years to redirect public investment away from such cross-cutting activities towards direct support to farmers in specific value chains (MAFAP, 2013). While focusing on select value chains is likely to
produce faster and more visible results in those specific value chains, too much focus may raise equity issues and lead to underinvestment in the basic building blocks needed to address cross-cut-ting constraints that may unlock local and private initiatives in other (non-targeted) value chains.
Intersectoral coordination. The RAIP and some of the NAIPs recognise that agricultural devel-opment transcends the domain of ministries of agriculture and thus requires coordination on policies and investments across sectors. For ex-ample, the ECOWAS regional programme creates a structure within the ECOWAS Commission (the Inter-departmental Committee on Food and Agriculture) to address intersectoral issues. The programme also creates a platform, through the Advisory Committee on Food and Agriculture, for a broad range of stakeholder input into pro-gramme implementation and evaluation. Similarly, some of the national programmes (e.g. in Senegal and Ghana) create similar structures in the office of the Prime Minister or in specialized coordi-nation units (such as agribusiness development units) within individual ministries. A recent mid-term review of Ghana’s METASIP suggests that making such interministerial coordination units work smoothly is often a challenge (KPMG and University of Ghana-Legon, 2013). As discussed more in Chapter 13, such coordination will be critical to the future development of West African agrifood systems.
11.7 Missing or underemphasized policies and missing links with other policies
Several policy areas important to Agricultural development receive insufficient attention in the NAIPs and the RAIP. In some cases, other govern-ment initiatives (as spelled out in the Poverty Re-duction Strategy Documents) may be addressing these issues, but the agricultural policy documents do not spell out clearly the articulation between the Agricultural Investment Plans (which are short- to medium-term in orientation) and some of these medium-to-longer term efforts. Among the most important of these underemphasized or missing policy areas are the following:

298
Part IV / Chapter 11 / 11.7 Missing or underemphasized policies and missing links with other policies
》》 Human capital development, both at the voca-tional and the scientific level. Modernization of West Africa’s Agriculture will require very large investments in human capital at all lev-els – from rural literacy to vocational training in modern agricultural equipment operation and maintenance to high-level scientific ca-pacity in national and regional research cen-tres. While capacity building is highlighted as a cross-cutting issue in CAADP and most NAIPs have specific components on capacity building, they are mainly aimed at strengthen-ing the skills of farmers, their organizations and interprofessional organizations. While such actions are undoubtedly important, the nation-al programmes give relatively little attention to the need to expand systems to educate the large number of agricultural and food industry technicians that will be needed in the coming years. At the university level, African faculties of agriculture focus primarily on farm-level productivity issues, with relatively little atten-tion to food science, nutrition, and packaging. Nor do the national CAADP plans give much attention to the need to replace the large num-ber of senior agricultural scientists and policy makers who are nearing retirement. African governments’ and donors’ “retreat from agri-culture” from the late 1980s to the early 2000s resulted in a missing generation of well-trained scientists and policy makers, so when those currently close to retirement leave their servic-es, there are few highly experienced colleagues waiting in wings to fill their shoes. The RAIP does address this issue with respect to develop-ing the scientific capacity to deal with climate change (calling for the graduate training of 300 agricultural scientists and policy analysts over five years to strengthen a coordinated regional programme of research on adapting to climate change) and also acknowledges the heavy needs of ECOWAS, DAERE and the new ECOWAP implementing agencies for capacity strengthening.
》》 Land tenure and water rights. Although almost all the NAIPs acknowledge the critical impor-tance of secure land tenure and water rights to agricultural development (see Focus Section
D), few have programmed activities to address these issues. In some cases (e.g. in the Nigerian NAIP), resources are allocated for cadastral surveys. Broader national policy statements, such as the agricultural orientation laws in the francophone countries, generally have sections addressing the need for land tenure reforms. Moving forward on such reforms is critical to the success of the NAIPs. Without secure tenure, the incentives of private individuals to make the investments in land improvements called for in the NAIPs will be severely reduced. Areas where NAIP investments improve wa-ter control may also face contentious debates over who has access to the improved resources. Furthermore, lack of clear land records deny local governments a source of potential funding (through land taxes) that could help finance many of the infrastructure improvements and support services needed to spur Agricultural growth.
》》 Links with industrialization policies. ECOWAS has a West African Common Industrial Policy (WACIP) that explicitly discusses challenges facing agroprocessing in the region and makes proposals to address issues of developing qual-ity standards and improving energy infrastruc-ture, which are critical to the agro-industry in the region (ECOWAS, 2010). While WACIP states that it has been designed to be coherent with ECOWAP, the ECOWAP regional in-vestment plan makes no reference to WACIP, and the proposed ECOWAP/CAADP actions to promote agroprocessing do not appear to be linked in any way to WACIP (Lambert, 2012). This is an area for greater intersectoral coordination – e.g. at the regional level through the Inter-departmental Committee on Food and Agriculture. Similarly, the NAIPs generally make no reference to national industrial poli-cies or other relevant policy frameworks such as private sector development and investment promotion.
》》 Reliable electrification. Many of the NAIPs emphasize infrastructure investment, but this is primarily focused on irrigation and rural roads. Reliable and reasonably priced electrical
299
Part IV / Chapter 11 / 11.8 Policy implementation
power, however, is critical to the development of agroprocessing, competitive local production of agricultural equipment and repair services, and the success of local production of consumer goods that could create knock-on employment opportunities in response to higher agricultural incomes. Currently, unreliable and costly elec-tricity is a major constraint to these activities in West Africa. For example, WACIP states that at current electrical rates, only Nigeria and Ghana would have a chance of being com-petitive in textile manufacture in the region (ECOWAS, 2010). While other national and regional initiatives are working to improve the reliability of the electrical grid in the region, agricultural policy documents need to stress the importance of pushing such efforts aggressively if Agriculture in the region is to prosper.
11.8 Policy implementation
While there are some policy gaps and incoheren-cies in the PAU and ECOWAP/CAADP pro-grammes at both the national and regional levels, perhaps the biggest threat to their success are po-tential implementation problems. The challenges to successful implementation are of several types:
》》 Stakeholder participation and buy-in. Successful implementation of the new plans and policies will depend strongly on the degree to which stakeholders (e.g., farmers’ organizations, other private-sector actors, and development part-ners) believe that their major concerns have been taken into account. As mentioned earlier, the degree of farmer organization involvement in developing the CAADP plans varied con-siderably by country. ROPPA (2012b) argues that producer organizations were, in general, more influential at the regional level than at the national level. This may reflect that national policy makers, acutely aware of the potential unrest caused by high food prices, implicitly gave greater weight to consumer concerns than was done at the regional level. In some coun-tries, the participation of the private sector in plan elaboration was very limited. Regarding donors, they generally were active participants
in most of the processes, but their buy-in to a truly sector-wide process remains an open question. In practice it appears that donors are picking those aspects of each plan they can support, consistent with the priorities of their own assistance programmes and frequently with their own reporting requirements, even though the aim of CAADP is to move to-wards a common reporting and monitoring and evaluation system.
》》 Buy-in by non-signatories to the Compacts. The signatories to the CAADP compacts are not the only actors in the rural development of these countries. Other donors that were not signatories (e.g. China, Brazil, and India), for-eign firms and sovereign wealth funds are all becoming increasingly important actors, inter-acting with national governments and enlarg-ing the governments’ choices and policy spaces. It is not clear the extent to which actions taken in concert with these new actors will be consist-ent with the CAADP plans.
》》 Human and institutional capital limitations. The programmes proposed in the NAIPs and the RAIP are very ambitious relative to the managerial capacities of the agencies charged with implementing them. In some cases, such as Senegal, the new activities essentially dou-ble the agricultural budget. The problem is at least equally acute at the level of the regional programme, where the human resources are very limited at the ECOWAS Department of Agriculture, Environment and Water Re-sources (DAERE), charged with managing the programme, as they are at the ECOWAS Monitoring Unit, charged with supervising the monitoring and evaluation efforts (African Un-ion et al., 2010b). In addition, several new in-stitutions, including the Fund and the Regional Technical Agency, need to be staffed. While the RAIP stresses the need for capacity building within ECOWAS, especially DAERE, these needs must not be underestimated. Given the limited capacity, by necessity the regional pro-gramme will be largely implemented through contracting with outside agencies and individu-als, but the in-house capacity of ECOWAS and

300
Part IV / Chapter 11 / 11.8 Policy implementation
the new agencies to manage all these contracts will need to be built. Furthermore, the opera-tional links and incentive structures between the DAERE and the various organizations through which the RAIP will be implemented need to be spelled out. The limits on the human resources, both at the regional and the national levels, make it imperative to resist the inevitable pressures to expand the programmes quickly in the coming years to cover more value chains and problem areas.
》》 Policy constancy. Successful cases of agricul-tural development, such as in Brazil and Thai-land, show that agricultural transformation processes require long time horizons, often decades, and need to be backed by consistent policies and a conducive institutional environ-ment (World Bank, 2009a). Moreover, these policies have generally focused on the basic public-good building blocks of agricultural development – infrastructure, human capital, technology generation and diffusion, and the rule of law. However, as noted above, past ag-ricultural development efforts in West Africa have often been characterized by short-term planning with over-ambitious targets, often focused on subsidies to try to overcome the under-investment in the basic building blocks. Some of the current CAADP investment plans have similar elements and this short-term ori-entation has been reinforced by the need to appeal to voters in the next election and by donor disbursement deadlines and reporting procedures. The ambitious production tar-gets of such crash programmes are seldom achieved, inevitably leading to disappointment and policy reversals. These reversals, in turn, undermine the confidence of the private sec-tor that government policy pronouncements can be trusted, so the private sector is un-derstandably reluctant to make the long-term investments needed to increase food system productivity. Government, in turn, often views such reluctance as proof of the incapacity or unwillingness of the private sector to respond, prompting another set of policy changes and generating a vicious cycle of policy instability (see Focus Section C). Providing a minimum
of policy constancy, focused on the key build-ing blocks, is a first step in converting these public-private deadlocks into public-private partnerships.
》》 Aligning the incentives of different actors to foster coordinated efforts. Successfully implementing both the NAIPs and the regional components of ECOWAP will require aligning incentives of participants at many different levels so that they have an interest in contributing to the success of the programmes. Examples of the different levels of actors with possibly diverse interests and incentives for policy implemen-tation include: (i) different member states; (ii) national, state and local governments within a member state; (iii) government, private actors and producer organizations; and (iv) govern-ment institutions and their employees charged with implementing the programmes. There are many examples of the current misalignment of those incentives, as evidenced by the persis-tence of widespread harassment and non-tariff barriers faced by those engaged in regional ag-ricultural trade despite nearly 30 years of ef-fort by regional organizations like CILSS and WAEMU to make regional trade more fluid. Another potential misalignment of incentives is between Nigeria and the rest of the Community regarding the regional approach. As discussed in Appendix 11.1, Nigeria’s new NAIP, the Ag-ricultural Transformation Agenda, makes no explicit mention of CAADP or regional inte-gration, raising the question of how committed Nigeria is to a regional approach to Agricultural development. The use of regional co-funding of national activities (such as targeted input subsi-dies) only if they conform to regional standards is a welcome move to go beyond moral suasion to try to ensure alignment of interests between individual member states and the Community. Similar co-funding between various levels of government (national, state, and local) at the country level also should be explored.
》》 Financing and ownership. Although CAADP is touted as an African-led, African-owned ini-tiative, the proposed CAADP investment plans for West Africa all have very large funding

301
Part IV / Chapter 11 / 11.9 Summary of key findings
gaps that the countries and ECOWAS are asking external donors to cover. This raises a question of whether the proposed programmes have a realistic chance of being implemented at the scale they have been planned. Even if they are funded, if anywhere from 60% to 90% of a programme is paid for non-Africans, it is reasonable to ask who really owns the pro-gramme. ROPPA has complained that the CAADP agenda has been increasingly cap-tured by outsiders (see Focus Section B, p.315, on stakeholder involvement in CAADP), but this may be an inevitable consequence of pro-posing overly ambitious programmes that are highly dependent on external funding.
》》 Improving governance and the general busi-ness climate. All the NAIPs and the RAIP acknowledge that good governance and re-ducing transaction costs are critical to success of the programmes. It will be important that this assertion be more than lip service. Even though several ECOWAS states have made important reforms to improve their business environments, all countries in the zone except Ghana and Cape Verde still rank among the bottom third of all countries in the world in terms of the ease of doing business (World Bank, 2012b). As long as this situation per-sists, it is hard to see how West African Ag-riculture can become competitive globally for anything other than a few tropical products where the region has a strong locational ad-vantage.
11.9 Summary of key findings
After a long period of neglect of Agriculture dur-ing the 1980s and 1990s, policies in the region have become much more supportive of Agricul-tural growth since 2000. The efforts of PAU and ECOWAP/CAADP to move countries and the subregion away from project-driven approaches to-ward a more sector-wide approach to Agricultural development offers the hope for a more coherent, less duplicative and more locally driven process. In most countries and at the regional level, the degree of stakeholder involvement, especially of farmer
groups, in the policy debate and policy design has been greater in recent years than in many previous planning exercises. This has led to a more open, democratic debate about development objectives and strategies than when previous development strategies were put together largely within govern-ment ministries.
The approach of linking national strategies in a coherent way to regional strategies, initially de-veloped through WAEMU’s PAU and then ex-tended under ECOWAP/CAADP, was done in a thoughtful manner, with clear guidelines about which activities were most appropriately national or regional. In addition, the national and regional investment plans that emerged generally focus on commodities (such as rice, cassava and ani-mal products) where demand is growing rapidly. Under CAADP, the development of National Agricultural Investment Plans (NAIPs) for all ECOWAS member states, using a similar set of methods and supported through common work-shops for national design teams, created a process of mutual learning and peer review among the national teams, which probably improved national programme designs and, if the network is main-tained, mutual learning as programme implemen-tation takes place. The regional programmes also are seeking to create incentives for states to avoid policies like trade restrictions as a means of dealing with national price volatility, as such actions only reinforce volatility at the regional level.
In spite of the progress, there remain some important policy inconsistencies and gaps. The NAIPs that emerged from the CAADP process generally put substantial emphasis on infrastruc-ture development (especially for water control), but vary considerably with respect to their bal-ance between direct expenditures to support on-farm production (e.g. through input subsidies) and investments elsewhere in the agrifood system. Many set very ambitious production goals that are both questionable from a technical standpoint and highly reliant on external funding, which may undermine local ownership of the programmes. Although these plans mention the need to develop the entire value chain, investments in marketing (particularly the development of improved food

302
Part IV / Chapter 11 / 11.9 Summary of key findings
wholesaling systems) and processing, food safety, research, and human capital development, all of which will be increasingly critical for a successful structural transformation of the food system, re-ceive relatively little emphasis in some of the plans. There is also relatively little explicit articulation, at both the national and regional levels, between agricultural investment programmes and industrial investment programmes, which generally include a focus on agroprocessing, nor with programmes aimed at improving rural electrification. While most national investment programmes also rec-ognize the critical importance of providing more secure land tenure and water rights in stimulating sustained and equitable Agricultural growth, in most cases the links between the investment pro-grammes and efforts to strengthen land and water rights are not well spelled out.
In the end, Agricultural policies are effective only if they can be implemented, and West Africa faces important challenges in strengthening the capaci-ties and incentives of individuals and institutions charged with policy implementation. Policy con-sistency over time is also crucial, as frequent policy changes can lead to a vicious cycle wherein private actors become reluctant to invest because of fear that policy changes will negate the profitability of their investments. This reluctance, in turn, often leads to a new round of policy changes as the government perceives the reluctance as signifying the incapac-ity of the private sector to play a constructive role. Considerations of policy consistency and imple-mentation both argue for keeping policy agendas and investment programmes straightforward and tightly focused, especially initially when human and institutional resources are relatively limited.
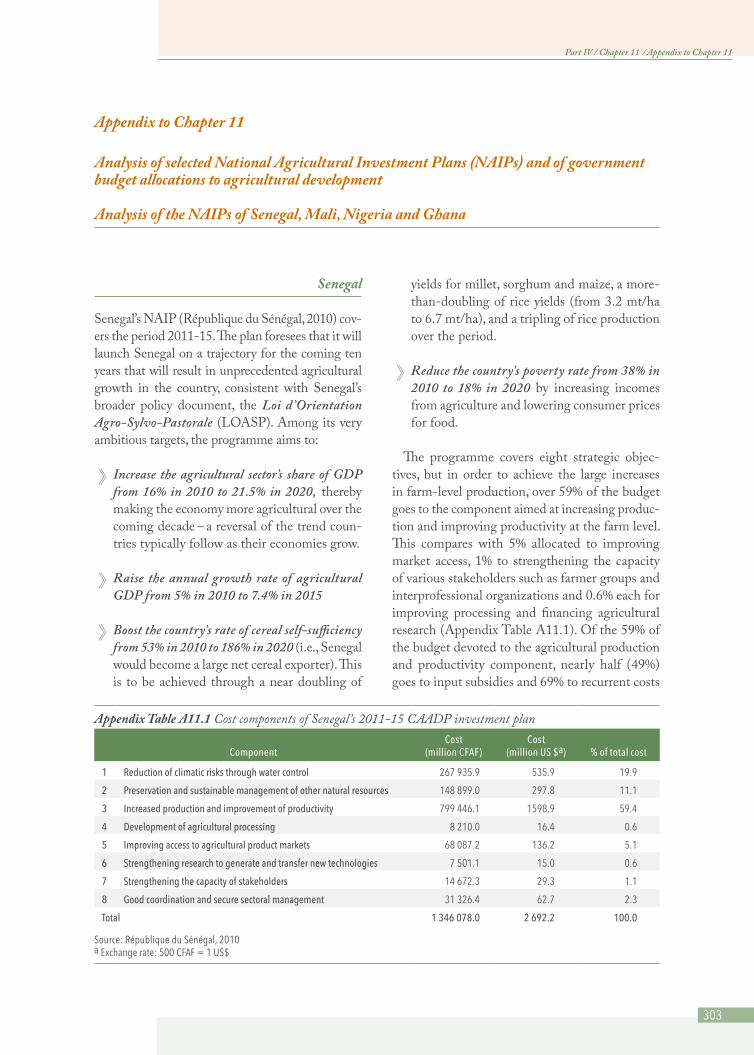
303
Part IV / Chapter 11 / Appendix to Chapter 11
Appendix to Chapter 11
Analysis of selected National Agricultural Investment Plans (NAIPs) and of government budget allocations to agricultural development Analysis of the NAIPs of Senegal, Mali, Nigeria and Ghana
Senegal
Senegal’s NAIP (République du Sénégal, 2010) cov-ers the period 2011-15. The plan foresees that it will launch Senegal on a trajectory for the coming ten years that will result in unprecedented agricultural growth in the country, consistent with Senegal’s broader policy document, the Loi d’Orientation Agro-Sylvo-Pastorale (LOASP). Among its very ambitious targets, the programme aims to:
》》 Increase the agricultural sector’s share of GDP from 16% in 2010 to 21.5% in 2020, thereby making the economy more agricultural over the coming decade – a reversal of the trend coun-tries typically follow as their economies grow.
》》 Raise the annual growth rate of agricultural GDP from 5% in 2010 to 7.4% in 2015
》》 Boost the country’s rate of cereal self-sufficiency from 53% in 2010 to 186% in 2020 (i.e., Senegal would become a large net cereal exporter). This is to be achieved through a near doubling of
yields for millet, sorghum and maize, a more-than-doubling of rice yields (from 3.2 mt/ha to 6.7 mt/ha), and a tripling of rice production over the period.
》》 Reduce the country’s poverty rate from 38% in 2010 to 18% in 2020 by increasing incomes from agriculture and lowering consumer prices for food.
The programme covers eight strategic objec-tives, but in order to achieve the large increases in farm-level production, over 59% of the budget goes to the component aimed at increasing produc-tion and improving productivity at the farm level. This compares with 5% allocated to improving market access, 1% to strengthening the capacity of various stakeholders such as farmer groups and interprofessional organizations and 0.6% each for improving processing and financing agricultural research (Appendix Table A11.1). Of the 59% of the budget devoted to the agricultural production and productivity component, nearly half (49%) goes to input subsidies and 69% to recurrent costs
Appendix Table A11.1 Cost components of Senegal’s 2011-15 CAADP investment plan
ComponentCost
(million CFAF)Cost
(million US $a) % of total cost
1 Reduction of climatic risks through water control 267 935.9 535.9 19.9
2 Preservation and sustainable management of other natural resources 148 899.0 297.8 11.1
3 Increased production and improvement of productivity 799 446.1 1598.9 59.4
4 Development of agricultural processing 8 210.0 16.4 0.6
5 Improving access to agricultural product markets 68 087.2 136.2 5.1
6 Strengthening research to generate and transfer new technologies 7 501.1 15.0 0.6
7 Strengthening the capacity of stakeholders 14 672.3 29.3 1.1
8 Good coordination and secure sectoral management 31 326.4 62.7 2.3
Total 1 346 078.0 2 692.2 100.0
Source: République du Sénégal, 2010a Exchange rate: 500 CFAF = 1 US$

304
Part IV / Chapter 11 / Appendix to Chapter 11
rather than investments. The bulk of the invest-ments are targeted at irrigation and water man-agement.
The programme’s budget thus focuses very heav-ily on increasing farm-level production in the short run through boosting input subsidies rather than on the longer-term issues of structural transfor-mation of the food system, as evidenced by the relatively small amount of resources allocated to improving marketing, processing, and the actions needed to ensure consistent product quality and quantity to processors and retailers through im-proved grades and standards and strengthened wholesaling. The programme allocates no resources explicitly to address the sensitive issue of land tenure (see the Focus Section D, p.321), although it acknowledges that failure to deal with this issue poses a serious threat to programme success.
The programme document itself raises the ques-tion of whether the heavy reliance on subsidies is sustainable (p. 10):
In fact, the efficiency of the subsidy is the subject of many debates, which deal, notably, with whether much of the subsidy is captured by intermediaries and with the sustainability of the system for public finances.
The proposed programme is costly, US$2.7 bil-lion over five years, for which national and donor funds in hand in 2010 could cover approximately half the cost. Thus, the programme faced a fund-ing gap of approximately US$1.3 billion. In terms of subsectors, the programme allocated 69% of its resources to crops, 11% to livestock, 11% to environmental programmes, 5% to fisheries, 3% to rural infrastructure and 1% to processing. In recognition that successful Agricultural devel-opment involves much more than just actions by the Ministry of Agriculture, the programme establishes a steering committee headed by the Prime Minister’s office and involving representa-tives from the Ministries of Agriculture, Economy and Finance; ECOWAS Affairs; Infrastructure; Local Government; Research; and agricultural processing and trade, as well as representatives of farmer organizations, the private sector, civil so-
ciety, and development partners. The programme document recognizes that the government’s ca-pacity to manage such a programme will be chal-lenged given current human and institutional resources, but of the 2% of the budget allocated to programme management, there is no explicit line item to expand the number of trained analysts and programme managers.
Mali
In 2010, Mali developed a Priority National Invest-ment Plan for its Agricultural sector (PNIP-SA) (République du Mali Cellule Nationale CEDEAO, 2010). The PNIP-SA represents only a portion of the country’s proposed investment plan for Agricultural development over the period 2011-15. This portion was presented to ECOWAS and development partners while the country contin-ued to develop its full ten year Agricultural Sec-tor Investment Plan (PNISA).141 The PNIP-SA is partial in the sense that even for the period 2011-15 it does not cover the major irrigated rice development efforts in the Office du Niger carried out under the country’s Initiative Riz and which the government intended to continue regardless of the views of ECOWAS and development partners. In this sense, the PNIP-SA is a transitional docu-ment as the country gradually moves to a sector-wide planning approach, which is to be embodied by the PNISA and guided by the broader policy objectives laid out in Mali’s Loi d’Orientation Agricole (LOA).
The PNIP-SA focuses on strengthening the de-velopment of value chains for maize, millet and sorghum, rice outside of Office du Niger zone, live-stock/meat, and fisheries. The document stresses the need to increase productivity in all stages of the value chain, not just at the farm level, and notes that the plan’s concern for gender equity justified focusing on certain marketing activities where women predominate. The PNIP-SA also has a component focused on cross-cutting food security activities, including nutrition education, a contribution to the national agricultural develop-
141 As of 2013, the PNISA had not been completed . Until September of that year, when elected government was restored to the country, discussions proceeded slowly due to Mali’s severe political and security crisis of 2012-13 .
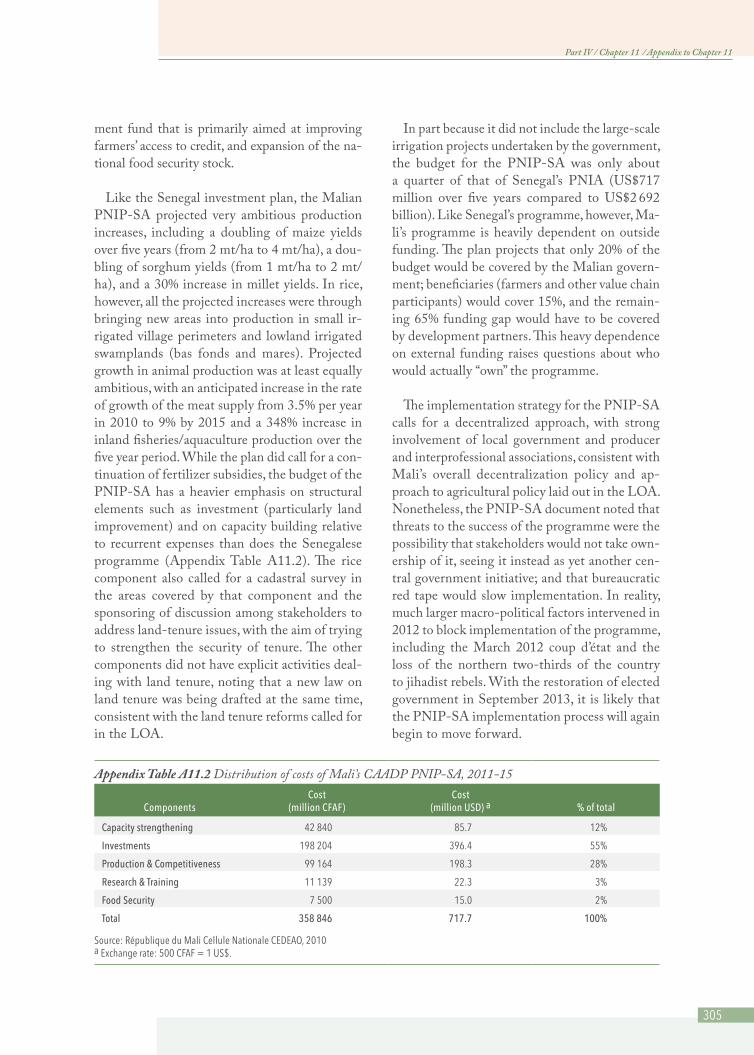
305
Part IV / Chapter 11 / Appendix to Chapter 11
ment fund that is primarily aimed at improving farmers’ access to credit, and expansion of the na-tional food security stock.
Like the Senegal investment plan, the Malian PNIP-SA projected very ambitious production increases, including a doubling of maize yields over five years (from 2 mt/ha to 4 mt/ha), a dou-bling of sorghum yields (from 1 mt/ha to 2 mt/ha), and a 30% increase in millet yields. In rice, however, all the projected increases were through bringing new areas into production in small ir-rigated village perimeters and lowland irrigated swamplands (bas fonds and mares). Projected growth in animal production was at least equally ambitious, with an anticipated increase in the rate of growth of the meat supply from 3.5% per year in 2010 to 9% by 2015 and a 348% increase in inland fisheries/aquaculture production over the five year period. While the plan did call for a con-tinuation of fertilizer subsidies, the budget of the PNIP-SA has a heavier emphasis on structural elements such as investment (particularly land improvement) and on capacity building relative to recurrent expenses than does the Senegalese programme (Appendix Table A11.2). The rice component also called for a cadastral survey in the areas covered by that component and the sponsoring of discussion among stakeholders to address land-tenure issues, with the aim of trying to strengthen the security of tenure. The other components did not have explicit activities deal-ing with land tenure, noting that a new law on land tenure was being drafted at the same time, consistent with the land tenure reforms called for in the LOA.
In part because it did not include the large-scale irrigation projects undertaken by the government, the budget for the PNIP-SA was only about a quarter of that of Senegal’s PNIA (US$717 million over five years compared to US$2 692 billion). Like Senegal’s programme, however, Ma-li’s programme is heavily dependent on outside funding. The plan projects that only 20% of the budget would be covered by the Malian govern-ment; beneficiaries (farmers and other value chain participants) would cover 15%, and the remain-ing 65% funding gap would have to be covered by development partners. This heavy dependence on external funding raises questions about who would actually “own” the programme.
The implementation strategy for the PNIP-SA calls for a decentralized approach, with strong involvement of local government and producer and interprofessional associations, consistent with Mali’s overall decentralization policy and ap-proach to agricultural policy laid out in the LOA. Nonetheless, the PNIP-SA document noted that threats to the success of the programme were the possibility that stakeholders would not take own-ership of it, seeing it instead as yet another cen-tral government initiative; and that bureaucratic red tape would slow implementation. In reality, much larger macro-political factors intervened in 2012 to block implementation of the programme, including the March 2012 coup d’état and the loss of the northern two-thirds of the country to jihadist rebels. With the restoration of elected government in September 2013, it is likely that the PNIP-SA implementation process will again begin to move forward.
Appendix Table A11.2 Distribution of costs of Mali’s CAADP PNIP-SA, 2011-15
ComponentsCost
(million CFAF)Cost
(million USD) a % of total
Capacity strengthening 42 840 85.7 12%
Investments 198 204 396.4 55%
Production & Competitiveness 99 164 198.3 28%
Research & Training 11 139 22.3 3%
Food Security 7 500 15.0 2%
Total 358 846 717.7 100%
Source: République du Mali Cellule Nationale CEDEAO, 2010a Exchange rate: 500 CFAF = 1 US$.
306
Part IV / Chapter 11 / Appendix to Chapter 11
Nigeria
Nigeria’s agricultural policies have historically been erratic, inconsistent, and characterized by uncertainty about their future evolution, which has discouraged investment and depressed production incentives. From the 1990s to 2005, however, the policies have moved towards less taxation of export agriculture and some reduction in the rates of as-sistance to import-substituting parts of the sector (as shown in Table 11.1, p.268). Since 2005, agri-cultural growth has accelerated, averaging over 7% over the period 2006-08 and becoming the main source of overall growth in the Nigerian economy (Walkenhorst, 2009; Federal Government of Ni-geria, 2010).
In 2010 Nigeria developed its NAIP, which was designed to be consistent with and build upon the government’s rolling three year strategic planning and budgeting for the sector (the Mid-Term Sec-tor Strategy, or MTSS, and the Mid-Term Budget Framework, or MTBF). It was also seen as consist-ent with the government’s prior five-point plan for agriculture and the Federal Government’s seven-point agenda for economic revitalization. The latter targets sectors deemed critical to helping Nigeria become one of the 20 largest economies in the world by 2020, focusing on power and energy, food security and agriculture, wealth creation and employment, mass transportation, land reform, security, and qualitative and functional education.
The NAIP took a value-chain approach to devel-oping Agriculture, with investments targeted not only to farm-level production, but also to market-ing, improved grades and standards for inputs, and better labelling and packaging for processed prod-ucts. The plan endorsed family farming, but also foresaw a role for large-scale commercial farming as part of the country’s growth strategy. Like the Mali and Senegal NAIPs, the Nigerian investment plan projects very rapid increases in production, including a doubling of crop productivity between 2011 and 2015, a more than doubling of milk yields per cow (from 2 000 kg/year to 5 000 kg/year) and a more than quadrupling of fish production. This would be achieved through the adoption of improved varieties of seed and brood stock by 50%
of all farmers by 2015 and 75% by 2020, a 30% increase in fertilizer use across the country, and a 50% increase in the use of animal traction and small farm machinery. As a consequence, the plan projects that the number of food-insecure house-holds would be reduced by 50% in five years and that the value of food imports would fall by 50% by 2015 and 90% by 2020. Also like the Mali and Senegal plans, the Nigerian NAIP would require a large inflow of additional funds, as the funding gap for the five year plan was estimated at US$1.6 billion.
In September 2011, just one year after the completion of its NAIP, the Federal Ministry of Agriculture and Rural Development of the newly elected government published its Agricul-tural Transformation Agenda as a component of President Goodluck Jonathan’s broader transfor-mation agenda for the Nigerian economy (Federal Government of Nigeria, 2011; Nigeria Federal Ministry of Agriculture and Rural Development, 2011). The President’s economic transformation agenda focuses on four thematic areas: governance, human capital development, infrastructure and the real sector142. Both agriculture and manufacturing (including agroprocessing) are included in the real sector, but of course their development will also de-pend strongly on progress in addressing the other three thematic areas as well.
The Agricultural Transformation Agenda lays out a vision and principles to guide Agricul-tural development policy in Nigeria as well as lessons learned from other (particularly Asian) countries’ successful Agricultural development experiences. The agenda focuses on value chains for rice, cassava, sorghum, cocoa, cotton, maize, dairy, beef, leather, poultry, oil palm and fisheries, along with revitalization of agricultural exten-sion to boost productivity growth at the farm level. Some of the approaches (e.g. the emphasis on public-private partnerships and the removal of direct government involvement in fertilizer distri-bution) are similar to those outlined in the previ-ously developed NAIP. There are also new initia-tives, however, such as the creation of marketing
142 The real sector refers to those parts of the economy that produce physical outputs as opposed to services .
307
Part IV / Chapter 11 / Appendix to Chapter 11
corporations. These are to be owned by private-sector actors but with some government support to help carry out some of the coordination func-tions of the now defunct marketing boards.
Like the earlier NAIP, the Agricultural Trans-formation Agenda sets very ambitious production goals, such as increasing the average yield of cas-sava from 10 mt/ha to 25 mt/ha in five years. The relationship between the transformation agenda and the national CAADP process is not clear from the document, but by 2013 Nigeria had presented the Agenda as driving the CAADP process in the country. The Agricultural Trans-formation Agenda is consistent with the CAADP move to a sector-wide approach, declaring that “There shall be end to the era of treating agricul-ture as a development project.” It is also consistent with the CAADP view of seeing agriculture as a major driver of broad economic growth. Yet not once in the 89-page Agricultural Transformation Agenda document or in the 208-page overall economic Transformation Agenda is CAADP or ECOWAP ever mentioned, and ECOWAS itself receives only slight mention, mainly in relation to the Common External Tariff.
The relatively small emphasis in the Agricultural Transformation Agenda on regional issues suggests that for the time being Nigeria’s strategy is to focus on internal reform of its agricultural sector, with little attention to how that agenda fits into the broader ECOWAP approach. Indeed, given the size of the Nigerian economy in the region, it may be that ECOWAP will be forced to adjust to ac-commodate Nigeria’s Agricultural Transformation Agenda rather than vice versa.
Ghana
Ghana’s NAIP was built around a process the country had already launched in 2008 to plan the implementation of Ghana’s revised Food and Ag-riculture Sector Development Policy (FASDEP II). The policy is driven by a vision of Ghanaian agriculture as “a modernised agriculture culmi-nating in a structurally transformed economy and evident in food security, employment opportuni-ties and reduced poverty” (Government of Ghana,
2010). The mechanism for the implementation of the first five years (2011-15) of FASDEP II is the Medium Term Agriculture Sector Investment Plan (METASIP), which Ghana incorporated into the CAADP process and which became the country’s NAIP.
The METASIP is built around six programmes (Annex Table A11.3), which correspond to the six objectives of FASDEP II:
》》 Food security and emergency preparedness
》》 Increased growth in incomes
》》 Increased competitiveness and enhanced integration into domestic and international markets
》》 Sustainable management of land and environment
》》 Science and technology applied in food and agriculture development
》》 Improved institutional coordination
The NAIP, consistent with the vision statement for Ghanaian agriculture, is driven by a strong view of the role of agriculture growth can play in pro-pelling structural transformation of the economy. Hence, the programme puts a large emphasis on technological change to drive productivity growth throughout the agrifood system (as evidenced in METASIP’s planned investments in science and technology), the importance of strengthening agro-processing and value-added activities, and the view that not all the poor currently in agriculture will be able to farm their way out of poverty. To ad-dress the latter problem, the food security and emergency preparedness component contains a sub-component that aims at diversifying income sources of the rural poor, including expansion of non-farm rural activities.
Ghana’s NAIP also puts stronger emphasis than those of Mali, Senegal and Nigeria, on intersec-toral and interministerial coordination, recogniz-ing that such coordination (e.g., between invest-

308
Part IV / Chapter 11 / Appendix to Chapter 11
Appendix Table A11.3 Budget of Ghana’s NAIP (METASIP), 2011-15
Programme/Component Total (million US$) % of total
Programme 1: Food security and emergency preparedness
1.1 Productivity improvement 94.3 8.9%
1.2 Improved nutrition 7.7 0.7%
1.3 Diversification of livelihood options for the poor 15.2 1.4%
1.4 Food storage and distribution 1.0 0.1%
1.5 Early warning systems and emergency preparedness 6.0 0.6%
1.6 Irrigation and water management 198.3 18.7%
1.7 Mechanization services 69.3 6.5%
Total Programme 1 391.8 36.9%
Programme 2: Increased growth in incomes
2.1 Promotion of crop, livestock and fishery production for cash 128.2 12.1%
2.2 Development of new products 7.1 0.7%
2.3 Pilot value chain development 140.2 13.2%
2.4 Intensification of FBOs and out-grower concepts 3.0 0.3%
2.5 Development of rural infrastructure 311.9 29.4%
2.6 Urban and peri-urban agriculture 1.0 0.1%
Total Programme 2 591.4 55.7%
Programme 3: Increased competiveness and enhanced integration
3.1 Marketing of Ghanaian produce domestically and internationally 16.3 1.5%
Total Programme 3 16.3 1.5%
Programme 4: Sustainable management of land and environment
4.1 Awareness creation and use of SLM technologies by men and women farmers 19.3 1.8%
Total Programme 4 19.3 1.8%
Programme 5: Science and technology for food and agricultural development
5.1 Uptake of technology along the value chain and application of biotechnology in agriculture 1.5 0.1%
5.2 Agricultural research funding and management of agricultural research information 34.6 3.3%
Total Programme 5 36.1 3.4%
Programme 6: Institutional Coordination
6.1 Institutional strengthening for intra-ministerial coordination 2.5 0.2%
6.2 Inter-ministerial coordination 0.8 0.1%
6.3 Partnership with private sector and civil society organizations 2.1 0.2%
6.4 Coordination with development partners 1.2 0.1%
Total Programme 6 6.6 0.6%
Total METASIP 1061.5 100.0%
Source: Government of Ghana, 2010.Figures converted from GHC to US$ by the authors using an average exchange rate for 2010 of GHC = 0.6927 US$

309
Part IV / Chapter 11 / Appendix to Chapter 11
ments in agricultural production and those in road construction) has been insufficient in the past. The Ministry of Food and Agriculture will take the lead for METASIP implementation, in coordi-nation with other ministries, departments, and agencies and with various stakeholder groups. The Policy Coordinating and Monitoring Unit of the Office of the President and the National Development Planning Commission will play key oversight roles. The METASIP also provides funds for coordination with stakeholder groups and with donors.
In terms of production increases (Sub-programme 1.1 and Programme 2), the METASIP focuses on both staples and selected export products, including tree crops and horticultural products. Actions to boost animal production are focused on fisheries, aquaculture and livestock that have quick repro-ductive cycles, such as poultry and small ruminants, in order to boost production quickly and to help ensure that low-income producers are not excluded from the programmes. The projected production increases over the five-year period are more mod-est than those of the NAIPs of Senegal, Mali, and Nigeria – generally on the order of 20% to
30% – driven primarily by productivity increases, including increased use of biotechnology in ag-riculture. There is also a strong value-chain ori-entation to many of the production programmes, focused on improving quality and value addition and reducing post-harvest losses.
While the plan calls for Ghana’s universities to be involved in the research component under programme 5 (via competitive grants), there is no planned funding for agricultural higher education and only minimal funding for vocational training in the skills needed in the expanding agrifood industries. Perhaps these needs will be handled through coordination with other ministries and the private sector, through the mechanisms de-scribed earlier, but this is not apparent from the plan.
The promotion of many of the agroprocessing ac-tivities under METASIP are envisioned as being carried out through public-private partnerships (PPPs). The government foresees initially financing some of the infrastructure needed and then recov-ering the funds (which total about nine percent of the total METASIP budget) from user fees from
Appendix Table A11.4 Shares of total public expenditures allocated to agriculture, 1990-2009 (%)
Country
Annual average share
(1990–1995)
Annual average % change
(1990–1995)
Annual average share
(1995-2003)
Annual average % change
(1995-2003)Share(2003)
Annual average(2003-2009)
Annual average % change
(2003-2009)
Benin 7.0 –7.2 5.4 6.0 –0.6
Burkina Faso 28.1 1.0 27.4 –4.7 25.6 19.2 –12.3
Cape Verde
Côte d’Ivoire 3.7 7.6 3.1 –4.9 2.6 2.4 –7.3
Ghana 8.5 1.8 8.6 –5.8 7.2 8.7 5.2
Guinea 21.4 13.7 –8.6
Guinea-Bissau 1.8 1.4 –9.5
Liberia 5.1
Mali 16.0 –13.9 10.0 11.8 2.7
Niger 17.5 15.5 –6.0
Nigeria 2.6 11.4 3.3 –4.8 2.8 3.6 17.7
Senegal 5.4 –0.9 6.4 2.9 8.5 12.1 17.1
Sierra Leone 2.8 2.8 –4.4
The Gambia 5.0
Togo 4.3 3.5 3.8 –6.2 2.5 4.7 29.7
Source: Benin, et al., 2010

310
Part IV / Chapter 11 / Appendix to Chapter 11
the private sector. Thus, the financial viability of the programme will depend on how effectively these PPPs are designed and implemented.
As with other NAIPs, the METASIP requires a large increase in current government funding to food and agriculture. The total 5-year cost, which the plan admits does not include the salaries of government employees charged with its imple-
mentation, is slightly over US$1 billion, of which two-thirds represents an unfunded gap that would most likely have to come from outside funders. Thus, while Ghana’s METASIP appears to be well designed to address many of the challenges facing the country’s Agricultural sector, how well it actu-ally addresses these challenges, like the rest of the NAIPs, will depend critically on its implementa-tion, including its funding strategy.