Part III Project ETP. Trigger Design for the East of ... · Part III Project ETP. Trigger Design...
38
Part III Project ETP. Trigger Design for the East of England Cosmic-Ray Spark Chamber. Supervisor – Dr. Christopher Lester. Candidate Number – 8248S. May 10 th 2010 Abstract The development of an upgrade to the existing trigger system for the East of England Spark Chamber. Development is taken from basic testing of scintillator materials through to quantitative assessment of complete systems. A design for a compact detector with efficiency close to unity and a very low noise rate is presented and tested. This system is a significant improvement on the existing system, in terms of size, whilst maintaining high efficiency. Problems associated with measuring detection efficiency are discussed and overcome. 1
-
Upload
phungkhanh -
Category
Documents
-
view
216 -
download
0
Transcript of Part III Project ETP. Trigger Design for the East of ... · Part III Project ETP. Trigger Design...
Part III Project ETP.
Trigger Design for the East of England Cosmic-Ray Spark Chamber.
Supervisor – Dr. Christopher Lester.Candidate Number – 8248S.
May 10th 2010
Abstract
The development of an upgrade to the existing trigger system for the East of England Spark Chamber. Development is taken from basic testing of scintillator materials through to quantitative assessment of complete systems. A design for a compact detector with efficiency close to unity and a very low noise rate is presented and tested. This system is a significant improvement on the existing system, in terms of size, whilst maintaining high efficiency. Problems associated with measuring detection efficiency are discussed and overcome.
1

Illustration IndexIllustration 1: Diagram of spark chamber with existing detectors........................................................................................3 Illustration 2: Diagram of chamber showing cosmic-ray, sparks and plates....................................................................3Illustration 3: Photo of SiPM coupled to WSF.....................................................................................................................4Illustration 4: Typical dark signal from SiPM, demonstrating the smallest stable peak. If the trigger level is reduced then the peak size remains constant..............................................................................................................................................5Illustration 5: Example of SiPM output as a result of multiple incident photons collected from the final device tested.. . .5Illustration 6: Taken from photonique.ch/Prod_0701BG.html.............................................................................................6Illustration 7: Photo of the electronics including power supplies, discriminators, coincidence units and counters............7Illustration 8: Block diagram of quantitative assessment set up...........................................................................................7Illustration 9: Diagram of quantitative assessment set up....................................................................................................8Illustration 10: Diagram of scintillator coupled to PMT via fish-tail light guide.................................................................9Illustration 11: Efficiency of C as a function of PMT voltage. See results for raw data....................................................10Illustration 12: Singles rate as a function of PMT operating voltage.................................................................................10Illustration 13: WSF is held against plate through combination of grease and tape. The WSF is stuck through a perspex biscuit. The face of this biscuit was polished so that the end of the WSF was flush with its surface and it is smooth. This face was then attached to the face of the PMT using a thin layer of silicon grease...........................................................11Illustration 14: Efficiency of scintillator plate coupled to PMT via WSF as a function of PMT voltage..........................12Illustration 15: Efficiency of ATLAS scintillator coupled to PMT via WSF as a function of discriminator threshold.. . .12Illustration 16: Singles rate as a function of threshold for PMT.........................................................................................13Illustration 17: Schematic of WSF interfacing with SiPM. The plastic casing slots onto the can containing the SiPM. This serves as a mechanical guide for the WSF..................................................................................................................13Illustration 18: Singles rate of SiPM as a function of threshold at a bias of 17.8V............................................................14Illustration 19: Singles rate of SiPM as function of bias at a threshold of -35mV.............................................................15Illustration 20: Efficiency as a function of bias at a threshold of -35mV...........................................................................15Illustration 21: Accidental efficiency as a function of width at a bias of 19.46V...............................................................16Illustration 22: Efficiency of ATLAS plate coupled to SiPM via WSF as a function of width..........................................16Illustration 23: Oscilloscope trace showing the early arrival of C.....................................................................................17Illustration 24: Oscilloscope trace showing closely matched arrival times of AB and C after the introduction of a delay to C.....................................................................................................................................................................................17Illustration 25: Efficiency of ATLAS plate coupled to SiPM via WSF as a function of width after the introduction of a signal delay.........................................................................................................................................................................18Illustration 26: Efficiency of small plate with greased WSF join as a function of threshold at a bias of 18.9V. Note the lower maximum efficiency compared to the ATLAS plate of greater area. This is likely a manifestation of AB paths that do not pass through C. .......................................................................................................................................................19Illustration 27: Diagram showing design of plates produced by the workshop.................................................................19Illustration 28: Diagram showing groove profile...............................................................................................................20Illustration 29: Photo of arrangement for dry holding WSF in groove..............................................................................20Illustration 30: Efficiency of final device pre-gluing.........................................................................................................21Illustration 31: Photo showing end of WSF. Note green light can be seen reflected from the white surface....................21Illustration 32: Photo showing fibre glued into groove......................................................................................................21Illustration 33: Trace showing early arrival of C compared to AB. Note that C is labelled as D on the trace...................22Illustration 34: Trace showing matched arrival times after the introduction of a delay to C.............................................22Illustration 35: Efficiency of final product as a function of threshold at a bias of 18.9V. The efficiency is independent of threshold up to a value with an acceptable singles rate.....................................................................................................23Illustration 36: Efficiency of final product in the absence of geometric concerns. Note that in the range tested the efficiency is essentially independent of threshold..............................................................................................................23Illustration 37: Singles rate of SiPM at 18.9V bias............................................................................................................24Illustration 38: Efficiency of final product as a function of threshold with A and B thresholds set high to reduce cross-talk......................................................................................................................................................................................25Illustration 39: Efficiency of final device at a bias of 18.96V with A and B on separate power supplies.........................25Illustration 40: Plot showing exponential dependence of efficiency on threshold and the accompanying R2 value.........26Illustration 41: Efficiency with A and B anti-parallel to avoid coincidences from Čerenkov radiation. ..........................26Illustration 42: Singles rate of SiPM at bias of 18.9V........................................................................................................34Illustration 43: Peak size of thermal noise..........................................................................................................................37
An index of tables can be found on page 28.
2
Introduction
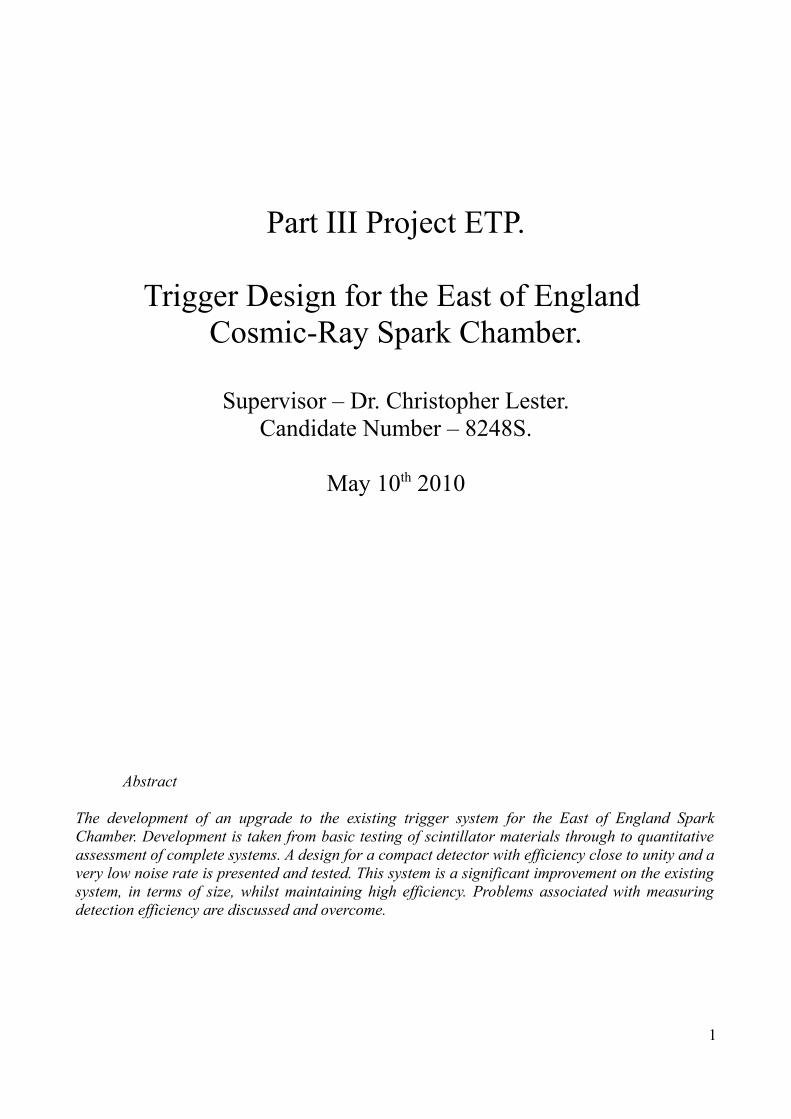
The east of England spark chamber exists to demonstrate the exciting nature of physics to school children. It will feature in the CHaOS road show. As a result it must be compact, portable and reliable. At present it is large and its set up is complex. One of the factors contributing to its large size is the particle detection system. At present it consists of two detectors both containing long, 80cm, strips of scintillator material, light guides and photomultiplier tubes. The scintillator strips may only overlap across the chamber so the total length of the detection system is around 1.5m. The chamber is approximately 22cm long and 10cm deep. Ideally the detectors used would match this size.
A spark chamber images the path of particles with a spark. When a charged particle passes through the air it leaves a trail of ionised air. This ion trail presents a path of least resistance to the formation of a spark on the application of an electric field. It is by this process that the chamber images the particle path. Within a spark chamber there are a number of metal plates. When a particle is known to have passed through the chamber a potential difference is applied between pairs of plates of sufficient magnitude to cause breakdown of the air along the particle path. This potential may only be applied momentarily if the user wishes to view the path of multiple particles as the spark will self-sustain in the presence of the electric field. It is therefore necessary to know when a particle has passed through the chamber and to be able to apply the electric field within a short period of time.
In order to produce meaningful sparks, the chamber should only be triggered when a cosmic-ray has passed through both the top and the bottom of the chamber. Particles can pass through the detector in any direction. To achieve meaningful detections only the detectors should be such that one covers the top face and the other the bottom face. When a signal is produced by
3
Illustration 1: Diagram of spark chamber with existing detectors.
Illustration 2: Diagram of chamber showing cosmic-ray, sparks and plates.

both detectors within some coincidence window, it is taken to mean that a particle has passed through the chamber and the potential across the plates is turned on. The rate of cosmic-rays passing through a surface is commonly said to be around 1 cm-2 minute-1[1]. The chamber has an area of around 220 cm2 so one would expect the detectors to output a signal at around 4Hz. The two detectors in coincidence are sensitive to some solid angle that does not cover the whole sky. This reduces the average detection rate to around 1Hz. A typical signal width is of the order of tens of nanoseconds. It is therefore reasonable to assume that coincidences are indeed caused by the same particle. In the final device tested, noise was produced at around 6Hz, with a signal width of 25ns, giving an expected rate of coincidences due to noise of .3μHz, or about once every 40 days of operation.
The format of the detector to be developed and the existing detectors is a piece of scintillator material, a light guide and a light detector sensitive to small numbers of photons. When a particle passes through the scintillator material it produces light. In the configuration used in the ATLAS tile calorimeter the plates used were expected to yield 64 photoelectrons per GeV[2]. This light is collected and directed to a photomultiplier. The output from the photomultiplier is processed and fed through a coincidence unit.
Photon detection
The ability to detect small numbers of photons is key to the project. The existing system uses photomultiplier tubes. These are bulky devices that have long been the back bone of particle physics. A smaller device, known as a silicone photomultiplier or SiPM, has been developed.
PMT
Photomultiplier tubes rely on two basic principles: the photoelectric effect and secondary emission. Incident radiation leads to the emission of an electron through the photoelectric effect. This electron is then accelerated by an electric field. It then impinges upon a dynode. This energetic electron causes the emission of a cluster of electrons. These are accelerated by another electric field. They impinge upon another dynode, leading to the emission of further electrons. This process is repeated as many times as required to achieve the desired signal size.
SiPM
The SiPM is a diode run in reverse, or back biased. This is connected to an amplification circuit. The user can control the bias voltage and the amplification factor.
Light incident on the diode causes the formation of electron-hole pairs. In the presence of the bias these are accelerated. These accelerated pairs lead to the formation of further pairs which do the same thing, leading to an avalanche effect. The output from this device is proportional to the number of initial electron-hole pairs[3]. The noise output from the device is dominated by thermal effects, that is to say electron-hole pairs produced by thermal effects are indistinguishable from those
4Illustration 3: Photo of SiPM coupled to WSF

produced by incident photons. This thermally induced dark current is of the order of a few MHz mm-2 at room temperature[3]. This is around one million times the rate of the cosmic-rays to be detected. The noise is predominantly from single electron-hole pairs.
With some effort, multiple photons can be collected from each cosmic-ray. This results in the signal from a cosmic-ray being significantly larger than the thermal noise.
5
Illustration 4: Typical dark signal from SiPM, demonstrating the smallest stable peak. If the trigger level is reduced then the peak size remains constant.
Illustration 5: Example of SiPM output as a result of multiple incident photons collected from the final device tested.

One can choose to disregard all signals below a certain magnitude and hence this apparently large noise rate can be reduced to a workable level.
The SiPM used in this project was sourced from Photonique. A data sheet of the device can be found on their website[4].
Scintillator material
The light detected by the photomultipliers is produced by the interaction of the cosmic-ray with a piece of scintillator material. The scintillation light typically produced is in the ultra violet and then shifted in wavelength to blue by phosphors within the material. Material donated by the ATLAS project was the first to be tested in this project. This material was designed to be used in a different orientation resulting in the cosmic-rays traversing a distance around a factor of 100 less in the spark chamber trigger than in the ATLAS tile calorimeter. A full discussion of this plastic scintillator can be found in the ATLAS technical design report[5]. It was found that this material produced an insufficient signal. A different plastic scintillator, sourced from a previous experiment in HEP, was then tested and found to be suitable for the purpose.
Wavelength shifting fibre.
As shown in illustration 6 the peak sensitivity of the SiPMs used is around 560nm.
It can be seen that the device is significantly more sensitive to green light than to the blue light produced in the scintillator plate. By introducing wavelength shifting fibres (WSF) it is possible to increase the wavelength to close to the peak of the sensitivity curve. The attenuation length of the WSF used is 2.8m[6]. The WSF used has a length of 1.5m. This will cause a loss of signal of 42%. The increase in photo detection efficiency resulting from the shift in wavelength more than makes up for this signal loss.
6
Illustration 6: Taken from photonique.ch/Prod_0701BG.html

Associated electronics.
The output from a PMT and from an SiPM are of variable magnitude. These signals are made usable by passing them through a discriminator. The discriminator outputs a square wave of a width that can be set by the user. The minimum input signal hight that triggers an output may also be set by the user between 30mV and 900mV.
Comparison of events to determine coincidence is required for this project. This is done using a coincidence unit. The output from this device is a square wave of user controlled width. For the device to register a coincidence an overlap of the order of 1ns is required between input signals.
The output signals from the discriminator and the coincidence unit can both be counted using a scalar. The system used was capable of counting over four channels simultaneously. The system could be set up to stop and start over multiple channels automatically. This reduces errors introduced by timing problems.
7
Illustration 8: Block diagram of quantitative assessment set up.
Illustration 7: Photo of the electronics including power supplies, discriminators, coincidence units and counters.

Development of a quantitative assessment method.
It is possible to gain a qualitative insight into whether a device is functioning by comparing the rate of coincidences with an existing detector when the sensitive areas of the device are in physical alignment and out of physical alignment. This was a useful approach during the early development of a device. It did not, however, allow for quantitative comparisons between devices.
A quantitative assessment can be preformed. This will be called the efficiency of the device. By measuring coincidences between a pair of detectors, A and B say, one can reasonably assert that a cosmic-ray has passed through both detectors when a coincidence is logged. Let this coincidence be referred to as AB. Call the output from the detector under test C. The device being tested should be placed between the detectors A and B. When a particle has been detected passing through A and B then it must also have passed through C. Count the coincidences between AB and C, referred to as AB-C. The efficiency is then defined as AB-C / AB. [7]
This method relies on consideration of possible paths the that cosmic-rays can take. The set up must be such that all paths through A and B also pass through C. It is not necessary to know the efficiency of detectors A and B. Inefficient A and B simply mean that the rate of AB is reduced and so the experiment must be run for longer to obtain results of equivalent accuracy.
Later in the project it was found that there was some cross talk between the PMTs used in A and B. When one PMT fired it caused a signal to be produced in the other at a rate around 25% of the rate of actual events. This reduced the apparent efficiency of C. This effect could be diminished by setting the discriminator thresholds to a greater value. 100mV was found to be a good compromise between false positives and the reduction in the rate of AB.
Development of coupling techniques.
Optical coupling is the process where by two materials are joined in such a way as to allow for transmission of light from one material to the other with minimal reflection. This is especially important in this application because of the low number of photons produced in each scintillation event. It is possible to use optical grease for this task, however it was decided that it would be prohibitively expensive to do this. The use of silicon grease proved sufficient in this case.
8
Illustration 9: Diagram of quantitative assessment set up.

The scintillator material used has slab geometry. The light produced in a scintillation event is radiated from the path of the cosmic-ray. If one assumes that the faces of the slab are perfectly smooth then there is some cone in which light will pass through the face of the scintillator and out side of which light will be totally internally reflected. The angle of this cone is dependent upon the refractive index of the material in accordance with Snell's law. The reflected light remains inside the slab until it reaches a perpendicular face. At this point the light may be of an angle of incidence that allows it to escape. Light that cannot escape at this point are condemned to be totally internally reflected in the perfect slab for all time. In reality this is not the case as not only is the surface of the slab not perfectly smooth but the material has an attenuation length of 47cm[8]. A typical scintillator has a refractive index of around 1.5, giving a critical angle of around 42o. From this, one can deduce that they might expect equal amounts of light to escape from the large faces of the slab and from the edges of the slab. The scintillator plates used in ATLAS have dimensions of approximately 200mm x 100mm x 3mm. A fibre of 1mm diameter could collect light from 1/3 of the edge of the plate and 1/200 of the face so in makes sense to collect light from the edges and not from the face.
Testing ATLAS scintillator.
As discussed before, the scintillator plates from ATLAS were designed for a different purpose than that proposed in this project and so it was necessary to assess how well they functioned in the new task.
Qualitative assessment.
First a qualitative assessment was made by comparing coincidence rates between an ATLAS plate coupled to a PMT and an existing scintillator-PMT system when the sensitive areas of the device were in and out of alignment. The ATLAS plate was coupled to a PMT by the use of a fish-tail light guide. The joins between the plate and the fish-tail and between the fish-tail and the PMT were greased with silicon grease. This served as an optical coupling agent and as a means of holding the components in contact.
This method yielded 580 coincidences in 10 minutes with the plates in line and 5 coincidences in 10 minutes with the plates out of line. This was sufficient confirmation of the effectiveness of the device to justify moving on to a quantitative assessment of its performance.
Quantitative assessment.
The quantitative assessment requires the introduction of another scintillator-PMT system. As in the notation introduced earlier, the reference scintillator-PMT systems will be referred to as A and B and a coincidence between them as AB. The system under test will be referred to C and a coincidence with AB referred to as AB-C. The A and B systems both contained strips of scintillator material of approximately 80cm in length. Given the size of C it is necessary to arrange A and B such that the overlap between them does not exceed this size. This was achieved by arranging them
9
Illustration 10: Diagram of scintillator coupled to PMT via fish-tail light guide.
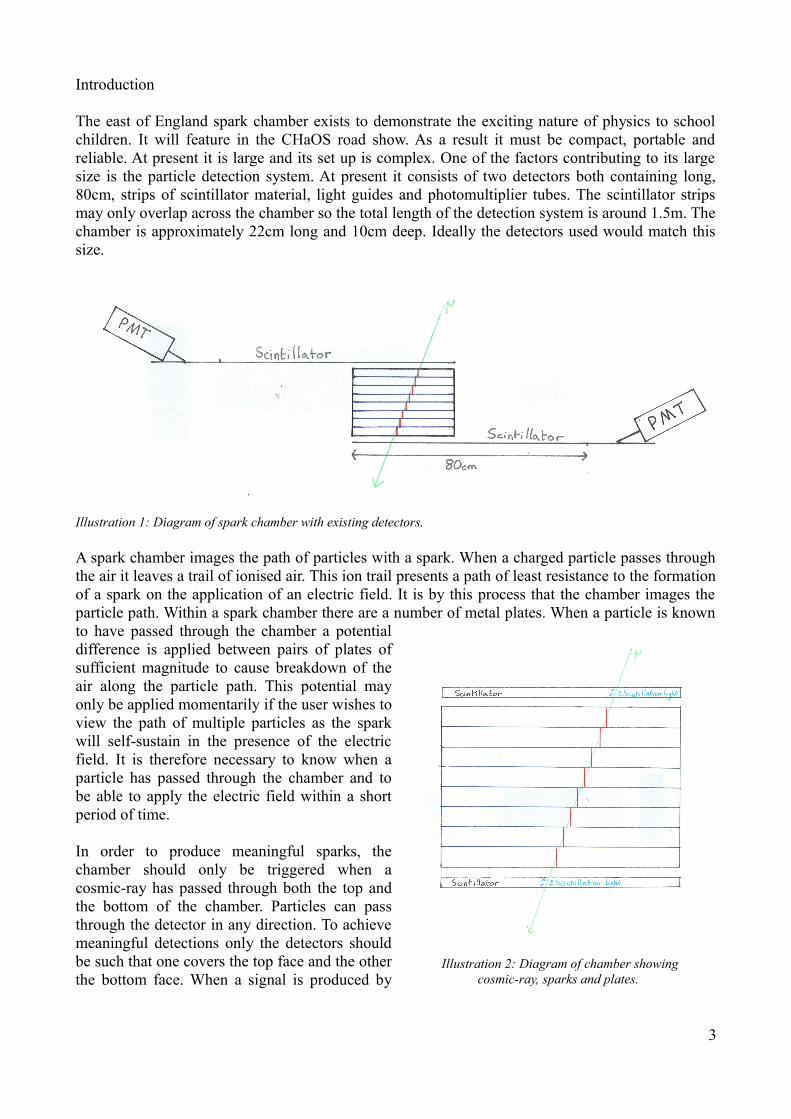
in an anti-parallel1 configuration. This configuration reduces the paths a cosmic-ray can take passing through A and B without passing through C to those of a very shallow angle. Running the PMT of the C system at 2.2kV this set up yielded an efficiency of 148 / 498, or 30%.
The discriminator units dispose of all signals below a threshold voltage and output of a PMT is dependent on its operating voltage so the dependence of the efficiency on the PMT operating voltage was measured. This was done using the same configuration as above.
Increasing the operating voltage of a PMT increases the sensitivity, illustration 11, of the detector but comes at the cost of an increasing dark count, illustration 12.
1 Anti-parallel: in opposite directions.
10
Illustration 11: Efficiency of C as a function of PMT voltage. See results for raw data.
0.0%
10.0%
20.0%30.0%
40.0%
50.0%
60.0%
70.0%80.0%
90.0%
100.0%
2 2.05 2.1 2.15 2.2 2.25 2.3 2.35 2.4 2.45 2.5
Voltage of PMT / kV
Effic
ienc
y
Illustration 12: Singles rate as a function of PMT operating voltage.
0.10
1.00
10.00
100.00
1000.00
10000.00
2 2.05 2.1 2.15 2.2 2.25 2.3 2.35 2.4 2.45 2.5
Operating Voltage / kV
Sing
les
/ Hz

Introduction of a wavelength shifting fibre (WSF).
The following experimentation was performed in a dark box. This allowed for more flexibility in testing intermediate stages in the design of the detector but also introduced problems, namely coupling between the PMTs due to a common power source. This problem will be discussed later.
Optical fibres have a minimum radius of curvature below which they become damaged. This damage is generally of the form of cracks in the outer layers of the fibre. The WSF provided by the ATLAS project is rated as having a minimum radius of curvature of 50mm[9]. A consequence of this is that the fibre cannot be held against the four sides of an approximately rectangular piece of scintillator material. It is, however, possible to have the fibre in contact with two edges of the material without complicated fibre configuration2.
To test the efficiency of this device, the scintillator plate was placed between the overlaps of A and B then AB and AB-C were recorded with the PMT at 2.4kV. This yielded a efficiency of 10399 / 17874, approximately 58.2%. To confirm that the effect was real, values of AB and AB-C were recorded again, however, this time, the plate C was placed in the dark box but not in the overlap of A and B. This yielded an 'efficiency' of 9 / 738, around 1%.
The scintillator plates used in ATLAS are wrapped in a material designed to improve the total internal reflection properties of the plate[10]. To attempt to reproduce this effect the plate was wrapped with aluminium foil with the more reflective side facing the plate. The efficiency was again measured and found to be 1466 / 2158, approximately 67.9%. This represents an improvement of around 12%. As a result all further systems tested were foil wrapped in this way.
The efficiency of this device as a function of PMT voltage was measured. The efficiency can be seen, illustration 14, to vary in a similar way to before, however the limiting value is somewhat below the value for the previous system tested outside the dark box. This is largely caused by the problem of crosstalk between A and B mentioned earlier.
2 An example of a complicated arrangement is having the fibre against each edge, with it describing a loop, away from the plate, at each corner. The result would look somewhat like a clover.
11
Illustration 13: WSF is held against plate through combination of grease and tape. The WSF is stuck through a perspex biscuit. The face of this biscuit was polished so that the end of the WSF was flush with its surface and it is smooth. This face was then attached to the face of the PMT using a thin layer of silicon grease.

Dependence on discriminator threshold.
To make an initial assessment of the effect of varying the discriminator threshold, efficiency was measured throughout the threshold range -30mV to -200mV, whilst holding all other variables constant. The thresholds of A and B were measured to be -30mV and -51mV. These were left unchanged so as to maintain consistency with previous results. The PMT associated with C was run on a voltage of 2.4kV.
The singles rate of C was also measured as a function of discriminator threshold. A rate of around 4Hz of the singles rate is due to cosmic-rays, with the rest being thermal noise. The singles rate is an important property of the system because the higher the singles rate, the higher the chance a
12
Illustration 14: Efficiency of scintillator plate coupled to PMT via WSF as a function of PMT voltage.
0.00%
10.00%
20.00%
30.00%
40.00%
50.00%
60.00%
70.00%
80.00%
2 2.05 2.1 2.15 2.2 2.25 2.3 2.35 2.4 2.45 2.5
PMT Voltage / kV
Effic
ienc
y
Illustration 15: Efficiency of ATLAS scintillator coupled to PMT via WSF as a function of discriminator threshold.
0.0%
10.0%
20.0%
30.0%
40.0%
50.0%
60.0%
70.0%
80.0%
90.0%
-200 -180 -160 -140 -120 -100 -80 -60 -40 -20 0
Threshold / mV
Effic
ienc
y

coincidence will be detected without it being caused by a cosmic-ray3.
The singles rate at a threshold of -50mV is anomalously high. The cause of this is unknown.
Replacing PMT with SiPM.
Whilst the system above represents an improvement, in terms of compactness, compared to the existing detectors for the spark chamber it is not significant enough to justify declaring this the solution. The size of the system is limited by the size of the PMT. Silicon photomultipliers (SiPM) can be used as a substitute. A SiPM in combination with an amplification circuit has a size of around 20mm x 6mm x 3mm. This is a negligible size compared to the scintillator plate. The other size advantage offered by a SiPM is that it operates at a few tens of volts, compared to the few kilovolts required by a PMT. This means that high voltage power supplies can be replaced with more compact low voltage supplies.
The face of the SiPM used has a diameter of 1mm. This is the same as the WSF.
3 See page 38.
13
Illustration 16: Singles rate as a function of threshold for PMT.
0
1000
2000
3000
4000
5000
6000
7000
-200 -180 -160 -140 -120 -100 -80 -60 -40 -20 0
Threshold / mV
Sing
les
/ Hz
Illustration 17: Schematic of WSF interfacing with SiPM. The plastic casing slots onto the can containing the SiPM. This serves as a mechanical guide for the WSF.
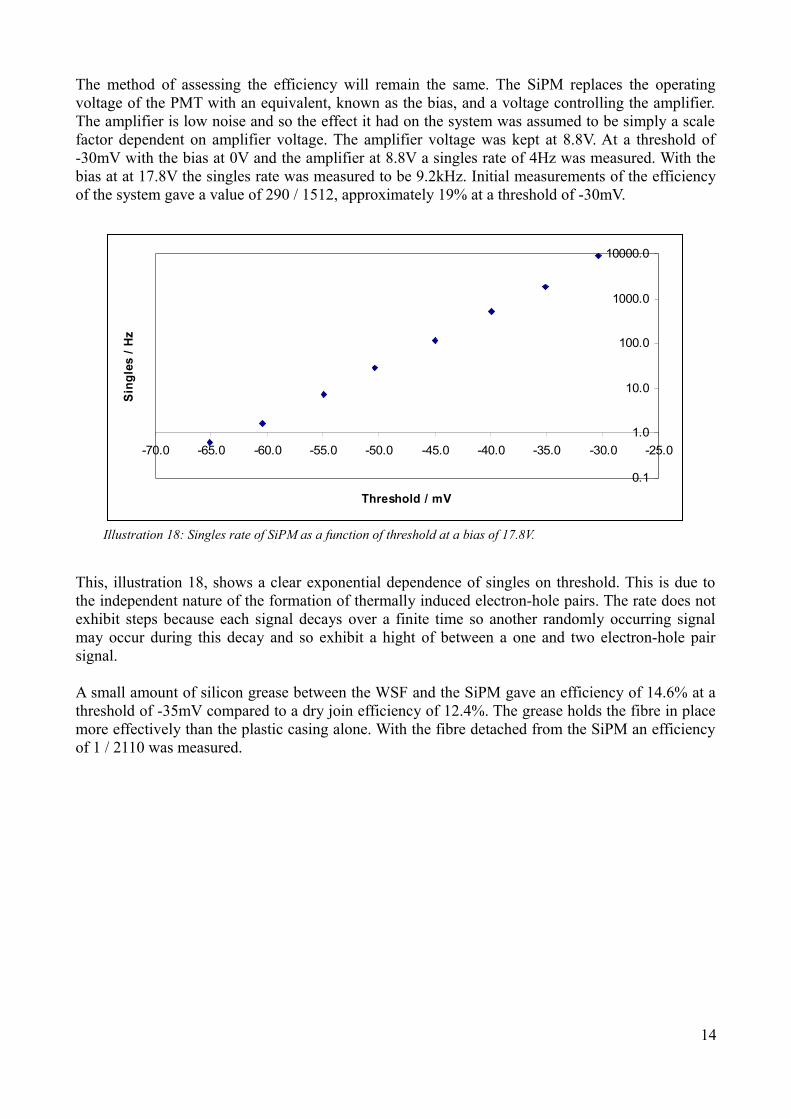
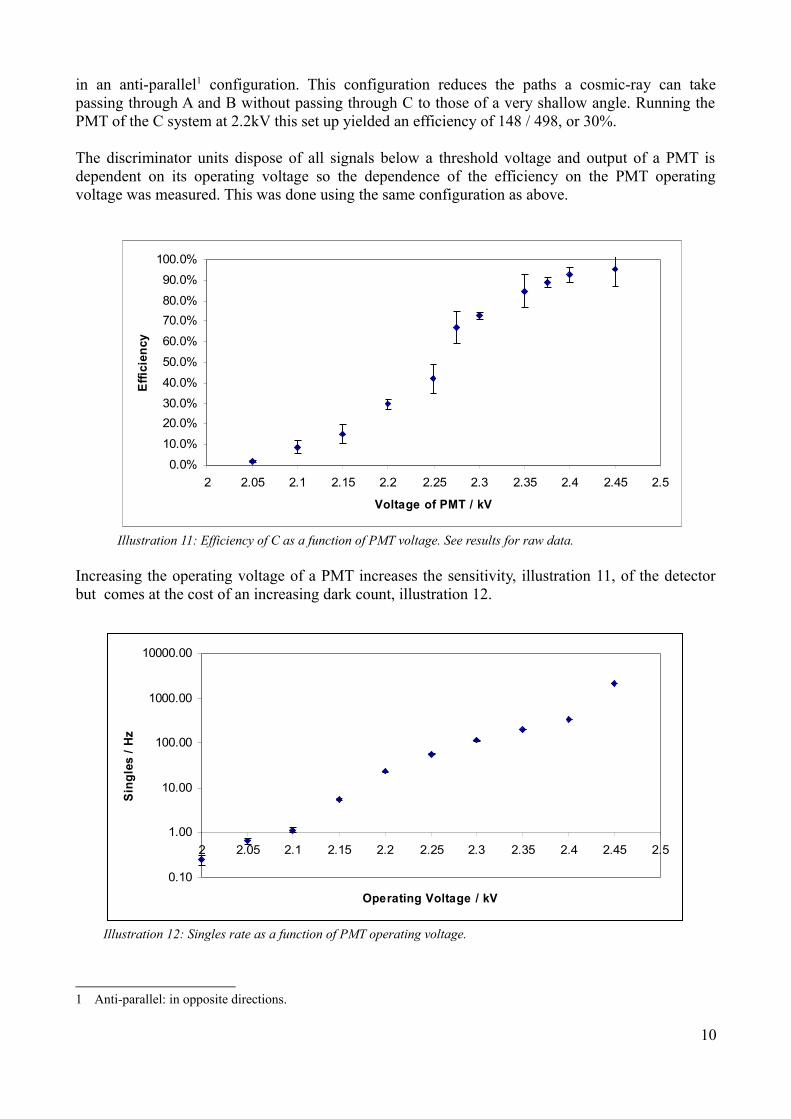
The method of assessing the efficiency will remain the same. The SiPM replaces the operating voltage of the PMT with an equivalent, known as the bias, and a voltage controlling the amplifier. The amplifier is low noise and so the effect it had on the system was assumed to be simply a scale factor dependent on amplifier voltage. The amplifier voltage was kept at 8.8V. At a threshold of -30mV with the bias at 0V and the amplifier at 8.8V a singles rate of 4Hz was measured. With the bias at at 17.8V the singles rate was measured to be 9.2kHz. Initial measurements of the efficiency of the system gave a value of 290 / 1512, approximately 19% at a threshold of -30mV.
This, illustration 18, shows a clear exponential dependence of singles on threshold. This is due to the independent nature of the formation of thermally induced electron-hole pairs. The rate does not exhibit steps because each signal decays over a finite time so another randomly occurring signal may occur during this decay and so exhibit a hight of between a one and two electron-hole pair signal.
A small amount of silicon grease between the WSF and the SiPM gave an efficiency of 14.6% at a threshold of -35mV compared to a dry join efficiency of 12.4%. The grease holds the fibre in place more effectively than the plastic casing alone. With the fibre detached from the SiPM an efficiency of 1 / 2110 was measured.
14
Illustration 18: Singles rate of SiPM as a function of threshold at a bias of 17.8V.
0.1
1.0
10.0
100.0
1000.0
10000.0
-70.0 -65.0 -60.0 -55.0 -50.0 -45.0 -40.0 -35.0 -30.0 -25.0
Threshold / mV
Sing
les
/ Hz

Effect of changing the bias.
Changing the bias has some amplification effect[4].
The singles rate for a SiPM is significantly higher than for a PMT.
At a bias of 20.86V the signal is coincident with around 6% of the AB signals when the SiPM is not coupled to the ATLAS plate.
Effect of discriminator output width.
The width of the discriminator output can be varied between 5ns and 50ns. The greater the width
15
Illustration 19: Singles rate of SiPM as function of bias at a threshold of -35mV.
0
100
200
300
400
500
600
700
800
900
17.5 18 18.5 19 19.5 20 20.5 21 21.5
Bias / V
Sing
les
rate
/ kH
z
Illustration 20: Efficiency as a function of bias at a threshold of -35mV.
0.0%
10.0%
20.0%
30.0%
40.0%
50.0%
60.0%
70.0%
17.5 18 18.5 19 19.5 20 20.5 21 21.5
Bias / V
Effic
ienc
y

the greater the chance two signals will overlap when they should not, giving rise to false positives and triggering the chamber when it ought not be. The narrower the width the higher the chance that two signals that should overlap do not, leading to a reduction in efficiency. This is due to there being some variation in signal arrival time. It is therefore important to find an optimum width. For a given width and singles rate it is possible to determine the accidental efficiency one would expect to measure4.
The efficiency of the system was measured as a function of width.
This dependence was stronger than expected so an oscilloscope was used to examine the signals from the discriminator connected to C, the coincidence unit detecting AB and the coincidence unit
4 See page 38.
16
Illustration 21: Accidental efficiency as a function of width at a bias of 19.46V.
0.00%
1.00%
2.00%3.00%
4.00%
5.00%
6.00%
7.00%8.00%
9.00%
10.00%
0 10 20 30 40 50 60
Width / ns
Acci
dent
al e
ffici
ency
Illustration 22: Efficiency of ATLAS plate coupled to SiPM via WSF as a function of width.
0.00%
5.00%
10.00%15.00%
20.00%
25.00%
30.00%
35.00%40.00%
45.00%
50.00%
0 10 20 30 40 50 60
Width / ns
Effic
ienc
y

detecting AB-C. The signal from C was seen to start around 40ns before the signal from AB started.
Greater width allows for the signals to overlap more often. To improve this situation, a delay, in the form of a length of cable, of 42ns was introduced.
17
Illustration 23: Oscilloscope trace showing the early arrival of C.
Illustration 24: Oscilloscope trace showing closely matched arrival times of AB and C after the introduction of a delay to C.
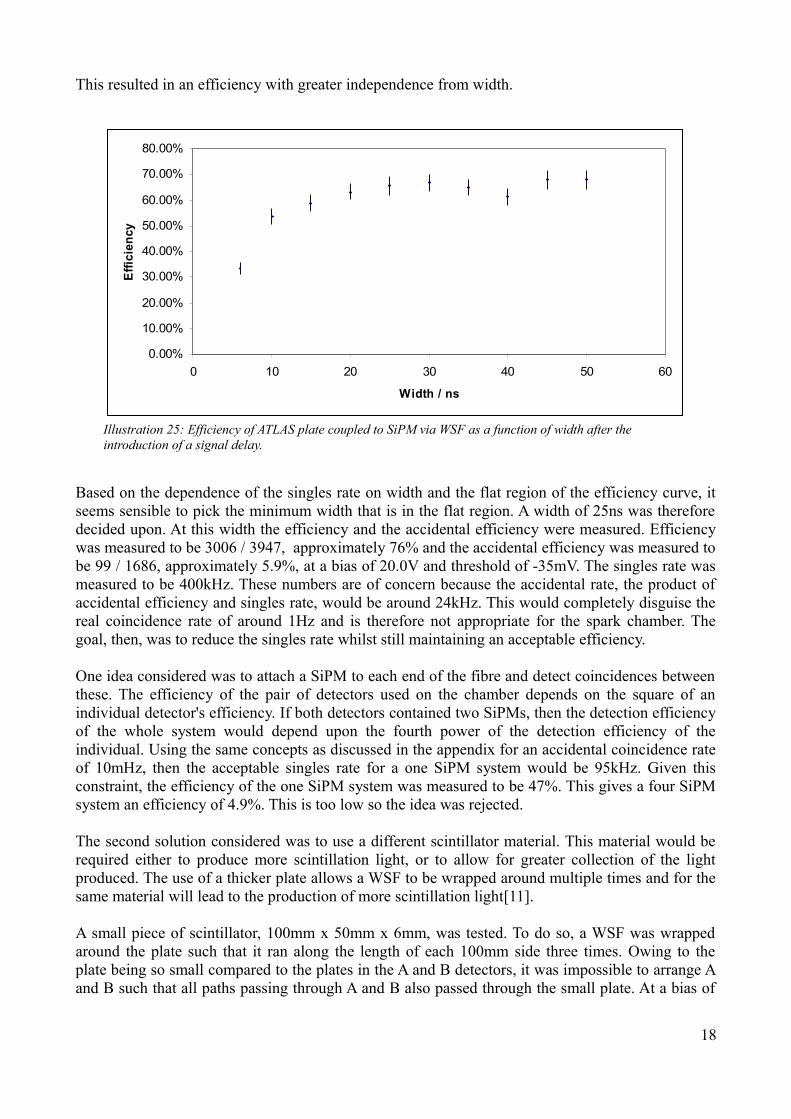
This resulted in an efficiency with greater independence from width.
Based on the dependence of the singles rate on width and the flat region of the efficiency curve, it seems sensible to pick the minimum width that is in the flat region. A width of 25ns was therefore decided upon. At this width the efficiency and the accidental efficiency were measured. Efficiency was measured to be 3006 / 3947, approximately 76% and the accidental efficiency was measured to be 99 / 1686, approximately 5.9%, at a bias of 20.0V and threshold of -35mV. The singles rate was measured to be 400kHz. These numbers are of concern because the accidental rate, the product of accidental efficiency and singles rate, would be around 24kHz. This would completely disguise the real coincidence rate of around 1Hz and is therefore not appropriate for the spark chamber. The goal, then, was to reduce the singles rate whilst still maintaining an acceptable efficiency.
One idea considered was to attach a SiPM to each end of the fibre and detect coincidences between these. The efficiency of the pair of detectors used on the chamber depends on the square of an individual detector's efficiency. If both detectors contained two SiPMs, then the detection efficiency of the whole system would depend upon the fourth power of the detection efficiency of the individual. Using the same concepts as discussed in the appendix for an accidental coincidence rate of 10mHz, then the acceptable singles rate for a one SiPM system would be 95kHz. Given this constraint, the efficiency of the one SiPM system was measured to be 47%. This gives a four SiPM system an efficiency of 4.9%. This is too low so the idea was rejected.
The second solution considered was to use a different scintillator material. This material would be required either to produce more scintillation light, or to allow for greater collection of the light produced. The use of a thicker plate allows a WSF to be wrapped around multiple times and for the same material will lead to the production of more scintillation light[11].
A small piece of scintillator, 100mm x 50mm x 6mm, was tested. To do so, a WSF was wrapped around the plate such that it ran along the length of each 100mm side three times. Owing to the plate being so small compared to the plates in the A and B detectors, it was impossible to arrange A and B such that all paths passing through A and B also passed through the small plate. At a bias of
18
Illustration 25: Efficiency of ATLAS plate coupled to SiPM via WSF as a function of width after the introduction of a signal delay.
0.00%
10.00%
20.00%
30.00%
40.00%
50.00%
60.00%
70.00%
80.00%
0 10 20 30 40 50 60
Width / ns
Effic
ienc
y

18.9V a dry join between the WSF and the plate gave an efficiency of 700 / 1562, approximately 45%, at a threshold of -30mV and 180 / 1032, approximately 17%, at -45mV. Greasing the join gave an efficiency of 208 / 478, approximately 44%, at a threshold of -45mV.
This set up shows a drop in efficiency at a threshold of around -45mV. The singles rate drops to an acceptable level at this bias at a threshold of around -65mV.
In order to progress with the project, it was decided that a plate appropriate to the chamber should be built and tested. A plate was designed, in consultation with the Cavendish workshop. Several sections of scintillator plate measuring 250mm x 50mm x 6mm were available. It was decided that in order to match the dimensions of the spark chamber, two of these plates should be glued together along the long edge. This results in a plate of 250mm x 100mm x 6mm. Given the chamber is around 220mm long then the plate required shortening. It was also decided that, given the design was to be compact, the corners of the plate should be rounded, owing to the radius of curvature restrictions on the WSF. The workshop was commissioned to machine four of the 250mm x 50mm x 6mm plates into plates with maximum length 220mm, with quarter circular ends of radius of curvature 45mm. Whilst this radius of curvature is less than the minimum stated for the WSF it was decided that the degradation of the fibres in this configuration would not adversely effect the performance of the end product.
19
Illustration 26: Efficiency of small plate with greased WSF join as a function of threshold at a bias of 18.9V. Note the lower maximum efficiency compared to the ATLAS plate of greater area. This is likely a manifestation of AB paths that do not pass through C.
0.0%
10.0%
20.0%
30.0%
40.0%
50.0%
60.0%
70.0%
-75.0 -70.0 -65.0 -60.0 -55.0 -50.0 -45.0 -40.0 -35.0 -30.0 -25.0
Threshold / mV
Effic
ienc
y
Illustration 27: Diagram showing design of plates produced by the workshop.

The workshop was also asked to machine a groove into the edge of the plates into which the WSF could be glued.
These were joined together using an optical cement. A WSF was laid dry into the groove. The fibre was wrapped around the plate three times.
The device was tested at this stage. The results are shown in illustration 30.
20
Illustration 29: Photo of arrangement for dry holding WSF in groove.
Illustration 28: Diagram showing groove profile.

Illustration 29 shows the extra equipment required to hold the WSF into place in the groove without glue. The WSF was then glued into the groove using optical cement in order to provide better optical coupling and to do away with the need for the extras seen above. A small length of fibre, around 50mm, was left free to allow the SiPM to be joined.
The device was tested first by looking at the signals from AB and from the discriminator C on an oscilloscope. The signal from C was found to start 25-30ns before the AB signal.
21
Illustration 30: Efficiency of final device pre-gluing.
0.0%
10.0%
20.0%
30.0%
40.0%
50.0%
60.0%
70.0%
80.0%
-95.0 -85.0 -75.0 -65.0 -55.0 -45.0 -35.0 -25.0
Threshold / mV
Effic
ienc
y
Illustration 32: Photo showing fibre glued into groove. Illustration 31: Photo showing end of WSF. Note green light can be seen reflected from the white surface.

A delay, again in the form of a length of cable, of 28ns was introduced.
22
Illustration 33: Trace showing early arrival of C compared to AB. Note that C is labelled as D on the trace.
Illustration 34: Trace showing matched arrival times after the introduction of a delay to C.
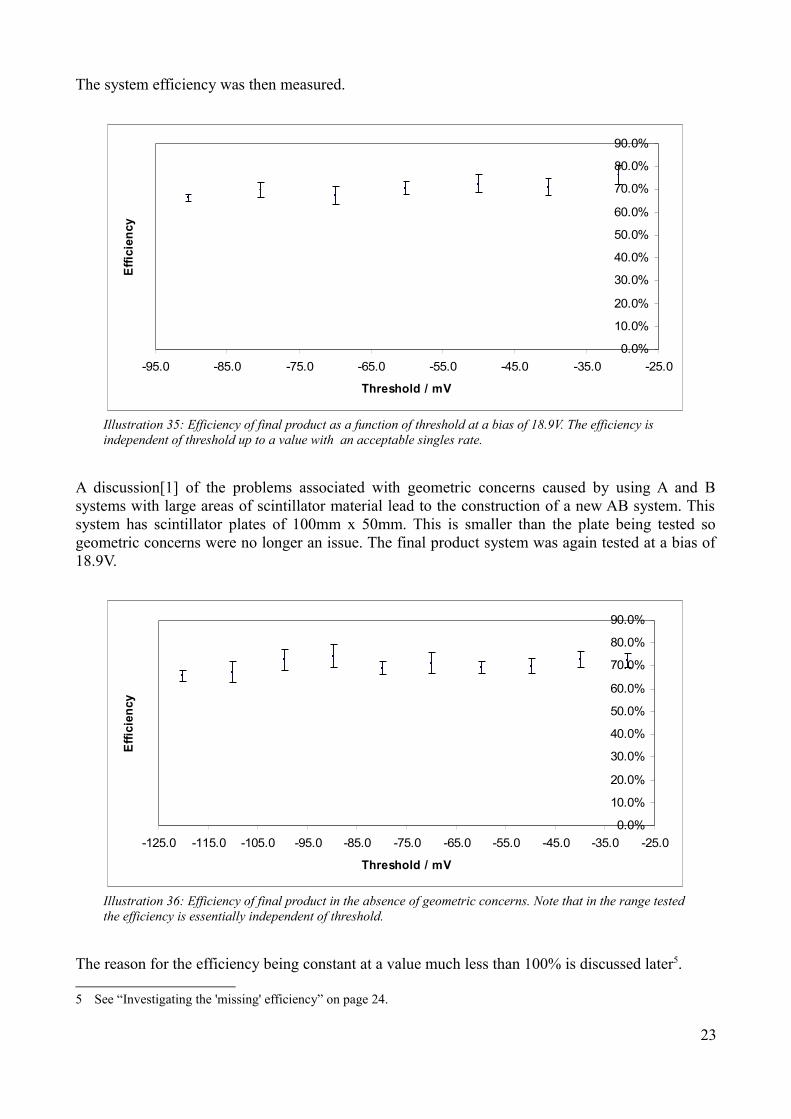
The system efficiency was then measured.
A discussion[1] of the problems associated with geometric concerns caused by using A and B systems with large areas of scintillator material lead to the construction of a new AB system. This system has scintillator plates of 100mm x 50mm. This is smaller than the plate being tested so geometric concerns were no longer an issue. The final product system was again tested at a bias of 18.9V.
The reason for the efficiency being constant at a value much less than 100% is discussed later5.
5 See “Investigating the 'missing' efficiency” on page 24.
23
Illustration 35: Efficiency of final product as a function of threshold at a bias of 18.9V. The efficiency is independent of threshold up to a value with an acceptable singles rate.
0.0%
10.0%
20.0%
30.0%
40.0%
50.0%
60.0%
70.0%
80.0%
90.0%
-95.0 -85.0 -75.0 -65.0 -55.0 -45.0 -35.0 -25.0
Threshold / mV
Effic
ienc
y
Illustration 36: Efficiency of final product in the absence of geometric concerns. Note that in the range tested the efficiency is essentially independent of threshold.
0.0%
10.0%
20.0%
30.0%
40.0%
50.0%
60.0%
70.0%
80.0%
90.0%
-125.0 -115.0 -105.0 -95.0 -85.0 -75.0 -65.0 -55.0 -45.0 -35.0 -25.0
Threshold / mV
Effic
ienc
y
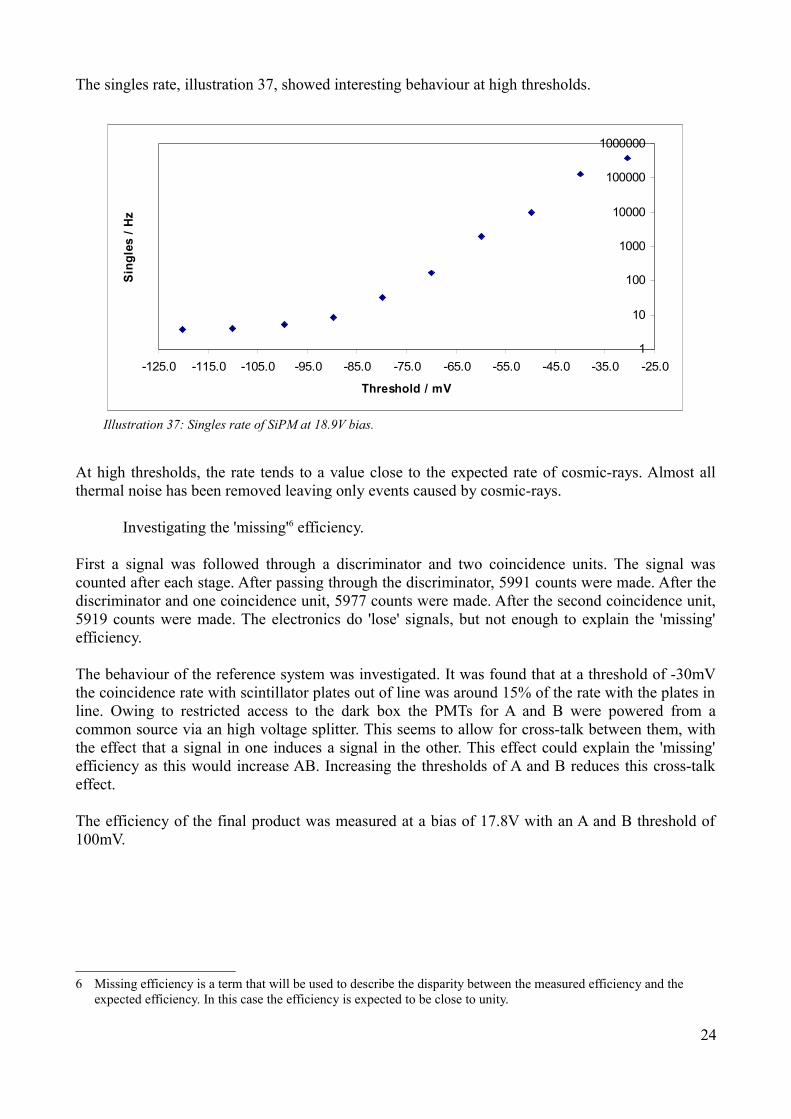
The singles rate, illustration 37, showed interesting behaviour at high thresholds.
At high thresholds, the rate tends to a value close to the expected rate of cosmic-rays. Almost all thermal noise has been removed leaving only events caused by cosmic-rays.
Investigating the 'missing'6 efficiency.
First a signal was followed through a discriminator and two coincidence units. The signal was counted after each stage. After passing through the discriminator, 5991 counts were made. After the discriminator and one coincidence unit, 5977 counts were made. After the second coincidence unit, 5919 counts were made. The electronics do 'lose' signals, but not enough to explain the 'missing' efficiency.
The behaviour of the reference system was investigated. It was found that at a threshold of -30mV the coincidence rate with scintillator plates out of line was around 15% of the rate with the plates in line. Owing to restricted access to the dark box the PMTs for A and B were powered from a common source via an high voltage splitter. This seems to allow for cross-talk between them, with the effect that a signal in one induces a signal in the other. This effect could explain the 'missing' efficiency as this would increase AB. Increasing the thresholds of A and B reduces this cross-talk effect.
The efficiency of the final product was measured at a bias of 17.8V with an A and B threshold of 100mV.
6 Missing efficiency is a term that will be used to describe the disparity between the measured efficiency and the expected efficiency. In this case the efficiency is expected to be close to unity.
24
Illustration 37: Singles rate of SiPM at 18.9V bias.
1
10
100
1000
10000
100000
1000000
-125.0 -115.0 -105.0 -95.0 -85.0 -75.0 -65.0 -55.0 -45.0 -35.0 -25.0
Threshold / mV
Sing
les
/ Hz

This configuration shows an efficiency of close to 100% at low thresholds. Using the lower bias reduces the singles rate considerably compared to a bias of 18.9V.
Adjusting the set up such that A and B were on separate power supplies was possible at this stage. Measurements of the device efficiency were again taken, this time at a bias of 18.96V.
This configuration shows a constant efficiency of around 93% down to a threshold of -80mV. The region from -300mV to -120mV can be well described, having R2 = 0.9956, by an exponential
25
Illustration 38: Efficiency of final product as a function of threshold with A and B thresholds set high to reduce cross-talk.
0.0%
10.0%
20.0%30.0%
40.0%
50.0%
60.0%
70.0%80.0%
90.0%
100.0%
-105.0 -95.0 -85.0 -75.0 -65.0 -55.0 -45.0 -35.0 -25.0
Threshold / mV
Effic
ienc
y
Illustration 39: Efficiency of final device at a bias of 18.96V with A and B on separate power supplies.
0.0%
10.0%
20.0%
30.0%
40.0%
50.0%
60.0%
70.0%
80.0%
90.0%
100.0%
-210 -190 -170 -150 -130 -110 -90 -70 -50 -30
Threshold / mV
Effi
cien
cy

dependence on threshold.
The configuration of A and B was such that the light guides coupling the scintillator material to the PMTs were in vertical alignment. It was thought possible that light was being produced in the light guides via Čerenkov radiation[1] . To test this A and B were aligned anti-parallel such that the only overlap was the scintillator material.
This configuration yields an efficiency of around 98%. The electronics were found to lose some signals, around 1%. When this is taken into account, the efficiency of this device is close to unity.
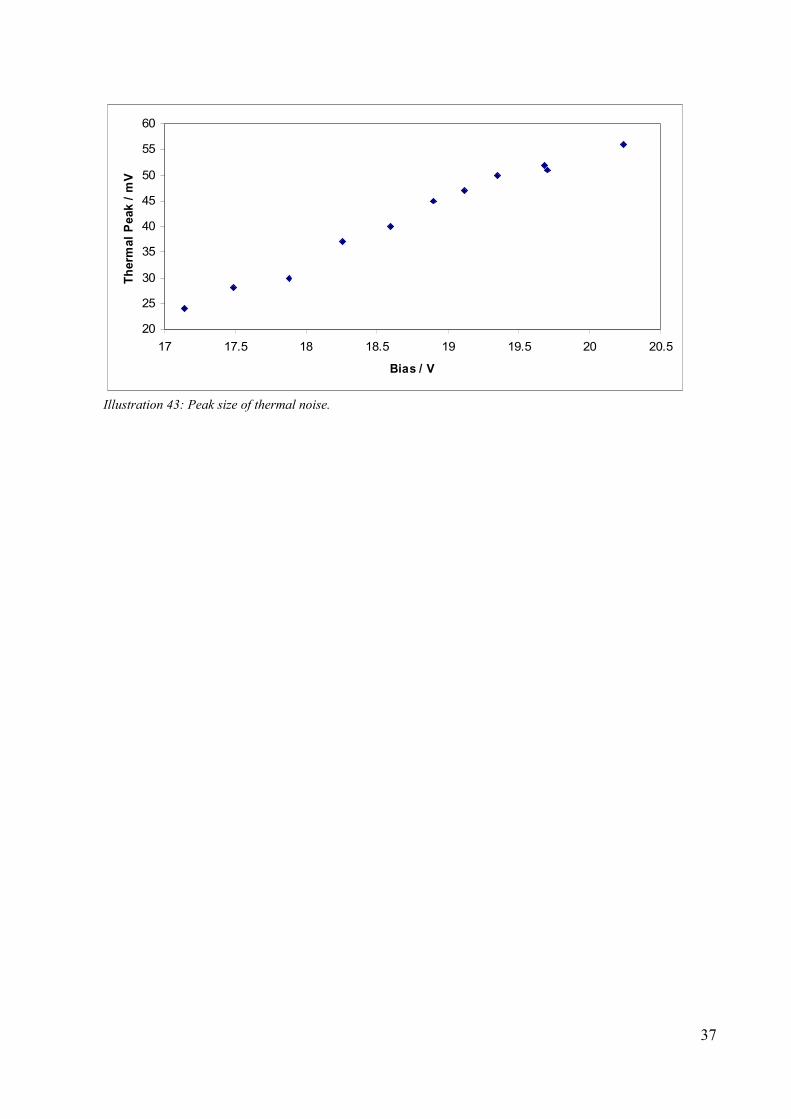
By considering the magnitude of the thermal noise, one can determine the size of the signal produced by one electron-hole pair. This will be equivalent to the signal size from one photon. At a
26
Illustration 40: Plot showing exponential dependence of efficiency on threshold and the accompanying R2
value.
y = 3.9467e0.0141x
R2 = 0.9956
0.0%
10.0%
20.0%
30.0%
40.0%
50.0%
60.0%
70.0%
80.0%
-310 -260 -210 -160 -110
Threshold / mV
Effi
cien
cy
Illustration 41: Efficiency with A and B anti-parallel to avoid coincidences from Čerenkov radiation.
0.0%
10.0%
20.0%
30.0%
40.0%
50.0%
60.0%
70.0%
80.0%
90.0%
100.0%
-95 -85 -75 -65 -55 -45 -35 -25
Threshold / mV
Effi
cien
cy

bias of 18.94V, this size is 45mV7. The plot above shows minimal drop in efficiency up to 90mV, hence one can conclude that most signals contain at least two initial electron-hole pairs. Rearranging the equation shown in illustration 40 suggests that the device efficiency should reach unity at a threshold of -97.4mV. Given that the singles rate of the SiPM at a bias of 18.9V and threshold of -90mV is of order 10, then the device configured in this way has very high efficiency and very low noise. If a further copy of this device is produced, then the two can be used as an effective trigger for the spark chamber.
Conclusion.
The device presented has a detection efficiency extremely close to unity with a very low noise rate. It is a significant improvement to the system currently used. Not only is it much more compact than the existing system, having only the SiPM and amplification circuit, as opposed to the photomultiplier tube, contributing to its size in addition to the scintillator plate, but it also covers a greater area of the top and bottom of the chamber. This will allow the chamber to image a greater range of cosmic-rays coming through it. The device can easily be replicated. SiPMs vary from one to the next in terms of the nominal bias so a bias and threshold will need to be selected for each one. As only one SiPM was tested it is not possible to suggest a rule for determining optimum values for threshold and bias. Further work could be done on this. It seems that an over bias of ~1.5V gives appropriate sensitivity. A threshold of twice the single electron-hole pair peak gives a low noise rate.
It is worth noting that signal arrival times should be examined to ensure that they arrive at the same time, to within the errors associated with random fluctuations. This may not be a significant issue when comparing signals from two SiPMs, as opposed to comparing signals from different types of devices with additional coincidence logic.
The introduction of discriminator and coincidence logic based on a circuit board instead of the system used at present would would reduce the size of the chamber significantly. This is an existing technology.
7 To measure the single electron-hole pair peak size an oscilloscope should be used. Trigger the oscilloscope on the output from the SiPM. If the trigger level is reduced there will be found a region in which the peak size is independent from the trigger level. This peak is from single electron-hole pair signals. The size of this peak can then be read off.
27

Appendix
Index of TablesEfficiency data for ATLAS scintillator coupled to PMT via fish-tail light guide..............................28Singles rate of PMT as a function of operating voltage.....................................................................29Efficiency of scintillator plate coupled to PMT via WSF as a function of PMT voltage...................29Efficiency and singles rate for ATLAS scintillator plate coupled to PMT via WSF..........................30Singles rate for SiPM biased at 17.8V as a function of threshold......................................................30Singles rate of SiPM at threshold of -35mV as a function of bias.....................................................31Efficiency of ATLAS plate coupled to SiPM at a threshold of -35mV as a function of bias.............31Accidental efficiency as a function of width......................................................................................32Efficiency of ATLAS plate coupled to SiPM via WSF as a function width prior to introducing signal delay....................................................................................................................................................32Efficiency of ATLAS plate coupled to SiPM via WSF as a function width after the introduction of signal delay.........................................................................................................................................33Data for small plate coupled to SiPM via WSF at bias of 18.9V........................................................33Data for final device pre-gluing. .......................................................................................................34Data for final device...........................................................................................................................35Data for final device with A and B thresholds set to 100mV to reduce effect of cross-talk...............35Data for final device with A and B on separate power supplies with SiPM at a bias of 18.96V........36Peak size of thermal noise..................................................................................................................36
Results
Table 1: Efficiency data for ATLAS scintillator coupled to PMT via fish-tail light guide.
Voltage/ kV AB AB-C Efficiency Error2.2 498 148 29.7% 2.4%2.3 2770 2017 72.8% 1.6%2.4 657 608 92.5% 3.8%2.45 150 143 95.3% 8.0%2.35 136 115 84.6% 7.9%2.25 83 35 42.2% 7.1%2.15 66 10 15.2% 4.8%2.1 80 7 8.8% 3.3%2.05 961 18 1.9% 0.4%2.275 109 73 67.0% 7.8%2.375 1750 1555 88.9% 2.3%
28
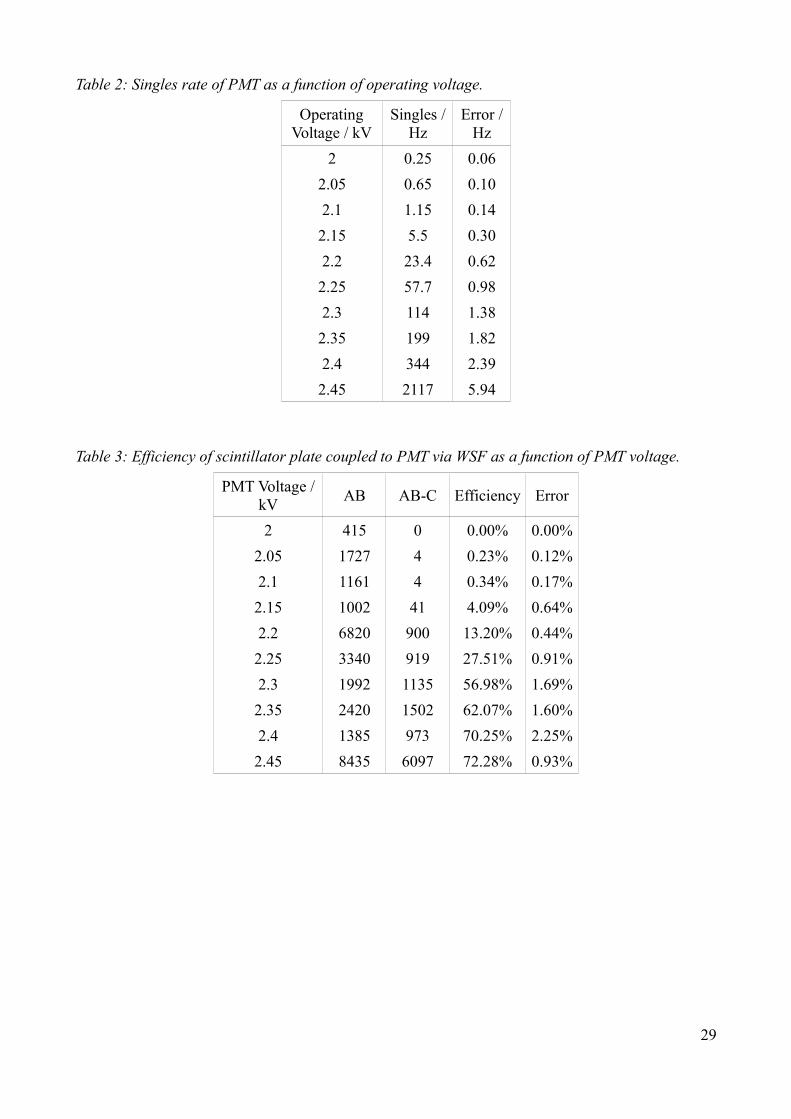
Table 2: Singles rate of PMT as a function of operating voltage.
Operating Voltage / kV
Singles / Hz
Error / Hz
2 0.25 0.062.05 0.65 0.102.1 1.15 0.142.15 5.5 0.302.2 23.4 0.622.25 57.7 0.982.3 114 1.382.35 199 1.822.4 344 2.392.45 2117 5.94
Table 3: Efficiency of scintillator plate coupled to PMT via WSF as a function of PMT voltage.
PMT Voltage / kV AB AB-C Efficiency Error
2 415 0 0.00% 0.00%2.05 1727 4 0.23% 0.12%2.1 1161 4 0.34% 0.17%2.15 1002 41 4.09% 0.64%2.2 6820 900 13.20% 0.44%2.25 3340 919 27.51% 0.91%2.3 1992 1135 56.98% 1.69%2.35 2420 1502 62.07% 1.60%2.4 1385 973 70.25% 2.25%2.45 8435 6097 72.28% 0.93%
29

Table 4: Efficiency and singles rate for ATLAS scintillator plate coupled to PMT via WSF.
Threshold of C / mV AB-C AB Efficency Error Singles
/ Hz-88.31 191 727 26.3% 1.9% 799-30.11 938 1237 75.8% 2.5% 5930
-196.72 5 509 1.0% 0.4% 160-138.81 42 751 5.6% 0.9% 270-50.35 640 1020 62.7% 2.5% 3978-39.02 4508 6356 70.9% 1.1% 3718-61.21 2493 5053 49.3% 1.0% 1837-70.23 3728 9384 39.7% 0.7% 1332-80.5 314 1127 27.9% 1.6% 793
-100.53 425 2486 17.1% 0.8% 316-110.2 155 1183 13.1% 1.1% 213
-120.45 114 1437 7.9% 0.7% 176-130.85 86 1653 5.2% 0.6% 142
Table 5: Singles rate for SiPM biased at 17.8V as a function of threshold.
Threshold / mV
Singes / Hz
-30.4 9159.9-39.9 531.1-35.1 1871.0-45.0 116.7-50.4 28.5-54.9 7.4-60.4 1.6-65.1 0.6
30
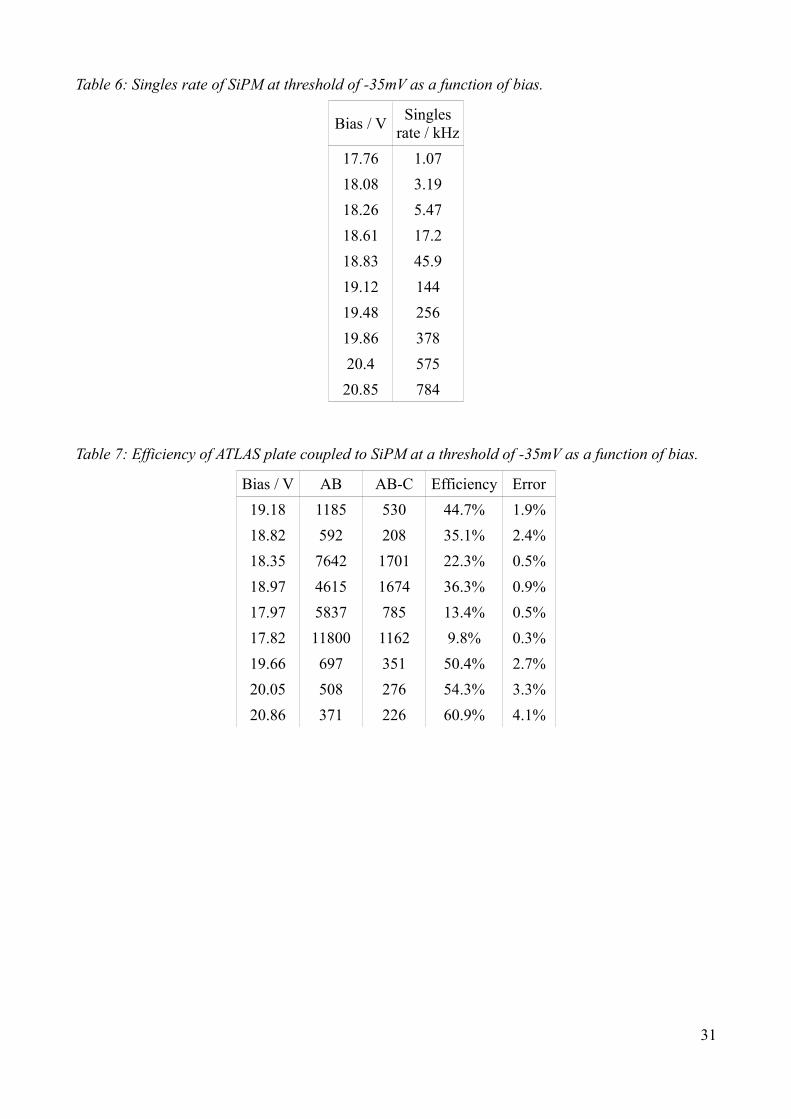
Table 6: Singles rate of SiPM at threshold of -35mV as a function of bias.
Bias / V Singles rate / kHz
17.76 1.0718.08 3.1918.26 5.4718.61 17.218.83 45.919.12 14419.48 25619.86 37820.4 57520.85 784
Table 7: Efficiency of ATLAS plate coupled to SiPM at a threshold of -35mV as a function of bias.
Bias / V AB AB-C Efficiency Error19.18 1185 530 44.7% 1.9%18.82 592 208 35.1% 2.4%18.35 7642 1701 22.3% 0.5%18.97 4615 1674 36.3% 0.9%17.97 5837 785 13.4% 0.5%17.82 11800 1162 9.8% 0.3%19.66 697 351 50.4% 2.7%20.05 508 276 54.3% 3.3%20.86 371 226 60.9% 4.1%
31

Table 8: Accidental efficiency as a function of width.
Width / ns AB AB-C Efficiency Error
6 677 7 1.03% 0.39%10 761 13 1.71% 0.47%15 520 14 2.69% 0.72%20 378 10 2.65% 0.84%25 553 14 2.53% 0.68%30 401 11 2.74% 0.83%35 6226 327 5.25% 0.29%40 386 19 4.92% 1.13%45 490 34 6.94% 1.19%50 401 32 7.98% 1.41%
Table 9: Efficiency of ATLAS plate coupled to SiPM via WSF as a function width prior to introducing signal delay.
Width / ns AB AB-C Efficiency Error
5 884 29 3.28% 0.61%10 699 30 4.29% 0.78%15 663 47 7.09% 1.03%20 707 60 8.49% 1.10%25 907 103 11.36% 1.12%30 571 96 16.81% 1.72%35 824 215 26.09% 1.78%40 502 166 33.07% 2.57%45 900 386 42.89% 2.18%50 583 259 44.43% 2.76%
32
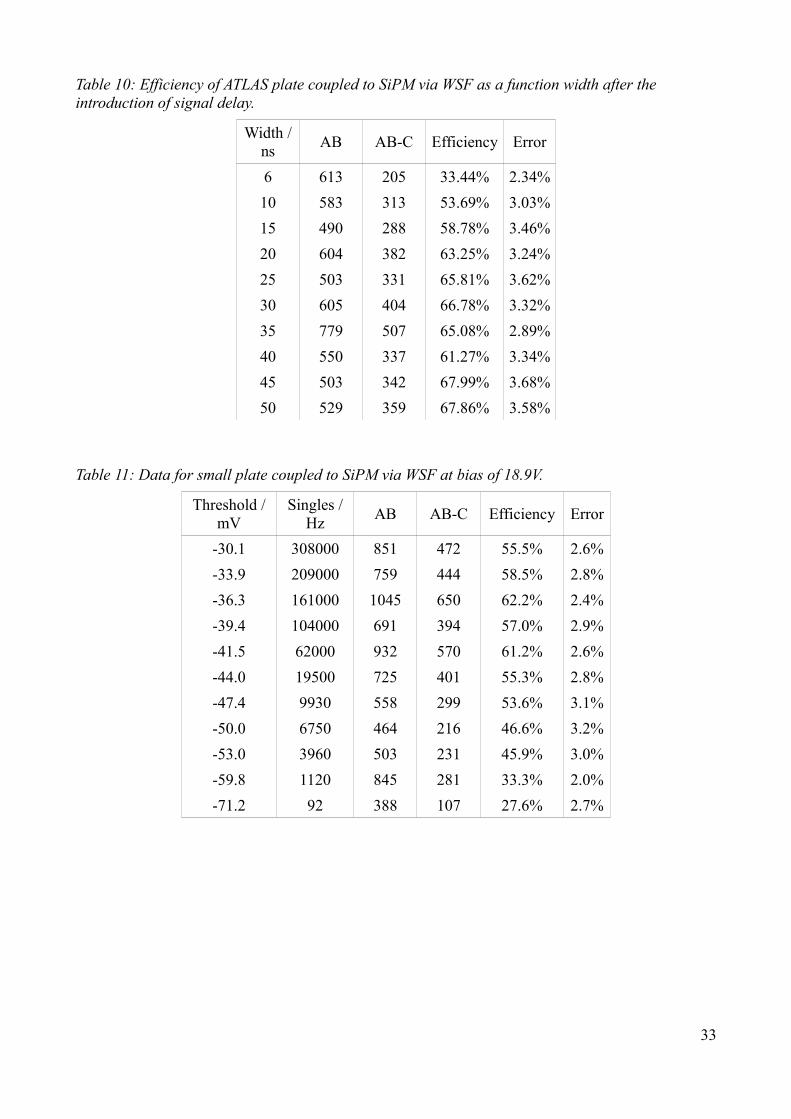
Table 10: Efficiency of ATLAS plate coupled to SiPM via WSF as a function width after the introduction of signal delay.
Width / ns AB AB-C Efficiency Error
6 613 205 33.44% 2.34%10 583 313 53.69% 3.03%15 490 288 58.78% 3.46%20 604 382 63.25% 3.24%25 503 331 65.81% 3.62%30 605 404 66.78% 3.32%35 779 507 65.08% 2.89%40 550 337 61.27% 3.34%45 503 342 67.99% 3.68%50 529 359 67.86% 3.58%
Table 11: Data for small plate coupled to SiPM via WSF at bias of 18.9V.
Threshold / mV
Singles / Hz AB AB-C Efficiency Error
-30.1 308000 851 472 55.5% 2.6%-33.9 209000 759 444 58.5% 2.8%-36.3 161000 1045 650 62.2% 2.4%-39.4 104000 691 394 57.0% 2.9%-41.5 62000 932 570 61.2% 2.6%-44.0 19500 725 401 55.3% 2.8%-47.4 9930 558 299 53.6% 3.1%-50.0 6750 464 216 46.6% 3.2%-53.0 3960 503 231 45.9% 3.0%-59.8 1120 845 281 33.3% 2.0%-71.2 92 388 107 27.6% 2.7%
33
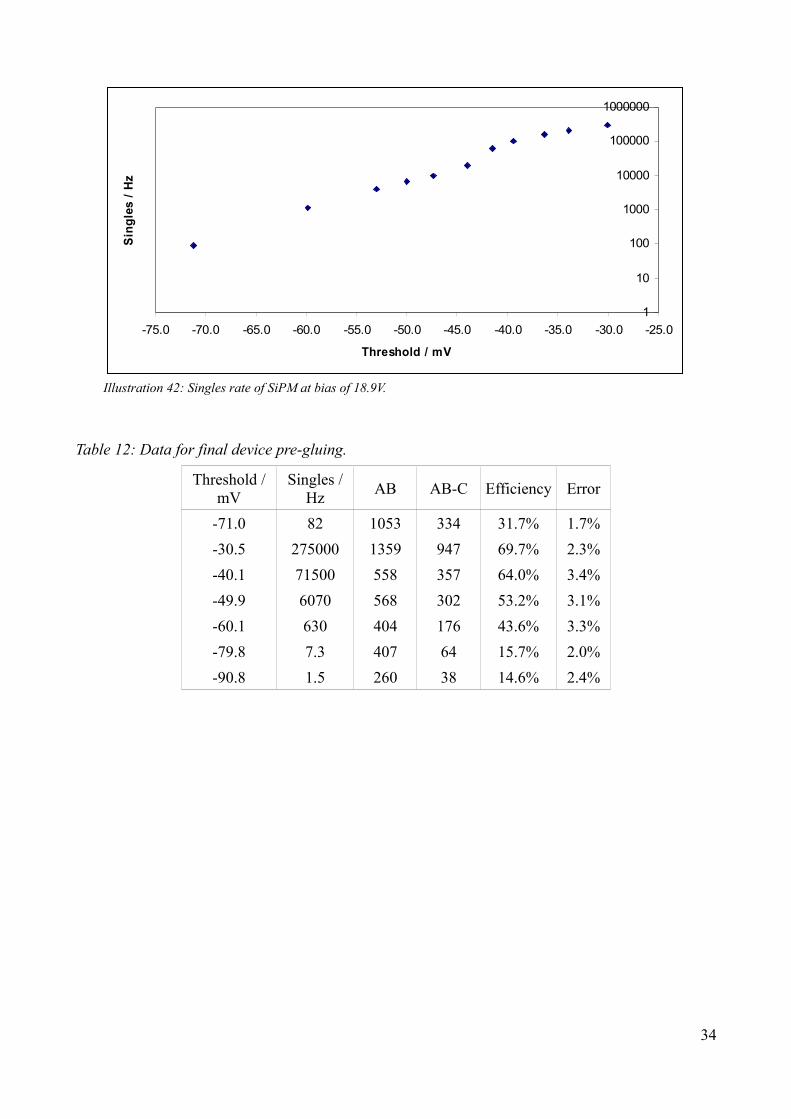
Table 12: Data for final device pre-gluing.
Threshold / mV
Singles / Hz AB AB-C Efficiency Error
-71.0 82 1053 334 31.7% 1.7%-30.5 275000 1359 947 69.7% 2.3%-40.1 71500 558 357 64.0% 3.4%-49.9 6070 568 302 53.2% 3.1%-60.1 630 404 176 43.6% 3.3%-79.8 7.3 407 64 15.7% 2.0%-90.8 1.5 260 38 14.6% 2.4%
34
Illustration 42: Singles rate of SiPM at bias of 18.9V.
1
10
100
1000
10000
100000
1000000
-75.0 -70.0 -65.0 -60.0 -55.0 -50.0 -45.0 -40.0 -35.0 -30.0 -25.0
Threshold / mV
Sing
les
/ Hz

Table 13: Data for final device.
Threshold / mV
Singles / Hz AB AB-C Efficiency Error
-30.5 352000 460 351 76.3% 4.1%-40.4 117000 501 356 71.1% 3.8%-50.1 9240 493 357 72.4% 3.8%-60.1 2100 773 546 70.6% 3.0%-70.0 192 426 287 67.4% 4.0%-80.3 35 650 454 69.8% 3.3%-90.4 7.6 3004 1992 66.3% 1.5%-100.6 5.2 163 105 64.4% 6.3%
Table 14: Data for final device with A and B thresholds set to 100mV to reduce effect of cross-talk.
Threshold / mV
Singles / Hz AB AB-C Efficiency Error
-30.5 9150 2756 2647 96.0% 1.9%-40.5 314 437 421 96.3% 4.7%-51.3 10.6 814 742 91.2% 3.3%-61.0 4.4 1037 857 82.6% 2.8%-70.5 3.4 882 645 73.1% 2.9%-80.8 2.56 768 450 58.6% 2.8%-90.8 2.1 429 211 49.2% 3.4%-100.0 1.9 586 251 42.8% 2.7%
35
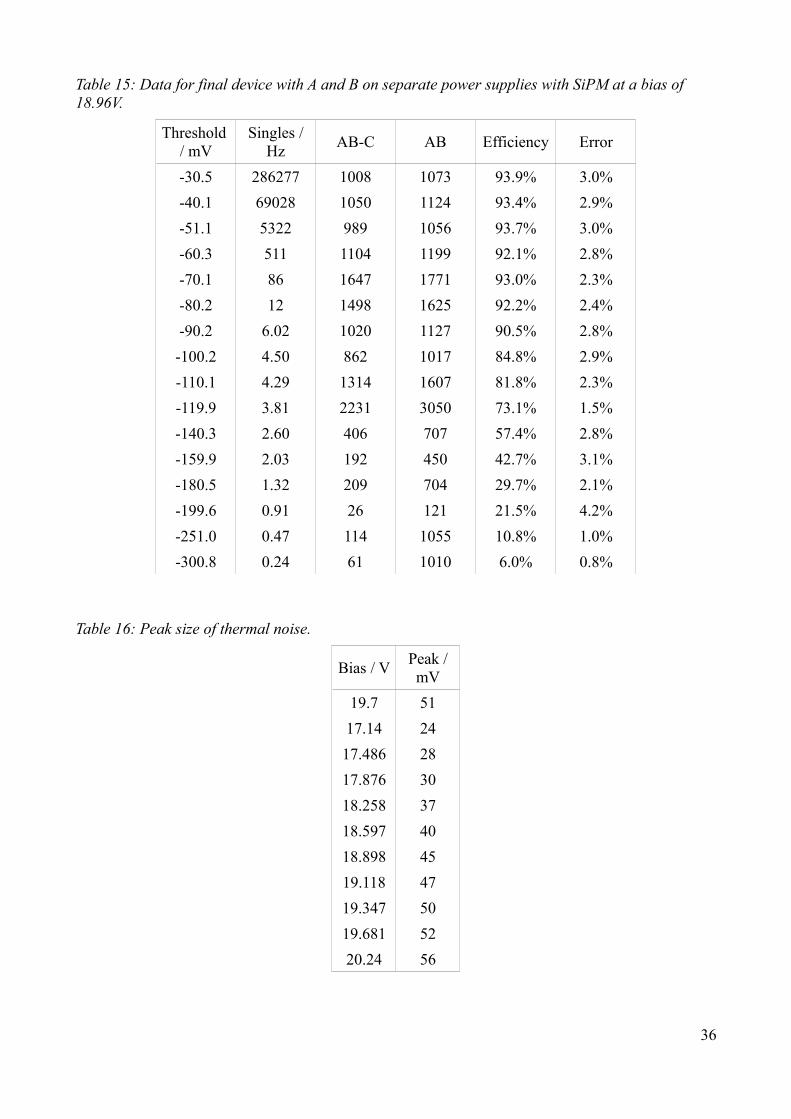
Table 15: Data for final device with A and B on separate power supplies with SiPM at a bias of 18.96V.
Threshold / mV
Singles / Hz AB-C AB Efficiency Error
-30.5 286277 1008 1073 93.9% 3.0%-40.1 69028 1050 1124 93.4% 2.9%-51.1 5322 989 1056 93.7% 3.0%-60.3 511 1104 1199 92.1% 2.8%-70.1 86 1647 1771 93.0% 2.3%-80.2 12 1498 1625 92.2% 2.4%-90.2 6.02 1020 1127 90.5% 2.8%-100.2 4.50 862 1017 84.8% 2.9%-110.1 4.29 1314 1607 81.8% 2.3%-119.9 3.81 2231 3050 73.1% 1.5%-140.3 2.60 406 707 57.4% 2.8%-159.9 2.03 192 450 42.7% 3.1%-180.5 1.32 209 704 29.7% 2.1%-199.6 0.91 26 121 21.5% 4.2%-251.0 0.47 114 1055 10.8% 1.0%-300.8 0.24 61 1010 6.0% 0.8%
Table 16: Peak size of thermal noise.
Bias / V Peak / mV
19.7 5117.14 2417.486 2817.876 3018.258 3718.597 4018.898 4519.118 4719.347 5019.681 5220.24 56
36
37
Illustration 43: Peak size of thermal noise.
20
25
30
35
40
45
50
55
60
17 17.5 18 18.5 19 19.5 20 20.5
Bias / V
Ther
mal
Pea
k / m
V

Accidental coincidence rate.
Consider a system where two SiPM systems, 1 and 2, are being used in coincidence to detect cosmic-rays.
For a singles rate of r1 and r2 and discriminator output widths of τ1 and τ2 then the coincidence rate, R, is given by
R = r1 r2 (τ1 + τ2 – τc).
Where τc is the overlap time required for the coincidence unit to detect the coincidence.
Assume that the widths and rates are the same for 1 and 2 and that the overlap width required is zero.
R = 2 r2 τ.
For a given rate of coincidence R one can deduce a value of r.
R / Hz r / Hz1 4472
0.1 14140.01 4470.001 141
The accidental efficiency can also be determined from
efficiency = r (τ1 + τ2 – τc).
Bibliography1: Maurice Goodrick, University of Cambridge, HEP, Private discussion, 20102: Beniamino Di Girolamo, The ATLAS Tilecal hadronic calorimeter, Nuclear Instruments and Methods in Physics Research A 453 (2000) 233-236, 3: P. Buzhan et al., An advanced study of silicon photomultiplyer, 20014: , http://photonique.ch/DataSheets/SSPM_0701BG_TO18.pdf, 5: ATLAS Collaboration, Chapter 5, Technical Design Report, CERN LHCC 99-14, 6: ATLAS Collaboration, page 132, Chapter, Technical Design Report, CERN LHCC 99-14, 7: Steve Wooton, University of Cambridge, HEP, Private discussion, 8: The Tile Calorimeter Group of the ATLAS Collaboration, The Production and Qualification of Scintillator Tiles for the ATLAS Hadronic Calorimeter, 20089: ATLAS Collaboration, page 144, Chapter 5, Technical Design Report, CERN LHCC 99-14, 10: ATLAS Collaboration, page 133, Chapter 5, Technical Design Report, CERN LHCC 99-14, 11: ATLAS Collaboration, page 154, Chapter 5, Technical Design Report, CERN LHCC 99-14,
38