Part I: Overview of OET-69 and TVStudy Softwarewireless.fcc.gov/learn/Learn_slides_20130822.pdf ·...
39
Robert D. Weller Chief, Technical Analysis Branch robert.weller @ fcc.gov August 22, 2013 FCC LEARN Program Part I: Overview of OET-69 and TVStudy Software
Transcript of Part I: Overview of OET-69 and TVStudy Softwarewireless.fcc.gov/learn/Learn_slides_20130822.pdf ·...

Robert D. Weller Chief, Technical Analysis Branch
robert.weller @ fcc.gov
August 22, 2013
FCC LEARN Program
Part I:
Overview of OET-69
and TVStudy Software
2
OET-69 and TVStudy Overview
• “Repacking” of Television Stations
• Allotment and channel reuse restrictions
• What is OET-69?
• Assumptions for Coverage Area and Population Served for illustrative study
• What is TVStudy?
• Station and Parameter selection for the illustrative study
• Illustrative output files for summarizing interference calculations

Repacking of Television Stations (Illustration)
VHF
UHF
Used in Market
Used in Adj. Market
Astr
ono
my
Cla
ss A
Contiguous Spectrum available for Auction
After Repacking

4
Channel Usage Restrictions to limit interference
• Co-Channel operation generally requires physical separation of transmitting locations
• Adjacent-Channel operation generally requires either physical separation or collocation
• OET-69 accounts for local terrain and other factors, which mean that the actual distances required to prevent interference could be greater or lesser than typical values that might be used for spacing-based allotments

5
What is OET-69 ?
• “Longley-Rice Methodology for Evaluating TV Coverage and Interference” o Developed in 1990s for the transition from
analog to digital
o A methodology for determining coverage
area and population served using two
propagation models
OET BULLETIN No. 69
Longley-Rice Methodology for Evaluating TV Coverage and
Interference
July 2, 1997
Updated February 6, 2004
• A Five-Step Process: 1. Establish contour as limit of service
2. Divide area within contour into square cells
3. Determine whether coverage exists in each cell
4. Check for interference in each coverage cell
5. Sum population of all cells having interference-free coverage

6
What is OET-69 ?
Interfering Station
A
BB
Green = coverage
Yellow = no coverage (e.g., terrain blockage)
Red = Interference

7
Assumptions for Coverage Area and Population Served
For purposes of satisfying the statutory
requirement to make all reasonable
efforts to preserve “coverage area” and
“population served,” the Commission
proposed in the NPRM to interpret:
Coverage area = noise limited contour
w/o regard to interference
(the entire area inside the circle)
Population served = who receives signal
within the coverage area, excluding
station interference and terrain
obstructions
(the green area)
A
B
8
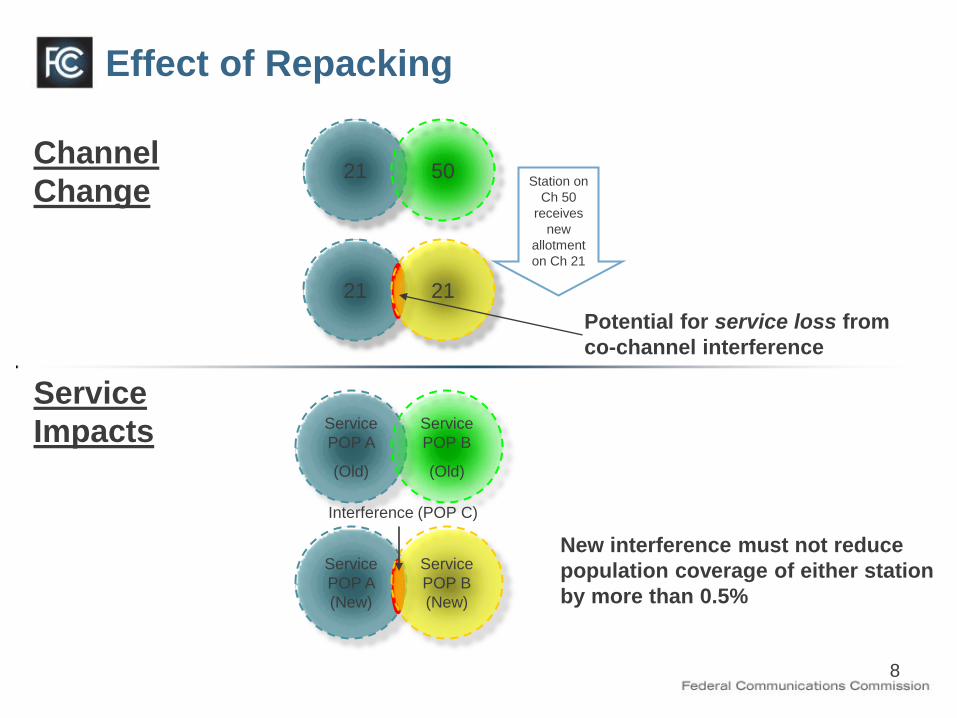
Effect of Repacking
21 50
Potential for service loss from
co-channel interference
21
Service
POP A
(New)
Station on
Ch 50
receives
new
allotment
on Ch 21
Channel
Change
Service
Impacts Service
POP A
(Old)
Service
POP B
(Old)
Interference (POP C)
New interference must not reduce
population coverage of either station
by more than 0.5%
21
Service
POP B
(New)

9
“Fixed” Option to Preserve Population Served
• Repack can “replace” only population interference existing as of 2/22/12
• Potential to gain new viewers (green)
• Channel assignment not permitted if population served loss exceeds 0.5% (yellow)
• Predicted areas of no change (black)
not permitted unless <.5%

10
What is TVStudy?
• Software implementing the methodology of OET Bulletin No. 69
• Software output can be used to predict which stations can be permitted on co- and adjacent-channels to other stations
• For example, if the “Fixed” interference option is adopted, existing areas of population interference cannot be moved
o Requires bookkeeping of interference on a cell-by-cell basis – millions of cells
o Because many TV stations are collocated (e.g., Sutro Tower), there may be many permutations that create the same geographic pattern of interference
• Using TVStudy to pre-calculate a truth table of channel relationships that would likely be permissible enables use of a “feasibility checker” at each step of the auction.

11
Station Selection for Illustrative Study
• Legislation specifies protection of U.S. stations operating as of 2/22/2012
• Full-power and Class A stations only
• Agreements with Canada and Mexico specify analog and digital allotments, some of which are vacant, but must still be protected
• Digital allotments are assumed built at maximum facilities and are allowed to cause interference to U.S. stations
• Mexican analog allotments are similarly assumed to be at maximum power and height and allowed to cause interference
• Canadian analog allotments are generally replaced by co-channel digital allotments and so are not included
• A number of non-discretionary cases not included in the above
• See July 22, 2013 Public Notice for details

12
Parameter Selection for Illustrative Study
• The February 4, 2013 Public Notice sought comment on 8 Parameters not specified in OET Bulletin 69. The final decision will be made by the Commissioners, but choices for the illustrative study are:
• Census Data – 2010
• Terrain Data – 1 arc-second (USGS DEM)
• CDBS errors – correct data if obvious (DA, BT)
• Beam Tilt – use value in CDBS, if available, else 0.75
• Depression angles – calculate from AMSL heights
• Census Block locations – full precision
• Grid system – global (uniform)
• kwx=3 warnings – assume coverage (no change)

13
Sample Pairwise Output Files: “Truth Table”
• Pairwise output files from TVStudy can be combined in a
relational way to determine whether a particular pair of
stations might be assigned to a particular channel
relationship in each television band.
• Sufficient data are provided to make this determination for
any of the three options considered in the NPRM and for
any desired “threshold” for acceptable interference.

14
Pairwise studies
• TVStudy can automatically replicate all U.S. stations onto user-selected channels (co- and 1) and calculate interference on each
• For each channel selected, 3 interference scenarios are studied
• For compactness of output, one “proxy” channel per band was selected as shown below

15
Sample Pairwise Output Files
• An illustrative small study of just 13 stations
• Took 34 seconds for baseline on 2.9 Ghz i7 Macbook
• 15 seconds for 3-band pairwise study @ 2x2 km

16
Sample Pairwise Output Files; “Truth Table”
• Six files are created as shown below
• baseline gives existing summary (total) coverage info
• interference lists each cell with interference and the
station pair involved
• points lists details of each cell (pop, area, lat/long, etc.)
• replication gives summary (total) coverage info on
each replicated channel
• service lists whether service or not for each cell
• stations lists each station studied

17
Sample Pairwise Output Files: Stations
• Stations file is CSV format with high-level information on
each station studied
• Facility ID, Channel
• Whether studied as desired and/or undesired
• Station Class, callsign, location, country, authorization
status, file number

18
Sample Pairwise Output Files: Baseline
• Baseline file is CSV format with summary coverage
information for each station studied
• Facility ID, Channel
• Country key
• Noise-limited area/pop, Terrain-limited area/pop,
Interference-free area/pop

19
Sample Pairwise Output Files: Replication
• Replication file is CSV format with summary replication
information for each station studied
• Facility ID, Replication Channel
• Country key, Noise-limited area/pop, Terrain-limited
area/pop

20
Sample Pairwise Output Files: Points
• Points file is CSV format with common information about
each cell studied
• Defines Point Key (unique value for each study point)
• Lat/Long index of SE corner of cell
• Country key, Lat/Long of study point in cell, area of
cell, population of cell
21
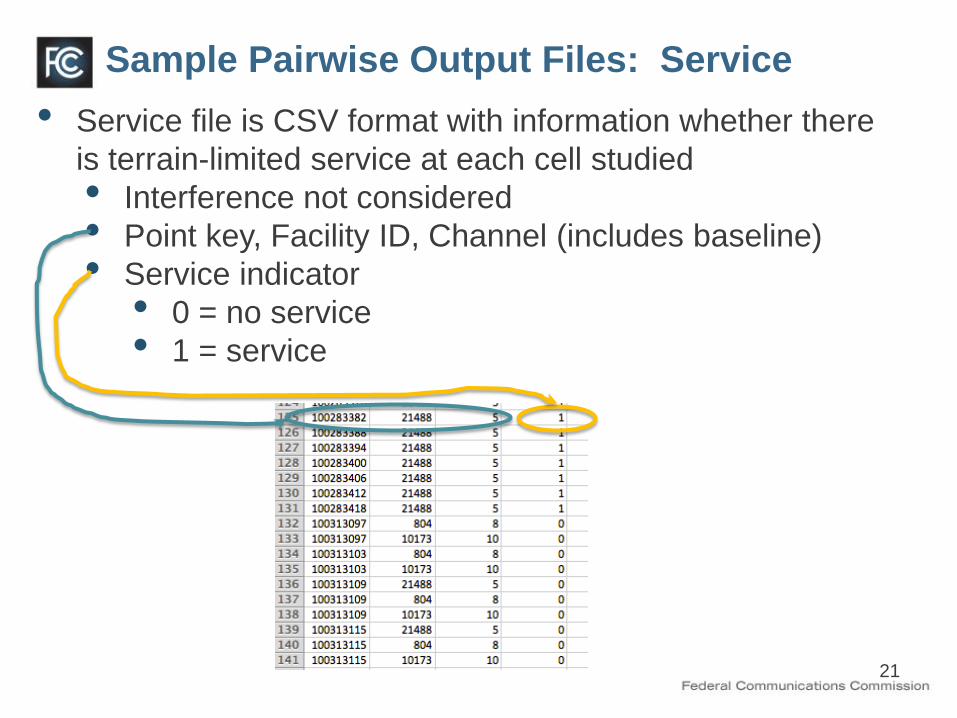
Sample Pairwise Output Files: Service
• Service file is CSV format with information whether there
is terrain-limited service at each cell studied
• Interference not considered
• Point key, Facility ID, Channel (includes baseline)
• Service indicator
• 0 = no service
• 1 = service

22
Sample Pairwise Output Files: Interference
• Interference file is CSV format and lists only points with
interference and station causing interference
• Point key, Facility ID, Channel (includes baseline)
• Interfering Facility ID, Interfering station’s channel

Brett Tarnutzer
Assistant Bureau Chief, WTB
brett.tarnutzer @ fcc.gov
August 22, 2013
FCC LEARN Program
Part II:
Generating Constraint Files

24
Constraint File #1: Interference_Paired File
• Illustrative example
• Following Option 2 (the “fixed” option
preserving “population served”)
• Two key TVStudy output files used from:
• Service.csv
• Interference.csv
25
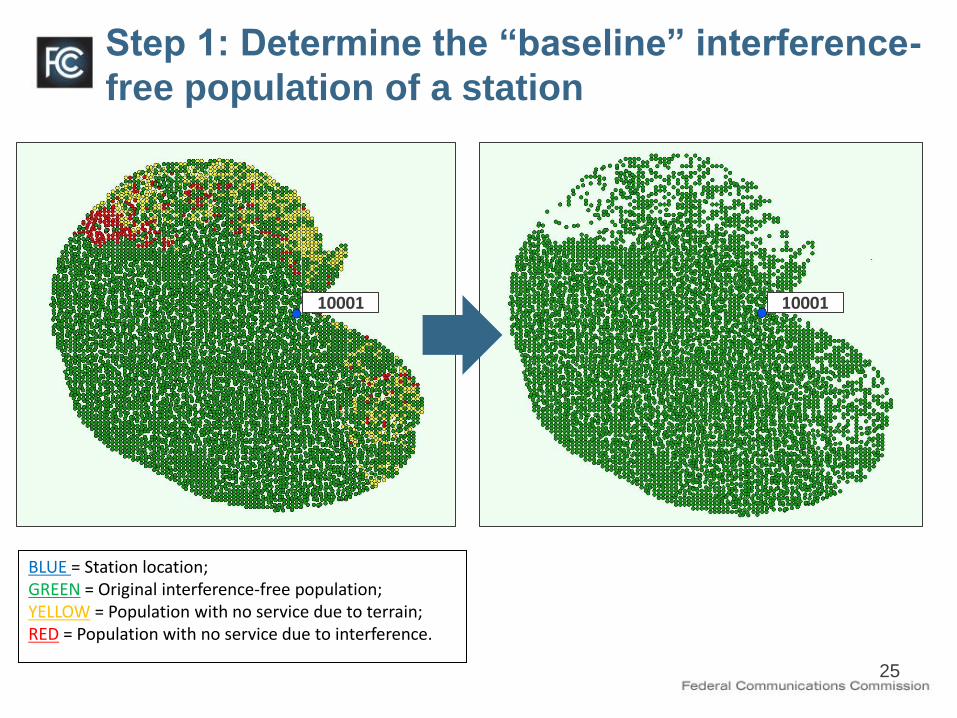
Step 1: Determine the “baseline” interference-
free population of a station
BLUE = Station location; GREEN = Original interference-free population; YELLOW = Population with no service due to terrain; RED = Population with no service due to interference.
10001 10001

26
Step 2: Replicate on proxy channels and count
the number of new points of interference
10001
10002
BLUE = Station location;
GREEN = Original interference-free population;
ORANGE = Interference caused by Station 10002.
pointkey integer
facilityid integer
channel integer
Interfering facilityid integer
Interfering channel integer
1 59899596 10001 3 10002 3
2 59929509 10001 3 10002 3
3 59959419 10001 3 10002 3
4 59989329 10001 3 10002 3
5 60019239 10001 3 10002 3
6 60049149 10001 3 10002 3
7 60049152 10001 3 10002 3
8 60079041 10001 3 10002 3
9 60079059 10001 3 10002 3
10 60079062 10001 3 10002 3
From the interference table, Station 10001 (on proxy channel 3) receives co-channel interference from Station 10002 (also on channel 3) in the ten cells indicated.

27
Step 3: Determine whether the new pairwise
interference is predicted to exceed the 0.5%
threshold
• Sum of Population of Interference Points for Station 10001
on proxy channel 3 caused by Station 10002 = 180,844
• Baseline Interference-Free Population for Station 10001 on
current Channel = 1,709,743
• Percent of Baseline Interference-Free Population impacted
by this potential assignment = 180,844/1,709,743 = 10.58%
Since 10.58% is > 0.5%,
Station 10001 on proxy channel 3 cannot exist with
Station 10002 also on channel 3.
New constraint is added to the Interference_Paired file

28
Station1 Proxy Channel
Station2 Channel2
10001 3 10002 2
10001 3 10002 3
10001 3 10002 4
10001 10 10002 9
10001 10 10002 10
10001 10 10002 11
10001 20 10002 19
10001 20 10002 20
10001 20 10002 21
Station1 Proxy Channel
Station2 Channel2 % POP
10001 3 10002 2 0.47
10001 3 10002 3 10.58
10001 3 10002 4 0.85
10001 10 10002 9 0.33
10001 10 10002 10 8.21
10001 10 10002 11 0.66
10001 20 10002 19 1.31
10001 20 10002 20 10.39
10001 20 10002 21 1.43
4.a. Generate Station Pairs* 4.b. Run TVStudy 4.c. Perform
Post-Processing
4.d. Generate Results
Step 4: Repeat for Each Station Pair Within
Culling Distance to Create “Truth Table”
*NOTE: 2177 Stations in the U.S. excluding
territories
facility_id 10001 facility_id 10002
Interference

29
Step 5: Generate Interference_Paired File
If after repacking Station 10001* is placed in the UHF band
(channels 14-51) then:
a) Stations 1116, 1301, 285, 1356, 390, 588, 1981 and 383 cannot
be placed on the same channel (co-channel);
b) Stations 1116, 1301, 285, 1356, 1981 and 383 cannot be
placed on the first adjacent channel above station 10001;
c) Stations 1116, 1301, 285, 1356, 1981 and 383 cannot be
placed on the first adjacent channel below station 10001.
CO, 14, 51, 10001, 1116, 1301, 285, 1356, 390, 588, 1981, 383
ADJ+1, 14, 51, 10001, 1116, 1301, 285, 1356, 1981, 383
ADJ-1, 14, 51, 10001, 1116, 1301, 285, 1356, 1981, 383
*Sample – does not reflect real station data.

30
Nuance – Asymmetry
A - Channel 3
B - Channel 4
B - Channel 3
B - Channel 2
B - Channel 3 A - Channel 3
A - Channel 2
A - Channel 4
“Protected Station” “Interfering Station”

31
Constraint File #2: Domain File
• Illustrative example
• Dealing with “fixed” constraints:
• Canadian allotments
• Mexican allotments
• LM and LMW stations
• Channel 37
• ORTS

32
Step 1: Protecting Canadian Allotments
• Assumed Canadian allotments remained on their existing channel
• Run TVStudy putting “undesired” U.S. stations on actual Canadian
allotment channels
• U.S. Stations which violate the 0.5% threshold have a channel
removed from their domain in the Domain file
Desired: Canadian Station
Channel (Canada)
Undesired: USA Station
Channel (USA) % POP
10001 43 10002 42 0.55
10001 43 10002 43 5.26
10001 43 10002 44 0
1.a. Run TVStudy 1.b. Generate Results

33
Step 2: Protecting Mexican Allotments
• Assumed Mexican allotments remain on their existing channel
• Distance-based protections
US and Mexico Operations
DTV to DTV Station
DTV to NTSC Station
Co-Channel VHF: 273 km 273 km
1st Adj. Channel VHF: 48-96 km 18-100 km
Co-Channel UHF: 223 km 244 km
1st Adj. Channel UHF: 32-88 km 10-88 km
± 2 UHF: - 24-32 km
± 3 UHF: - 24-32 km
± 4 UHF: - 24-32 km
± 7 UHF: - 24-95 km
± 8 UHF: - 24-32 km
+ 14 UHF: - 24-95 km
+ 15 UHF: - 24-96 km
2.a. Map Border Stations 2.b. Determine Exclusion Zones
Based on Relevant Distance
Separations

34
Step 3: Protecting Land Mobile
• Assumed LM and LMW operations remain on their existing channel
• Distance-based protections
• Protect from LM City Centers and LMW Base Stations
US and Land Mobile Operations
DTV to Land Mobile (LM) City Center
DTV to LM Waiver (LMW) Base
Station
Co-Channel: 250 km 185 km
Adjacent Channel: 176 km 96 km
3.a. Map LM City Centers
and LMW Base Stations 3.b. Determine Exclusion Zones
Based on Relevant Distance
Separations

35
Step 4: Protecting Channel 37 and Other
Applicable Radio Services
• Assumed no station could be placed in Channel 37 • Reserved for RAS and WMTS
• Assumed no applicable restriction on repacking from
ORTS (“Offshore Radiotelephone Services”) • But we do add a constraint to protect Channel 17 in Hawaii for
point-to-point inter-island communications

36
Step 5: Generate Domain File
*Sample – does not reflect real station data.
In the following sample, Station #10001* may only be placed on
channels 2, 3, 4, 5, 6, 19, 20, 21, 48, 49, 50, 51. A channel
assignment algorithm could not place Station #10001 on any other
channel.
DOMAIN, 10001, 2, 3, 4, 5, 6, 19, 20, 21, 48, 49, 50, 51

37
Use of Constraint Files and Associated Data
• Verify Commission data
• Generate constraint files using other
assumptions
• Explore conducting repacking analyses
based on assumptions about which stations
stay on the air and are assigned channels in
the incentive auction repacking process

38
THANK YOU

39
Reference Information
• TVStudy and documentation
http://data.fcc.gov/download/incentive-auctions/OET-69/
• List-serve for discussion and announcements
• Questions
• General Incentive Auction Information:
Visit the FCC Learn Website
(http://wireless.fcc.gov/incentiveauctions/learn-program/)
• Incentive Auction Questions: