Part Four Long-time Capital Raising
19
Part Four Long-time Capital Raising
-
Upload
macaulay-whitehead -
Category
Documents
-
view
20 -
download
1
description
Part Four Long-time Capital Raising. Learning Objectives. Understand the financial planning process and how decisions are interrelated Be able to develop a financial plan using the percentage of sales approach Understand the four major decision areas involved in long-term financial planning - PowerPoint PPT Presentation
Transcript of Part Four Long-time Capital Raising

Part Four
Long-time Capital Raising

Learning Objectives
• Understand the financial planning process and how decisions are interrelated
• Be able to develop a financial plan using the percentage of sales approach
• Understand the four major decision areas involved in long-term financial planning
• Understand how capital structure policy and dividend policy affect a firm’s ability to grow

4-3
Elements of Financial Planning
• Investment in new assets – determined by capital budgeting decisions
• Degree of financial leverage – determined by capital structure decisions
• Cash paid to shareholders – determined by dividend policy decisions
• Liquidity requirements – determined by net working capital decisions

4-4
Financial Planning Process
• Planning Horizon - divide decisions into short-run decisions (usually next 12 months) and long-run decisions (usually 2 – 5 years)
• Aggregation - combine capital budgeting decisions into one big project
• Assumptions and Scenarios– Make realistic assumptions about important variables
– Run several scenarios where you vary the assumptions by reasonable amounts
– Determine at least a worst case, normal case and best case scenario
4-5
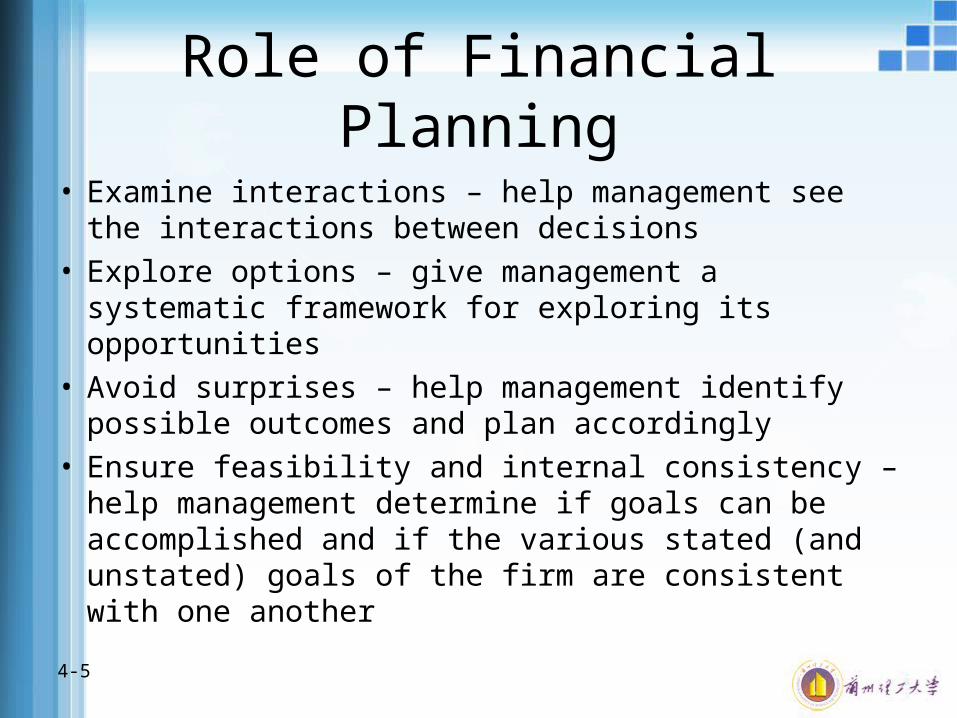
Role of Financial Planning
• Examine interactions – help management see the interactions between decisions
• Explore options – give management a systematic framework for exploring its opportunities
• Avoid surprises – help management identify possible outcomes and plan accordingly
• Ensure feasibility and internal consistency – help management determine if goals can be accomplished and if the various stated (and unstated) goals of the firm are consistent with one another
4-6
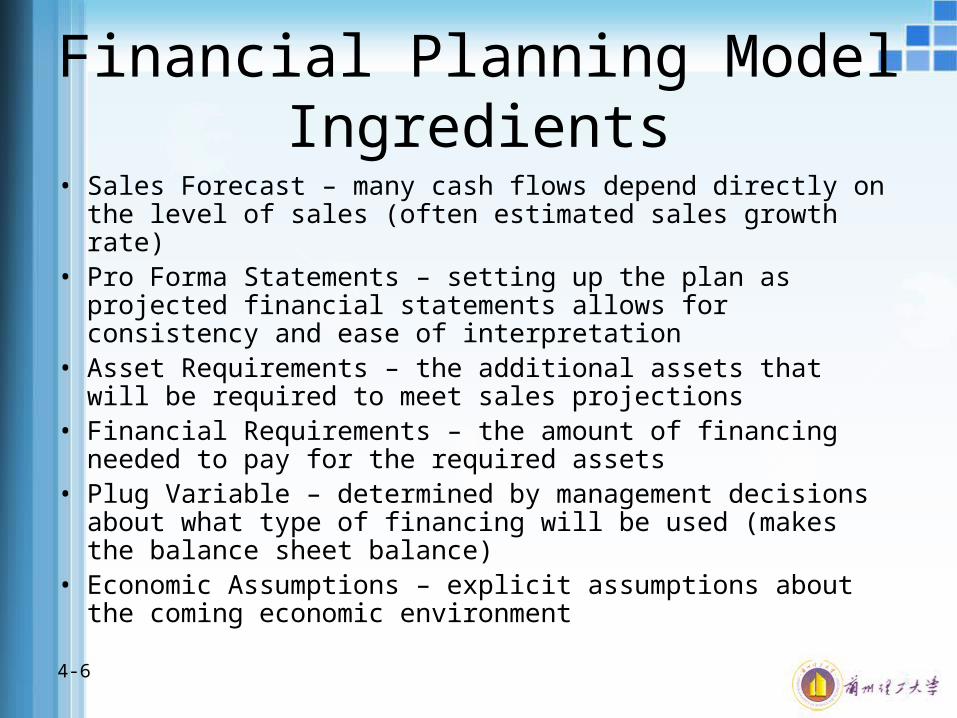
Financial Planning Model Ingredients
• Sales Forecast – many cash flows depend directly on the level of sales (often estimated sales growth rate)
• Pro Forma Statements – setting up the plan as projected financial statements allows for consistency and ease of interpretation
• Asset Requirements – the additional assets that will be required to meet sales projections
• Financial Requirements – the amount of financing needed to pay for the required assets
• Plug Variable – determined by management decisions about what type of financing will be used (makes the balance sheet balance)
• Economic Assumptions – explicit assumptions about the coming economic environment

4-7
Example: Historical Financial Statements
Gourmet Coffee Inc.Balance Sheet
December 31, 2004Assets 1000 Debt 400
Equity 600
Total 1000 Total 1000
Gourmet Coffee Inc.
Income Statement
For Year Ended December 31, 2004
Revenues 2000
Costs 1600
Net Income 400
4-8
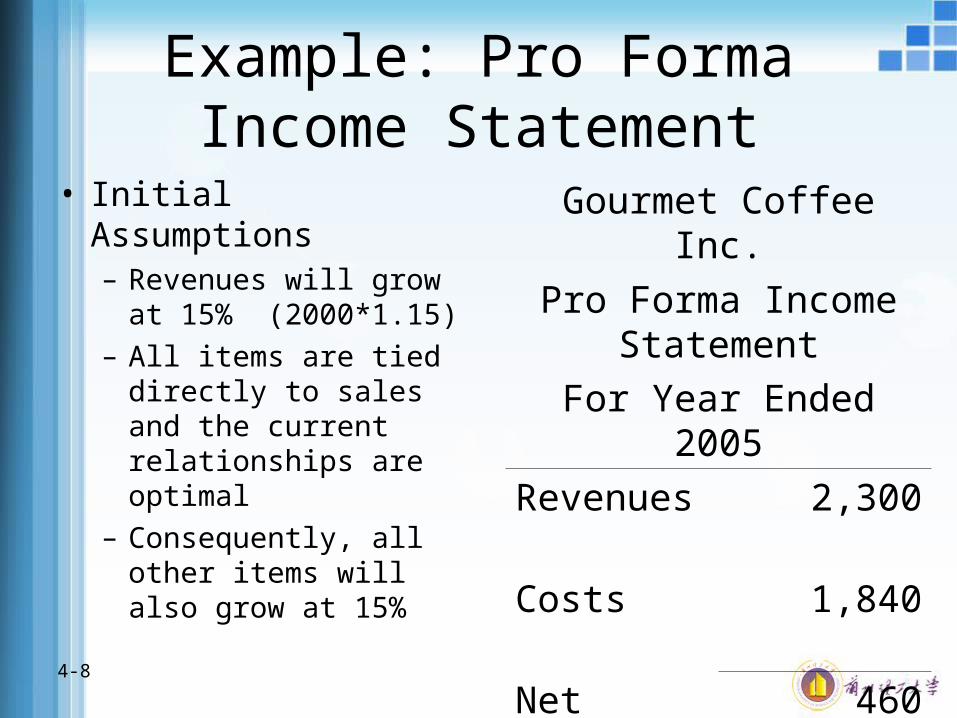
Example: Pro Forma Income Statement
• Initial Assumptions– Revenues will grow at
15% (2000*1.15)
– All items are tied directly to sales and the current relationships are optimal
– Consequently, all other items will also grow at 15%
Gourmet Coffee Inc.
Pro Forma Income Statement
For Year Ended 2005
Revenues 2,300
Costs 1,840
Net Income 460

4-9
Example: Pro Forma Balance Sheet
• Case I– Dividends are the plug
variable, so equity increases at 15%
– Dividends = 460 NI – 90 increase in equity = 370
• Case II– Debt is the plug variable and
no dividends are paid
– Debt = 1,150 – (600+460) = 90
– Repay 400 – 90 = 310 in debt
Gourmet Coffee Inc.
Pro Forma Balance Sheet
Case 1
Assets 1,150 Debt 460
Equity 690
Total 1,150 Total 1,150
Gourmet Coffee Inc.
Pro Forma Balance Sheet
Case 1Assets 1,150 Debt 90
Equity 1,060
Total 1,150 Total 1,150

4-10
Percent of Sales Approach
• Some items vary directly with sales, while others do not• Income Statement
– Costs may vary directly with sales - if this is the case, then the profit margin is constant
– Depreciation and interest expense may not vary directly with sales – if this is the case, then the profit margin is not constant
– Dividends are a management decision and generally do not vary directly with sales – this affects additions to retained earnings
• Balance Sheet– Initially assume all assets, including fixed, vary directly with sales– Accounts payable will also normally vary directly with sales– Notes payable, long-term debt and equity generally do not because they
depend on management decisions about capital structure– The change in the retained earnings portion of equity will come from the
dividend decision

4-11
Example: Income StatementTasha’s Toy Emporium
Income Statement, 2004
% of Sales
Sales 5,000
Costs 3,000 60%
EBT 2,000 40%
Taxes (40%)
800 16%
Net Income 1,200 24%
Dividends 600
Add. To RE 600
Tasha’s Toy Emporium
Pro Forma Income Statement, 2005
Sales 5,500
Costs 3,300
EBT 2,200
Taxes 880
Net Income 1,320
Dividends 660
Add. To RE 660
Assume Sales grow at 10%
Dividend Payout Rate = 50%
4-12
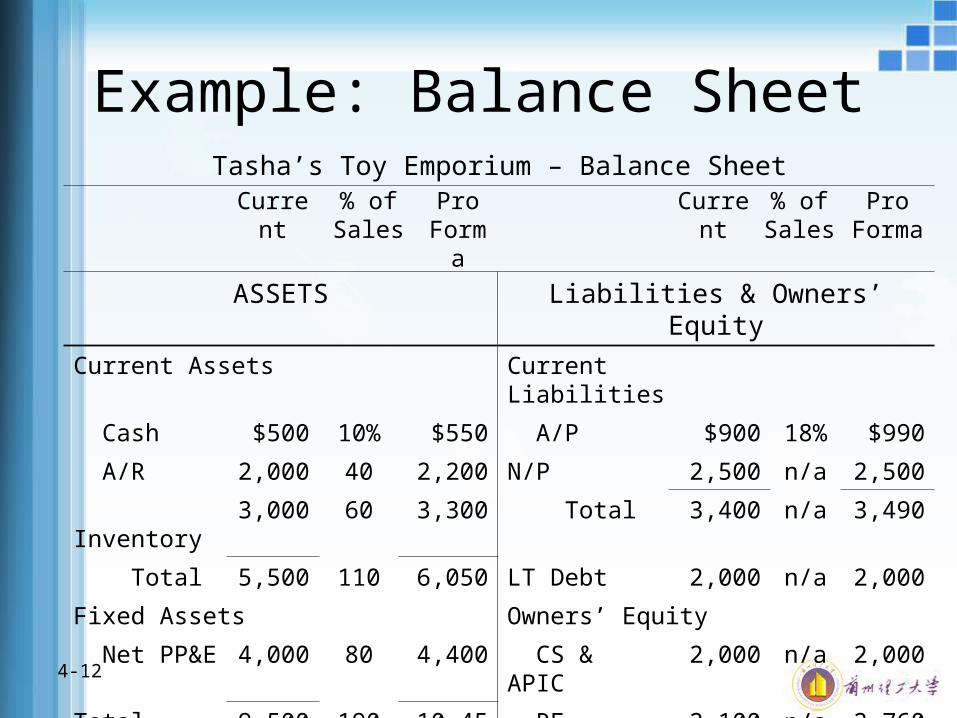
Example: Balance SheetTasha’s Toy Emporium – Balance Sheet
Current % of Sales
Pro Forma
Current % of Sales
Pro Forma
ASSETS Liabilities & Owners’ Equity
Current Assets Current Liabilities
Cash $500 10% $550 A/P $900 18% $990
A/R 2,000 40 2,200 N/P 2,500 n/a 2,500
Inventory 3,000 60 3,300 Total 3,400 n/a 3,490
Total 5,500 110 6,050 LT Debt 2,000 n/a 2,000
Fixed Assets Owners’ Equity
Net PP&E 4,000 80 4,400 CS & APIC 2,000 n/a 2,000
Total Assets 9,500 190 10,450 RE 2,100 n/a 2,760
Total 4,100 n/a 4,760
Total L & OE 9,500 10,250

4-13
Example: External Financing Needed
• The firm needs to come up with an additional $200 in debt or equity to make the balance sheet balance– TA – TL&OE = 10,450 – 10,250 = 200
• Choose plug variable– Borrow more short-term (Notes Payable)– Borrow more long-term (LT Debt)– Sell more common stock (CS & APIC)– Decrease dividend payout, which increases the
Additions To Retained Earnings

4-14
Example: Operating at Less than Full Capacity
• Suppose that the company is currently operating at 80% capacity.– Full Capacity sales = 5000 / .8 = 6,250– Estimated sales = $5,500, so would still only be operating at 88%– Therefore, no additional fixed assets would be required.– Pro forma Total Assets = 6,050 + 4,000 = 10,050– Total Liabilities and Owners’ Equity = 10,250
• Choose plug variable– Repay some short-term debt (decrease Notes Payable)– Repay some long-term debt (decrease LT Debt)– Buy back stock (decrease CS & APIC) – Pay more in dividends (reduce Additions To Retained Earnings)– Increase cash account

4-15
Growth and External Financing
• At low growth levels, internal financing (retained earnings) may exceed the required investment in assets
• As the growth rate increases, the internal financing will not be enough and the firm will have to go to the capital markets for money
• Examining the relationship between growth and external financing required is a useful tool in long-range planning

4-16
The Internal Growth Rate
• The internal growth rate tells us how much the firm can grow assets using retained earnings as the only source of financing.
• Using the information from Tasha’s Toy Emporium– ROA = 1200 / 9500 = .1263– B = .5
%74.6
0674.5.1263.1
5.1263.bROA - 1
bROA RateGrowth Internal

4-17
The Sustainable Growth Rate
• The sustainable growth rate tells us how much the firm can grow by using internally generated funds and issuing debt to maintain a constant debt ratio.
• Using Tasha’s Toy Emporium– ROE = 1200 / 4100 = .2927– b = .5
%14.17
1714.5.2927.1
5.2927.bROE-1
bROE RateGrowth eSustainabl

4-18
Determinants of Growth
• Profit margin – operating efficiency
• Total asset turnover – asset use efficiency
• Financial leverage – choice of optimal debt ratio
• Dividend policy – choice of how much to pay to shareholders versus reinvesting in the firm

Thanks for Your Attention