Part 4: Analysing Caribbean and OECS trade with descriptive … · 2016-08-02 · region, and...
61
Part 4: Analysing Caribbean and OECS trade with descriptive statistics Michael Gasiorek Michanne Haynes-Prempeh January 2006 Part of a draft final report, funded by the EC-PREP programme, submitted by Poverty Research Unit, Sussex University to DFID entitled “The impact of the Cotonou Agreement on trade, production and poverty alleviation in the Caribbean region”
Transcript of Part 4: Analysing Caribbean and OECS trade with descriptive … · 2016-08-02 · region, and...
Part 4: Analysing Caribbean and OECS trade
with descriptive statistics
Michael Gasiorek
Michanne Haynes-Prempeh
January 2006
Part of a draft final report, funded by the EC-PREP programme, submitted by PovertyResearch Unit, Sussex University to DFID entitled “The impact of the CotonouAgreement on trade, production and poverty alleviation in the Caribbean region”

2
Contents
4.1 Introduction................................................................................................... 6
4.2 The historical evolution of Caribbean trade.................................................. 9
4.2.1 Changes in aggregate trade flows ........................................................ 10
4.2.2 Changes in extra-regional trade ........................................................... 14
4.2.3 Changes in intra-regional trade flows ................................................. 20
4.3 Changes in the structure of trade ................................................................ 28
4.3.1 Revealed Comparative Advantage....................................................... 28
4.3.2 Decile Analysis ................................................................................... 34
4.3.3 The degree of export diversification in the Caribbean........................ 39
4.4: Assessing the impact of integration ........................................................... 45
4.4.1 Tariffs................................................................................................... 47
4.4.2 A detailed analysis of trade by source ................................................. 49
4.4.3 Finger Kreinin Indices of trade similarity............................................ 53
4.5 Summary and Conclusions ........................................................................ 57
Bibliography: .................................................................................................... 60

3
List of Tables
Table 4.1 Shares in Caricom’s Imports for a sample of 78 countries............................... 10
Table 4.2 Shares in Caricom’s imports of the top ten exporters....................................... 11
Table 4.3 Share of Trade by source : 2000-2003.............................................................. 13
Table 4.4: Revealed Comparative Advantage Correlation Cofficients ............................ 29
Table 4.5: RCA indices greater than 1 - MDCs................................................................ 31
Table 4.6: RCA indices greater than 1 - OECS ................................................................ 33
Table 4.7: Decile analysis for selected MDCs.................................................................. 36
Table 4.7: Decile analysis for selected OECS economies ................................................ 38
Table 4.8: CARICOM Top 20 Export Commodities........................................................ 39
Table 4.9: Caribbean Tariff structure................................................................................ 48
Table 4.10: Share of CARICOM imports by supplier – 2002 .......................................... 51
Table 4.11: Shares of trade for those industries where the reporting country share is
between 40-80%........................................................................................................ 53
Table 4.12 Bilateral Finger-Kreinin Indices ..................................................................... 56

4
List of Figures
Figure 4.1a: Change in Real Total Exports....................................................................... 15
Figure 4.1b Change in Real Total Exports........................................................................ 15
Figure 4.2a Change in Real Total Imports........................................................................ 15
Figure 4.2b Change in Real Total Imports........................................................................ 15
Figure 4.3a Change in Real Exports to the EU................................................................. 17
Figure 4.3b Change in Real Exports to the EU................................................................. 17
Figure 4.4a Change in Real Imports from the EU ............................................................ 17
Figure 4.4b Change in Real Imports from the EU............................................................ 17
Figure 4.5a Change in Real Exports to NAFTA............................................................... 18
Figure 4.5b Change in Real Exports to NAFTA............................................................... 18
Figure 4.6a Change in Real Imports from NAFTA .......................................................... 18
Figure 4.6b Change in Real Imports from NAFTA.......................................................... 18
Figure 4.7a: Caricom total regional exports ..................................................................... 20
Figure 4.7b: Caricom total regional imports..................................................................... 21
Figure 4.8: Non-OECS Caricom Regional Exports.......................................................... 22
Figure 4.9: Trinidad and Tobago Regional Exports ......................................................... 22
Figure 4.10a Change in Real Exports to (non-OECS) CARICOM ................................. 24
Figure 4.10b Change in Real Exports to (non-OECS) Caricom....................................... 24
Figure 4.11a Change in Real Exports to the OECS......................................................... 24
Figure 4.12b Change in Real Exports to the OECS.......................................................... 24
Figure 4.13a Change in Real Imports from (non-OECS) CARICOM.............................. 26
Figure 4.13b Change in Real Imports from (non-OECS) CARICOM ............................. 26
Figure 4.14a Change in Real Imports from the OECS ..................................................... 26

5
Figure 4.14b Change in Real Imports from the OECS ..................................................... 26
Figure 4.15: Levels of export concentration in the Caribbean - 2000 .............................. 41
Figure 4.16: Herfindahl indices for Barbados, Trinidad and Jamaica .............................. 42
Figure 4.17 Main Exports for Barbados ........................................................................... 43
Figure 4.18 OECS Herfindahl indices .............................................................................. 43
Figure 4.19 Dominica: Main export categories ................................................................ 44
Figure 4.20 St Kitts and Nevis: principal exports............................................................. 45

6
4.1 Introduction1
In this part of the report, we examine key features of Caribbean trade as well as
their evolution over time. We do this by looking both at aggregate trade statistics by
source, and also by considering a number of descriptive statistical trade indicators. The
aim of this analysis is first, to provide an overview of the evolution of Caribbean trade
flows, and secondly to provide an assessment of the possible impact on the Caribbean
region, and particularly on the OECS economies of possible changes in trade policy, and
notably of an EPA.
This part of the report is therefore divided into three sections. The first focuses on
the evolution of trade over time. This is important not simply as a matter of historical
interest but also because identifying key sources and shifts over time in those source as
well as in the composition of trade is also crucial for assessing the impact of an EPA. The
intention here is to build up an accurate picture of both intra-Caribbean and extra-
Caribbean patterns of trade. This is important in order to see which are the key import and
export markets, to see their evolution over time, and to see the extent to which these
patterns may differ across individual countries, and also across groups of countries, and in
particular the OECS economies.
The second section examines more closely the existing structure of trade. In
analysing the structure of trade, we look at the pattern of revealed comparative advantage
in the Caribbean and how this has changed over time. We also examine the evidence to
see how much change there has been in the composition of Caribbean imports, as well as
analyse the degree of concentration of those export flows. Understanding the sectoral
composition and intensity is also important from the point of view of assessing the
possible impact of an EPA. Highly specialised economies may for example be more
vulnerable to changes in the international trading regime.
1 In parallel to this project a team of University of Sussex economists has been working on another DFIDfunded project whose objective has been to devise a handbook of summary trade statistics which can be usedprecisely for this sort of analysis. There are direct synergies between the two projects and hence thediscussion in this section should be seen as drawing from the work undertaken on both projects. There isconsiderable overlap therefore in the discussion of these indicators.

7
Finally in the third section of the report we focus on the concepts of trade creation,
trade diversion and trade reorientation in order to provide an assessment of the likely
welfare impact of an EPA. These three concepts are crucial in understanding the welfare
consequences of preferential trade liberalisation, and in particular what is often referred to
as shallow integration (the removal of barriers to trade). Any proposed process of
preferential liberalisation is likely to impact on the existing structure of trade and thence
on welfare and patterns of production in the region. In the first instance whether, those
changes in trade flows are likely to be welfare increasing or welfare decreasing will
depend crucially on the extent to which sources of supply shift towards more efficient
suppliers, or away from more efficient suppliers. Both outcomes are possible and the
discussion assesses this in some detail.
It is important to note that a key issue, which arises when discussing Caribbean
trade and trade policy, is the role of regional integration. As discussed earlier this is also
an important dimension of the EPA process. The importance of effective Caribbean
regional integration for economic growth and prosperity has long been established in the
region. However, there are two key caveats to this which often emerge in discussion of the
Caribbean regional integration process, which has also led some to question how
effectively integrated the region really is2. The first is that while integration of the
Caribbean economies is in principle generally endorsed by analysts, there remains
considerable concern particularly within the region as to the intra-regional distributional
consequences arising from the integration process. In essence, the argument here is one
that has been commonly made in many regional trading arrangements where it is felt that
certain countries are more likely to gain from the integration process, while others are
more likely to lose. Underlying this position is the that there are a number of prerequisites
for effective market integration, which for example, include reasonably developed
production structures, the ability to produce at sufficient scale, and thus the need
productive systems to be geared towards extra-regional trade – and that these prerequisites
may well not be shared by all the partners.
Within the Caribbean the argument is thus sometimes made that these prerequisites
are more likely to be present in the “more developed” territories of, for example,
2 See, for example, Trevor Farrell, ‘Five Major Problems for CARICOM’ in The Caribbean Community-Beyond Survival ed. by Kenneth Hall (2001) p 8-16

8
Barbados, Jamaica, and Trinidad and Tobago, and in particular the last of these. In
contrast those islands lacking in these prerequisites, may not be able to take advantage of
expanded regional markets because of underdeveloped productive systems. In this vein, a
recent report Commissioned by the OECS Secretariat states that over the past decade
while there has been an increase in intra-regional exports, that this is due exclusively to
Trinidad and Tobago, and that the OECS, the LDC’s and the MDC’s excluding Trinidad
have lost intra-regional market share. The discussion there suggests that this is a reflection
of the uneven benefits of the regional integration process in the Caribbean3. Clearly the
distribution of the benefits from integration may be unevenly distributed, and the
implications of this need to be addressed by any effective regional integration scheme.
There remain, however, important questions as to how best address such issues, and
whether, for example, introducing special and differential treatment in trade policy is
optimal. These issues are discussed in more detail later in this report.
The second caveat, which emerges concerns the extent to which regional
integration in the Caribbean has de facto been realised. As discussed earlier in Part 2 of
this report, built into the relevant treaties is the explicit recognition of the special and
differential treatment of the LDCs. That special and differential treatment in particular
with regard to tariff and non-tariff barriers serves to introduce intra-regional trade barriers,
which limit the extent of integration in the region. Of course, the very recognition of the
differential treatment of LDCs is firmly grounded and in part justified by the first caveat.
Of course, this is not the only reason. As discussed earlier in the report a second factor
seen as being important for the justification for the differential treatment concerns the
vulnerability of the LDCs. That vulnerability is in part driven by the lack of
“prerequisites”, but also by their vulnerability to natural disasters. Of course, there is no
simple definitive measure of vulnerability. However, economic vulnerability is likely to be
closely related to issues of economic size, and economic diversification.
The changes in trade flows and the movements in the structure and pattern of trade
which we focus on in this part of ther report are to a large extent driven by changes in the
formal trading arrangements, especially with the EU. Hence, under the Lome Convention
the Caribbean ACP economies enjoyed duty free access to the EU for agricultural
products not covered by the EU’s Common Agricultural Policy (CAP). Products covered
3 UN ECLAC, 20005

9
by CAP, which include the majority agricultural goods in which CARICOM and EU are
competitors, are restricted on a case-by-case regime. The agreement also specified special
trade protocols for trade in bananas, beef and veal, as well as rum and sugar, which had
guaranteed that the EU would buy an agreed quantity of these commodities at a price
significantly above world price. In order to insure WTO’s compatibility, the future EPA is
likely to have significant erosion of these preferences. Although for CARICOM in 2001,
sugar, bananas and rum comprise only 5% of total exports, they constitute a third of
exports to the EU. If one excludes two biggest CARICOM economies – Jamaica and
Trinidad and Tobago, which are major exporters of natural resources, such as aluminium
ores and oil respectively, the goods under special protocols are important export
commodities for the remaining countries. The export of bananas comprises nearly half of
exports of St. Lucia and St. Vincent and the Grenadines and almost a quarter in Dominica.
For Barbados, Belize, Dominican Republic, Jamaica and St. Kitts and Nevis in 2000,
sugar was one of the top three export commodities with a total export share from 6.3% to
18.8%.
The removal of these special protocols from the future EPA is, thus likely to have
a significant negative effect on the CARICOM producers of these commodities in favour
of low cost producers in countries like Brazil or Thailand. In most of the Caribbean
economies the total exports share of bananas, sugar, or rum has declined in the past 20
years. This suggests that some degree of diversification has taken place. This is reassuring
as the adjustment costs faced by CARICOM countries from the removal of special
protocols might be mitigated by the structural changes, already taking place, as the
majority of economies in the region move away from high dependence on agricultural
commodities to specialization in tourism and financial services. These are all issues, which
the descriptive statistics we consider in this part of the report shed more light on.
4.2 The historical evolution of Caribbean trade
In this sub-section, the objective is focus on the historical evolution of trade and
trade structure. We do this in two ways. First, we devote some space to considering
patterns of trade, and changes in those patterns of trade over time. Here we look at the data
on trade flows by source and consider carefully how those trade flows have changed over
time. We do this both for the region as a whole and also, where relevant, in some detail for

10
individual countries, as well as looking intra-and extra-regional flows. Secondly, we use
summary descriptive statistical indicators, which shed light on the evolution of the
underlying structure of trade for the Caribbean economies over time. Specifically our
analysis involves examining indices of revealed comparative advantage, and changes in
decile trade shares.
4.2.1 Changes in aggregate trade flows
In Table 4.1. we examine the changing pattern of trade shares over time. The table
gives the geographic distribution of CARICOM’s trade, by exploring the shares of imports
accounted by the main economic groups and other relevant regions from 1995 onwards.
These trade shares display relative stability over the period analysed. The key series,
which presents a downward trend is the share of Nafta in Caricom’s imports, which starts
with 59% of imports in 1995 and declines to 44% by 2002. There is a sharp fall in Nafta
from 1995 to 1996, which is matched with increases in the shares of Caricom and
“Others”. Among the latter, Colombia and Venezuela exhibit an increased level of exports
to Caricom in that year, which is likely to be explained by the trade liberalisation
processes initiated in 1994 and 1993 respectively, which then required three years to
become fully implemented.
Table 4.1 Shares in Caricom’s Imports for a sample of 78 countries
1995 1996 1997 1998 1999 2000 2001 2002Nafta 59.48% 50.51% 57.62% 57.54% 55.33% 53.01% 51.20% 43.87%EU 13.42% 15.02% 13.11% 12.86% 11.43% 10.61% 13.26% 14.32%Caricom 7.98% 10.01% 8.47% 8.42% 9.87% 10.11% 8.03% 9.33%Japan 4.25% 4.70% 4.66% 4.95% 5.40% 4.13% 3.09% 4.75%Others 3.71% 9.56% 7.07% 7.07% 8.38% 11.94% 10.53% 10.39%Mercosur 2.16% 2.08% 1.40% 1.56% 1.26% 1.67% 2.69% 3.39%Central America 1.22% 1.60% 1.25% 1.48% 1.92% 1.84% 4.23% 2.70%Associated States 0.04% 0.01% 0.02% 0.01% 0.01% 0.01% 0.02% 0.01%Pacific 0.00% 0.00% 0.00% 0.00% 0.00% 0.01% 0.00% 0.00%Sample Sub Total 92.25% 93.50% 93.61% 93.90% 93.60% 93.34% 93.04% 88.77%Total 100.00% 100.00% 100.00% 100.00% 100.00% 100.00% 100.00% 100.00%Source: Author's Calculations based on data from World Bank"Associated States" stands for the countries that are Associated to Caricom but do not share the same CET."Mercosur" includes Argentina and Brazil"Others" includes a group of relevant industrialised countries plus Colombia Venezuela and Ecuador."EU" stands for the European Union (25 countries)"Pacific" includes the Pacific islands included in ACP
Shares in Caricom's Imports for a sample of 78 countries
11
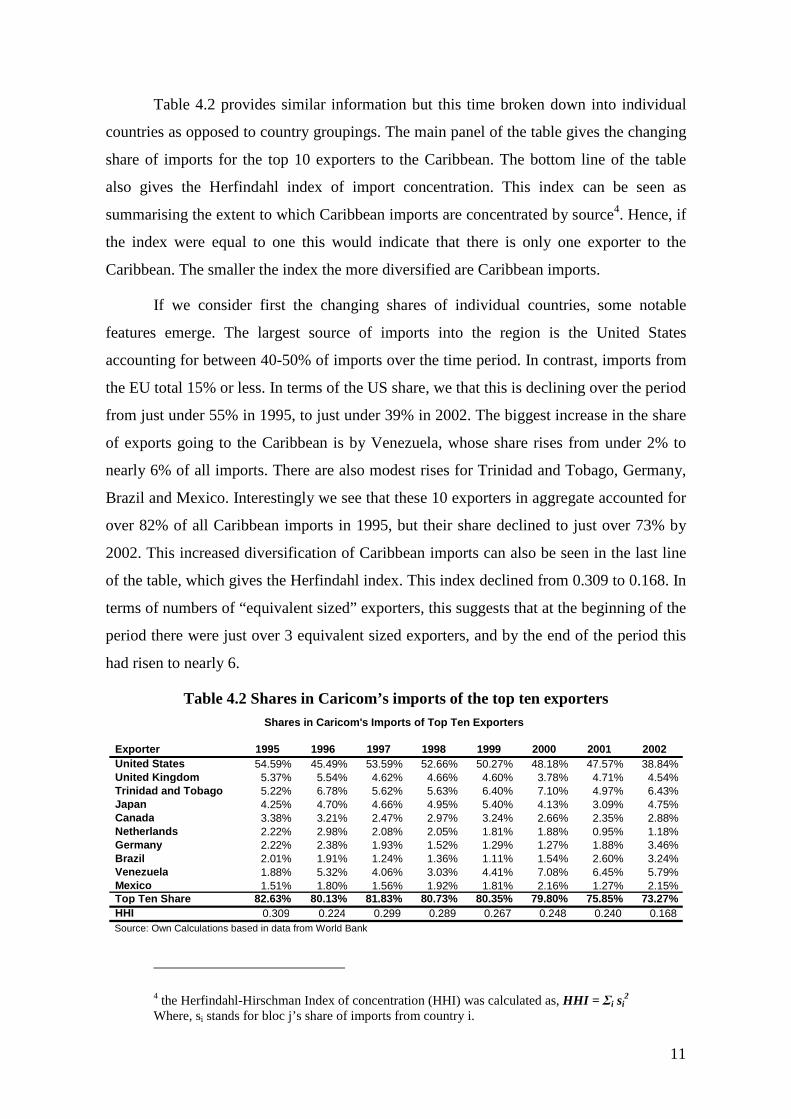
Table 4.2 provides similar information but this time broken down into individual
countries as opposed to country groupings. The main panel of the table gives the changing
share of imports for the top 10 exporters to the Caribbean. The bottom line of the table
also gives the Herfindahl index of import concentration. This index can be seen as
summarising the extent to which Caribbean imports are concentrated by source4. Hence, if
the index were equal to one this would indicate that there is only one exporter to the
Caribbean. The smaller the index the more diversified are Caribbean imports.
If we consider first the changing shares of individual countries, some notable
features emerge. The largest source of imports into the region is the United States
accounting for between 40-50% of imports over the time period. In contrast, imports from
the EU total 15% or less. In terms of the US share, we that this is declining over the period
from just under 55% in 1995, to just under 39% in 2002. The biggest increase in the share
of exports going to the Caribbean is by Venezuela, whose share rises from under 2% to
nearly 6% of all imports. There are also modest rises for Trinidad and Tobago, Germany,
Brazil and Mexico. Interestingly we see that these 10 exporters in aggregate accounted for
over 82% of all Caribbean imports in 1995, but their share declined to just over 73% by
2002. This increased diversification of Caribbean imports can also be seen in the last line
of the table, which gives the Herfindahl index. This index declined from 0.309 to 0.168. In
terms of numbers of “equivalent sized” exporters, this suggests that at the beginning of the
period there were just over 3 equivalent sized exporters, and by the end of the period this
had risen to nearly 6.
Table 4.2 Shares in Caricom’s imports of the top ten exporters
Exporter 1995 1996 1997 1998 1999 2000 2001 2002United States 54.59% 45.49% 53.59% 52.66% 50.27% 48.18% 47.57% 38.84%United Kingdom 5.37% 5.54% 4.62% 4.66% 4.60% 3.78% 4.71% 4.54%Trinidad and Tobago 5.22% 6.78% 5.62% 5.63% 6.40% 7.10% 4.97% 6.43%Japan 4.25% 4.70% 4.66% 4.95% 5.40% 4.13% 3.09% 4.75%Canada 3.38% 3.21% 2.47% 2.97% 3.24% 2.66% 2.35% 2.88%Netherlands 2.22% 2.98% 2.08% 2.05% 1.81% 1.88% 0.95% 1.18%Germany 2.22% 2.38% 1.93% 1.52% 1.29% 1.27% 1.88% 3.46%Brazil 2.01% 1.91% 1.24% 1.36% 1.11% 1.54% 2.60% 3.24%Venezuela 1.88% 5.32% 4.06% 3.03% 4.41% 7.08% 6.45% 5.79%Mexico 1.51% 1.80% 1.56% 1.92% 1.81% 2.16% 1.27% 2.15%Top Ten Share 82.63% 80.13% 81.83% 80.73% 80.35% 79.80% 75.85% 73.27%HHI 0.309 0.224 0.299 0.289 0.267 0.248 0.240 0.168Source: Own Calculations based in data from World Bank
Shares in Caricom's Imports of Top Ten Exporters
4 the Herfindahl-Hirschman Index of concentration (HHI) was calculated as, HHI = Σi si2
Where, si stands for bloc j’s share of imports from country i.

12
In the above two tables we considered the pattern of trade over time but for the
Caribbean region as a whole. The data indicate that the Caribbean share has been
relatively stable in aggregate, and that the key regional supplier is Trinidad and Tobago.
The data also indicate quite a high degree of reorientation of imports away from the US
largely towards new suppliers. We now turn to looking at more detail at individual
countries. This is important because as we saw earlier there is considerable diversity
among the Caricom islands and it is therefore likely that the evolution of their trade and
trade patterns is likely to differ. For example the EU has been consistently an important
export market for Jamaica (around 30% of exports), while less for other countries such as
Trinida and Tobago (varying between 9%-14% over 1980-2001). For the Bahamas, the
share of EU exports has risen from 9% in 1995 to 17.8% in 2001. Conversely, for St.
Kitts, the share of exports going to the EU has declined from 40% in 1995 to 21% in 2000.
It is also important to see the extent to which the experience of the OECS islands
may differ from the remaining Caricom economies. Indeed as cited earlier, a recent
ECLAC report commissioned by the OECS economies suggested that�“the most intra-
regional oriented group and hence the most dependent group [ie the OECS] has lost,
according to most sources, intra-regional market share”5. That loss of market share is then
clearly seen by the report as evidence of the relative lack of success of the regional
integration process for these islands. These are important issues, which need careful
examining.
In Table 4.3 we first look at the share of both imports and exports by source for
each of the Caribbean economies. These are average shares for the years 2000-2003
inclusive. The reason for taking a four-year average is that for small economies such as
these trade flows from year to year can be subject to fluctuation. Consider first the left
hand panel. Here we see that the US is the principal supplier for all of the Caribbean
economies except Suriname, and for 10 of the 14 economies listed here the Caribbean
region itself is the principal supplier. As a supplier of imports, the EU for most of the
islands ranks relatively low. The picture is slightly different when looking at exports,
where the EU is clearly a more important supplier in many cases. For some economies -
Barbados, Surinam and the OECS micro-states such as St. Lucia, St. Vincent and the
5 ECLAC, 2005, Bracketed term added.

13
Grenadines, the EU tends to be the most important export market. The OECS micro-states
and Barbados have long lasting trade relations with the UK which go back to the colonial
period. On average, the share of CARICOM exports going to the EU has tended to be
somewhat stable over the last 20 years, with the range varying between 15%-20%, while
as seen earlier the share of exports going to the US has fluctuated somewhat more, with
54.7% of exports going to the US in 1980, and 40.8% in 2001.
What is also striking about the right hand panel of the table is the importance of
the Caribbean region as a destination for the exports of several of the islands. This is most
marked for Antigua and Barbuda where 77% of their exports go to the Caribbean region,
but the region is also important for Barbados (48%), Dominica, Montserrat, and St
Vincent and the Grenadines (in each case 60%). Although not directly of concern in this
chapter, in terms of the welfare effects of any proposed EPA this pattern of trade is likely
to be important in determining in the first instance the extent of any trade creation and
trade diversion.
Table 4.3 Share of Trade by source : 2000-2003
Share of imports by source Share of exports by source
CAR. EEC15 USA CAR. EEC15 USA
Antigua and Barbuda 0.13 0.10 0.49 0.77 0.05 0.06Bahamas 0.01 0.02 0.83 0.00 0.28 0.68Barbados 0.20 0.17 0.42 0.48 0.20 0.18Belize 0.04 0.08 0.46 0.07 0.25 0.51Dominica 0.28 0.16 0.36 0.60 0.29 0.06Grenada 0.25 0.12 0.47 0.17 0.38 0.40Guyana 0.18 0.12 0.38 0.14 0.25 0.33Jamaica 0.12 0.08 0.45 0.03 0.30 0.39Montserrat 0.18 0.10 0.60 0.60 0.08 0.27St. Kitts and Nevis 0.18 0.13 0.51 0.03 0.23 0.73St. Lucia 0.24 0.16 0.42 0.30 0.54 0.15St. Vincent & the Gr. 0.27 0.21 0.35 0.60 0.36 0.01Suriname 0.20 0.29 0.27 0.06 0.32 0.21Trinidad and Tobago 0.03 0.18 0.34 0.20 0.09 0.42
Source: UN Comtrade database
If we take Caricom as a grouping, we see that the United States is not surprisingly
then the prime destination for Caricom exports, accounting for about 40% of the value of
goods exported. Less than 20% of aggregate CARICOM exports go to the EU. For
example, data from 2001 shows that over 93% of the CARICOM exports to the United
States have come from the MDCs, where as exports from the OECS have only accounted

14
for 2.4% of total exports to the United States. On the other hand, goods from the OECS
accounted for nearly 20% of all goods exported to the United Kingdom from CARICOM
in 2001, and goods from the MDCs, only 70% indicating the importance of the UK and
EU market to the OECS states relative to the United States.
The preceding provides a snapshot of the pattern of trade by individual islands and
as with many of the preceding tables focuses on shares. Shares are an extremely useful
statistic for considering the relative importance, for example, of different suppliers.
However, the use of shares can also mask important changes taking place. For example,
earlier we cited the ECLAC report which identified the declining share of the OECS in
intra-regional Caribbean trade. That declining share could occur because of declining
OECS imports and exports, or in context where OECS imports and exports are rising, but
not as fast as other suppliers in the region. The conclusions that one might wish to draw
under the two scenarios could be quite different. In the analysis that follows therefore, we
consider the changing pattern of trade by country with regard to different sources, but
rather than looking at changes in the share of trade, we look more directly at the total
value of trade. Importantly the data is in constant as opposed to current prices. This
enables us to see if there have been any changes in real trade flows over the period 1990-
2000. For ease of exposition and analysis, we present the data graphically.
4.2.2 Changes in extra-regional trade
Figures 4.1a and 4.1b give the change in total exports by the Caribbean economies
for which consistent data were available. Figures 4.2a and 4.2b, give the corresponding
changes in imports. In each case, the first panel gives the change in exports by the non-
OECS Caricom economies, and the latter gives the change in exports for five of the OECS
economies. Consider first Figure 4.1a. The striking feature in this table is the substantial
rise in the real value of the exports of Trinidad and Tobago which nearly double over this
time period. For Jamaica, there is a significant decline in the value of total real exports
while the series for Barbados and for Belize are relatively stable.

Figure 4.1a: Change in Real Total Exports
0500000
100000015000002000000
25000003000000
1990
1991
1992
1993
1994
1995
1996
1997
1998
1999
2000
2001
2002
US
do
llars
BLZ
BRB
JAM
TTO
Figure 4.1b Change in Real Total Exports
0
50000
100000
150000
200000
1990
1991
1992
1993
1994
1995
1996
1997
1998
1999
2000
2001
2002
US
do
llars ATG
DMA
KNA
LCA
VCT
Figure 4.2a Change in Real Total Imports
0
500000
1000000
1500000
2000000
2500000
3000000
3500000
1990
1991
1992
1993
1994
1995
1996
1997
1998
1999
2000
2001
2002
US
do
llars
BLZ
BRB
JAM
TTO
Figure 4.2b Change in Real Total Imports
0
50000
100000
150000
200000
250000
300000
350000
1990
1991
1992
1993
1994
1995
1996
1997
1998
1999
2000
2001
2002
US
do
llars ATG
DMA
KNA
LCA
VCT

16
For Trinidad and Tobago, concomitant with the rise in exports we see a rise in
imports over the period. There is also a rise in real imports for Jamaica, which with
the decline in exports implies a significant worsening of the trade balance. As with
exports, for Barbados and Belize there is little real change in imports over the period.
If we turn to the OECS economies (Figure 4.1b), we see that not surprisingly the
overall levels of trade are much lower. Two of the islands (St.Kitts and Nevis, and
St.Vincent and the Grenadines) see a small overall rise in the overall pattern of their
exports over the time period; Dominica’s exports are fairly stable until the year 1999
after which they see a decline. The biggest overall decline in exports is that
experienced by St.Lucia, which sees a steady and substantial decline over the period.
For each of these economies (except Antigua and Barbuda for whom there is
insufficient data) real imports remain fairly constant throughout the time period,
though with some decline towards the end of the period for St Lucia, Dominica, and
St Vincent and the Grenadines.
In the subsequent graphs, we break these overall changes in export flows
down into different regional sources and destinations. In this section, we consider
extra-regional sources and destinations, and then subsequently we consider regional
trade flows by focussing on trade with the non-OECS Caricom countries, and the
OECS countries. As above, we look at the changes in export and import flows for
selected non-OECS Caricom economies and selected OECS economies depending on
data availability.
If we focus on the figures themselves, a number of features then emerge. First
consider the overall rise in the exports of Trinidad and Tobago. We see that this is
principally driven by the rise in exports to the US especially towards the end of the
period in question. Interestingly exports to the EU rise in the first part of the period
but then decline from 1998 onwards, and there is a similar pattern also for Belize. For
Trinidad and Tobago while there is tailing off of exports to the EU, there is a
substantial increase in imports. The decline in Jamaican exports occurs with respect to
both NAFTA and the EU, and with respect to both these markets there is a steady
increase in real imports over this time period. As in the aggregate graphs, there tends
to be less movement in the real pattern of trade for Belize and for Barbados. Both
imports and exports with regard to NAFTA and the EU remain fairly constant over

17
the time period. There is some evidence of a decline in both imports and exports with
respect to NAFTA for Barbados towards the end of the period.
Figure 4.3a Change in Real Exports to the EU
0
100000
200000
300000
400000
500000
1990
1991
1992
1993
1994
1995
1996
1997
1998
1999
2000
2001
2002
US
do
llars
BLZ
BRB
JAM
TTO
Figure 4.3b Change in Real Exports to the EU
0
20000
40000
60000
80000
100000
120000
1990
1991
1992
1993
1994
1995
1996
1997
1998
1999
2000
2001
2002
US
do
llars ATG
DMA
KNA
LCA
VCT
Figure 4.4a Change in Real Imports from the EU
0
100000
200000
300000
400000
500000
600000
1990
1991
1992
1993
1994
1995
1996
1997
1998
1999
2000
2001
2002
US
do
llars
BLZ
BRB
JAM
TTO
Figure 4.4b Change in Real Imports from the EU
0
10000
20000
30000
40000
50000
60000
70000
1990
1991
1992
1993
1994
1995
1996
1997
1998
1999
2000
2001
2002
US
do
llars ATG
DMA
KNA
LCA
VCT

18
Figure 4.5a Change in Real Exports to NAFTA
0
500000
1000000
1500000
2000000
1990
1991
1992
1993
1994
1995
1996
1997
1998
1999
2000
2001
2002
US
do
llars
BLZ
BRB
JAM
TTO
Figure 4.5b Change in Real Exports to NAFTA
0
10000
20000
30000
40000
50000
1990
1991
1992
1993
1994
1995
1996
1997
1998
1999
2000
2001
2002
US
do
llars
ATG
DMA
KNA
LCA
VCT
Figure 4.6a Change in Real Imports from NAFTA
0200000400000600000800000
1000000120000014000001600000
1990
1991
1992
1993
1994
1995
1996
1997
1998
1999
2000
2001
2002
US
do
llars
BLZ
BRB
JAM
TTO
Figure 4.6b Change in Real Imports from NAFTA
020000400006000080000
100000120000140000160000180000
1990
1991
1992
1993
1994
1995
1996
1997
1998
1999
2000
2001
2002
US
do
llars ATG
DMA
KNA
LCA
VCT

19
What is particularly interesting is to look at the diverse experience of the
OECS islands. If we take St.Lucia we see a decline in overall exports, which appears
primarily driven by a decline in exports to the EU and to some extent with respect to
NAFTA. The change in exports to the EU is no doubt driven by the changes in the
banana regime over this time period, and similarly we see a decline in exports to the
EU for Dominica, though not to the same extent. There is a smaller decline also in
Dominca’s exports to NAFTA (except for a solitary marked rise in 2000).
In contrast, the exports of St.Kitts and Nevis to the EU are fairly stable over
this period – though of course it should be noted that with the changes in the sugar
regime post 2002, it is likely that more recent data would indicate a decline in exports.
Interestingly, there is a steady rise in the exports of St. Kitts and Nevis to the NAFTA
region, and a small rise for St Vincent and the Grenadines towards the end of the
period. The latter sees a decline in exports to the EU in the first part of the period
followed by also a subsequent rise.
In comparison, the changes in import flow tend to be more stable over time,
with imports from the EU declining most notably again for St Lucia, but also for
Dominica, while remaining more or less contant for St Vincent and the Grenadines,
and for St. Kitts. With regard to imports from NAFTA, St.Kitts and Nevis steadily
increase the real value of their imports, while the remaining countries real trade flows
remain fairly constant over this period.
Overall then a key conclusion to be drawn from this analysis is that the
experience of the Caribbean region is highly diverse. Clearly the economy which
appears to have been most successfully increasing its’ import and export flows is
Trinidad and Tobago. However, it is not generally the case that the non-OECS
Caricom countries’ experience differs substantially to that of the OECS. The
distinction is perhaps more between Trinidad and Tobago and the remaining
economies. With regard to the remaining economies, the biggest declines in exports
appear to have occurred for Jamaica and for St.Lucia. For each of these that decline is
with respect to both their principal export markets - NAFTA and the EU.
20
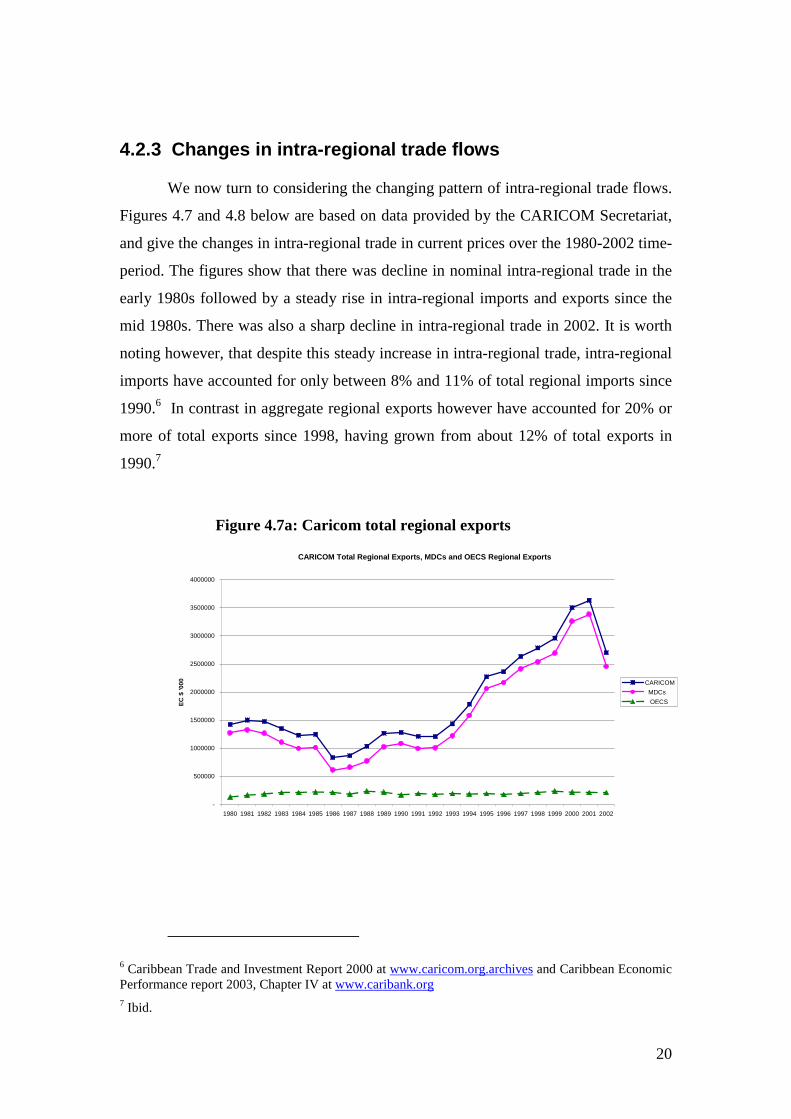
4.2.3 Changes in intra-regional trade flows
We now turn to considering the changing pattern of intra-regional trade flows.
Figures 4.7 and 4.8 below are based on data provided by the CARICOM Secretariat,
and give the changes in intra-regional trade in current prices over the 1980-2002 time-
period. The figures show that there was decline in nominal intra-regional trade in the
early 1980s followed by a steady rise in intra-regional imports and exports since the
mid 1980s. There was also a sharp decline in intra-regional trade in 2002. It is worth
noting however, that despite this steady increase in intra-regional trade, intra-regional
imports have accounted for only between 8% and 11% of total regional imports since
1990.6 In contrast in aggregate regional exports however have accounted for 20% or
more of total exports since 1998, having grown from about 12% of total exports in
1990.7
Figure 4.7a: Caricom total regional exports
CARICOM Total Regional Exports, MDCs and OECS Regional Exports
-
500000
1000000
1500000
2000000
2500000
3000000
3500000
4000000
1980 1981 1982 1983 1984 1985 1986 1987 1988 1989 1990 1991 1992 1993 1994 1995 1996 1997 1998 1999 2000 2001 2002
EC
$'0
00 CARICOM
MDCs
OECS
6 Caribbean Trade and Investment Report 2000 at www.caricom.org.archives and Caribbean EconomicPerformance report 2003, Chapter IV at www.caribank.org7 Ibid.
21
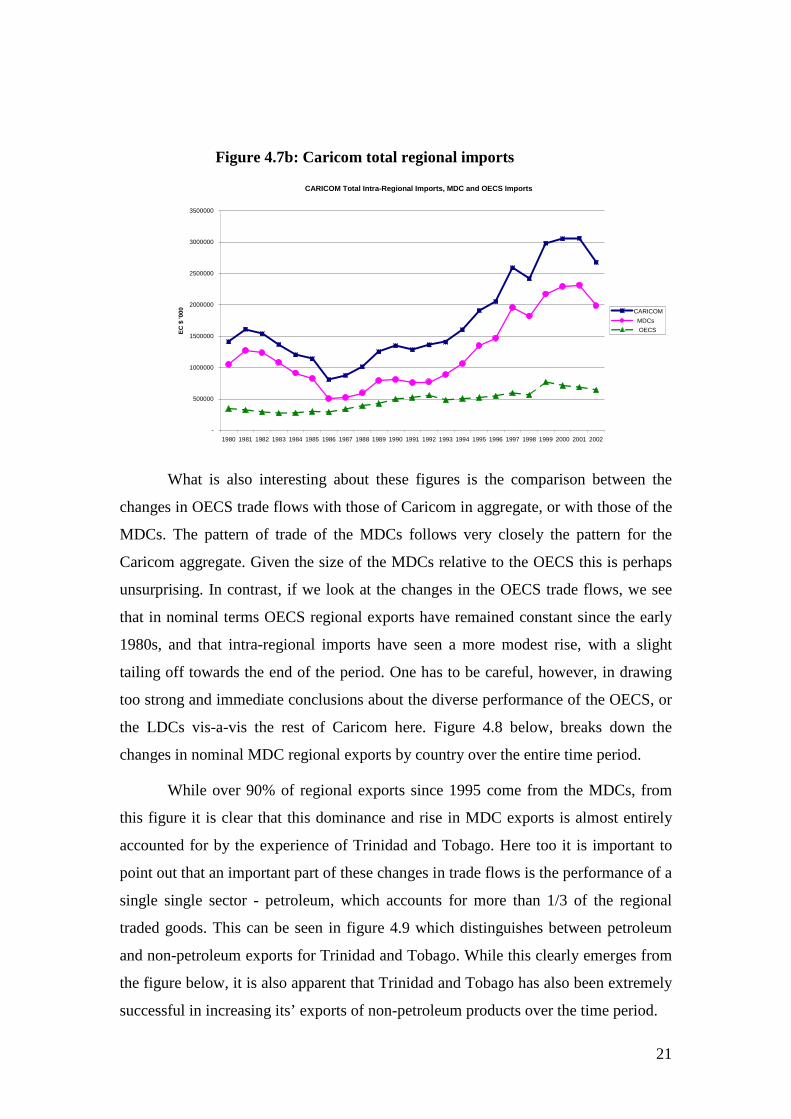
Figure 4.7b: Caricom total regional imports
CARICOM Total Intra-Regional Imports, MDC and OECS Imports
-
500000
1000000
1500000
2000000
2500000
3000000
3500000
1980 1981 1982 1983 1984 1985 1986 1987 1988 1989 1990 1991 1992 1993 1994 1995 1996 1997 1998 1999 2000 2001 2002
EC
$'0
00 CARICOM
MDCs
OECS
What is also interesting about these figures is the comparison between the
changes in OECS trade flows with those of Caricom in aggregate, or with those of the
MDCs. The pattern of trade of the MDCs follows very closely the pattern for the
Caricom aggregate. Given the size of the MDCs relative to the OECS this is perhaps
unsurprising. In contrast, if we look at the changes in the OECS trade flows, we see
that in nominal terms OECS regional exports have remained constant since the early
1980s, and that intra-regional imports have seen a more modest rise, with a slight
tailing off towards the end of the period. One has to be careful, however, in drawing
too strong and immediate conclusions about the diverse performance of the OECS, or
the LDCs vis-a-vis the rest of Caricom here. Figure 4.8 below, breaks down the
changes in nominal MDC regional exports by country over the entire time period.
While over 90% of regional exports since 1995 come from the MDCs, from
this figure it is clear that this dominance and rise in MDC exports is almost entirely
accounted for by the experience of Trinidad and Tobago. Here too it is important to
point out that an important part of these changes in trade flows is the performance of a
single single sector - petroleum, which accounts for more than 1/3 of the regional
traded goods. This can be seen in figure 4.9 which distinguishes between petroleum
and non-petroleum exports for Trinidad and Tobago. While this clearly emerges from
the figure below, it is also apparent that Trinidad and Tobago has also been extremely
successful in increasing its’ exports of non-petroleum products over the time period.

22
Figure 4.8: Non-OECS Caricom Regional Exports
MDCs Regional Exports
-
500000
1000000
1500000
2000000
2500000
3000000
1980
1981
1982
1983
1984
1985
1986
1987
1988
1989
1990
1991
1992
1993
1994
1995
1996
1997
1998
1999
2000
2001
2002
EC
$'0
00
BARBADOS
GUYANA
JAMAICA
SURINAME
TRINIDAD & TOBAGO
Figure 4.9: Trinidad and Tobago Regional Exports
Trinidad and Tobago Regional Exports
0
500000
1000000
1500000
2000000
2500000
3000000
1990 1991 1992 1993 1994 1995 1996 1997 1998 1999 2000
EC
$'0
00
Exports less Petroleum Products
Total Regional Exports
Where the preceding figures considered the changes in nominal trade flows
since 1980 we now turn to looking at the changes in regional trade flows in constant
prices, since the early 1990s, and where as before we break this down by country. In
terms of looking at the regional trade flows, we distinguish between flows with the
non-OECS Caricom countries, and flows with the OECS. We saw earlier in Table 4.3
that the region is an extremely important destination market for a number of the

23
economies. In particular, this was the case for Antigua and Barbuda, Barbados,
Dominica, Monsterrat, St.Lucia, and St.Vincent and the Grenadines. What is clear
from this list is the importance of the regional market for most of the OECS
economies. For example, since 1996, close to 50% of Dominica’s total exports have
gone to the CARICOM market, and in 1998 that figure was 78.3%. St. Vincent and
the Grenadines has also sold more than 50% of its exports to other CARICOM
markets since 1994.8 Similarly the ECLAC reports states that,
‘...as a sub-regional grouping, the OECS exhibit the highest degree ofdependency on intra-regional trade flows. For 1985-2000, the average exportand import share for the OECS equaled 30% and 22% whereas for the LDC’sand MDC’s these reached 18% and 13% and 12% and 9% respectively.’
It is then the decline in the regional share from 2.4% to 1.4% of total trade
between 1980-2003 which the ECLAC reports suggests is an indicator of the regional
difficulties facing the OECS.
As discussed earlier in considering these issues it is important not only to
consider shares, but also to consider changes in the real value of imports and exports.
For shares can decline in a context of rising or falling growth. It is also worth pointing
out that the extent of intra-regional trade is addressed more formally in Part 5 of this
report in the context of a gravity modelling framework. For the remainder of this
section, therefore, we turn to a discussion of the changes in the real value of intra
regional trade by country. These changes can be seen in figures 4.10-4.14.
If we turn first to Figures 4.10 and 4.11, we see a number of features. First, the
rise in the exports of Trinidad and Tobago, which we saw earlier with respect to
NAFTA and the EU, is also present with regard to the non-OECS Caricom countries,
and with regard to the OECS economies. The intra-regional exports of the other
MDCs remain fairly constant over the time period, with perhaps again some evidence
of a small decline towards the end of the period for Barbados. The overall picture for
the MDCs is therefore very similar to the changes in aggregate exports described
earlier.
8 Caribbean Trade and Investment Report 2000.

24
Figure 4.10a Change in Real Exports to (non-OECS) CARICOM
0
100000
200000
300000
400000
500000
1990
1991
1992
1993
1994
1995
1996
1997
1998
1999
2000
2001
2002
US
do
llars
BLZ
BRB
JAM
TTO
Figure 4.10b Change in Real Exports to (non-OECS) Caricom
0
5000
10000
15000
20000
25000
1990
1991
1992
1993
1994
1995
1996
1997
1998
1999
2000
2001
2002
US
do
llars ATG
DMA
KNA
LCA
VCT
Figure 4.11a Change in Real Exports to the OECS
0
20000
40000
60000
80000
100000
120000
140000
1990
1991
1992
1993
1994
1995
1996
1997
1998
1999
2000
2001
2002
US
do
llars
BLZ
BRB
JAM
TTO
Figure 4.12b Change in Real Exports to the OECS
02000400060008000
100001200014000
1990
1991
1992
1993
1994
1995
1996
1997
1998
1999
2000
2001
2002
US
do
llars ATG
DMA
KNA
LCA
VCT
25
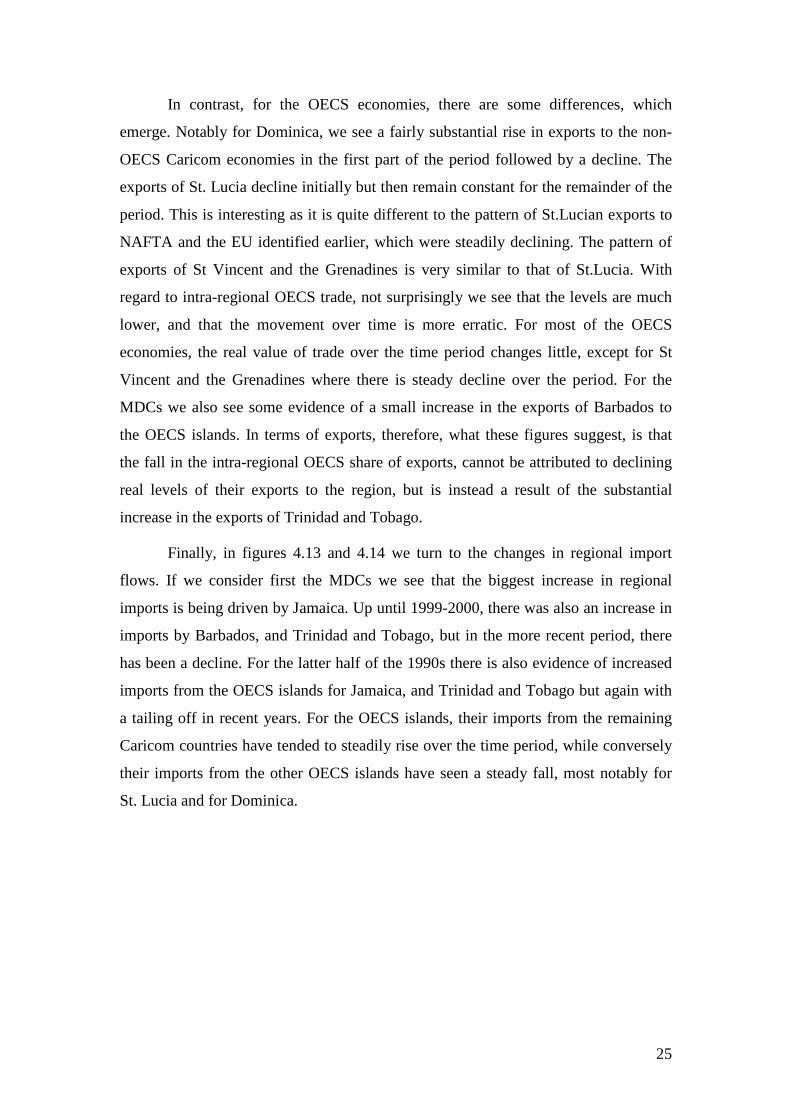
In contrast, for the OECS economies, there are some differences, which
emerge. Notably for Dominica, we see a fairly substantial rise in exports to the non-
OECS Caricom economies in the first part of the period followed by a decline. The
exports of St. Lucia decline initially but then remain constant for the remainder of the
period. This is interesting as it is quite different to the pattern of St.Lucian exports to
NAFTA and the EU identified earlier, which were steadily declining. The pattern of
exports of St Vincent and the Grenadines is very similar to that of St.Lucia. With
regard to intra-regional OECS trade, not surprisingly we see that the levels are much
lower, and that the movement over time is more erratic. For most of the OECS
economies, the real value of trade over the time period changes little, except for St
Vincent and the Grenadines where there is steady decline over the period. For the
MDCs we also see some evidence of a small increase in the exports of Barbados to
the OECS islands. In terms of exports, therefore, what these figures suggest, is that
the fall in the intra-regional OECS share of exports, cannot be attributed to declining
real levels of their exports to the region, but is instead a result of the substantial
increase in the exports of Trinidad and Tobago.
Finally, in figures 4.13 and 4.14 we turn to the changes in regional import
flows. If we consider first the MDCs we see that the biggest increase in regional
imports is being driven by Jamaica. Up until 1999-2000, there was also an increase in
imports by Barbados, and Trinidad and Tobago, but in the more recent period, there
has been a decline. For the latter half of the 1990s there is also evidence of increased
imports from the OECS islands for Jamaica, and Trinidad and Tobago but again with
a tailing off in recent years. For the OECS islands, their imports from the remaining
Caricom countries have tended to steadily rise over the time period, while conversely
their imports from the other OECS islands have seen a steady fall, most notably for
St. Lucia and for Dominica.

26
Figure 4.13a Change in Real Imports from (non-OECS) CARICOM
0
50000
100000
150000
200000
250000
300000
350000
1990
1991
1992
1993
1994
1995
1996
1997
1998
1999
2000
2001
2002
US
do
llars
B LZ
B R B
J A M
TTO
Figure 4.13b Change in Real Imports from (non-OECS) CARICOM
0
10000
20000
30000
40000
50000
60000
1990
1991
1992
1993
1994
1995
1996
1997
1998
1999
2000
2001
2002
US
do
llars
A T G
D M A
K N A
LC A
V C T
Figure 4.14a Change in Real Imports from the OECS
0
5000
10000
15000
20000
25000
1990
1991
1992
1993
1994
1995
1996
1997
1998
1999
2000
2001
2002
US
do
llars
BLZ
BRB
JAM
TTO
Figure 4.14b Change in Real Imports from the OECS
0
2000
4000
6000
8000
10000
12000
14000
16000
1990
1991
1992
1993
1994
1995
1996
1997
1998
1999
2000
2001
2002
US
do
llars
ATG
DMA
KNA
LCA
VCT

27
In summary then we see that examination of aggregate trade statistics for the
Caribbean region is likely then to be dominated by the experience of Trinidad and
Tobago, and partly, in turn, by the role of the petroleum sector in this economy. In
particular, the declining intra-regional share of trade can be attributed to the growth of
the trade of Trinidad and Tobago more than to declining export and import
performance of individual island. This is important for the discussion about the
distribution of the benefits from regional integration across countries. It is clear that
Trinidad and Tobago have been more successful than other Caribbean economies in
increasing their imports and exports. However, this is not simply an intra-regional
phenomenon and it is hard to attribute this to the process of Caribbean regional
integration. The increase in trade is also true with regard to their internal and external
trading partners. There are two economies, which have experienced a relatively
significant decline in the real value of their exports over the period in question and
these are Jamaica, and St. Lucia. What is interesting is that this decline in overall
exports is partly matched by a decline in intra-regional exports for Jamaica but not for
St.Lucia.
The overall picture that emerges from this analysis is then one, which
indicates considerable diversity in the evolution of trade flows by both reporting
(source) country and by partner country. From the point of view of the EPAs a further
significant feature of the above analysis is that the Caribbean and the OECS
economies tend to import comparatively little from the EU. To some extent, this is
also true with regard to their export flows. For certain countries it is clear that the EU
remains an important market, but that is being impacted upon by a number of factors.
This includes the gradual erosion of preferences in the EU market for the Caribbean
region, the on-going changes in the banana and sugar protocols, and also in the
expansion of trade agreements, which the Caribbean region is engaged in with other
countries. As an export destination then, the EU is clearly important for certain
product categories (bananas, sugar), and thus also for certain countries. As a supplier
of imports, the EU is typically less important. This has important implications in
considering the possible impact of an EPA. In particular the importance of third
country markets as suppliers, suggests that a regional agreement with the EU may
well contain considerable scope for trade diversion, which would then serve to

28
mitigate against substantial positive welfare improvements. This issue is taken up in
more detail below.
4.3 Changes in the structure of trade
In the preceding section, we examined in some detail the evolution of
aggregate trade over time and by source. This gives us important information with
regard to key import and export markets and the direction in which these are
changing. The evidence also suggested that there may be considerable scope for trade
diversion arising from a future EPA. The preceding analysis, however gives us little
information on the underlying composition of that trade. Nor does it give us
information on the underlying competitiveness of the region. These are issues to
which we now turn, where we consider several relevant descriptive statistics. The
indicators we consider include the Balassa index of revealed comparative advantage, a
decile analysis of the composition of trade over time, and the Hirschmann-Herfindahl
index of export and import concentration.
4.3.1 Revealed Comparative Advantage
A commonly used statistical indicator is the Balassa index of revealed
comparative advantage. This index helps to indicate at the level of an individual
product whether a given country has a revealed comparative advantage in that
product. This can be seen by an examination of the trade data. The index calculates
the share of a given product in a given country’s export bundle, and compares it to the
share of that product in another “country’s” export bundle. The comparator country is
typically is the rest of the world. Hence, if the share of exports for a given country is
greater than the share of exports for the product for the rest of the world, then the
index is greater than 1, and the country is said to have a revealed comparative
advantage in that product. There are two features about this index, which it is
important to highlight. The first is that the index can be calculated at different levels
of aggregation and direct use of the index sheds light on the degree of revealed
comparative advantage for individual products or sectors. The index does not, in and
of itself provide a summary measure of the degree of competitiveness of a given

29
economy. Secondly, trade flows are of course influenced by trade policy and trade
agreements. Hence, to the extent that tariffs, regional agreements distort trade, than
this will also be reflected in the index. For example, if a given country is artificially
supporting a given industry via export subsidies, than the data may well “reveal” that
the country has a comparative advantage in that product. However, in reality it may be
the case that without the subsidy the country would not be competitive in that given
product.
Table 4.4 provides some summary information arising from the detailed
calculation of revealed comparative advantage indices at the 2-digit SITC level of
aggregation. Here we have calculated the index for Caribbean country exports both
for 1985, and for 2002. In each case, also we have calculated the index for two
“comparator” countries – the world and the EU. For each of these comparator
countries we have then examined the degree of correlation in the index over time.
Here we are interested in seeing the extent to which there have been changes over
time. The OECS countries are shaded in grey.
Table 4.4: Revealed Comparative Advantage Correlation Cofficients
World EU
1985-2002 1985-2002
CARICOM 0.898 0.757
Barbados 0.682 0.800
Dominica 0.930 0.853
Grenada 0.777 0.896
Jamaica 0.919 0.971
St Kitts 0.075 0.078
St Lucia 0.886 0.930
T&T 0.776 0.472
St Vincent 0.997 0.997
Source: UN Comtrade, calculated at the 2-digit SITC level.Note: For St.Kitts and Nevis, and for St. Vincent the base year was 1995.
If we look at the Caricom in aggregate we see that with respect to the World
there is quite a high correlation over 1985-2002, whereas somewhat less with respect
to the EU. This indicates a greater degree of change with regard to the EU than with
regard to the world, and clearly, this can occur either because of changes taking place

30
within the Caribbean or because of changes taking place in the EU. Turning to
individual countries, we see that the highest degree of correlation with respect to both
the world and the EU is for St.Vincent and the Grenadines where the correlation
coefficient is close to 1. However, note that due to data constraints the base year here
is 1995, so we are looking at changes over a much shorter time period. There is also a
higher degree of correlation for Jamaica at over 90% in both cases, and this time over
the entire time period. Staying with the remaining MDCs we see that there have been
quite substantial changes for Trinidad and Tobago. The correlation coefficient with
regard to the world is 0.776, whereas with respect to the EU it is only 0.472. This
clearly indicates that overtime the degree of “competitivness” at the individual
product level between the EU and Trinidad and Tobabo has changed quite
significantly. Conversely, for Barbados, the coefficient is lower with respect to the
world (0.682), than it with respect to the EU (0.8).
For the OECS islands, the picture is also somewhat mixed. The biggest change
is clearly for St. Kitts, where the correlation coefficient with respect to both the world
and the EU is extremely low (0.078). A closer examination of the data reveals, not
surprisingly, that this is being very much driven by the changing pattern of trade in
sugar. It is worth also pointing out here, that for St. Kitts, as for St. Vincent the base
year is 1995, hence the change is taking place over a very short time span. St. Lucia
has a high correlation over the time period (principally driven by importance of
banana exports), in particular with regard to the EU. For Dominica, the degree of
correlation with the EU (0.853) is lower than with respect to the rest of the world
(0.93).
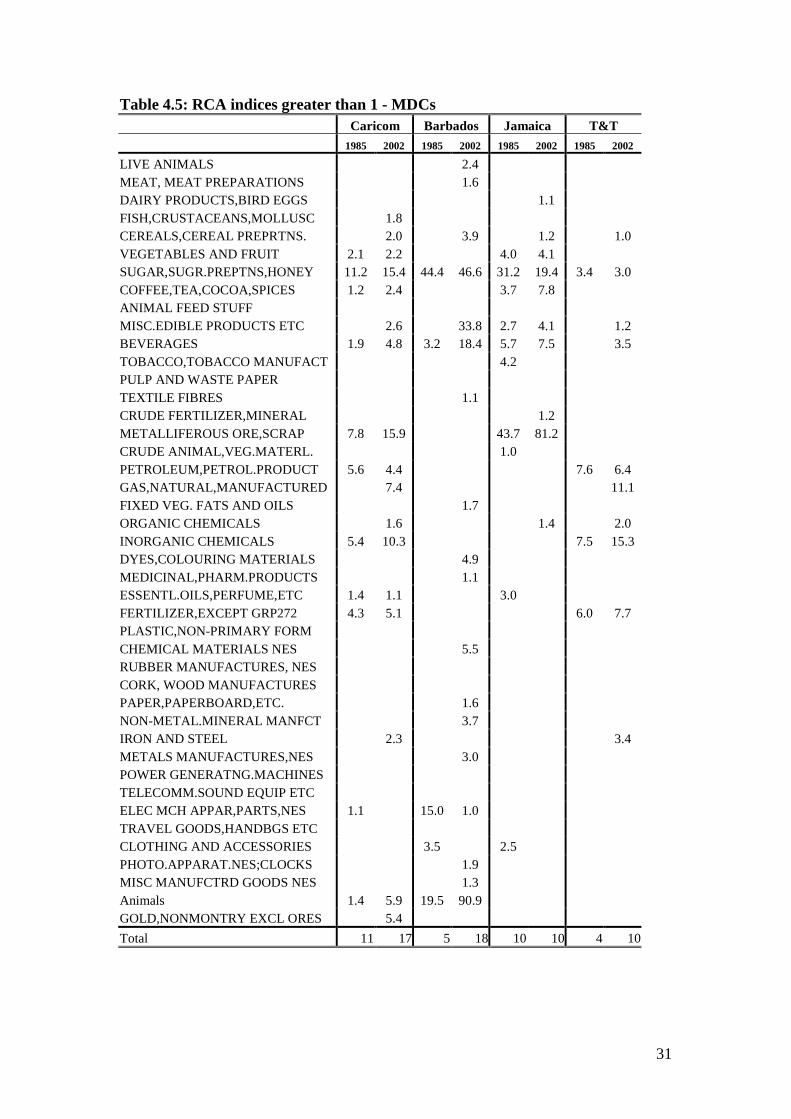
Tables 4.5 and 4.6, then provide more detailed information for each of the
islands. In Table 4.5 we focus on the Caricom average, and also for individual MDCs.
For each island, we give the index of revealed comparative advantage for those cases
where the index is greater than 1, and we do this for the base year, 1985 and for 2002.
The bottom row of the table gives the number of industries for which the index is
greater than 1 for each year. Both tables include the entire list of industries for which
any of the Caricom islands were seen to have a revealed comparative advantage in
either of the two years. The purpose of including all the industries is that it facilitates
comparison across the tables, and across the islands.
31
Table 4.5: RCA indices greater than 1 - MDCsCaricom Barbados Jamaica T&T
1985 2002 1985 2002 1985 2002 1985 2002
LIVE ANIMALS 2.4MEAT, MEAT PREPARATIONS 1.6DAIRY PRODUCTS,BIRD EGGS 1.1FISH,CRUSTACEANS,MOLLUSC 1.8CEREALS,CEREAL PREPRTNS. 2.0 3.9 1.2 1.0VEGETABLES AND FRUIT 2.1 2.2 4.0 4.1SUGAR,SUGR.PREPTNS,HONEY 11.2 15.4 44.4 46.6 31.2 19.4 3.4 3.0COFFEE,TEA,COCOA,SPICES 1.2 2.4 3.7 7.8ANIMAL FEED STUFFMISC.EDIBLE PRODUCTS ETC 2.6 33.8 2.7 4.1 1.2BEVERAGES 1.9 4.8 3.2 18.4 5.7 7.5 3.5TOBACCO,TOBACCO MANUFACT 4.2PULP AND WASTE PAPERTEXTILE FIBRES 1.1CRUDE FERTILIZER,MINERAL 1.2METALLIFEROUS ORE,SCRAP 7.8 15.9 43.7 81.2CRUDE ANIMAL,VEG.MATERL. 1.0PETROLEUM,PETROL.PRODUCT 5.6 4.4 7.6 6.4GAS,NATURAL,MANUFACTURED 7.4 11.1FIXED VEG. FATS AND OILS 1.7ORGANIC CHEMICALS 1.6 1.4 2.0INORGANIC CHEMICALS 5.4 10.3 7.5 15.3DYES,COLOURING MATERIALS 4.9MEDICINAL,PHARM.PRODUCTS 1.1ESSENTL.OILS,PERFUME,ETC 1.4 1.1 3.0FERTILIZER,EXCEPT GRP272 4.3 5.1 6.0 7.7PLASTIC,NON-PRIMARY FORMCHEMICAL MATERIALS NES 5.5RUBBER MANUFACTURES, NESCORK, WOOD MANUFACTURESPAPER,PAPERBOARD,ETC. 1.6NON-METAL.MINERAL MANFCT 3.7IRON AND STEEL 2.3 3.4METALS MANUFACTURES,NES 3.0POWER GENERATNG.MACHINESTELECOMM.SOUND EQUIP ETCELEC MCH APPAR,PARTS,NES 1.1 15.0 1.0TRAVEL GOODS,HANDBGS ETCCLOTHING AND ACCESSORIES 3.5 2.5PHOTO.APPARAT.NES;CLOCKS 1.9MISC MANUFCTRD GOODS NES 1.3Animals 1.4 5.9 19.5 90.9GOLD,NONMONTRY EXCL ORES 5.4
Total 11 17 5 18 10 10 4 10

32
There are a number of interesting features, which emerge from these tables.
First the tables identify those industries, which the data suggest the Caribbean has a
“revealed” comparative advantage. However, here it is important to stress the point
made earlier, that preferential trading arrangements distort trade flows, and to the
extent that they do so are likely to incorrectly identify true comparative advantage.
Secondly, we see, that the number of industries for which the index is greater than 1 is
relatively small. For the Caricom average, there are 17 industries in 2002, and for the
individual countries, the highest number of industries is 18, which is for Barbados.
Thirdly, for the three MDCs included in Table 4.5 there is comparatively wide spread
of industries. This indicates considerable diversity across the three islands.
The fourth feature emerges in considering each island separately. If we take
Barbados, we see that in 1985 there were only 5 industries/sectors with a revealed
comparative advantage, with a rise to 18 by 2002. Of the five 1985 industries, two of
them had seen a decline in the degree of revealed comparative advantage. These are
Electrical Machinery, and Clothing and Accessories. The remaining industries have
experienced an increase in the index, which in certain cases (Beverages, and animals)
is quite substantial. For Jamaica, the number of industries is the same in both years,
although the composition has slightly changed with a change from a revealed
comparative advantage, to a comparative disadvantage in Tobacco, Crude Animal and
Vegetable materials, Essential Oils, and Clothing and accessories. The industry
experiencing the biggest increase in the index is metalliferous ores. Finally, we see
quite a substantial change in the composition of the industries for Trinidad and
Tobago with a number of new industries emerging over the time period in question.
Table 4.6 gives the same information - this time for the OECS economies.
Here we see that the number of industries for which the index is greater than 1 is
typically smaller with the highest number being for St. Vincent & the Grenadines for
2002. For each country, there are less than 10 industries with a positive index of
revealed comparative advantage. This highlights the degree of export concentration
generally in the Caribbean, but particularly for the OECS economies. This issue of
export concentration is dealt with in more detail below. The table also shows a degree
of commonality across the OECS islands in the importance of fruit and vegetable,
processed foodstuffs, and beverages – though precise sectors differ across countries.

33
Table 4.6: RCA indices greater than 1 - OECSDominica Granada St.Kitts St. Lucia St Vincent
1985 2002 1985 2002 1995 2002 1985 2002 1995 2002
LIVE ANIMALS 1.3MEAT, MEAT PREPARATIONSDAIRY PRODUCTS,BIRD EGGSFISH,CRUSTACEANS,MOLLUSC 14.3 2.0 2.4CEREALS,CEREAL PREPRTNS. 12.6 1.3 21.4 24.7VEGETABLES AND FRUIT 41.1 28.5 31.7 46.0 41.0 34.8 44.1SUGAR,SUGR.PREPTNS,HONEY 119.4COFFEE,TEA,COCOA,SPICES 1.9 45.9 96.3 2.3 2.1ANIMAL FEED STUFF 1.1 9.0 7.4 8.7MISC.EDIBLE PRODUCTS ETC 2.5 11.3 14.4 3.1 4.0 2.4BEVERAGES 1.4 1.1 6.7 1.9 8.1 29.6 2.5 5.3TOBACCO,TOBACCO MANUFACT 1.2PULP AND WASTE PAPER 1.1TEXTILE FIBRESCRUDE FERTILIZER,MINERAL 16.1METALLIFEROUS ORE,SCRAPCRUDE ANIMAL,VEG.MATERL.PETROLEUM,PETROL.PRODUCTGAS,NATURAL,MANUFACTUREDFIXED VEG. FATS AND OILS 8.4 4.4ORGANIC CHEMICALSINORGANIC CHEMICALSDYES,COLOURING MATERIALS 3.2 5.0 1.8MEDICINAL,PHARM.PRODUCTSESSENTL.OILS,PERFUME,ETC 56.8 51.3 2.0 8.8FERTILIZER,EXCEPT GRP272PLASTIC,NON-PRIMARY FORMCHEMICAL MATERIALS NES 3.6RUBBER MANUFACTURES, NES 1.7CORK, WOOD MANUFACTURES 1.0PAPER,PAPERBOARD,ETC. 3.3 6.4 1.2NON-METAL.MINERAL MANFCT 5.0IRON AND STEEL 1.0METALS MANUFACTURES,NESPOWER GENERATNG.MACHINES 6.0TELECOMM.SOUND EQUIP ETC 1.1ELEC MCH APPAR,PARTS,NES 1.9 9.6TRAVEL GOODS,HANDBGS ETC 1.5 1.5CLOTHING AND ACCESSORIES 1.1 3.7 1.8 1.4PHOTO.APPARAT.NES;CLOCKS 1.2MISC MANUFCTRD GOODS NESAnimals 12.4 16.6GOLD,NONMONTRY EXCL ORES
Total 6 8 7 8 7 7 7 7 6 9

34
As earlier, the table is interesting in the degree of information it gives for
individual islands. For example, for Dominica we see a strong revealed comparative
advantage in Essential Oils, Perfumes etc, a strong but declining revealed comparative
advantage in vegetables and fruit, as well as a number of new products emerging –
Coffee, tea and spices, Crude Fertilisers, and Chemical Materials. For St. Lucia the
sector with the biggest revealed comparative advantage is that Vegetables and Fruit.
This is of course dominated by the banana industry, and we can see the decline in this
index as the changes in preferences start to impact upon trade and the extent of
specialisation.
Finally, it is important to emphasise again that for many Caribbean countries
their access to EU markets arises from the EU’s preferential trade regime, which may
not bear much resemblance to underlying comparative advantage. For example, if you
take the share of each product out of total exports being exported to the EU, and
correlate this with the share of each product being exported to the US, the correlation
coefficients for St. Lucia, St. Kitts and Dominica respectively are: -0.001, 0.008, and
0.038. Hence the pattern of exports to the EU is substantially different to that with
respect to the US. The differences in preferences granted is likely to be playing an
extremely important role here.
4.3.2 Decile Analysis
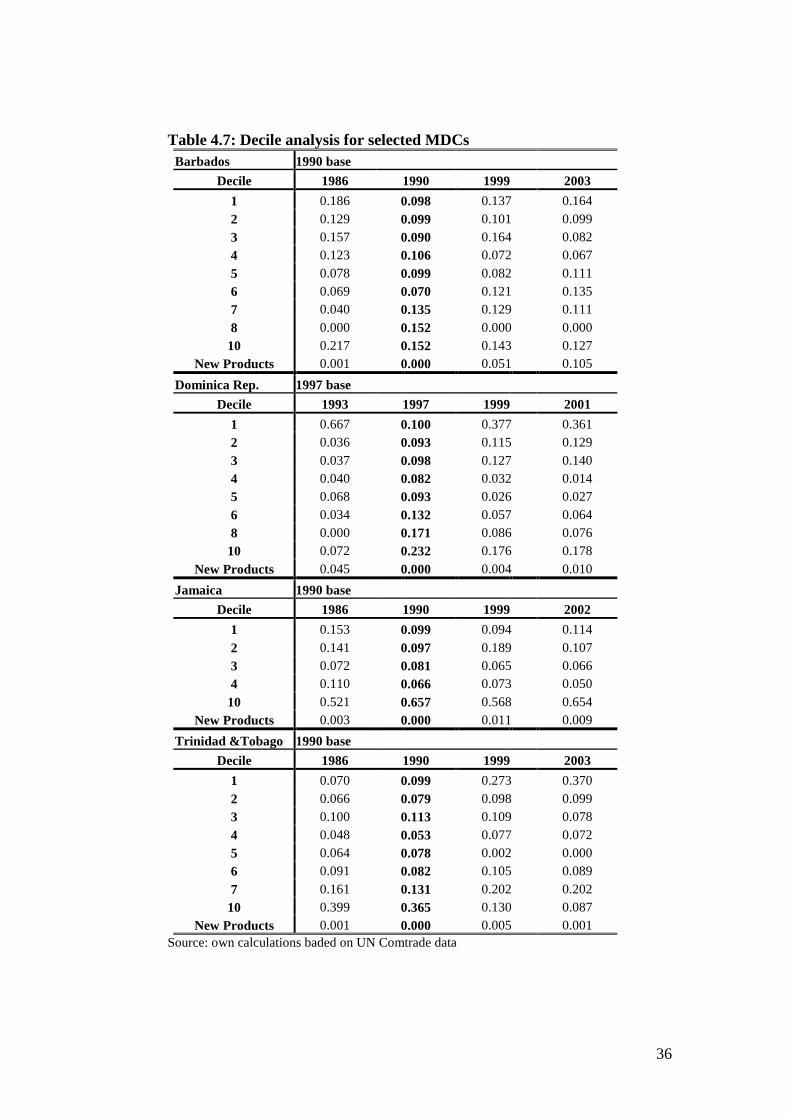
Tables 4.7 and 4.8 then provide further complementary information on the
changing structure of trade. Table 4.7 is for selected MDCs as well as for the
Dominican Republic, while Table 4.8 provides the same information for the OECS
economies. For these tables we have taken each countries’ trade at the 4-digit level of
aggregation for a given year, and calculated the share of each 4-digit category in total
trade. For a given base year we have then divided up the data into deciles. Hence,
each decile contains approximately 10% of the value of trade. However, because
certain product groups form a significant part of total trade certain decile groupings
get dropped. Take the first panel of Table 4.7 which considers Barbados. Here we see
that the base year is 1990 and the 10th “decile” accounts for 15.2% of trade. This is
entirely accounted for by SITC category 0611 (Sugars, beet etc). Similarly, “decile” 8

35
is accounted for by the exports of SITC category 3342 (Kerosene and other medium
oils).
For the years preceding and after the base year we then calculate the share of
trade accounted for by the same product groups that formed the base year deciles.
Hence if again look along the 10th decile row for Barbados, we see that where Sugars,
beet etc, accounted for just over 15% of trade in 1990 the corresponding share of trade
in 1986 was 21.7% and their share of trade in 2003 was 12.7%. Hence, here we see
clear evidence of structural changes in the Barbadian economy with a marked decline
in the share of the 10th decile industries. Looking along each row then gives an
indication of the degree of structural change across the different deciles. For example,
Take the first decile row for Barbados. The industries included here in the base are all
the small export industries, which together accounted for 9.8% of exports in 1990. By
2003 these industries had increased their share of trade to 16.8% of total exports. The
other big change is in decile 8 where the product or products, which formed just over
15% of trade in 1990, appear to be no longer exported in 2003.
It is also possible that in there are products, which are not exported at all in the
base year, but are exported in any of the other years. The extent to which this is the
case is captured in the last row of the panel for each country, entitled “new products”.
This is, for example particularly important for Barbados where we see that by 2003
10% of Barbadian exports are in products, which were not exported at all in the year
1990. This suggests a fair degree of change and possibly diversification over time. If
we compare this to the other countries in this table we see that for the Dominican
Republic over 1997-2001 there was just 1% of trade covered in new products, for
Jamaica over the 1990-2001 period less than 1% of trade, and similarly for Trinidad
and Tobago.
All the economies show some evidence of structural change over the period in
question. For example if we take the Dominican Republic and consider the 8th and
10th deciles together we see that in the base year (1997) the relevant industries
accounted for over 40% of total trade, yet a few years later, by 2001, they only
accounted for approximately 25% of trade. The big increase here appears to have
occured in the first decile. Similarly, if we look at Trinidad and Tobago, the industries
in the 10th decile accounted for over 36% of trade in 1990, and by 2001, the
corresponding figure is 8.7%.
36
Table 4.7: Decile analysis for selected MDCsBarbados 1990 base
Decile 1986 1990 1999 2003
1 0.186 0.098 0.137 0.164
2 0.129 0.099 0.101 0.0993 0.157 0.090 0.164 0.0824 0.123 0.106 0.072 0.067
5 0.078 0.099 0.082 0.1116 0.069 0.070 0.121 0.1357 0.040 0.135 0.129 0.111
8 0.000 0.152 0.000 0.00010 0.217 0.152 0.143 0.127
New Products 0.001 0.000 0.051 0.105
Dominica Rep. 1997 base
Decile 1993 1997 1999 2001
1 0.667 0.100 0.377 0.3612 0.036 0.093 0.115 0.129
3 0.037 0.098 0.127 0.1404 0.040 0.082 0.032 0.0145 0.068 0.093 0.026 0.027
6 0.034 0.132 0.057 0.0648 0.000 0.171 0.086 0.076
10 0.072 0.232 0.176 0.178
New Products 0.045 0.000 0.004 0.010
Jamaica 1990 base
Decile 1986 1990 1999 2002
1 0.153 0.099 0.094 0.114
2 0.141 0.097 0.189 0.1073 0.072 0.081 0.065 0.0664 0.110 0.066 0.073 0.050
10 0.521 0.657 0.568 0.654New Products 0.003 0.000 0.011 0.009
Trinidad &Tobago 1990 base
Decile 1986 1990 1999 2003
1 0.070 0.099 0.273 0.370
2 0.066 0.079 0.098 0.0993 0.100 0.113 0.109 0.078
4 0.048 0.053 0.077 0.0725 0.064 0.078 0.002 0.0006 0.091 0.082 0.105 0.089
7 0.161 0.131 0.202 0.20210 0.399 0.365 0.130 0.087
New Products 0.001 0.000 0.005 0.001Source: own calculations baded on UN Comtrade data
37
Once again, the biggest positive changes appear to have taken place in the first
decile where in 1990 the industries in this decile accounted for just under 10% of
trade, and this had increased to 37% of trade by 2001. Again therefore, this suggests
considerable structural change. Finally, if we look at Jamaica we see much more
stability in the trade shares across all the decile categories.
If we then turn to table 4.7 here, we focus on the same analysis but for selected
OECS countries. The first panel of the table considers Dominica, and the base year
here is 1999. Once again, we see evidence of considerable change taking place. There
is one industry in 1999, which accounted for 32% of exports, and that industry
accounted for just over 50% of exports in 1995. By 2003, the share of that industry in
exports had declined to 19%. As with the Dominican Republic, and Trinidad and
Tobago, the largest increases in shares appear to have occurred in the first and second
deciles who increased their shares from 9% to 13.7% and from 10.3% to 15.9%
respectively. There are very few new products being exported.
There is also interesting non-monotonic evidence of change for St.Lucia. We
see that 54.9% of trade is accounted for by the 10th decile (bananas) in the base year
1993. This increased to 62.6% in 1999 and then subsequently declined to 42.1% in
2003. Here it is largely the products in the 1st and 4th deciles who have seen their
share of exports rise. There is also some evidence of new products being exported as
these account for 5.5% of trade in 2003. St.Kitts is also interesting as we see reverse
movement in the 8th and 10th deciles. Hence the 8th decile industry accounted for
55.6% of trade in 1995, this declined to 24.1% in 1999, and 16% in 2003. Conversely,
the 10th decile industry accounted for 12.4% of trade in 1995, 45.3% in 1999 and
40.8% in 2003. Finally, for St.Vincent and the Grenadines we see much more stability
in the decile shares with comparatively little change over time.

38
Table 4.7: Decile analysis for selected OECS economies
Source: own calculations baded on UN Comtrade data
Dominica 1999 base
Decile 1995 1999 2003
1 0.089 0.090 0.137
2 0.044 0.103 0.1593 0.048 0.069 0.0714 0.016 0.135 0.158
7 0.280 0.282 0.28410 0.501 0.320 0.190
New Products 0.021 0.000 0.001
St Lucia 1993 base
Decile 1986 1993 1999 2003
1 0.077 0.098 0.091 0.158
2 0.123 0.098 0.085 0.109
3 0.056 0.080 0.009 0.0024 0.026 0.118 0.184 0.2545 0.002 0.057 0.000 0.000
10 0.708 0.549 0.626 0.421New Products 0.009 0.000 0.004 0.055
St Kitts 1999 base
Decile 1995 1999 2003
1 0.162 0.099 0.039
2 0.000 0.035 0.3724 0.033 0.172 0.003
6 0.556 0.241 0.16010 0.124 0.453 0.408
New Products 0.125 0.000 0.018
St Vincent 1998 base
Decile 1994 1998 2003
1 0.141 0.097 0.105
2 0.078 0.101 0.1483 0.027 0.044 0.023
4 0.137 0.156 0.1586 0.184 0.147 0.155
10 0.367 0.453 0.409
New Products 0.066 0.000 0.002

39
4.3.3 The degree of export diversification in the Caribbean
In looking at the indices of revealed comparative advantage, the data indicated
that the number of industries for which the region has a revealed comparative
advantage is typically comparatively small. This would tend to suggest the high
degree of concentration of economic activity in certain sectors. The decile analysis
then provided information on the evolving structure of trade, which also indicated that
in many cases there has been quite substantial change over time.
A key issue, which arises when considering the pattern of Caribbean trade, is
the high degree of export specialisation. Hence, Table 4.8 shows that for the Caricom
countries as a whole, for the year 2000, the top three export commodities comprise
over 50% of their exports. In aggregate, these figures are of course dominated by the
larger economies such as Trinidad and Tobago, and by the sectors important to the
larger economies, such as Fuel and fuel products.
Table 4.8: CARICOM Top 20 Export Commodities2000
Product Name4-digitSITCcode
Trade Value ($ '000) % share
Total Trade Total 4273447.1681 Fuel oils,n.e.s. 3344 1097420.928 25.72 Petrol.oils & crude oils obt.from b 3330 571364.736 13.43 Petroleum gases and other gaseous h 3413 554671.872 13.04 Oth.inorg.bases & metallic oxid.,hy 5225 359904.192 8.45 Motor spirit and other light oils 3341 343295.712 8.06 Acyclic alcohols & their halogenate 5121 267171.264 6.37 Kerosene and other medium oils 3342 198847.984 4.78 Wire rod of iron or steel 6731 154904.976 3.69 Iron or steel powders,shot or spong 6713 73274.136 1.710 Mineral or chemical fertilizers,nit 5621 60980.964 1.411 Non alcoholic beverages,n.e.s. 1110 42418.14 1.012 Sugars,beet and cane,raw,solid 0611 36112.496 0.813 Spirits;liqueurs, other spirituous 1124 24765.044 0.614 Art.of paper pulp,paper,paperboard, 6428 24403.176 0.615 Lubricating petrol.oils & other hea 3345 18728.48 0.416 Portland cement,ciment fondu,slag c 6612 16836.232 0.417 Edible products and preparations n. 0980 16770.323 0.418 Organic surface-active agents,n.e.s 5542 16664.218 0.419 Boxes,bags & oth.packing containers 6421 15887.418 0.420 Bakery products (e.g.,bread,biscuit 0484 15538.789 0.4

40
However the high degree of specialisation is true also of the smaller islands.
For example if you look at the average over the four year period 2000-2004 for three
of the OECS economies: over 90% of all exports by St.Lucia, and 63% of all
Dominican exports to the EU were in bananas, and 93% of St Kitts exports were in
raw sugars. Looking at the larger Caribbean economies over 2000-2003, 63% of
Barbados exports to the EU were raw sugars and a further 14% in distilled alcoholic
beverages (presumably rum); 66% of Jamaican exports are in “other organic bases
and metallic oxides”, and a further 19% in raw sugars; 44% of Granadan exports are
in spices, followed by 14% in each of “apparatus for electrical circuits”, “office
machines n.e.s.”, and “electrical insulating equipment”; Trinidad and Tobago are
more diversified with the biggest export category to the EU, “alcohols, phenols….”
comprising only 21% of exports.
We now turn to another summary statistical indicator, which captures some
the above – the Hirschmann-Herfindahl index. This index focuses more directly on
the degree of concentration of trade, and on the changes over time in the degree of
concentration. Herfindahl indices have traditionally been used in economics as a
measure of concentration in a particular industry. Formally, it is defined as the sum of
the squares of the market shares of each firm i in an industry, and is calculated as Σi
si2.9 The Herfindahl index ranges from zero, indicating that there exist a large number
of equally sized firms in the industry, to unity, indicating that there is only one firm in
the industry.
This measure of concentration can also be used to compare the level of
diversification of different countries’ trade regimes in two different dimensions. First,
the index can be calculated using data on origin of imports and destination of exports
to assess the changes in a country’s dependence on a particular market over time. For
example, one might expect that countries in a customs union, or in bilateral free trade
agreements to have less trading partners than countries that have multilaterally
liberalised their trading regime. This was the form of the index used in Table 4.2
earlier.
9 Sawyer, M., The Economics of Industries and Firms 2nd Edition (1985) pp. 29
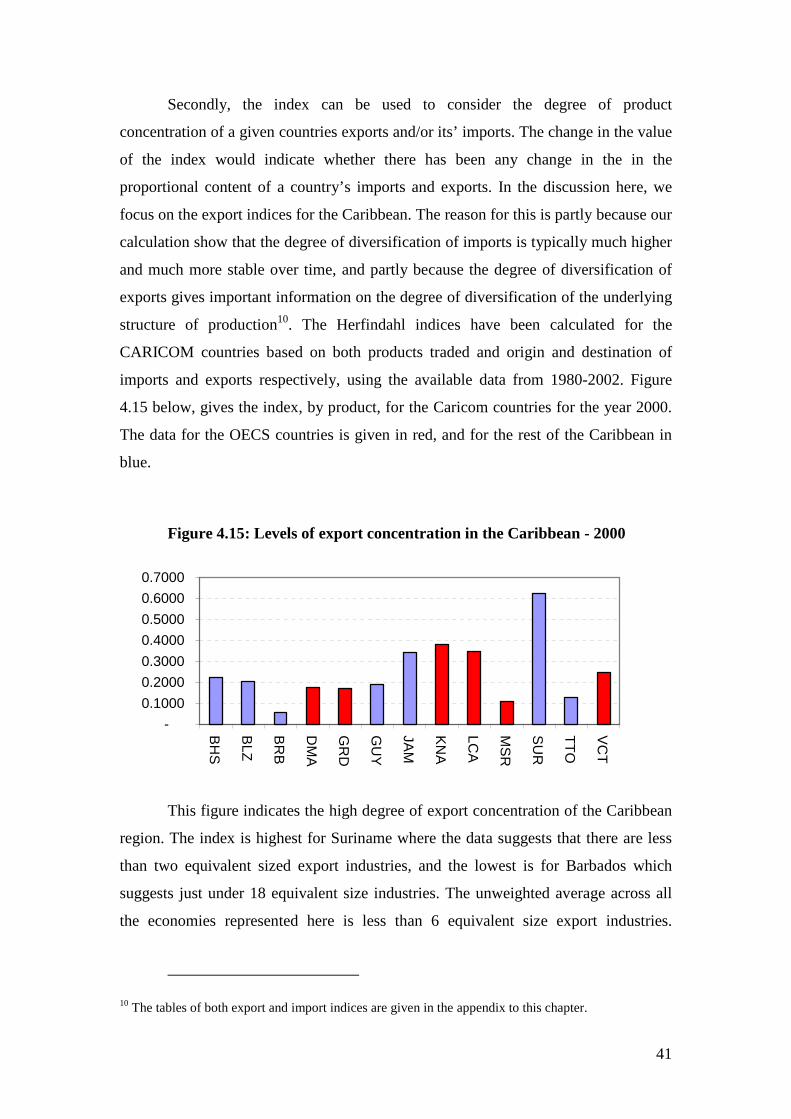
41
Secondly, the index can be used to consider the degree of product
concentration of a given countries exports and/or its’ imports. The change in the value
of the index would indicate whether there has been any change in the in the
proportional content of a country’s imports and exports. In the discussion here, we
focus on the export indices for the Caribbean. The reason for this is partly because our
calculation show that the degree of diversification of imports is typically much higher
and much more stable over time, and partly because the degree of diversification of
exports gives important information on the degree of diversification of the underlying
structure of production10. The Herfindahl indices have been calculated for the
CARICOM countries based on both products traded and origin and destination of
imports and exports respectively, using the available data from 1980-2002. Figure
4.15 below, gives the index, by product, for the Caricom countries for the year 2000.
The data for the OECS countries is given in red, and for the rest of the Caribbean in
blue.
Figure 4.15: Levels of export concentration in the Caribbean - 2000
-
0.1000
0.2000
0.3000
0.4000
0.5000
0.6000
0.7000B
HS
BLZ
BR
B
DM
A
GR
D
GU
Y
JAM
KN
A
LCA
MS
R
SU
R
TT
O
VC
T
This figure indicates the high degree of export concentration of the Caribbean
region. The index is highest for Suriname where the data suggests that there are less
than two equivalent sized export industries, and the lowest is for Barbados which
suggests just under 18 equivalent size industries. The unweighted average across all
the economies represented here is less than 6 equivalent size export industries.
10 The tables of both export and import indices are given in the appendix to this chapter.

42
Barbados, Trinidad and Jamaica Herfindahl Exported Products
-
0.0500
0.1000
0.1500
0.2000
0.2500
0.3000
0.3500
0.4000
0.4500
1980
1981
1982
1983
1984
1985
1986
1987
1988
1989
1990
1991
1992
1993
1994
1995
1996
1997
1998
1999
2000
2001
2002
Her
fin
dah
lIn
dex
BRB
JAM
TTO
Overall then, this figure therefore serves to confirm that there is comparatively little
export diversification in the Caribbean, and that most of the islands are highly
dependent on a few export commodities. Interestingly, there is little evidence here that
the degree of export concentration is more pronounced for the OECS islands in
comparison to the other economies. St Kitts and Nevis and St. Lucia have a high
degree of concentration, with less than three equivalent size export industries, while
Dominica and Granada, have a level of export diversification approximately the same
as the Caribbean average and Montserrat and St Vincent and the Grenadines being
more diversified.
The subsequent figures indicate the changes in the Herfindahl export index
over time. Figure 4.16 indicates that of the more developed CARICOM countries,
Jamaica, Trinidad and Tobago, and Barbados have been able to export a larger variety
of products by the end of the period under review than at the beginning. However, a
closer inspection of the data does indicate that within recent years there has been little
improvement in the diversification of these country’s export bundles and in the cases
of Jamaica and Trinidad, there has been a trend towards increasing concentration of
exports since 1993 and 1998 respectively.
Figure 4.16: Herfindahl indices for Barbados, Trinidad and Jamaica

43
For Barbados, after a noticeable increase in the diversification of goods
exported by Barbados between 1985 and 1987, there has been little change since then.
The change in the Barbados export concentration can be explained primarily by a
decrease in Barbados’ main export product than by the increased diversification of
exports. This can be seen from the graph below. The period corresponding the the rise
and fall of the Herfindahl index for Barbados exports i.e. from 1982-1987 also
matches the rise and fall of Barbados exports of thermionic valves and tubes which
between 1982 and 1987 was Barbados main export revenue earner.
Figure 4.17 Main Exports for Barbados
The less developed CARICOM countries are represented by 4 OECS countries
for which data was available for most of the period studied. These calculations
indicate that only Dominica was able to achieve a notable diversification in its export
bundle at the end of the period compared to the beginning of the period. St. Kitts &
Nevis and Grenada showed little change in concentration whereas the calculations for
St. Lucia indicate increasing dependence on fewer exported products. For all four
OECS states over the 22 year time period, the Herfindahl index of export products
shows more variation than for the larger CARICOM countries.
Figure 4.18 OECS Herfindahl indices
B a r b a d o s M a i n E x p o r t s
0
2 0 0 0 0
4 0 0 0 0
6 0 0 0 0
8 0 0 0 0
1 0 0 0 0 0
1 2 0 0 0 0
1 4 0 0 0 0
1 6 0 0 0 0
1 9 8 0 1 9 8 1 1 9 8 2 1 9 8 3 1 9 8 4 1 9 8 5 1 9 8 6 1 9 8 7 1 9 8 8 1 9 8 9 1 9 9 0 1 9 9 1 1 9 9 2 1 9 9 3 1 9 9 4 1 9 9 5 1 9 9 6 1 9 9 7 1 9 9 8 1 9 9 9 2 0 0 0 2 0 0 1 2 0 0 2
US
$M
illio
ns
C e m e n t D i s t i l l e d a l c o h o l i c b e v e r a g e s R a w s u g a r , b e e t & c a n e D i s t i l l e d a l c o h o l i c b e v e r a g e s T h e r m i o n i c v a l v e s a n d t u b e s , t r a n s i

44
O E C S H e r f i n d a h l P r o d u c t E x p o r t s
-
0 . 0 5 0 0
0 . 1 0 0 0
0 . 1 5 0 0
0 . 2 0 0 0
0 . 2 5 0 0
0 . 3 0 0 0
0 . 3 5 0 0
0 . 4 0 0 0
0 . 4 5 0 0
0 . 5 0 0 0
0 . 5 5 0 0
0 . 6 0 0 0
1980
1981
1982
1983
1984
1985
1986
1987
1988
1989
1990
1991
1992
1993
1994
1995
1996
1997
1998
1999
2000
2001
2002
D M A
G R D
K N A
L C A
The charts below focus in a little more detail on the OECS islands in order to
provide a fuller picture for the changes over time. Figure 4.19, provides the
underlying information for Dominica. Dominica has been a traditional exporter of
bananas, but since 1993 when revenue from banana exports peaked, exports of
perfume products have increased. Since 1997 there has also been an increase in the
export of soaps and soap products, while revenue from banana exports continues to
decline. Over the period then the share of banana products has fallen from about 75%
of exports in 1987 to about 25% of exports in 2001.
Figure 4.19 Dominica: Main export categories
D o m in ic a M a in E x p o r ts
0
5 0 0 0
1 0 0 0 0
1 5 0 0 0
2 0 0 0 0
2 5 0 0 0
3 0 0 0 0
3 5 0 0 0
4 0 0 0 0
4 5 0 0 0
1 9 8 0 1 9 8 1 1 9 8 3 1 9 8 5 1 9 8 6 1 9 8 7 1 9 8 8 1 9 8 9 1 9 9 3 1 9 9 4 1 9 9 5 1 9 9 6 1 9 9 7 1 9 9 9 2 0 0 0 2 0 0 1
US
Do
llars
Mill
ion
s
B a n a n a s - in c lu d in g p la n ta in s - , f re s h P e r fu m e r y & c o s m e t ic s ,d e n t i f r ic e s e S o a p s
This diversification of exports can be contrasted with case of St. Lucia, which
actually increased the proportion of bananas exported relative to total exports.
Revenue from banana exports accounted for just over 20% of exports in 1980, and

45
reached a maximum proportion of about 75% in 1986, but was still about 50% in
2002. St. Kitts is a special case because while the Herfindahl indices indicate that
there is little change in the concentration of exports from 1980 to 2002; St. Kitts has
actually managed to replace its tradition dominant export, raw sugar cane, with
apparatus for electrical circuits as the graph below shows.
Figure 4.20 St Kitts and Nevis: principal exports
S t . K it t s & N e v is M a in E x p o r ts
0
5 0 0 0
1 0 0 0 0
1 5 0 0 0
2 0 0 0 0
2 5 0 0 0
1 9 8 1 1 9 8 2 1 9 8 3 1 9 8 6 1 9 8 7 1 9 8 8 1 9 9 3 1 9 9 4 1 9 9 5 1 9 9 6 1 9 9 7 1 9 9 9 2 0 0 0 2 0 0 1
US
$M
illio
ns
A p p a ra tu s fo r e le c t r ic a l c ir c u i ts E le c t r ic p o w e r m a c h in e ry F o o tw e a r
C lo th in g a n d a c c e s s o r ie s ,k n i t te d o r C lo th in g o f te x t fa b r ic , n o t k n it te R a w s u g a r ,b e e t & c a n e
Sugar exports from St. Kitts have declined since the early 1980s at which time
export revenue from electrical power machinery was on the rise. Although sugar
exports recovered in the mid-1990s, exports of apparatus for electrical circuits also
started to increase sharply by the late 1990s and they have outstripped sugar as the
main export earner.
What is interesting from the preceding is that the export concentration is by no
means in the same sectors across countries. Hence if one compares the top three
export industries by country, there is little pattern to the industries, which emerge as
being significant. This is also consistent with the discussion on the revealed
comparative advantage indicators earlier.
4.4: Assessing the impact of integration
In this section of the report, we turn to analysing the extent to which it is likely
that a future EPA will induce the Caribbean economies to switch their imports to
more efficient suppliers and away from less efficient suppliers or viva versa. Here, the
aim of the analysis is to look again at descriptive statistical indicators to see what the

46
evidence suggests in this regard. In Part 6 of this report we explore this more formally
with the use of detailed partial equilibrium simulations.
Switching to more efficient sources of supply in principle leads to welfare
gains. In the literature, this is typically referred to as trade creation or trade
reorientation. Switching away from more efficient sources of supply towards less
efficient sources is referred to as trade diversion, and typically leads to welfare losses.
These terms are important in understanding the likely impact of the process of
regional integration and hence are discussed in more detail below.
� Trade creation: this is where the change in tariffs results in an increase in net
trade for one of two reasons. On the consumpton or demand side, this can occur
because the lower prices induce consumers to purchase more of the good at the
lower price. On the supply side, trade creation occurs when the source of supply
shifts from less efficient domestic producers, to more efficient importers who can
now supply the market at a lower price because of the tariff reductions. Each of
these effects can be seen as welfare increasing.
� Trade diversion: occurs when sources of supply shift away from a more efficient
external supplier to the less efficient new partner country. For example, suppose
that currently the US and the EU face the same tariffs for a given product in the
Caribbean market, but that the Caribbean currently imports the good from the US,
as their tariff inclusive price is lower. Of course if their tariff inclusive price is
lower this suggests that they can supply the good more cheaply hence more
efficiently than the EU. Now suppose the Caribbean signs an EPA with the EU in
which tariffs on the EU export of the good are eliminated. It is now possible that
the EU can supply the good more cheaply than the US which still has to pay the
tariff. Hence, the source of supply will have switched away from the US (the more
efficient supplier) to the EU (the less efficient) supplier. This is welfare reducing.
� Trade reorientation: This is analogous to trade diversion but essentially in
reverse. Suppose the Caribbean countries regionally integrate, as indeed they have
done. That process of regional integration is likely to generate some trade
diversion. In other words that imports from (less efficient) partner Caribbean
countries will have risen and substituted away from (more efficient) EU suppliers.
Now, suppose that the Caribbean signs an EPA with the EU. That process of trade

47
diversion is likely to be reversed with trade being reoriented back to the more
efficient supplier (the EU), and away from the less efficient supplier (the
Caribbean). To the extent that this occurs this is likely to be welfare increasing.
In order to assess the likelihood of each of the above the analysis in this section is
divided into three parts. First, we look at the structure of tariffs, as the level of tariffs
is extremely important in assessing the likely impact of their subsequent removal.
Secondly, we consider in great detail trade flows by source in order to build up a
picture of the likelihood of trade creation, trade diversion and trade reorientation.
Finally, we use Finger-Kreinin indices of trade similarity which also serve to shed
light on this.
4.4.1 Tariffs
The CARICOM economies grant at least MFN treatment to all their trading
partners including the EU and the US. The organization has signed preferential trade
agreements with Colombia, Venezuela, Cuba and Dominican Republic, and is a
participant in the Free Trade of the Americas negotiations. The CARICOM
economies have made some progress in liberalising their trade regime in the 90’s with
the simple average tariff falling from 17.6% in 1991 to 12.25% in 2002 and by further
0.9 of a percent in the following year. Table 4.9 below gives more detailed
information on tariffs by Caribbean economy, and in each a comparison is made over
two years.
A number of features emerge from the table. First, it can be seen that almost
all the economies have on average liberalised their tariff regime over the two
comparator years. The only exception here is The Bahamas but it should be noted that
the comparison (due to data availability) here is over a short time span, 1999-2002.
Secondly, it is clear that the most protected sectors domestically are Food, Beverages
and Tobacco, as well as consumer goods, and that these are also the sectors that have
witnessed the most modest decreases in average tariffs. Thirdly, the least the protected
sectors are typically Fuels and Lubricants, as well as Capital goods with the latter
being the sectors which have seen the largest reductions in tariffs. Overall then levels
of tariffs – and hence domestic distortions – are quite high for Food, Beverages and
Tobacco products, as well as for Consumer goods, as well as to some extent for

48
Transport equipment. However clearly also there has been a move in recent years to
attempt to liberalise the MFN trade regime.
Table 4.9: Caribbean Tariff structureFBT Industrial
Suppliesnes
Fuels &Lubricants
CapitalGoods
TransportEquipment
Consumergoods
Goods nes
Antigua and Barbuda 1996 27.0 17.8 4.7 15.3 25.1 23.3 36.32003 19.9 7.5 4.2 6.4 13.8 18.1 20.5
Bahamas, The 1999 22.8 31.8 32.8 35.4 37.9 27.6 54.22002 22.0 31.4 32.7 34.2 36.9 27.4 45.8
Barbados 1996 25.3 16.2 5.1 12.1 19.8 23.2 31.72003 41.7 7.7 6.0 6.4 12.6 20.3 28.2
Belize 1996 26.4 16.7 5.0 12.4 20.2 23.3 47.52003 23.2 7.6 3.6 6.1 12.1 18.8 28.2
Dominica 1996 23.7 16.9 2.2 14.7 19.3 23.3 35.02003 26.9 8.6 3.8 5.1 12.2 18.1 21.3
Dominican Republic 1997 23.2 12.4 8.3 9.6 11.2 23.8 22.52004 17.3 5.9 4.1 3.8 9.3 17.8 17.6
Grenada 1996 25.9 17.3 7.8 14.3 21.1 23.1 27.52003 21.8 7.9 5.0 6.3 13.6 17.9 27.5
Guyana 1996 28.2 18.0 4.6 13.6 22.4 24.1 37.92003 25.2 7.2 4.5 6.2 11.8 18.8 23.3
Jamaica 1996 27.0 16.5 6.0 12.2 17.9 22.9 22.52003 21.4 2.9 2.7 1.8 9.0 17.6 13.1
St. Kitts and Nevis 1996 24.5 17.6 4.3 14.8 29.7 23.0 34.02003 17.3 7.9 4.4 6.3 15.7 21.2 27.0
St. Lucia 1996 23.7 17.4 2.2 14.2 24.8 23.1 47.52003 19.6 6.4 2.0 2.3 18.8 19.8 48.8
St. Vinc. & the Grenadines 1996 23.1 17.9 5.7 13.4 18.7 23.0 30.02003 20.1 7.7 4.8 6.1 11.2 18.1 18.3
Suriname 1996 26.3 16.9 3.7 12.3 16.4 23.0 18.82000 25.2 12.2 7.3 6.2 13.5 16.0 25.0
Trinidad and Tobago 1991 31.4 13.2 8.6 10.8 14.5 33.2 52.51996 21.4 6.1 3.9 4.4 10.9 21.1 16.12003 21.7 3.9 2.3 2.9 11.2 17.8 14.7
There is some evidence then that the structure of CARICOM’s Common
External Tariff (CET) differs between competing and non – competing imports, as
well as between input, intermediate and final goods, forming a hierarchy in which
non-competing goods bear the lowest tariff, while competing final goods bear the
highest tariff11. In 2002, the agricultural and beverages and tobacco sectors remained
most protected with average tariffs of 19.55% and 37.7% respectively. Crude
11 See also, CARICOM Secretariat, 2001 for a discussion of this.

49
materials and mineral fuels had an average tariff of just above 5%, while the tariffs on
manufactured goods and machinery were around 9%. The highest manufacturing
tariffs were imposed on miscellaneous manufacturing goods under SITC rev. 2
classification, such as textiles and apparel or footwear which averaged around 20%.
Clearly then where tariffs are high there is more scope for trade creation, trade
diversion or trade reorientation – any of these outcomes are possible. The extent of
each will be largely determined by the existing patterns of trade, and to this, we now
turn.
4.4.2 A detailed analysis of trade by source
Trade creation is more likely where the partner countries already trade
substantially with each other, and hence in this context where the Caribbean
economies already import a high proportion of their imports from the EU. Consider
the hypothetical case where all Caribbean imports currently derive from the US where
the US faces the same tariffs as the EU. Clearly then the US is the more efficient
supplier, and any switch to EU imports following an EPA would thus be trade
diverting. Hence, the first descriptive statistic to consider the extent to which the
Caribbean economies trade (import) substantially with (from) the EU. Evidence on
this was already presented earlier when we consider the evolution of trade by source
over time.
Hence, if we take the Caricom countries as a group of their total imports only
14% came from the EU. In contrast, the US supplied more than 39% of imports, and
the combined total for Venezuela, Japan, Brazil, Canada and Mexico was just under
19%. There are of course variations across countries but even Trinidad and Tobago,
which has one of the lowest share of imports coming from the US, has a 1992 share of
33%, and the share of the EU is 16.6%. The highest EU share in 1992 is for Suriname
at 26.2%, and the lowest is for the Bahamas at 2.1%. The trade pattern of Dominican
Republic, the only non-CARICOM EPA negotiating country, broadly follows that of
CARICOM states with only one exception - Venezuela is the second biggest importer
after the US, closely followed by the EU.
50
These statistics are very telling and certainly suggest that there would appear
to be considerable potential for trade diversion, ultimately the extent to which this is
the case depends on how the marginal import price is determined. Welfare losses are
more likely via trade diversion, revenue loss or terms of trade effects where the non-
EU suppliers comprise the sole or principal supplier. Welfare losses are also more
likely when the marginal import price is determined by an elastic ROW supply
schedule but the EU has a larger share12. We do not have direct information on this,
however, we can explore in considerably more detail the share of imports by
individual tariff lines and establish the extent to which these imports are supplied by a
sole country supplier or not. This information is provided in Table 4.10, and builds
upon the analysis in Gasiorek and Winters (2004).
From the preceding discussion, it is clear that on the import side the welfare
effects of any proposed EPA will depend in good measure on who is supplying given
goods to the market. For our six Caribbean economies and for the year 2002, we have
calculated the share of imports for each HS 6-digit product from each of four sources
– CARICOM, EU15, USA and the Rest of the World. In the table, we report the
number of product categories for which each of the suppliers has a share of 20%-80%,
80%-90% and over 90%. We also give the percentage of imports falling in each
category and, in column (1), the total number of 6-digit headings in which imports are
recorded. We interpret 20%-80% shares as indicating a shared market and over 90%
as being effectively a sole supply. Hence, the first row of table 5 shows that for
Trinidad and Tobago, the US supplies between 20% and 80% of the market for 1256
products, which account for 10.8% of total imports. For 775 products, the US is
virtually the sole supplier with over 90% of all imports, and flows of these goods
account for 6.41% of Trinidad and Tobago’s total imports.
There are several important messages, which emerge from this table. First, it is
only for Antigua and Barbuda that the EU is a significant “sole” supplier, where for
27.21% of total imports the EU supplies more than 90% of the market. In fact, this
figure is dominated by two import categories – motor-boats and sail-boats – which
between them comprise 53% of all EU exports to Antigua and Barbuda. For the
remaining economies the number of headings for which the EU is the “sole” supplier
12 See Gasiorek and Winters, 2004 for a more detailed discussion of this issue.

51
ranges from 8 (covering 0.03% of the total trade) for the Bahamas to 196 (0.83%) for
Trinidad and Tobago; the largest share of trade with the EU as sole supplier is 4.8%
for St. Kitts and Nevis. These numbers suggest that there is little scope for pure trade
creation.
Table 4.10: Share of CARICOM imports by supplier – 2002
Country % Detail CARICOM EEC15 USA ROW
Trinidad & Tobago 20% - 80% no of products 61 733 1256 1028% of total trade 0.570 9.192 10.803 8.276
80%-90% no of products 13 58 272 171% of total trade 0.216 0.827 3.045 2.234
> 90% no of products 37 196 775 801% of total trade 0.110 0.830 6.410 52.320
Bahamas 20% - 80% no of products 11 82 198 93% of total trade 0.606 0.800 14.859 12.031
80%-90% no of products 1 5 160 3% of total trade 0.000 0.003 5.440 0.004
> 90% no of products 2 8 3743 12% of total trade 0.000 0.030 62.150 0.650
Jamaica 20% - 80% no of products 128 498 1469 1048% of total trade 9.220 5.516 24.998 14.327
80%-90% no of products 5 34 376 109% of total trade 0.079 0.438 6.276 5.544
> 90% no of products 15 106 1445 218% of total trade 0.300 2.480 10.120 11.930
St. Kitts and Nevis 20% - 80% no of products 227 308 814 394% of total trade 7.378 4.388 21.787 7.714
80%-90% no of products 18 26 283 40% of total trade 0.221 0.880 8.480 5.875
> 90% no of products 78 96 1368 97% of total trade 8.600 4.800 18.450 2.250
St. Lucia 20% - 80% no of products 282 530 1090 495% of total trade 13.805 11.900 27.519 10.124
80%-90% no of products 28 55 215 37% of total trade 2.500 1.075 4.281 0.657
> 90% no of products 84 167 987 155% of total trade 4.290 1.300 8.910 4.450
Antigua & Barbuda 20% - 80% no of products 204 279 297 188% of total trade 2.009 10.131 5.309 27.033
80%-90% no of products 34 48 79 25% of total trade 1.270 0.805 3.097 0.689
> 90% no of products 469 352 403 266% of total trade 6.210 27.210 6.050 3.560

52
The three small OECS economies report a significant proportion of total trade
for which the CARICOM countries supply more than 90% of the imports: St. Kitts &
Nevis, 8.6%; St. Lucia 4.29% and Antigua & Barbuda 6.21%. Thus, there may be a
little more scope for trade reorientation. For the remaining CARICOM economies,
however, the regional share is very low. It may be that in the OECS, we are observing
the transhipment from a CARICOM location of small consignments from elsewhere,
but it might be that in the absence of direct transport links to the EU and USA,
CARICOM output looks competitive in these economies.
Perhaps more importantly, if we look at imports from either the USA or ROW
we see much higher numbers of products where these are dominant suppliers. For the
US, the figures for the share of total trade so covered range from 6.05% for Antigua
and Barbuda to 62.15% for the Bahamas (and in this case there are no particular
industries which dominate). Given the high proportion of headings, and the high share
of trade covered by those headings this would suggest considerable scope for trade
diversion arising from an EPA.
Table 4.11 cross-classifies some of the information in table 4.10. Classifying
headings by reporting country share between 40%-80%, we ask what are the typical
shares of other suppliers. Thus if we take the first row, the products for which the EU
share lies between 40%-80% account for 12.41% of total imports by Trinidad and
Tobago. Of this, the EU accounts for 7.29%, CARICOM 0.03%, the US 3.55% and
the ROW 1.54%. That is, where the EU has a “material share” of Trinidad and
Tobago’s markets, it is almost exclusively sharing with tariff-paying suppliers. The
same applies to the other countries. Thus for these industries, trade diversion is more
likely than trade creation, and, because of the small Caribbean share, there is little
prospect for trade reorientation. Conversely, where the USA has a material share, the
EU typically supplies a quarter or less of the US amount. In a differentiated good
model based on the “Armington” assumption, in which substitution possibilities are
proportional to market shares this would be taken as evidence that trade diversion was
unlikely to be serious, but in our homogeneous goods model such a comforting
conclusion would not be warranted. In fact, the data suggest that liberalising trade
with the USA may be better than an EPA because the relative importance of local
Caribbean supplies in the USA’s “material-share” products opens up the prospect of
trade reorientation.

53
Table 4.11: Shares of trade for those industries where the reporting countryshare is between 40-80%Country Reporting country CARICOM EEC15 US ROW Total
Trinidad & Tobago EU 0.03 7.29 3.55 1.54 12.41US 0.23 1.65 6.57 2.37 10.81CARICOM 0.30 0.03 0.07 0.09 0.49
Bahamas EU 0.00 0.18 0.18 0.01 0.37US 0.63 1.23 9.10 2.42 13.38CARICOM 0.34 0.04 0.22 0.01 0.61
Jamaica EU 0.02 1.97 1.05 0.49 3.53US 6.36 3.97 20.31 6.38 37.02CARICOM 0.23 0.23 1.16 0.49 2.11
St Kitts EU 0.07 1.90 1.36 0.20 3.53US 3.46 3.61 18.62 4.29 29.98CARICOM 5.49 0.33 2.07 1.35 9.24
St Lucia EU 0.40 5.33 2.05 1.35 9.13US 2.51 5.45 19.80 5.30 33.06CARICOM 11.98 1.05 5.24 0.79 19.06
Antigua & Barbuda EU 0.38 2.97 0.80 0.83 4.98US 0.72 0.96 3.96 0.60 6.24CARICOM 1.56 0.33 0.49 0.30 2.68
4.4.3 Finger Kreinin Indices of trade similarity
Finally, another means of exploring this issue via the use of descriptive trade
statistics is the use of Finger-Kreinin indices of export (import) similarity. The FK
index provides a single measure, which summarises the extent to which countries
export or import structures are similar. The index ranges from 0-1, and where the
index is equal to 1 this means that the export (import) structures of the pair of
economies being considered is identical, and where it is equal to zero the export
(import) structure has no overlap whatsoever. The mathematical formula is as
follows:-
FK= Σi min ([Xia/ Σ Xia], [Xib/ Σ Xib])
Where Xia/ Σ Xia is the share of product i in country’s a total exports, Xib/ Σ
Xib is the share of product i in country’s b total exports.
Suppose the FK export index is equal to 0 and suppose that export structure
can be taken as a reasonable proxy for a given country’s production structure. An
index equal to zero suggests no overlap in the countries production and export
bundles which in turn suggest no possibility for trade creation on the production side.

54
There remains some possibility for trade creation on the consumption side. Equally,
suppose the FK export index is equal to 1. This would mean that there is a very high
degree of overlap in the two countries export and production bundles which in turn
suggest a higher possibility for trade creation on both the production and consumption
side. However, with regard to each of these extreme cases the possibilities for trade
creation will depend on from whom the importing country is initially importing. If,
initially the Caribbean is importing heavily from the EU, and the EU-Caribbean FK
index is high this suggest considerable scope for trade creation. If however, the
Caribbean is initially importing heavily from the US, and the EU-Caribbean FK index
is high this suggests that there is likely to be considerable trade diversion. Where the
FK index is low, then the only possibility for trade creation is on the consumption
side, and again this will only occur where EU exports to the Caribbean are high.
Table 4.12 gives the FK export index for all our bilateral pairings for the year
2000, calculated at the 4-digit rev2 SITC level. Consider first the bottom right hand
corner of the table where we see the FK index between the EU and the US. The index
is 0.691 which suggests a high degree of overlap between the US and the EU,
therefore considerable scope for gains from trade between this pair of countries. Note
also that high index of similarity also suggests that these countries exports are likely
to be substitutes and again suggests the possibility for trade diversion. The fifth
column, along the bottom two rows of the table, then give the FK index between
Caricom and the EU and the US respectively. We see that the index is now 0.286 with
respect to the EU, and 0.266 with respect to the US. This is considerably lower and
suggests less scope for trade creation on the production side.
However, this average figure masks considerable diversity among the
Caribbean economies. If we consider the individual FK indices by country, we see
that for the majority of the Caribbean economies there is extremely little overlap in
export (and therefore probably production) bundles. For many of the economies the
index is considerably below 0.1. If we couple this with the statistics earlier on imports
by source we can see that there is very little evidence to suggest that for many of these
economies there is much scope for trade creation either on the production or
consumption side. This is not always the case. Trinidad and Tobago for example have
a higher share of imports coming from the EU, and have an FK export index with the
EU of 0.334. Similarly Barbados has one of the higher shares of imports accounted

55
for by the EU (17.4%), and has an FK index of 0.225. For these two economies, there
is perhaps a greater likelihood of trade creation than for the other economies, but the
figures nevertheless suggest that the extent of this is likely to be low.
As well as looking at the FK index at a given moment in time, it is instructive
to consider its’ evolution over time (not reported here). Looking at these, the analysis
shows that the exports of the OECS countries are more similar with each other than
with the other CARICOM members. For the period 1980-2002, the FK index for
Dominica and St. Lucia has been consistently higher than that between Dominica and
Barbados or St. Lucia and Barbados.
Looking at imports we find that, imports by the CARICOM islands have a
much higher degree of similarity for all the island pairs than exports. Secondly,
generally the OECS states share similar imports with each other than with the other
CARICOM countries even though, St. Lucia’s import bundle was as similar in content
to Barbados’s by the end of the period as it was with Dominica and Grenada, and the
trend has been toward increasing similarity. Thirdly, while exports from OECS states
are more similar with each other than with the other CARICOM states, there has been
a trend towards increasing dissimilarity. Dominica’s exports have become
increasingly dissimilar to that of St. Lucia and St. Vincent, but more similar to
Barbados, Jamaica and Trinidad and Tobago. Indicating that some OECS countries
have been successful in reducing their dependence on traditional export products but
others have not. Fourthly, the results for the MDCs indicate that Jamaican imports are
more similar in content to Barbados than any other island, and have become more
similar with the smaller OECS islands than with Trinidad. Jamaican exports are more
similar in content with the other MDCs than with the LDCs. Although the trend has
been increasing similarity with Trinidad for most of the period, and decreasing
similarity with Barbados since about 1988.
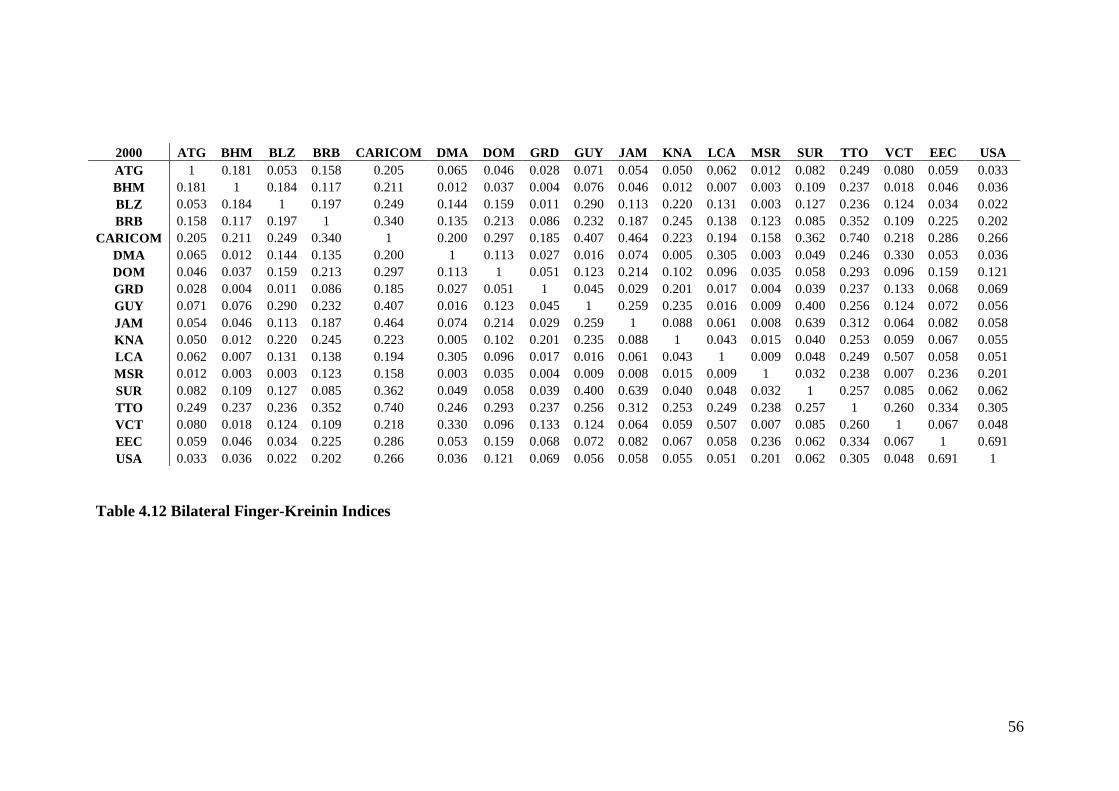
56
Table 4.12 Bilateral Finger-Kreinin Indices
2000 ATG BHM BLZ BRB CARICOM DMA DOM GRD GUY JAM KNA LCA MSR SUR TTO VCT EEC USAATG 1 0.181 0.053 0.158 0.205 0.065 0.046 0.028 0.071 0.054 0.050 0.062 0.012 0.082 0.249 0.080 0.059 0.033BHM 0.181 1 0.184 0.117 0.211 0.012 0.037 0.004 0.076 0.046 0.012 0.007 0.003 0.109 0.237 0.018 0.046 0.036BLZ 0.053 0.184 1 0.197 0.249 0.144 0.159 0.011 0.290 0.113 0.220 0.131 0.003 0.127 0.236 0.124 0.034 0.022BRB 0.158 0.117 0.197 1 0.340 0.135 0.213 0.086 0.232 0.187 0.245 0.138 0.123 0.085 0.352 0.109 0.225 0.202
CARICOM 0.205 0.211 0.249 0.340 1 0.200 0.297 0.185 0.407 0.464 0.223 0.194 0.158 0.362 0.740 0.218 0.286 0.266DMA 0.065 0.012 0.144 0.135 0.200 1 0.113 0.027 0.016 0.074 0.005 0.305 0.003 0.049 0.246 0.330 0.053 0.036DOM 0.046 0.037 0.159 0.213 0.297 0.113 1 0.051 0.123 0.214 0.102 0.096 0.035 0.058 0.293 0.096 0.159 0.121GRD 0.028 0.004 0.011 0.086 0.185 0.027 0.051 1 0.045 0.029 0.201 0.017 0.004 0.039 0.237 0.133 0.068 0.069GUY 0.071 0.076 0.290 0.232 0.407 0.016 0.123 0.045 1 0.259 0.235 0.016 0.009 0.400 0.256 0.124 0.072 0.056JAM 0.054 0.046 0.113 0.187 0.464 0.074 0.214 0.029 0.259 1 0.088 0.061 0.008 0.639 0.312 0.064 0.082 0.058KNA 0.050 0.012 0.220 0.245 0.223 0.005 0.102 0.201 0.235 0.088 1 0.043 0.015 0.040 0.253 0.059 0.067 0.055LCA 0.062 0.007 0.131 0.138 0.194 0.305 0.096 0.017 0.016 0.061 0.043 1 0.009 0.048 0.249 0.507 0.058 0.051MSR 0.012 0.003 0.003 0.123 0.158 0.003 0.035 0.004 0.009 0.008 0.015 0.009 1 0.032 0.238 0.007 0.236 0.201SUR 0.082 0.109 0.127 0.085 0.362 0.049 0.058 0.039 0.400 0.639 0.040 0.048 0.032 1 0.257 0.085 0.062 0.062TTO 0.249 0.237 0.236 0.352 0.740 0.246 0.293 0.237 0.256 0.312 0.253 0.249 0.238 0.257 1 0.260 0.334 0.305VCT 0.080 0.018 0.124 0.109 0.218 0.330 0.096 0.133 0.124 0.064 0.059 0.507 0.007 0.085 0.260 1 0.067 0.048EEC 0.059 0.046 0.034 0.225 0.286 0.053 0.159 0.068 0.072 0.082 0.067 0.058 0.236 0.062 0.334 0.067 1 0.691USA 0.033 0.036 0.022 0.202 0.266 0.036 0.121 0.069 0.056 0.058 0.055 0.051 0.201 0.062 0.305 0.048 0.691 1

57
Overall then, the results thus show that imports by countries in the region are
more similar than exports and the LDCs, in particular, the OECS countries show a
trend towards increasing similarity of imports with the MDCs in the region. While
Dominica, St. Lucia and St. Vincent share strong similarities in the content of their
imports and exports, the trade content of all the OECS states are not similar. In
particular, exports from St. Kitts show a stronger similarity with that from Barbados
and Jamaica than with the other OECS states.
In summary then in this section of the report we have looked at the structure of
the Caribbean economies’ trade in order to assess the likelihood of trade diversion,
trade creation, and trade reorientation arising from the signing of an EPA. The
conclusions, which emerge from this analysis, are that the removal of tariffs
bilaterally with the EU is likely for many of the economies to results in considerable
trade diversion, and is less likely to results in significant trade creation. This issue is
taken up more formally in Part 6 of this report when we use a partial equilibrium
modelling structure in order to simulate the possible changes in trade flows.
4.5 Summary and Conclusions
In this part of the report we have examined a number of features of Caribbean
trade. The purpose of this analysis was three-fold. First to establish which are the key
trading partners for the countries of the region, and to see the extent to which there is
any change over time with respe to these partners. Here the analysis indicated that
there is considerable diversity across the Caribbean islands with regard to their trade
patterns. Nevertheless, what is clear is that in terms of exports to the Caribbean the
EU is typically not the most important supplier. The most important supplier by far is
the US, and in many intra-regional supplies are also important though this is largely
accounted for the importance of the exports of petroleum and other products by
Trinidad and Tobago. This has important implications for the opening up of
Caribbean markets on a preferential basis to EU suppliers as it strongly suggests the
possibility of trade diversion. When looking at destination markets the analysis
indicated that for a number of islands the EU was relatively more important. In
looking at the pattern of changes over time we saw again that the pattern was mixed
across the countries of the region, with the country experiencing the biggest increases

58
in exports and imports being Trinidad and Tobago. The experience of the OECS
economies is typically varied both by partner and reporting country.
Secondly, this part of the report focussed on the structure of trade. Here the
analysis indicated that for most of the countries in the region exports are heavily
concentrated in a small number of sectors, and closely related to this that there is only
a small number of sectors for which the countries appear to have a revealed
comparative advantage. Concentration on a few sectors is perhaps not very surprising
given the relatively small size of many of the Caribbean economies. Of relevance here
however, is that for several of the economies, and in particular the OECS islands the
dominance of particular export sectors has been driven by the preferential access
given to the countries, for example by the EU. The erosion of those preferences with
changes taking place in GSP regimes, changes in particular protocols such as for
sugar and bananas, and the progressive liberalisation of trade barriers are likely to
have significant implications for a number of islands. This can already be seen in the
changes taking place with regard to exports and production in islands such as St.
Lucia, Dominica, St. Kitts & Nevis, and St Vincent and the Grenadines. Where export
production is highly concentrated and is subject to a changing and significantly more
challenging external environment than this will result in structural change with a
concomittant economic and social impact for these islands. As has therefore been
widely recognised there is a need to carefully manage that change in terms of flanking
policies, in terms of development assistance and aid, and in terms of the timing and
transition periods allowed for in trade policy.
Much of the above is particularly relevant when considering the impact of the
changes in trade policy currently taking place, for the Caribbean and OECS
economies’ export markets and hence production structures. The final section of this
part of the report focussed on relevant descriptive statistics which shed light on the
implications for the Caribbean economies of the preferential liberalisation of their
import markets. The conclusions emerging from this analysis is that there is clearly
considerable scope for trade diversion arising from preferential trade liberalisation
with the EU. This is as a result of the height of the Caribbean tariffs, the relative
importance of non-EU suppliers to the Caribbean market, and from the lack of overlap
in export structures between the Caribbean countries and the EU, as well as across the
Caribbean countries.

59
The overall picture that emerges therefore is that there is considerable
diversity across the Caribbean region. Despite that diversity, changes in external trade
relations are likely to impact significantly on the region in terms of exports and
production and particularly for those economies heavily dependent on the existing
preference structure. Preferential liberalisation with the EU, as is likely under an EPA,
is unlikely to lead to significant welfare gains because of the consequences of trade
diversion. What does this suggest in terms of policy options for the region? What is
clear is that in many cases existing export and production structures are based on
historical preferences granted and are unlikely to reflect true comparative advantage.
There are therefore long run welfare gains, and reductions in poverty to be attained
via a process of trade liberalisation, structural adjustment and integration into the
world economy. The more widespread and multilateral is the process of trade
liberalisation the more likely it is that the economies production structures will move
towards those areas and sectors where they have a comparative advantage. This could
of course be either in manufacturing or in services. Given the size and location of
many of the economies, it is also more likely that there will be gains in efficiency and
flexibility arising from the furthering of the process of Caribbean regional integration.

60
Bibliography:
CARICOM Secretariat ‘Caribbean Trade and Investment Report 2000.’
CARICOM Secretariat (2004) ‘Caribbean Economic Performance Report 2003’
Caribbean Export Development Agency (2002). “Inventory of Non-Tariff, TradeRestricting Measures Applied by Member States of the CaribbeanCommunity” Final Report submitted the CARICOM Secretariat
Chaitoo, R (2003), “The Compatibility of trade policies in Caricom states in thecontext of current regional economic integration processes”, Report preparedfor the ACP secretariat.
De Rosa, D.(2002) “Trade Policies and Prospects of the Eastern Caribbean States inthe New Global Economy” Revised Draft, ADR International Ltd., Virginia,U.S.A.
Inter-American Development Bank. (2005) “Caricom Report No. 2”, Integration andRegional Programs Department, Institute for the Integration of Latin Americaand the Caribbean.
Egoume-Bossogo, P. and C. Mendis (2002) ‘Trade and Integration in the Caribbean’International Monetary Fund (IMF) Working Paper 02/148.
ECLAC (2005), “Effects and implications of the Common Market and SingleEconomy on the Member States of the Organisation of the Eastern CaribbeanStates (OECS) and the utilization of Chapter 7 of the Treaty of Chaguaramas”,Comissioned by the OECS secretariat.
European Commission (2005), “Action Plan on accompanying measures for SugarProtocol countries affected by the reform of the EU sugar regime”,Commission of the European Communities.
Gasiorek, M &Winters L.A (2004), “What Role for the EPAs in the Caribbean, WorldEconomy, September.
Gonzales, A,P, (2000), “Policy implications of smallness as a factor in the Lome,FTAA, and WTO negotiations”
Hall, K and Blake, B (2001). ‘CARICOM Administration’ in The CaribbeanCommunity-Beyond Survival ed. by Kenneth Hall.
International Monetary Fund (2004) ‘Eastern Caribbean Currency Union: SelectedIssues’ Country Report No. 04/335.
Jessen, A; E. Rodríguez (1999), “The Caribbean Community: Facing the Challengesof Regional and Global Integration” INTAL Occasional Paper 2
Nilsson, L. (2002) ‘trading relations: is the road from Lome to Cotonou correct?’Applied Economics, 2002, 34,
Nogueira, U. (1997), “The Integration Movement in the Caribbean at Crossroads:Towards a New Approach of Integration” INTAL Working Paper 1

61
OECS Secretariat (1998), Strategic Considerations of the OECS In Relation to theLOMÉ and FTAA Negotiations, A study prepared for the CRNM (draft)
Pantin, D and Hosein R, (2004), “Repas or Rip-off? A critical review of the CotonouAgreement from the perspective of the African, Caribbean and Pacific (ACP)member countries”, final report on CPDC commissioned study.
Peters, A. (2002), “The Fiscal Effects of Tariff Reduction in the CaribbeanCommunity” Economic Intelligence and Policy Unit, CARICOM Secretariat
Stevens, C and Kennan, J (2005), “EU-ACP Economic Partnership Agreements: Theeffects of reciprocity”, IDS Briefing Paper.
United Nations ECLAC. (2005) “Effects and implications of the Common Market andSingle Economy on the Member States of the Organisation of the EasternCaribbean States (OECS) and the utilization of Chapter 7 of the Treaty ofChaguaramas”. Report Commissioned by the OECS Secretariat.
Winters, L.A & Martins, P.M.G. (2004), “When comparative advantage is notenough: business costs in small remote economies”, World Trade Review 3:3
World Bank, (2005), “A time to choose: Caribbean development in the 21st Century”,Caribbean Country Management Unit, Poverty Reduction and EconomicManagement Unit, Latin America and the Caribbean Region. Report no.31725-LAC.
World Bank, (2005), “OECS: Towards a new agenda for growth”, Caribbean CountryManagement Unit, Poverty Reduction and Economic Management Unit, LatinAmerica and the Caribbean Region. Report no. 31863-LAC.