MADE MONEY ONLINE BITCOIN & ETHERIUM - MINIMUM INVESTMENT ONLY 10$ - 065664

Join the conversation on Twitter @ARKinvest www.ark-invest.com
Bitcoin As An Investment
Part 2
Published: September 17, 2020
Author: Yassine Elmandjra, Analyst at ARK InvestAuthored in collaboration with Coin Metrics

Part 2 | Bitcoin As An InvestmentYassine Elmandjra, in collaboration with Coin Metrics
2
CONTENTS
I. Bitcoin’s Price History 3
II. Bitcoin’s Opportunity 5 A. Bitcoin As A Global Settlement Network 7 B. Bitcoin As Protection Against The Seizure Of Assets 8 C. Bitcoin As Digital Gold 8 D. Bitcoin As A Catalyst For Currency Demonetization In Emerging Markets 9 III. Bitcoin As A Strategic Allocation 10
IV. Bitcoin’s Maturity As An Institutional Asset 13 A. Bitcoin’s Trading Volume 13 B. Bitcoin’s Liquidity Profile 19
V. Asset Allocation To Bitcoin 20
VI. Risks 24 A. Custody 24 B. Regulation 25 C. Over-Institutionalization 25
VII. Conclusion 26

Part 2 | Bitcoin As An InvestmentYassine Elmandjra, in collaboration with Coin Metrics
3
Abstract
In Part 1 of this research, we described how we believe Bitcoin, a novel economic institution, satisfies the four assurances that maximize the probability of a robust and predictable financial system. In Part 2, we explore bitcoin as an emerging asset. While many investors question its merit, in our view bitcoin is the most compelling monetary asset since gold.
I. Bitcoin’s Price History
Bitcoin’s origin is tied to an unexpected email that pseudonym Satoshi Nakamoto sent to an obscure cryptography mailing list in late 2008.
Nakomoto’s email included a link to the Bitcoin whitepaper,1 which solved one of the biggest computer science problems that had stumped scientists for years. On January 3, 2009, Bitcoin was up and running.
In the absence of a market and a price, bitcoin attracted a limited group of cryptography enthusiasts during its first few years. Early adopters mined bitcoin cost effectively with nothing more than personal computers.
Toward the end of 2009, New Liberty Standard published the first bitcoin exchange rate: 1,309.03 BTC to 1 USD.2 With an established exchange rate, individuals could purchase bitcoin. In March 2010, a bitcointalk.org user put 10,000 BTC up for auction with a $50 minimum, 3 and got no bids.A few months later, Laszlo Hanyecz, a programmer in Florida , purchased two pizzas for 10,000 BTC, or $25 at the time. A decade later, 10,000 BTC would be worth $100 million.
1 Nakamoto, Satoshi. Bitcoin: A Peer-to-Peer Electronic Cash System. Bitcoin, bitcoin.org/bitcoin.pdf.2 Fiorillo, Steve. “Bitcoin History: Timeline, Origins and Founder.” TheStreet, 17 Aug. 2018, www.thestreet.com/investing/bitcoin/bitcoin-
history-14686578.3 Bitcoin Auction: 10,000.00 BTC --- Starting Bid 50.00 USD, bitcointalk.org/index.php?topic=92.0.
Bitcoin P2P e-cash paper
I`ve been working on a new electronic cash system that`s fullypeer-to peer, with no trusted trird party.
The paper is available at: http://www.bitcoin.org/bitcoin.pdf
Satoshi Nakamoto | Sat, 01 Nov 2008 16:16:33 -0700
An excerpt from Satoshi Nakomoto’s email introducing Bitcoin

Part 2 | Bitcoin As An InvestmentYassine Elmandjra, in collaboration with Coin Metrics
4
Bitcoin exchanges accelerated the distribution of bitcoin. The now infamous exchange, Mt. Gox, opened for trading in July 20104 and three years later accounted for 70% of global bitcoin transactions.5
In April 2013, the bitcoin price crossed $100 for the first time and then scaled 10-fold during the next six months, before collapsing. In February 2014, shortly after breaking through $1,000, bitcoin succumbed to Mt. Gox’s security lapses. Mt. Gox suspended withdrawals after “losing” ~850,000 bitcoin, more than 6% of the bitcoin in circulation at that time.6 Bitcoin then entered a severe bear market and dropped below $200 in January 2015, not to surpass $1,000 again until February 2017.
From Mt.Gox’s ashes emerged a new generation of market infrastructure. Bitfinex and Huobi, two of the largest crypto exchanges today, launched with better governance, processes, and procedures, and Coinbase launched a U.S. based exchange, the first to attract institutional investors.
Meanwhile in 2015, ether - the second largest cryptocurrency by network capitalization - ushered in a new class of cryptoassets, making it simple for anyone to introduce a token using ERC-20, 7
a technical standard specific to the Ethereum protocol.
4 Fiorillo, Steve. “Bitcoin History: Timeline, Origins and Founder.” TheStreet, 17 Aug. 2018, www.thestreet.com/investing/bitcoin/bitcoin-history-14686578.
5 “Mt. Gox.” Wikipedia, Wikimedia Foundation, 20 June 2020, en.wikipedia.org/wiki/Mt._Gox.6 Frankenfield, Jake. “Mt. Gox.” Investopedia, Investopedia, 28 Aug. 2020, www.investopedia.com/terms/m/mt-gox.asp.7 Reiff, Nathan. “What Is ERC-20 and What Does It Mean for Ethereum?” Investopedia, Investopedia, 6 Sept. 2020, www.investopedia.com/
news/what-erc20-and-what-does-it-mean-ethereum/.
Figure 1: Bitcoin USD Price History
$0,01
$0,10
$1
$10
$100
$1, 000
$10, 000
$100, 000
2010 2011 2012 2013 2014 2015 2016 2017 2018 2019 2020
Bitc
oin
USD
Pric
e (L
og)
Source: ARK Investment Management LLC, Coin Metrics

Part 2 | Bitcoin As An InvestmentYassine Elmandjra, in collaboration with Coin Metrics
5
By 2017, numerous cryptoassets had entered the market through initial coin offerings (ICOs), loosely equivalent to Initial Public Offerings (IPOs), circumventing traditional fundraising.By the end of 2017, ICOs had raised more than $4.6 billion, attracting not only speculators but also talent and capital.
As the ICO madness hit peak fever in December 2017 and January 2018, bitcoin’s price hit nearly $20,000 and was on the threshold of a massive selloff and an incredible period of volatility.By year-end 2018, it had dropped 80% and then, within six months, recovered to 70% of its all-time high before a Chinese-led Ponzi scheme PlusToken8 triggered another massive sell-off in 2018, driving the price down to $3,000. During the coronavirus crisis in March, it collapsed again, dropping briefly below $4,000. Within three months, it had returned to pre-crisis levels, buoyed by a rapid recovery in other asset classes globally. As of this writing, bitcoin is hovering just above $10,000.
Often informed by incorrect assumptions, mainstream media has cast doubt on Bitcoin’s viability9 during the last 10 years while institutional investors have begun to research it as the birth of a new asset class. Since December 2010, the media has declared bitcoin “dead” more than 380 times,10 while institutions have zeroed in on its unique monetary properties,11 particularly its store of value potential as digital gold, as well as the foundation it is laying for transparent finance and the hedge it offers against the existing monetary world order.
II. Bitcoin’s Opportunity
With little more than a 10-year price history, bitcoin has been the best performing asset of the 21st century. Five years ago, a $10,000 investment in bitcoin would have delivered a 119% compound annual rate of return and would be worth roughly $500,000 today. In fact, during any yearly holding period since inception through September 1, 2020, bitcoin’s return has been positive, significantly so in most cases, as shown in Figure 2.
8 Canellis, David. “Bitcoin’s Failing Price Could Be Caused by $2B Chinese Ponzi Scheme Dumping Its Crypto.” Hard Fork | The Next Web, 17 Dec. 2019, thenextweb.com/hardfork/2019/12/17/bitcoin-cryptocurrency-price-dump-ponzi-scheme-plustoken/.
9 Carter, Nic. “Media Coverage of Bitcoin Is Still a Total Disaster.” Medium, Medium, 26 Feb. 2019, medium.com/s/story/media-coverage-of-bitcoin-is-still-a-total-disaster-7d0d34d98971.
10 “Bitcoin Obituaries - Bitcoin Declared Dead 350 Times (2020 Updated).” 99 Bitcoins, 99bitcoins.com/bitcoin-obituaries/.11 Schatzker, Erik. “Paul Tudor Jones Buys Bitcoin With Reminder of Gold in 1970s.” Bloomberg.com, Bloomberg, 7 May 2020, www.bloomberg.
com/news/articles/2020-05-07/paul-tudor-jones-buys-bitcoin-says-he-s-reminded-of-gold-in-70s.

Part 2 | Bitcoin As An InvestmentYassine Elmandjra, in collaboration with Coin Metrics
6
Figure 2: Bitcoin Compound Annual Returns
90%
70%
119%113%
35%29%
22%
0%
20%
40%
60%
80%
100%
120%
140%
Last 7 Years Last 6 Years Last 5 Years Last 4 Years Last 3 Years Last 2 Years Last Year
Source: ARK Investment Management LLC, 2020For informational purposes only and should not be considered investment advice,
or a recommendation to buy, sell or hold any particular security.
Despite its run, our analysis suggests bitcoin is early on its path to monetization, with substantial appreciation potential. In our view, Bitcoin’s $200 billion market capitalization - or network value - will scale more than an order of magnitude to the trillions during the next decade.
In the next section, we will discuss bitcoin’s largest market opportunities. Consistent with these opportunities, we estimate Bitcoin could reach a $3 trillion market cap by 2025.
Figure 3: Sizing Bitcoin’s Opportunity
14x
Mar
ket C
apita
lizat
ion
(bill
ions
USD
)
$0
$500
$1,000
$1,500
$2,000
$2,500
$3,000
$3,500
$0
$20,000
$40,000
$60,000
$80,000
$100,000
$120,000
$140,000
$160,000Pr
ice
per b
itcoi
n
Bitcoin Market Capitalization as of 9/1/2020 2025 Bitcoin Market Capitalization (ARK Estimate)
$ 3 trillion
$ 220 billion
Note: TAM (Total Addressable Market) Source: ARK Investment Management LLC, 2020
For informational purposes only and should not be considered investment advice, or a recommendation to buy, sell or hold any particular security. Forecasts are inherently limited and cannot be relied upon.

Part 2 | Bitcoin As An InvestmentYassine Elmandjra, in collaboration with Coin Metrics
7
A. Bitcoin As A Global Settlement NetworkWe believe Bitcoin could become a settlement system for banks and businesses. Unlike traditional settlement systems, the Bitcoin network is global, it cannot censor transactions, and its money cannot be inflated by institutions like central banks. Instead of facilitating a large volume of low-value transactions at point of sale, Bitcoin could evolve to handle large transactions between and among financial intermediaries. Today, most dollar-based international payments must settle through the Federal Reserve’s Real Time Gross Settlement (RTGS), or Fedwire.
Supporting both senders and receivers, the Bitcoin network obviates the need for counterparties to mediate and settle transactions and is capable of settling high value transactions irrevocably every few hours. It can facilitate 2,000 global settling transactions roughly every ten minutes from anywhere at any time. As noted in Economics of Bitcoin as a Settlement Network,12 the Bitcoin network could settle one transaction daily with every other bank in a global network of 850 banks. In the United States alone, deposits totaling $14.7 trillion generate $1.3 quadrillion in settlement volumes between and among banks each year. If it were to capture 10% of those settlement volumes at a similar deposit velocity, we believe the Bitcoin network would scale more than 7-fold from roughly $200 billion to $1.5 trillion in value, as shown below.
Source: ARK Investment Management LLC, Swift Institute13 For informational purposes only and should not be considered investment advice,
or a recommendation to buy, sell or hold any particular security. Forecasts are inherently limited and cannot be relied upon.
12 “Economics of Bitcoin as a Settlement Network.” Economics of Bitcoin as a Settlement Network | Satoshi Nakamoto Institute, nakamotoinstitute.org/mempool/economics-of-bitcoin-as-a-settlement-network/.
13 A Billion Here, A Billion There: The Statistics Of Payments. www.swiftinstitute.org/wp-content/uploads/2012/10/The-Statistics-of-Payments_v15.pdf.
Figure 4: Hypothetical Value Of Bitcoin As A Settlement Network According To ARK’s Analysis
$0
$200
$400
$600
$800
$1,000
$1,200
$1,400
$1,600
Mar
ket C
apita
lizat
ion
(bill
ions
USD
)
$0
$10,000
$20,000
$30,000
$40,000
$50,000
$60,000
$70,000
$80,000
Pric
e pe
r bitc
oin
Bitcoin as of 9/1/2020 1% of Settlements 5% of Settlements 10% of Settlements

Part 2 | Bitcoin As An InvestmentYassine Elmandjra, in collaboration with Coin Metrics
8
B. Bitcoin As Protection Against The Seizure Of AssetsAs we explained in Part 1 to this paper, Bitcoin enables personal sovereignty, a useful - if not crucial - characteristic in jurisdictions where property rights are not recognized or enforced.With good public and private key management, we believe bitcoin cannot be seized.
In our view, a sensible allocation to bitcoin would approximate the probability that a corrupt or misguided regime will confiscate assets - whether by fiat money inflation or by outright seizure - during an individual’s lifetime. If that probability were 5% on average globally, bitcoin’s market capitalization, or network value, could vault more than 10-fold from $200 billion to $2.5 trillion, as shown below.
Figure 5: Hypothetical Value Of Bitcoin As Protection Against Asset Seizure According To ARK’s Analysis
Mar
ket C
apita
lizat
ion
(bill
ions
USD
)
$0
$1,000
$2,000
$3,000
$4,000
$5,000
$6,000
$0
$50,000
$100,000
$150,000
$200,000
$250,000
Pric
e pe
r bitc
oin
Bitcoin as of 9/1/2020 1% Probability 5% Probability 10% Probability
Source: ARK Investment Management LLC, 2020For informational purposes only and should not be considered investment advice,
or a recommendation to buy, sell or hold any particular security.Forecasts are inherently limited and cannot be relied upon.
C. Bitcoin As Digital Gold As part of the transition toward a digital economy, bitcoin could challenge gold as a global store of value. Economic history suggests that an asset accrues value as the demand for it increases relative to the supply. Demand is a function of an asset’s ability to serve the three roles of money: store of value, medium of exchange, and unit of account.
For thousands of years, the world has recognized gold as the most sustainable form of money. Through a process of natural selection, goods competed with each other for dominance until gold evolved as the global monetary standard. While gold has maintained its status as a store of

Part 2 | Bitcoin As An InvestmentYassine Elmandjra, in collaboration with Coin Metrics
9
value, its limitations to serve as a medium of exchange and unit of account began to surface in the 20th century.14
Supporters often refer to bitcoin as digital gold because it improves upon many of physical gold’s characteristics. Not only is bitcoin scarce and durable, but it also is divisible, verifiable, portable, and transferable, all of which protect from the threat of centralization. According to our research, if it were to take 10% share of the physical gold market, bitcoin’s network value could increase nearly $1 trillion, as shown below, 5 times its $200 billion base today.
D. Bitcoin As A Catalyst For Currency Demonetization In Emerging MarketsDuring a spike in inflation, not to mention hyperinflation, the loss of confidence in monetary authorities typically encourages investors and savers to adopt hedges to cash and bonds like physical gold and, now, bitcoin. Not subject to capital controls, bitcoin could become an important savings vehicle in emerging markets, to such an extent that businesses might demand payment in bitcoin instead of fiat. As a result, the velocity of fiat currencies would accelerate, further exacerbating inflation. Taken to the extreme of hyperinflation, fiat-denominated debt would become worthless and dollar-denominated bonds unpayable. Drained of deposits and unable to custody bitcoin, the banking systems would collapse.
14 Because of its bulk and high value per unit weight, gold was vulnerable to the human intervention associated with centralization. Its lack of portability and inefficient measurement tools allowed governments to centralize reserves, undermining its function as a medium of exchange and unit of account.
Figure 6: Hypothetical Value Of Bitcoin As Digital Gold According To ARK’s Analysis
Mar
ket C
apita
liztio
n (b
illio
ns U
SD)
Pric
e pe
r bitc
oin
$0
$100
$200
$300
$400
$500
$600
$700
$800
$900
$1,000
Bitcoin as of 9/1/2020 1% Gold 5% Gold 10% Gold$0
$5,000
$10,000
$15,000
$20,000
$25,000
$30,000
$35,000
$40,000
$45,000
Source: ARK Investment Management LLC, 2020For informational purposes only and should not be considered investment advice,
or a recommendation to buy, sell or hold any particular security.Forecasts are inherently limited and cannot be relied upon.

Part 2 | Bitcoin As An InvestmentYassine Elmandjra, in collaboration with Coin Metrics
10
While Bitcoin has not evolved enough to service an entire economy, we believe demand for bitcoin in emerging markets should increase as its infrastructure reaches critical mass. If bitcoin were to capture 5% of the global monetary base outside of the four largest fiat currencies - US dollar, yen, yuan, euro - its market cap could increase by $1 trillion, as shown below, a 6-fold increase from $200 billion today to roughly $1.2 trillion.15
III. Bitcoin As A Strategic Allocation
Many investors have resisted exposure to bitcoin because of its volatility. While distracting perhaps, bitcoin’s volatility actually highlights its uniqueness. In contrast to modern central banking, the Bitcoin network does not prioritize exchange rate stability, relying instead ona quantity rule that limits the growth of money supply but allows the free flow of capital.16 As a result, bitcoin’s price is a function of demand relative to supply, the latter of which is increasing only 1.8% per year.
Untethered from traditional rules and regulations and, generally uncorrelated to the behavior of other asset classes, bitcoin could serve as a strategic allocation in well-diversified portfolios, despite its volatility. We believe the low correlations among traditional asset classes and bitcoin, as shown below, should minimize idiosyncratic risks and lower overall volatility, resulting in higher risk-adjusted returns.
15 “Money Supply M2.” Money Supply M2 - Countries - List, tradingeconomics.com/country-list/money-supply-m2.16 “Debunking Bitcoin Myths for the Institutional Investment Community.” ARK Invest, 26 June 2020, ark-invest.com/analyst-research/bitcoin-myths/.
Figure 7: Hypothetical Value Of Bitcoin As Currency Demonetization CatalystAccording To ARK’s Analysis
$0
$500
$1,000
$1,500
$2,000
$2,500
$3,000
Mar
ket C
apita
liztio
n (b
illio
ns U
SD)
Bitcoin as of 9/1/2020 1% M2 5% M2 10% M2$0
$20,000
$40,000
$60,000
$80,000
$100,000
$120,000
Pric
e pe
r bitc
oin
Note: M2 is a measure of the money supply that includes cash, checking deposits, and easily convertible near money. Source: ARK Investment Management LLC, Trading Economics | For informational purposes only and should not be considered investment
advice,or a recommendation to buy, sell or hold any particular security. Forecasts are inherently limited and cannot be relied upon.

Part 2 | Bitcoin As An InvestmentYassine Elmandjra, in collaboration with Coin Metrics
11
To illustrate bitcoin’s low correlation relative to other asset classes, we calculated the 90-day rolling correlation between bitcoin and nine other assets over the 10 years from May 2010 through June 2020, as shown below. As suggested by this sample, for the most part bitcoin has been uncorrelated to traditional asset classes and various stocks.
Each distribution represents over 2,500 data points over ten years. While they have oscillated over the years, the correlations for each asset tend to center around zero, indicating little to no correlation. Bitcoin’s mean correlation to the S&P 500 is roughly 0.03 and its mean correlation to gold, -0.004. For the most part, the correlations have ranged between -0.2 and 0.2, as shown below. The coronavirus spike in correlations was an exception, but 0.4-0.5 is only 40-50% of the near 100% correlations among stocks in equity markets over the same time period. Even the correlation between the S&P 500 (SPY) and physical gold (GLD) shot past 0.4, its highest since 2013.17 In the absence of pandemic-like shocks, however, we believe the correlations will revert toward 0 until asset allocators routinely include bitcoin and until the traditional financial system incorporates Bitcoin technology into its infrastructure.
17 Metrics, Coin. “Issue 46 - Investigating Bitcoin’s Changing Correlations.” Coin Metrics’ State of the Network, Coin Metrics’ State of the Network, 14 Apr. 2020, coinmetrics.substack.com/p/coin-metrics-state-of-the-network-7c4.
Figure 8: Bitcoin Correlation Distributions
Source: ARK Investment Management LLC, Coin Metrics, Data sourced from third party (Bloomberg)For informational purposes only and should not be considered investment advice,
or a recommendation to buy, sell or hold any particular security.

Part 2 | Bitcoin As An InvestmentYassine Elmandjra, in collaboration with Coin Metrics
12
Even at extremes, bitcoin appears to be the only asset with consistently low correlations relative to traditional asset classes. With the exception of Real Estate, its maximum one-year rolling correlation - positive or negative – is considered low, as shown below.18
18 For more information on the methodology for Figure 10, please see disclosure on page 28.
Figure 9: Bitcoin Correlation
Source: ARK Investment Management LLC, Coin Metrics, Data sourced from third party (Bloomberg)For informational purposes only and should not be considered investment advice,
or a recommendation to buy, sell or hold any particular security.
Figure 10: Correlations Chart
Bitcoin S&P 500 Bonds Gold Oil Emerging Market Currencies Real Estate TSLA AAPL BAC
0.26-0.14 -0.620.24 0.37 0.610.19 0.59 -0.44 0.430.13 0.52 -0.36 0.37 0.530.34 0.89 -0.49 0.26 0.48 0.450.15 0.51 -0.30 0.22 0.42 0.29 0.470.17 0.69 -0.29 -0.22 0.37 -0.22 0.57 0.400.25 0.89 -0.61 -0.55 0.53 0.42 0.77 0.42 0.49
BitcoinS&P 500BondsGoldOilEmerging Market CurrenciesReal EstateTSLAAAPLBAC
Source: ARK Investment Management LLC, Data sourced from third party (Bloomberg)For informational purposes only and should not be considered investment advice,
or a recommendation to buy, sell or hold any particular security.
High correlation: coefficient value lies between ± 0.50 and ± 1Moderate correlation: coefficient value lies between ± 0.30 and ± 0.49Low correlation: coefficient value lies below ± .29

Part 2 | Bitcoin As An InvestmentYassine Elmandjra, in collaboration with Coin Metrics
13
IV. Bitcoin’s Maturity As An Institutional Asset
Buy-side and sell-side institutions are evaluating whether or not bitcoin is ready for prime time. Buy-side institutions are analyzing whether the maturity of the cryptocurrency market structure is sufficient to accommodate substantial allocations of capital. Sell-side institutions are evaluating the depth of the market as they plan to offer products and services to buy-side institutions. In the next section, we will delve into bitcoin’s volume and liquidity.
Bitcoin’s Trading VolumeAs of this writing, while bitcoin’s free float is roughly $200 billion, the size of some of the largest publicly traded stocks in the US, its trading volume does not have as clear cut an analogy. Bitcoin’s market structure resembles that of foreign exchange markets quoted globally 24 hours a day, but significant bitcoin trading takes place on centralized exchanges, not between and among banks.
Aggregated in different ways, bitcoin’s trading volume ranges from $200 million to $12.4 billion per day, as shown below. For a buy-side institution deploying fresh capital, U.S Dollar Markets on major exchanges is perhaps the most relevant. Given $200 million in daily trading, a buy-side institution limited to 10% of the volume could deploy roughly $20 million per day. Including the major fiat currencies, however, bitcoin’s daily trading volume triples to $600 million, the U.S. dollar accounting for roughly half of the total. Stablecoins more than triple bitcoin’s daily trading volume once again to $1.9 billion, thanks primarily to Tether. Adding cryptocurrencies to the mix increases trading volume by $700 million. Finally, accounting for nearly 80% of the total, derivatives expand bitcoin’s daily volume more than five-fold to $12.4 billion, giving institutions limited to 10% of the volume an opportunity to deploy $1.2 billion per day.
Figure 11: Average Bitcoin Trading Volume On Major Exchanges (July 2020)
$ 12.4
$ 2.6
$ 1.9
$ 0.6
$ 0.2
Billions (USD)
All Fiat, Stablecoin, Crypto, and Derivatives Markets
All Fiat, Stablecoin, and Crypto Markets
All Fiat and Stablecoin Markets
All Fiat Markets
All U.S. Dollar Markets
$0 $2 $4 $6 $8 $10 $12 $14
Source: Coin Metrics Market Data Feed

Part 2 | Bitcoin As An InvestmentYassine Elmandjra, in collaboration with Coin Metrics
14
While the Bitcoin trading ecosystem consists of hundreds of centralized exchanges as well as a handful of decentralized exchanges and several OTC desks, the majority of trading occurs on the major centralized exchanges.19 Distribution of the U.S. dollar quoted spot market volume follows a power law: roughly 90% concentrated in the top four exchanges, Coinbase, Bitstamp, Bitfinex, and Kraken, as shown below. Such fragmentation suggests that institutions will have to onboard with multiple exchanges to execute bitcoin trades.
The balance of trading of major fiat currencies takes place on smaller regional exchanges with low volumes. With the U.S. dollar accounting for roughly half of the total trading volume, the Japanese yen, the euro, the Korean won, and the British pound account for 57% of fiat currency trading volume, as shown in Figure 13.
19 In this analysis, our volume figures are derived from a set of major exchanges consisting of Binance, Binance.US, Bitfinex, bitFlyer, Bithumb, BitMEX, Bitstamp, Bittrex, Bybit, CEX.IO, Coinbase, FTX, Gate.io, Gemini, Huobi, itBit, Kraken, Liquid, OKEX, Poloniex, and Upbit.
Figure 12: Average Spot Market U.S. Dollar Daily Volume On Major Exchanges (July 2020)
$ 0.001
$ 0.002
$ 0.003
$ 0.004
$ 0.004
$ 0.006
$ 0.015
$ 0.035
$ 0.040
$ 0.052
$ 0.086
Billions (USD)
bitFlyer
CEX.IO
Liquid
itBit
Binance.US
Bittrex
Gemini
Bitfinex
Kraken
Bitstamp
Coinbase
$0.00 $0.04 $0.08 $0.12
Source: Coin Metrics Market Data FeedFor informational purposes only and should not be considered investment advice,
or a recommendation to buy, sell or hold any particular security.

Part 2 | Bitcoin As An InvestmentYassine Elmandjra, in collaboration with Coin Metrics
15
Increasingly, tokenized fiat currencies - stablecoins - are gaining share in the trading of cryptocurrencies, with Tether taking a majority of the share. Because Tether operates in a regulatory gray zone, buy-side and sell-side institutions must decide whether or not the increased liquidity associated with stablecoins outweighs the risks. Compared to Tether, stablecoins with more regulatory oversight like USD Coin, Paxos Standard, or TrueUSD trade little on a daily basis as shown below.
Figure 13: Average U.S. Dollar Daily Volume of Major Fiat Currencies (July 2020)
$ 0.010
$ 0.021
$ 0.076
$ 0.222
$ 0.246
British Pound
Korean Won
Euro
Japanese Yen
US Dollar
$ 0.000 $ 0.050 $ 0.100 $ 0.150 $ 0.200 $ 0.250 $ 0.300
Billions USD
Source: Coin Metrics Market Data Feed
Figure 14: Average U.S. Dollar Daily Volume of Major Stablecoins (July 2020)
$ 0.002
$ 0.003
$ 0.004
$ 0.020
$ 0.036
$ 1.288
HUSD
TrueUSD
Paxos Standard
USD Coin
Binance USD
Tether
$ 0.000 $ 0.200 $ 0.400 $ 0.600 $ 0.800 $ 1.000 $ 1.200 $ 1.400
Billions USD
Source: Coin Metrics Market Data FeedFor informational purposes only and should not be considered investment advice,
or a recommendation to buy, sell or hold any particular security.

Part 2 | Bitcoin As An InvestmentYassine Elmandjra, in collaboration with Coin Metrics
16
Larger than spot markets, derivatives provide significant bitcoin liquidity relative to other markets, as shown below. The majority of the market is comprised of a single instrument called the Bitcoin Perpetual Swap, a type of derivative that follows the price of the underlying asset in close to real time. Margin contracts can settle in bitcoin, stablecoins, and fiat but are evolving. That said, different contract terms can be confusing and highlight market fragmentation.
Figure 15: Average Derivatives Market U.S. Dollar Daily Volume (July 2020)
$ 0.111
$ 0.406
$ 0.641
$ 1.345
$ 1.795
$ 2.212
$0.0 $0.5 $1.0 $1.5 $2.0 $2.5
FTX BTC Perpetual
OKEx BTC Perpetual
Bybit BTC Perpetual
BitMEX BTC Perpetual
Binance BTC Perpetual
Huobi BTC Perpetual
Billions USD
Source: Coin Metrics Market Data Feed For informational purposes only and should not be considered investment advice,
or a recommendation to buy, sell or hold any particular security.
For perspective, we illustrate the spot volume of bitcoin compared to that of other asset classes below.
Figure 16: Average U.S. Dollar Daily Volume of Major Asset Classes (July 2020)
$1 987
$ 893
$ 496
$ 3
$ 0 $ 500 $1,000 $1,500 $2,000
Billions USD
Global FX Spot Markets
All U.S. Bond Spot Markets
All U.S. Equity Spot Markets
All Bitcoin Spot Markets
Source: Coin Metrics Market Data Feed, CBOE, Sifma, and BIS
Part 2 | Bitcoin As An InvestmentYassine Elmandjra, in collaboration with Coin Metrics
17
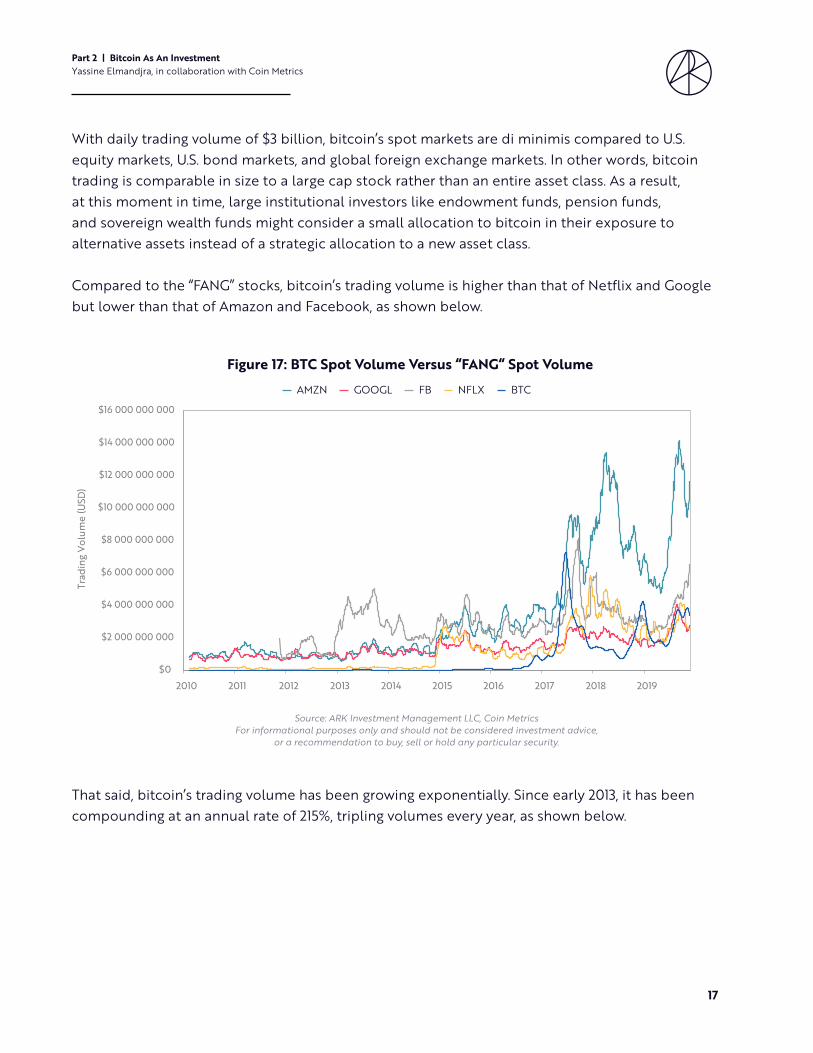
With daily trading volume of $3 billion, bitcoin’s spot markets are di minimis compared to U.S. equity markets, U.S. bond markets, and global foreign exchange markets. In other words, bitcoin trading is comparable in size to a large cap stock rather than an entire asset class. As a result, at this moment in time, large institutional investors like endowment funds, pension funds, and sovereign wealth funds might consider a small allocation to bitcoin in their exposure to alternative assets instead of a strategic allocation to a new asset class.
Compared to the “FANG” stocks, bitcoin’s trading volume is higher than that of Netflix and Googlebut lower than that of Amazon and Facebook, as shown below.
Figure 17: BTC Spot Volume Versus “FANG“ Spot VolumeAMZN GOOGL FB NFLX BTC
$0
$2 000 000 000
$4 000 000 000
$6 000 000 000
$8 000 000 000
$10 000 000 000
$12 000 000 000
$14 000 000 000
$16 000 000 000
Trad
ing
Volu
me
(USD
)
2010 2011 2012 2013 2014 2015 2016 2017 2018 2019
Source: ARK Investment Management LLC, Coin MetricsFor informational purposes only and should not be considered investment advice,
or a recommendation to buy, sell or hold any particular security.
That said, bitcoin’s trading volume has been growing exponentially. Since early 2013, it has been compounding at an annual rate of 215%, tripling volumes every year, as shown below.

Part 2 | Bitcoin As An InvestmentYassine Elmandjra, in collaboration with Coin Metrics
18
We believe that historical growth rates, bitcoin’s daily volume would exceed the volume of the US equity market in fewer than 4 years, and the volume of the US bond market in fewer than 5 years, as shown below.
Figure 18: Bitcoin Spot Market U.S. Dollar Daily Volume In Billions On Major Exchanges, 28-day Moving Average, 365-day Growth Rate
Source: Coin Metrics Market Data Feed
Figure 19: Bitcoin Spot Market U.S. Dollar Daily Volume In Billions On Major Exchanges, 28-day Moving Average
Source: Coin Metrics Market Data FeedForecasts are inherently limited and cannot be relied upon.

Part 2 | Bitcoin As An InvestmentYassine Elmandjra, in collaboration with Coin Metrics
19
Bitcoin’s LiquidityImportant to institutions when assessing an allocation to bitcoin is liquidity. Buy-side institutions will monitor data on spreads and volumes to estimate trading costs and capacity. Sell-side institutions will measure the risks of and rewards for providing liquidity across trading venues.
Liquidity as measured by bitcoin-US dollar bid-ask spreads is illuminating. Today, at the largest trading venues globally, spreads can be di minimis at the top exchanges, as low as 0.0001%, as shown below. For comparison, the average US equity bid-ask spread is roughly 0.035%, suggesting that bitcoin often is more liquid than the average publicly traded equity.
That said, while reliable at detecting its absence, bitcoin-US dollar spreads can be misleading measures of liquidity, primarily because of low minimum tick sizes, or price movements, compared to that of equities. Complicating the analysis are various tiered fee structures across trading venues.
An alternative measure of liquidity is the depth of book orders. Book depth is measured by the percentage price difference that a buyer or seller is likely to incur as the size of a trade increases. In liquid markets like Coinbase, Kraken, and Bitfinex, the slippage associated with a $1,000,000 order is below 0.30%, as shown below. Slippage can be much higher - up to 7% - on less liquid exchanges.
Figure 20: Bid-Ask Spread In Bitcoin-U.S. Dollar Markets On Major Exchanges (July 2020)
0.1069%
0.0683%
0.0559%
0.0511%
0.0504%
0.0073%
0.0051%
0.0027%
0.0011%
0.0011%
0.0001%
0.00% 0.02% 0.04% 0.06% 0.08% 0.10% 0.12% 0.14%
Average bid ask spread for U.S. Equities
CEX.IO
Bittrex
bitFlyer
Liquid
Bitstamp
Gemini
Binance.US
itBit
Kraken
Bitfinex
Coinbase
Bid-Ask Spread
Average bid-ask spread for U.S. Equities
Source: Coin Metrics Market Data FeedFor informational purposes only and should not be considered investment advice,
or a recommendation to buy, sell or hold any particular security.

Part 2 | Bitcoin As An InvestmentYassine Elmandjra, in collaboration with Coin Metrics
20
V. Asset Allocation to Bitcoin
Because bitcoin’s liquidity and volume appear to approach those of mega-cap public equities, they can inform institutional allocations to this new asset class. According to Modern Portfolio Theory, diversification optimizes returns and volatility as measured by the Sharpe ratio, the return per unit of risk. In this analysis, we use the three-month US Treasury Bill rate (0.15%) as the risk-free rate.
Based on daily returns during the past 10 years, we simulated 1,000,000 portfolios composed of various asset classes, as shown below:20
• Real Estate - The Morgan Stanley Capital International (MSCI) US Real Estate Investment Trust Index (RMZ) • Commodities - The Crude Oil Futures (CL1 COMB) • Currencies - MSCI Global Currency Index • Bonds - Bloomberg Barclays US Aggregate Bond Index • Equities - S&P 500 • Gold - GLD
20 For more information on the methodology, please see disclosure on page 28.
Figure 21: Percent Change In Price As A Result Of A $1 Million Market Buy Or Sell Order In Bitcoin-USD Markets For Major Exchanges (July 2020)
BuySell
7.70%
1.95%
1.42%
0.51%
0.48%
0.38%
0.28%
0.20%
0.21%
7.30%
2.00%
2.24%
0.52%
0.45%
0.33%
0.27%
0.19%
0.16%
itBit
CEX.IO
Bittrex
Binance.US
Gemini
Bitstamp
Coinbase
Bitfinex
Kraken
0,00% 1,00% 2,00% 3,00% 4,00% 5,00% 6,00% 7,00% 8,00% 9,00%
Percent Change In PriceSource: Coin Metrics Market Data Feed
For informational purposes only and should not be considered investment advice,or a recommendation to buy, sell or hold any particular security.
Part 2 | Bitcoin As An InvestmentYassine Elmandjra, in collaboration with Coin Metrics
21
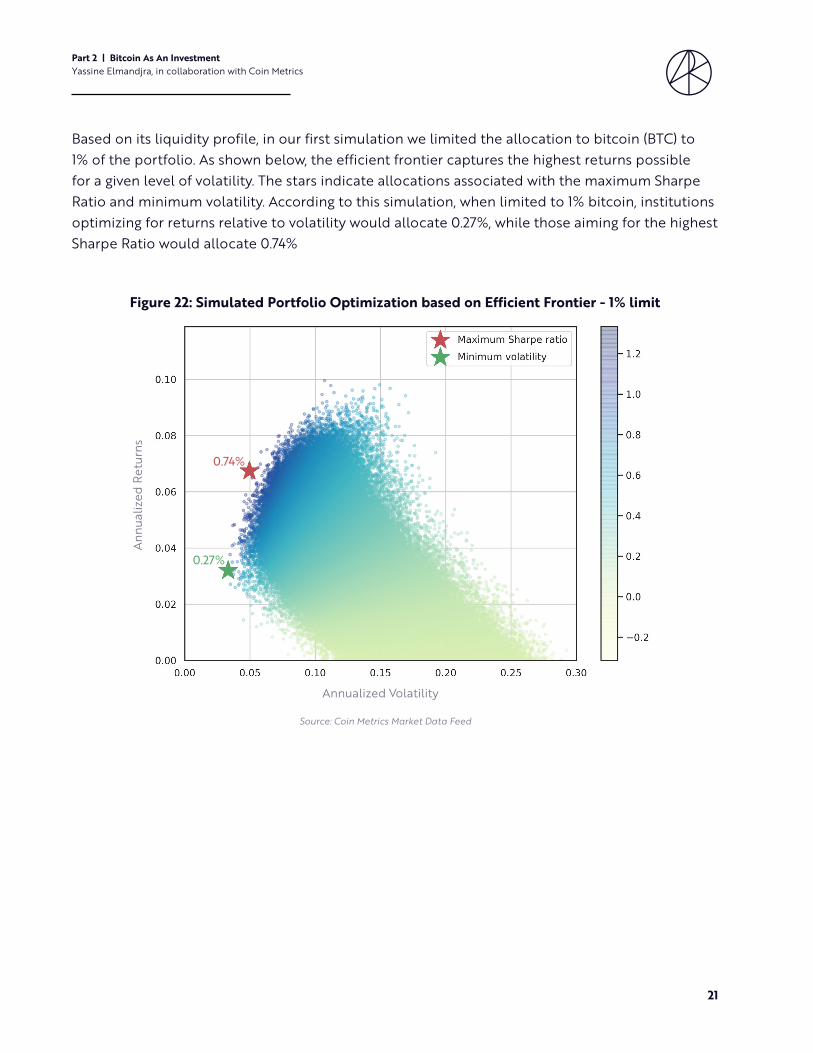
Based on its liquidity profile, in our first simulation we limited the allocation to bitcoin (BTC) to 1% of the portfolio. As shown below, the efficient frontier captures the highest returns possible for a given level of volatility. The stars indicate allocations associated with the maximum Sharpe Ratio and minimum volatility. According to this simulation, when limited to 1% bitcoin, institutions optimizing for returns relative to volatility would allocate 0.27%, while those aiming for the highest Sharpe Ratio would allocate 0.74%
Source: Coin Metrics Market Data Feed
Figure 22: Simulated Portfolio Optimization based on Efficient Frontier - 1% limit
Annu
aliz
ed R
etur
ns
Annualized Volatility
0.74%
0.27%

Part 2 | Bitcoin As An InvestmentYassine Elmandjra, in collaboration with Coin Metrics
22
Removing the 1% limit to allocation as bitcoin’s volume and liquidity approach those of a separate asset class, allocations to bitcoin would range from 2.55% when maximizing returns and minimizing volatility to 6.55% when maximizing Sharpe Ratios as shown in Figure 23.
Simulating Allocations Based on Bitcoin’s Total Addressable Market (TAM)With hindsight, to construct a portfolio with bitcoin while maximizing the Sharpe Ratio or minimizing volatility at the efficient frontier, an investor would allocate between 0.27% and 6.55% to bitcoin. Without hindsight, we have constructed predictive models including our 5-year forecast for bitcoin’s total addressable market, while assuming that the historical volatility and correlations between and among traditional asset classes remains intact.
According to three 5-year simulations, each a function of bitcoin’s total addressable market (TAM) opportunities outlined in Section 2, 1. 1% of TAM, or $1.1 trillion 2. 5% of TAM, or $5.5 trillion 3. 10% of TAM, or $11 trillion... the suggested bitcoin allocations range from 0.03% to 26%, as illustrated in Figures 24, 25, and 26.
Source: Coin Metrics Market Data Feed
Figure 23: Simulated Portfolio Optimization based on Efficient Frontier - No Limit
Annu
aliz
ed R
etur
ns
Annualized Volatility
6.55%
2.55%

Part 2 | Bitcoin As An InvestmentYassine Elmandjra, in collaboration with Coin Metrics
23
Based on this analysis, investors seeking to minimize volatility would allocate between 0.03% and 1.28% to bitcoin. Investors seeking to maximize Sharpe Ratio would allocate between 4.8% and 25.78% to bitcoin.
Figure 24: Simulated Portfolio Optimization based on Efficient Frontier - 1% TAM in 5 Years
Source: Coin Metrics Market Data FeedForecasts are inherently limited and cannot be relied upon.
Annu
aliz
ed R
etur
ns
Annualized Volatility
4.8%
1.15%
Figure 25: Simulated Portfolio Optimization based on Efficient Frontier - 5% TAM in 5 Years
Source: Coin Metrics Market Data FeedForecasts are inherently limited and cannot be relied upon.
Annu
aliz
ed R
etur
ns
Annualized Volatility
11.27%
1.28%

Part 2 | Bitcoin As An InvestmentYassine Elmandjra, in collaboration with Coin Metrics
24
VI. RISKS
A. CustodyCompared to that of traditional assets like stocks and bonds, the safekeeping of bitcoin is different. As discussed in Part 1, bitcoin adds a new dimension to custody and the ownership of assets. Cryptography enforces bitcoin’s ownership: the possession of digital private keys equates to ownership. The highly technical management of private keys requires solutions that do not exist in traditional asset custody.
Institutional investors allocating funds to bitcoin should understand the security measures necessary for its custody. In the last ten years, the mismanagement of private keys has cost investors hundreds of millions of dollars, without legal recourse. Even the largest bitcoin players have suffered from security breaches in the last two years, several retail exchanges losing $800 million collectively in client funds.21
While self-managed custody provides individuals with the optimal protection for their bitcoin, fiduciary responsibilities preclude institutional investors from the custody of bitcoin.
21 Source: Wright, Turner. “$39M Of Bitcoin Stolen in 2016 Bitfinex Hack Is on the Move.” Cointelegraph, Cointelegraph, 28 July 2020, cointelegraph.com/news/39m-of-bitcoin-stolen-in-2016-bitfinex-hack-is-on-the-move; Lam, Eric. “Binance Hack: 7,000 Bitcoin Worth $40 Million Stolen By Hackers.” Bloomberg.com, Bloomberg, 8 May 2019, www.bloomberg.com/news/articles/2019-05-08/crypto-exchange-giant-binance-reports-a-hack-of-7-000-bitcoin.
Figure 26: Simulated Portfolio Optimization based on Efficient Frontier - 10% TAM in 5 Years
Source: Coin Metrics Market Data FeedForecasts are inherently limited and cannot be relied upon.
Annualized Volatility
Annu
aliz
ed R
etur
ns
25.78%
0.03%
Part 2 | Bitcoin As An InvestmentYassine Elmandjra, in collaboration with Coin Metrics
25
Under the Securities and Exchange Commission’s (SEC) Custody Rule, for example, US institutions must adopt full-service third-party solutions to custody bitcoin. Fortunately, an ecosystem is evolving that should enable access to bitcoin with custodial services on par with traditional asset management services.
B. Regulation One of bitcoin’s primary value propositions is its ability to exchange and store value “permissionlessly”. In other words, we believe it will not succumb to the arbitrary imposition of financial regulations.
As a result, regulators are questioning how bitcoin can and should be regulated. As a borderless, internet-native asset, bitcoin operates without regard to jurisdiction, though nation-states can and do treat it differently. Some countries like Bolivia have banned it, while others like Malta have created national strategies promoting it.22
In the US, bitcoin falls in the regulatory cracks between stocks and commodities. Potentially due to concern that they would become obsolete in a fast-changing environment, the SEC has not pioneered bitcoin-specific policies. Without FDIC insurance and formal depositor rights, bitcoin’s infrastructure also is unregulated.
We believe investors have an opportunity to capitalize on the vacuum created by this regulatory uncertainty. Like the Internet, because the Bitcoin blockchain and the bitcoin cryptocurrency are here to stay, governments are likely to discover ways to deploy them to their advantage.
C. “Over-Institutionalization”Ironically, institutional adoption could present an existential risk to bitcoin’s value proposition. Specifically, bitcoin users and investors could fall prey to the custody of assets by third parties, limiting the satisfaction of the first two economic assurances explained in Part 1: 1) Value should be exchanged globally and freely, and 2) Wealth should be owned wholly and protected.
In our view, institutional adoption and Bitcoin’s core principles may be mutually exclusive. Because institutions must custody bitcoin with third party services, a custodial “banking” layer could result in just a few trusted parties dominating transactions. Users drawn to the most cost-efficient solutions also could transact with IOUs, saving on transaction costs and further diminishing Bitcoin’s ability to satisfy the first two economic assurances.
As noted in a recently published article by Deribit Insights Why Bitcoin Might Not Survive A Bitcoin Standard, bitcoin could succumb to the fate of gold in 1933 and 1970, when the US government
22 Dumont, Jackson. “How Malta Is Becoming the Global Capital of Crypto: Cointelegraph Documentary.” Cointelegraph, Cointelegraph, 4 July 2019, cointelegraph.com/news/how-malta-is-becoming-the-global-capital-of-crypto-cointelegraph-documentary.

Part 2 | Bitcoin As An InvestmentYassine Elmandjra, in collaboration with Coin Metrics
26
cancelled redemptions and abandoned the gold standard, eliminating its core value proposition.23 Today, more than 4 million BTC - 22% of bitcoin’s circulating supply – is in held in centralized custodial solutions.
VII. Conclusion
In this paper, we explore bitcoin as an emerging monetary asset. We believe its rapid growth has positioned bitcoin to earn an allocation in well diversified investment portfolios. Bitcoin offers one of the most compelling risk-reward profiles among assets, as our analysis suggests it should scale from roughly $200 billion today to $1-5 trillion network capitalization during the next five to ten years. In our view, capital allocators must consider the opportunity cost that will be associated with ignoring bitcoin as a new asset class.
Thank you for your interest. If you missed Part 1 of our white paper collaboration with Coin Metrics, we recommend you download it here: https://ark-invest.com/white-papers
23 Zhu, Su, and Hasu. “Why Bitcoin Might Not Survive a Bitcoin Standard.” Deribit Insights, 21 Aug. 2020, insights.deribit.com/market-research/why-bitcoin-might-not-survive-a-bitcoin-standard/.

Part 2 | Bitcoin As An InvestmentYassine Elmandjra, in collaboration with Coin Metrics
27
ARK Invest Management LLC3 East 28th Street, 7th FloorNew York, NY 10016
Join the conversation on Twitter@ARKinvest
Coin Metrics Inc. 125 High Street, Suite 220Boston, MA 02110
Coin Metrics was founded in 2017 as an open-source project to determine the economic significance of public blockchains. Today, we expand on that original purpose to empower people and institutions to make informed crypto financial decisions. We aim to onboard the world’s premier financial institutions into crypto with the most trusted data and insights. Analysts involved in researching and writing this paper are Nate Maddrey, Kevin Lu, and Jon Geenty.@coinmetrics
About Coin Metrics
Yassine joined ARK in July 2018. As ARK’s Blockchain/Cryptoasset Analyst, his research focuses on cryptoasset portfolio allocation, cryptoasset institutionalization, and Bitcoin mining.
Prior to ARK, Yassine was a Summer Analyst at Rembrandt Venture Partners, a SaaS focused early stage venture capital firm; and Arena Investors, a registered investment adviser that originates investments with borrowers and other counterparties who need access to financing and are otherwise not able to access conventional sources. Yassine graduated from the University of Pennsylvania with a Bachelor of Science in Economics from Wharton and a Bachelor of Science in Systems Engineering from The School of Engineering.
Yassine has been quoted on Yahoo, Yahoo Finance, Coindesk, Bitcoin Magazine, and Asia Times, among other publications. Additionally, Yassine was a featured speaker at The Fidelity Mining Summit and has been a guest on notable crypto-focused podcasts, including Marty Bent’s Tales from the Crypt, Laura Shin’s Unchained, Bitcoin Magazine, and Anthony Pompliano’s Off The Chain.
@yassineARK
About the Author

Part 2 | Bitcoin As An InvestmentYassine Elmandjra, in collaboration with Coin Metrics
28
©2020, ARK Investment Management LLC. No part of this material may be reproduced in any form, or referred to in any other publication, without the express written permission of ARK Investment Management LLC (“ARK”). The information provided is for informational purposes only and is subject to change without notice. This report does not constitute, either explicitly or implicitly, any provision of services or products by ARK, and investors should determine for themselves whether a particular investment management service is suitable for their investment needs. All statements made regarding companies or securities are strictly beliefs and points of view held by ARK and are not endorsements by ARK of any company or security or recommendations by ARK to buy, sell or hold any security. Historical results are not indications of future results.
Certain of the statements contained in this presentation may be statements of future expectations and other forward-looking statements that are based on ARK’s current views and assumptions and involve known and unknown risks and uncertainties that could cause actual results, performance or events to differ materially from those expressed or implied in such statements. The matters discussed in this presentation may also involve risks and uncertainties described from time to time in ARK’s filings with the U.S. Securities and Exchange Commission. ARK assumes no obligation to update any forward-looking information contained in this presentation.
ARK and its clients as well as its related persons may (but do not necessarily) have financial interests in securities or issuers that are discussed. Certain information was obtained from sources that ARK believes to be reliable; however, ARK does not guarantee the accuracy or completeness of any information obtained from any third party.
Methodology: Figure 10 (Page 12)In Figure 10, we take the maximum - positive or negative - one-year rolling correlation of listed assets since 2011. Our correlation calculation uses a Pearson correlation of logarithmic price returns. To take the correlation, we selected the following commonly used asset class benchmarks: Real Estate - The Morgan Stanley Capital International (MSCI), US Real Estate Investment Trust Index (RMZ), Commodities - The Crude Oil Futures (CL1 COMB), Currencies - MSCI Global Currency Index, Bonds - Bloomberg Barclays US Aggregate Bond Index, Equities - S&P 500, Gold - GLD.
Methodology: Portfolio Simulation (Page 20)To model the potential bitcoin weights in a portfolio, we use a Monte Carlo simulation method. The basis of using this method is that the probability of varying outcomes is typically harder to determine given random variable interference. A Monte Carlo simulation mitigates this interference by focusing on repeating random samples to output a result. While typically more effective than relying on a single variable to forecast or estimate an outcome, our simulation assumes perfectly efficient markets and does not account for factors that are not built into the price movement, including macro trends and market sentiment. As a part of the simulation, we selected the following commonly used asset class benchmarks, analyzing their price behavior since 2011: Real Estate - The Morgan Stanley Capital International (MSCI), US Real Estate Investment Trust Index (RMZ), Commodities - The Crude Oil Futures (CL1 COMB), Currencies - MSCI Global Currency Index, Bonds - Bloomberg Barclays US Aggregate Bond Index, Equities - S&P 500, Gold - GLD.
ARK Invest Management LLC3 East 28th Street, 7th FloorNew York, NY 10016
Join the conversation on Twitter@ARKinvest@coinmetrics
Coin Metrics Inc. 125 High Street, Suite 220Boston, MA 02110