Part 1 - World Economic Forum · 4/4/2012 · The Human Capital Report | 5 Part 1: Measuring Human...
34
Part 1 Measuring Human Capital
Transcript of Part 1 - World Economic Forum · 4/4/2012 · The Human Capital Report | 5 Part 1: Measuring Human...

Part 1Measuring Human Capital


The Human Capital Report | 3
The Human Capital Index
the trends in similar regional and income groups. The third and fourth pages show detailed information on variables contained in the Index as well as over 60 contextual variables on demographics, education, health, society and the workforce.
MEASURING HUMAN CAPITALThe Human Capital Index is a new measure for capturing and tracking the state of human capital development around the world. It has three key features.
First, the Index measures a broader set of indicators than the traditional definitions of human capital. Human capital is not a one–dimensional concept, but means different things to different stakeholders. In the business world, human capital is the economic value of an employee’s set of skills. To the policy maker, human capital is the capacity of the population to drive economic growth. Traditionally, human capital has been viewed as a function of education and experience, the latter reflecting both training and learning by doing. But in recent years, health (including physical capacities, cognitive function and mental health) has come to be seen as a fundamental component of human capital. Additionally, the value of human capital is critically determined by the physical, social and economic context of a society, because that context determines how particular attributes a person possesses may be rewarded. The Index is thus based on four pillars: three core determinants of human capital (education, health and employment) plus those factors that allow these three core determinants to translate into greater returns.
Second, the Index takes a long–term approach to human capital. In addition to providing a snapshot of the state of a country’s human capital today through measures that reflect the results of a country’s past practices, it includes indicators resulting from practices and policy decisions impacting the children of today and which will shape the future workforce. Long–term thinking around human capital often does not fit political cycles or business investment horizons; but lack of such long term planning can perpetuate continued wasted potential in a country’s population and losses for a nation’s growth and productivity. The Index seeks to develop a stronger consciousness around the need for such planning.
Third, the Index aims to take into account the individual life course. For example, the WHO states that
INTRODUCTIONA nation’s human capital endowment—the skills and capacities that reside in people and that are put to productive use—can be a more important determinant of its long term economic success than virtually any other resource. This resource must be invested in and leveraged efficiently in order for it to generate returns, for the individuals involved as well as an economy as a whole. Additionally, despite high unemployment in many countries, the global economy is entering an era of talent scarcity that, if left unaddressed, will hinder economic growth worldwide. Understanding and addressing challenges related to human capital is thus fundamental to short term stability as well as the long term growth, prosperity and competitiveness of nations.
The Human Capital Index explores the contributors and inhibitors to the development and deployment of a healthy, educated and productive labour force, and has generated the information contained in this Report. The Index provides country rankings that allow for effective comparisons across regions and income groups. The methodology and quantitative analysis behind the rankings are intended to serve as a basis for designing effective measures for workforce planning. While the rankings are designed to create greater awareness among a global audience, the Index also seeks to serve as a basis for dialogue and action by leaders at the World Economic Forum to increase public–private collaboration on developing human capital.
The first part of Part 1 reviews the underlying concepts employed in creating the Human Capital Index and outlines the methods used to calculate it. The second part presents the 2013 rankings and regional performance, and calls attention to notable country cases. The third part of Part 1 provides an overview of the links between human capital and the economic performance of countries and points to further areas of work.
The Country Profiles contained in Part 2 of this Report give a more detailed picture of the relative strengths and weaknesses of each country’s performance compared with that of other nations. The first page of each profile contains an overview of each country’s performance in 2013 as well as a visual representation of the countries demographic and labour force structure. The second page shows information on occupation types and comparisons with
Part 1: Measuring Human Capital
4 | The Human Capital Report
“early childhood is the most important phase for overall development throughout the lifespan,” elaborating that “many challenges faced by adults, such as mental health issues, obesity, heart disease, criminality, and poor literacy and numeracy, can be traced back to early childhood.” 1 The Index thus includes measures indicating quality of early childhood. Furthermore, the Index captures the extent to which investments made in earlier years in health and education are being realised in the working age population through lifelong learning and training. Finally, at the other end of the continuum, the Index takes into account the health and productivity of the older population.
As a vital support to the Index, the Country Profiles included in this Report contain a wide variety of contextual factors. In particular, the Profiles call attention to population dynamics, such as youth bulges, ageing populations and shrinking workforces, which, in the context of limited resources, point to critical areas for urgent– and longer–term investments.
THE FOUR PILLARSThe four pillars of the Index are:
• The Education pillar contains indicators relating to quantitative and qualitative aspects of education across primary, secondary and tertiary levels and contains information on both the present workforce as well as the future workforce.
• The Health and Wellness pillar contains indicators relating to a population’s physical and mental well–being, from childhood to adulthood.
• The Workforce and Employment pillar is designed to quantify the experience, talent, knowledge and training in a country’s working–age population.
• The Enabling Environment pillar captures the legal framework, infrastructure and other factors that enable returns on human capital.
The Index contains 51 indicators in total, spread across the four pillars, with 12 indicators in the Education pillar, 14 in the Health and Wellness pillar, 16 in the Workforce and Employment pillar and nine in the Enabling Environment pillar. The values for each of the indicators come from publicly available data produced by international organizations such as the World Health Organization (WHO), the United Nations Educational Scientific and Cultural Organization (UNESCO) and the International Labour Organization (ILO). In addition to hard data, the Index uses qualitative survey data from the World Economic Forum’s Executive Opinion Survey and Gallup’s wellness perception survey data. A full overview of the Index indicators and sources is included in Table 1 and detailed descriptions are included in the section on How to Read the Country Profiles.
EducationThe Education pillar captures several dimensions of education—access to education and quality of education, impacting the future labour force, and the educational attainment of those already in the labour force.
Access to educationAccess to education for today’s children and youth—the future workforce—is captured using net adjusted enrolment rates for primary and net enrolment rates for secondary school, as well as through gross tertiary enrolment ratios and a measure of the education gender gap. The net enrolment rate captures all children who are enrolling at the right age for that school level. Social, in addition to economic, marginalization still denies education to many. The Education subindex from the World Economic Forum’s Global Gender Gap Report, which measures the gap between females’ and males’ access to the three selected stages of education, is included in this pillar as an indicator of educational inclusion.
Quality of educationAlthough access measures show exposure to learning, they do not capture the quality of these learning environments. A third of the Education pillar thus comprises qualitative indicators, such as the quality of primary education, quality of maths and science instruction, the quality of management schools, the level of access to the Internet in schools and the quality of the education system overall for meeting the needs of a competitive economy.
Educational attainmentIncluded in this sub–pillar are three measures of educational attainment to capture the percentage of the population (aged 25 and over) who have achieved at least primary, lower secondary or tertiary education.
Health and WellnessThe Health and Wellness pillar captures how various socio–cultural, geographical, environmental and physiological health factors impact human capital development. Based on a life–course approach, it includes early development indicators, that are predictive of the health of the future workforce, and communicable and non–communicable disease indicators that impact the productivity and capacity of the current labour force.
SurvivalA fundamental determinant of human capital is the survival of its population. In the crudest terms, longer lives equal more productive years per capita, but are also a strong indicator of the overall health and living conditions of a population. This sub–pillar includes a simple measure of average life expectancy across the population, infant mortality and the health parity sub–index from the World Economic Forum’s Global Gender Gap Index.

The Human Capital Report | 5
Part 1: Measuring Human Capital
HealthThe state of physical health of the population is captured in the Health sub–pillar, focusing on both children and adults. The first few years of infancy are critical for a child; nutritional deficiencies and disease at this age may impede the child’s physical and cognitive development so that he or she is unable to reach his or her productive potential in adulthood. Early development indicators of long–term cognitive and physical impairment include an average of stunting (refers to low height–for–age, when a child is short for his/her age but not necessarily thin; a result of chronic malnutrition) and wasting (refers to low weight–for–height where a child is thin for his/her height but not necessarily short; a result of acute malnutrition) in children under five.
The Health sub–pillar also seeks to capture the years spent in poor health in the adult, working age population by measuring the difference between this life expectancy and the number of years that a person can expect to live in “full health” without disease and/or injury.2 Non–communicable diseases (NCDs) kill more than 36 million people each year, a quarter of whom die before the age of 60.3 We capture these losses through a measure of the proportion of the population under 60, (i.e. the population that is normally considered of economically active age), that dies ‘prematurely’ from NCDs. In addition, NCDs as well as communicable diseases have adverse effects throughout the life course. The Health sub–pillar includes five measures of NCDs, and their impact on business. These comprise: heart diseases, cancer, mental illness, diabetes and chronic respiratory disease. This group of five NCD indicators, which measure the seriousness of their impact on business, together contribute a single weight to the ‘Average business impact of non–communicable diseases’ composite indicator. In addition, the following three communicable diseases: HIV, tuberculosis and malaria combined, carry a further single weight for the ‘Average business impact of communicable diseases’ indicator.
In 2008, there were more than 1.4 billion adults in the world overweight, and more than half a billion globally obese (having a body mass index of equal to or greater than 30). More of the world’s population is killed through being overweight than underweight today.4 Obesity causes lost productivity and is a substantial burden on the health resources of a nation. We thus include a measure of BMI for the adult population.
Well–beingThe WHO estimates that the impact of mental health illnesses costs developed countries between three and four percent of GNP annually.5 Depression is ranked as the leading cause of disability worldwide.6 While many cases go unreported due to lack of access to care or stigma, this sub–pillar comprises two perception–based indicators reporting experiences of depression and stress. This means that the data is not reflective of those who
have received a medical diagnosis for stress or depression, but is a measure from a sample population who have experienced what they understand to be feelings of stress or depression.
ServicesThis sub–pillar includes three additional indicators that provide a broad view of the quality of healthcare and access to healthcare services. The qualitative measures of quality and access to healthcare were chosen because they are more closely related to individual health than are measures of expenditures on healthcare infrastructure. The final indicator in the sub–pillar measures the use of improved drinking water sources and improved sanitation facilities, which can reduce illnesses leading to loss of productivity and absenteeism.7
Workforce and EmploymentThere are no standard, internationally comparable datasets that directly measure skills, talent and experience despite agreement among governments, academia and business leaders that these should be measured. Therefore, the Index relies on a number of proxy variables to seek to provide an aggregate measure for quantitative and qualitative aspects of the labour force. The Workforce and Employment pillar combines labour force participation rates to measure how many in a country are gaining experience in the workforce with indicators of the level or quality of experience gained.
ParticipationThis sub–pillar measures how many people are able to participate actively in the workforce as well as how successfully particular sectors of the population are able to contribute (women, youth and those aged over 65). In addition to labour force participation rates for those aged 15–64, this sub–pillar includes a measure of the gender gap in economic participation—whether an economy is leveraging both halves of its human capital pool or not impacts the aggregate accumulation of experience. We have also included an indicator representing labour force participation of the over 65’s. From a human capital stock perspective, a low labour force participation rate for the “silver” workforce is treated as undesirable but is particularly negative for those countries with long, healthy life expectancies that face ageing populations and shrinking workforces. Further information on statutory retirement ages is included in each country’s profile.
Unemployment rates for both the youth and adult population are included. These indicators capture a subset of those in the economy who are in the labour force and are actively looking for and are available for work, and exclude those who are outside of the labour force, i.e. are not working nor looking for work. We include both adult and youth unemployment because of its greater multiplier effects in the future. With youth unemployment worsening
Part 1: Measuring Human Capital
6 | The Human Capital Report
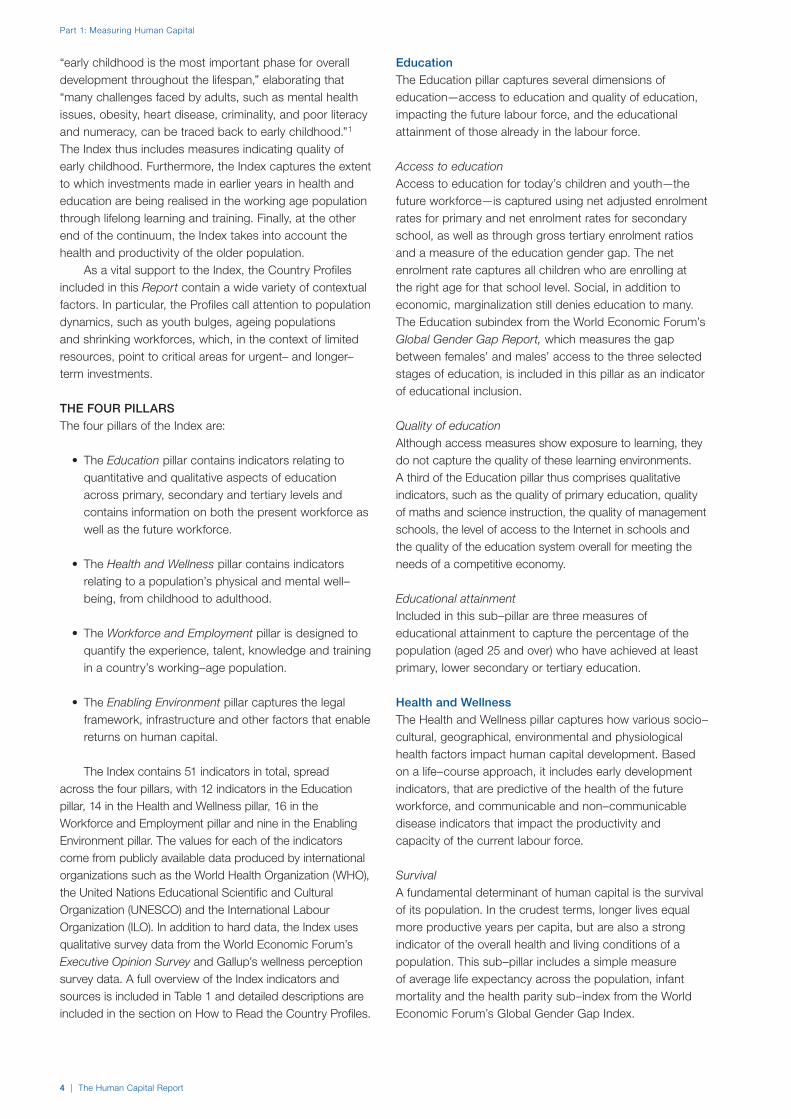
Table 1: Structure of the Human Capital Index
(cont’d.)
PILLAR 1: EDUCATION
Sub–pillar Indicator Source
Access Primary enrolment rate (%) UNESCO, Institute for Statistics, provided database extraction 22 August
2013, latest available data 2003–2012
Secondary enrolment rate (%) UNESCO, Institute for Statistics, provided database extraction 22 August
2013, latest available data 2003–2012
Tertiary enrolment ratio (%) UNESCO, Institute for Statistics, provided database extraction 22 August
2013, latest available data 2003–2012
Education gender gap World Economic Forum, Global Gender Gap Report, 2012
Quality Internet access in schools World Economic Forum, Executive Opinion Survey, 2013–2014
Quality of the education system World Economic Forum, Executive Opinion Survey, 2013–2014
Quality of primary schools World Economic Forum, Executive Opinion Survey, 2013–2014
Quality of math and science education World Economic Forum, Executive Opinion Survey, 2013–2014
Quality of management schools World Economic Forum, Executive Opinion Survey, 2013–2014
Attainment Primary education attainment
(% population age 25+)
UNESCO Institute for Statistics, Education Statistics online database,
2011 or latest year available
Secondary education attainment
(% population age 25+)
UNESCO Institute for Statistics, Education Statistics online database,
2011 or latest year available
Tertiary education attainment
(% population age 25+)
UNESCO Institute for Statistics, Education Statistics online database,
2011 or latest year available
PILLAR 2: HEALTH AND WELLNESS
Sub–pillar Indicator Source
Survival Infant mortality (per 1,000 live births) World Health Organisation, Global Health Observatory, World Health
Statistics, Mortality and Burden of Disease, Child mortality, 2011
Life expectancy World Health Organisation, Global Health Observatory, World Health
Statistics, Mortality and Burden of Disease, Child mortality, 2011
Survival gender gap World Economic Forum, Global Gender Gap Report, 2012
Health Stunting and wasting (% in children under 5) World Health Organisation, Global Health Observatory, World Health
Statistics, Nutrition, Child malnutrition, latest available data 2003–2011
Unhealthy life years (% of life expectancy) Healthy adjusted life expectancy, World Health Organisation data, 2007,
taken from the Global Gender Gap Report 2012; life expectancy, as
above
Deaths under 60 from non–communicable
diseases (% of all NCD deaths)
World Health Organisation, Global Health Observatory, World Health
Statistics, Non–communicable diseases, 2008
Obesity (% of adults with BMI ≥ 30) World Health Organisation, Global Health Observatory, World Health
Statistics, Adult risk factors, 2008
Business impact of non–communicable diseases World Economic Forum, Executive Opinion Survey, 2013–2014
Business impact of communicable diseases World Economic Forum, Executive Opinion Survey, 2013–2014
Well–being Stress (% of respondents) Gallup, Worldview database, latest available data 2009–2013
Depression (% of respondents) Gallup, Worldview database, latest available data 2006–2011
Services Water, sanitation and hygiene World Health Organisation, Global Health Observatory, World Health
Statistics, Environmental Health, latest available data 2005–2011
Healthcare quality World Economic Forum, Executive Opinion Survey, 2013–2014
Healthcare accessibility World Economic Forum, Executive Opinion Survey, 2013–2014
The Human Capital Report | 7
Part 1: Measuring Human Capital
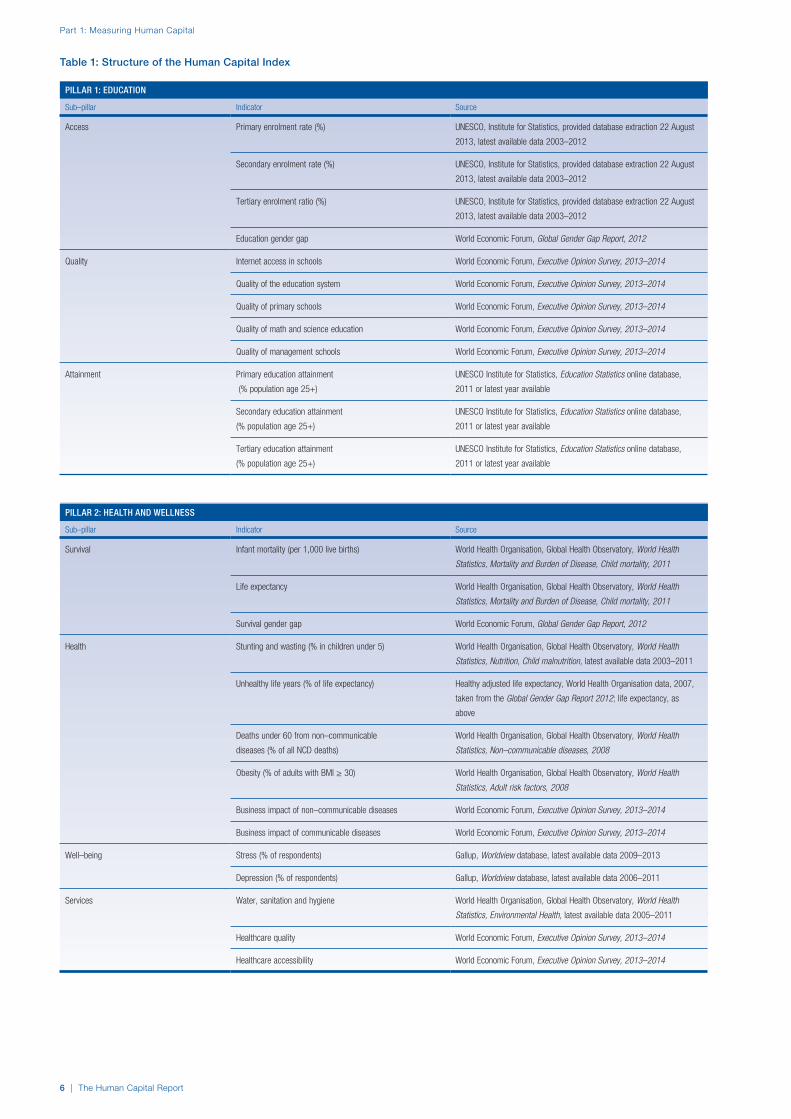
Table 1: Structure of the Human Capital Index (cont’d.)
PILLAR 3: WORKFORCE AND EMPLOYMENT
Sub–pillar Indicator Source
Participation Labour force participation rate, age 15–64 (%) ILO, Key Indicators of the Labour Market, (KILM), 2010
Labour force participation rate, age 65+ (%) ILO, Key Indicators of the Labour Market, (KILM), 2010
Economic participation gender gap World Economic Forum, Global Gender Gap Report, 2012
Unemployment rate (%) ILO, ILOstat, latest available data 2003–2010
Youth unemployment rate (%) ILO, Laborstat, latest available data 2003–2010
Talent Country capacity to attract talent World Economic Forum, Executive Opinion Survey, 2013–2014
Country capacity to retain talent World Economic Forum, Executive Opinion Survey, 2013–2014
Ease of finding skilled employees World Economic Forum, Executive Opinion Survey, 2013–2014
Pay related to productivity World Economic Forum, Executive Opinion Survey, 2013–2014
Capacity for innovation World Economic Forum, Executive Opinion Survey, 2013–2014
Index of Economic Complexity Hausmann, R., Hidalgo, C., et al. The Atlas of Economic Complexity.
Cambridge: Puritan Press, 2011
Firm level technology absorption World Economic Forum, Executive Opinion Survey, 2013–2014
Scientific and technical journal articles (per 1,000 people) World Bank, World Development Indicators online database, 2009
and United Nations, Department of Economic and Social Affairs,
World Population Prospects, 2009
Median age of the working population United Nations, Department of Economic and Social Affairs, Population
Division, World Population Prospects DEMOBASE 2010
Training Staff training World Economic Forum, Executive Opinion Survey, 2013–2014
Training services World Economic Forum, Executive Opinion Survey, 2013–2014
PILLAR 4: ENABLING ENVIRONMENT
Sub–pillar Indicator Source
Infrastructure Mobile users (per 100 people) World Bank, World Development Indicators online database, 2011
Internet users (per 100 people) World Bank, World Development Indicators online database, 2011
Quality of domestic transport World Economic Forum, Executive Opinion Survey, 2013–2014
Collaboration State of cluster development World Economic Forum, Executive Opinion Survey, 2013–2014
Business and university R&D collaboration World Economic Forum, Executive Opinion Survey, 2013–2014
Legal framework Doing Business Index World Bank and International Finance Corporation, 2012
Social safety net protection World Economic Forum, Executive Opinion Survey, 2013–2014
Intellectual property protection and property rights World Economic Forum, Executive Opinion Survey, 2013–2014
Social mobility Social mobility World Economic Forum, Executive Opinion Survey, 2013–2014
Part 1: Measuring Human Capital
8 | The Human Capital Report
globally and with young people more than three times more likely to be unemployed than adults, the ILO warns of a “scarred generation” and that “youth unemployment and underemployment impose heavy social and economic costs, resulting in the loss of opportunities for economic growth [...] and unutilized investment in education and training.”8
TalentThis sub–pillar contains several concepts to capture a broad, aggregate measure of talent. First, it contains a high–level measure of the average level of experience in an economy in the form of the median age of the working age population (15–64). Second, it integrates business leaders’ assessment of their countries ability to attract and retain talent, of their companies’ ability to find skilled employees and of the existence of merit–based rewards for employees. Third, it assesses whether the talent available in a country leads to economic results in the form of production, learning within firms, innovation and knowledge generation, captured through the Index of Economic Complexity—countries that make sophisticated products must possess the skills and expertise to do so—two survey variables on firm level technology absorption and capacity for innovation, and the prevalence of scientific and technical journal articles.
TrainingTwo quantitative indicators serve as a proxy for continued training and learning. The extent of staff training indicator measures the extent to which companies invest in training and employee development and the training services indicator measures the extent to which high–quality specialized training services are available.
Enabling EnvironmentThe indicators included in this pillar capture whether human capital is deployed effectively or whether barriers in the environment are preventing the effective use of human capital, thereby negating the investments made in human capital development.
InfrastructureThis sub–pillar looks at three basic aspects of physical and communication infrastructure as facilitators of human capital. Physical transport, which facilitates access to workplaces and is critical to connecting industry and communities together, is measured through a survey indicator on the quality of domestic transport. The use of ICT, such as mobile phones and the Internet, can also accelerate communication and exchange across the complex networks that underpin human capital growth. These are captured through prevalence indicators for mobile phones and Internet use, respectively.
CollaborationCross–industry and cross–sector learning facilitate innovation, information exchange and the development of human capital. These concepts are captured through two survey indicators from the Executive Opinion Survey. We include a measure of the extent to which universities and industry collaborate on R&D. We also include a measure of how prevalent are well–developed and deep clusters.
Legal frameworkThis sub–pillar looks at the legal environment within which people are employed or self–employed. In particular, we include the ease of doing business in a country, using the World Bank’s Doing Business Index, which looks at how conducive the legal and regulatory environment is to starting and operating a local business. The protection of both physical property and intellectual property is important from a human capital perspective as it protects the knowledge—the intangible assets—of an individual as well as the assets connected with that knowledge. This is measured through a combination of two survey variables. We also include in this sub–pillar social safety net protection for its role in preserving skills and knowledge and reducing the attrition on human capital.
Social mobilityFinally, we include a measure of rigid socio–cultural practices that may thwart progress in human capital development despite investments through policy instruments. The opportunity for an individual to transcend social strata may be a significant motivational factor for investment in their own and their offspring’s human capital development. Therefore in countries where status is ascribed rather than achieved, the incentive for investing in human capital is reduced.
CONSTRUCTION OF THE INDEXStandardizing dataThe indicators used in the Index are measured on different scales. To standardize the data, we used the z–score statistic as it preserves the distribution of the data, a feature most relevant for a comparative international composite index.
Z–scores are expressed as standard deviations from the mean. The mean is zero and has a standard deviation of one. This means that all data points above the mean are expressed as positive scores and all data below the mean are expressed as negative scores. The z–scores methodology is based on an assumption of the normal distribution. A standard deviation of plus (minus) 1 represents the area 34.13% above (below) the mean (zero) and a standard deviation of plus (minus) 2 represents the area 47.72% above (below) the mean. The z–score of a data point indicates the number of standard deviations above or below the mean. So a z–score of –2 is exactly two standard deviations, or 47.72%, below the mean.

The Human Capital Report | 9
Part 1: Measuring Human Capital
The z–score approach is a widely used way of converting raw data that is expressed in differing formats into a common metric (standardizing). The z-score approach is widely used but, like alternative approaches, it does introduce some uncertainty. For example, z-scores are unfamiliar to many. Also, converting to z-scores can sometimes yield an extreme value, and a common approach is to delete extreme values. However, considering the further arbitrary distortions this may create, a decision was made not to prune the data at any point in order to represent the dataset in its purest form.
Weights and missing dataOnce all underlying data is converted to z–scores, a country’s score on a given pillar is determined by an unweighted average of all available scores within that pillar. A country’s score on the overall index is an unweighted average of the four pillar scores. Underlying weights are reported in Tables 2a–2d.
Missing data is not imputed. The criterion for an indicator to be included in the Index is that it must have non–missing data for at least 50 percent of the countries. The criterion for a country to be included in the Index is that it must have non–missing data for at least 70 percent of each of the pillar’s indicators. This means a country must have data for at least:
• 8 out of 12 indicators in the Education pillar• 10 out of 14 indicators in the Health and Wellness pillar• 11 out of 16 indicators in the Workforce and
Employment pillar• 6 out of 9 indicators in the Enabling Environment pillar
THE HUMAN CAPITAL INDEX: RANKINGS 2013Country CoverageThe Index covers 122 countries. The terms country, economy and nation as used in this report do not in all cases refer to a territorial entity that is a state as understood by international law and practice. The term covers well–defined, geographically self–contained economic areas that may not be states but for which statistical data are maintained on a separate and independent basis. Figure 1 displays a world map with country coverage.
Global ResultsThe Index results are primarily reported in the context of 122 countries in Tables 3 and 4.
Tables 5, 6 and 7 allow for comparisons within regional groupings and income groupings. Table A1 and Table A2 in the Appendix contain the complete list of countries by region and income group, respectively.
Figures 2 through 6 display regional aggregate scores overall and by pillar.
Figure 1: Country coverage of the Human Capital Index
n Countries covered

Part 1: Measuring Human Capital
10 | The Human Capital Report
Sub–pillar Indicator Weight
Participation Labour force participation rate, age 15–64 (%) 1.56
Labour force participation rate, age 65+ (%) 1.56
Economic participation gender gap 1.56
Unemployment rate 1.56
Youth unemployment rate 1.56
Talent Country capacity to attract talent 1.56
Country capacity to retain talent 1.56
Ease of finding skilled employees 1.56
Pay related to productivity 1.56
Capacity for innovation 1.56
Index of economic complexity 1.56
Firm level technology absorption 1.56
Scientific and technical journal articles 1.56
Median age of the working population 1.56
Training Staff training 1.56
Training services 1.56
TOTAL PILLAR WEIGHT 25.00
Table 2c: Workforce and employment subpillars and indicator weights
Sub–pillar Indicator Weight
Access Primary enrolment rate (%) 2.08
Secondary enrolment rate (%) 2.08
Tertiary enrolment ratio (%) 2.08
Education gender gap 2.08
Quality Internet access in schools 2.08
Quality of the education system 2.08
Quality of primary schools 2.08
Quality of math and science education 2.08
Quality of management schools 2.08
Attainment Primary education attainment (% population age 25+) 2.08
Secondary education attainment (% population age 25+) 2.08
Tertiary education attainment (% population age 25+) 2.08
TOTAL PILLAR WEIGHT 25.00
Table 2a: Education subpillars and indicator weights
Sub–pillar Indicator Weight
Survival Infant mortality (per 1,000 live births) 1.79
Life expectancy 1.79
Survival gender gap 1.79
Health Stunting and wasting (% in children under 5) 1.79
Unhealthy life years (% of life expectancy) 1.79
Deaths under 60 from non–communicable diseases (% of all NCD deaths). 1.79
Obesity (% of adults with BMI ≥ 30) 1.79
Business impact of non–communicable diseases 1.79
Business impact of communicable diseases 1.79
Well–being Stress (% of respondents) 1.79
Depression (% of respondents) 1.79
Services Water, sanitation and hygiene 1.79
Healthcare quality 1.79
Healthcare accessibility 1.79
TOTAL PILLAR WEIGHT 25.00
Table 2b: Health and wellness subpillars and indicator weights
The Human Capital Report | 11
Part 1: Measuring Human Capital
TOP TENThe top ten countries are dominated by the European countries, with eight of the top ten spots occupied by countries from this region. Switzerland (1) tops the rankings for the Human Capital Index, demonstrating consistently high scores across all four pillars, with top spots on Health and Wellness and Workforce and Employment, second place on Enabling Environment and fourth on Education.
Within the countries from Northern and Western Europe in the top ten, four Nordic countries, Finland (2), Sweden (5), Norway (7) and Denmark (9) dominate. Finland’s exemplary Education and Enabling Environment scores put it at the top of the rankings for these two pillars and seven ranks ahead of the next highest–ranking Nordic country. The overall strength of the Nordic region lies in the Workforce and Employment pillar, with Finland, Norway and Sweden occupying three of the top six ranks. Denmark drops out of the top ten, to 12th position in this pillar and down to 11th position for the Enabling Environment pillar.
Singapore (3) is the only Asian country in the top ten due to very strong scores on the Education pillar, Workforce and Employment pillar and a strong fifth position on the Enabling Environment pillar.
The Netherlands (4) is the third of the European countries in the top ten due to strong performances for Health and Wellness and for Enabling Environment. Germany (6) just edges ahead of the Netherlands on the Enabling Environment rankings in third place but holds ninth position on the Workforce and Employment pillar. Germany’s relatively low place on the Education pillar (19) pulls down the country’s overall score in the Index.
The United Kingdom (8) performs well on Enabling Environment but has lower scores on Health and Wellness, holding 17th position. Canada (10) is the first of the two North American countries in the Index and the only one in the top ten. Canada’s overall scores are greatly enhanced by its second position on the Education pillar. Ranks for the remaining three pillars vary between 15th and 20th position.
ASIA AND THE PACIFICThe region has a diverse spread of wealth, comprising five of the sample’s high–income economies, four upper–middle income, nine lower–middle economies as well as Bangladesh and Cambodia, two low–income countries. As a region, Asia ranks third overall, behind North America and Europe and Central Asia.
Singapore (3) is the highest ranked of the region’s countries and the only country from the region in the top ten. Singapore’s excellent rank is due to its very strong scores on the Education and Workforce and Employment pillars, and good scores on Enabling Environment. Exceptionally strong scores across the qualitative education indicators and the high level of tertiary education among the adult population drive up its Education pillar ranking. Strengths on the Enabling Environment’s Collaboration and Legal framework sub–pillars include a top rank on the Doing Business Index. The Health and Wellness pillar is weakened mainly due to the burden of disease in the country.
Despite the Enabling Environment being New Zealand’s (12) weakest pillar at 18th, the country also performs very well in some aspects, with top ten ranks across the Legal framework sub–pillar and a rank of 3 in Social mobility. New Zealand’s strengths in Education are similar to those of Singapore, but it ranks lower in the qualitative talent indicators on the Workforce and Employment pillar, including a particularly low rank (69) for the ability of the country to retain talent, or the ‘brain drain’ indicator.
Japan’s (15) strong performance in Health and Wellness is due to excellent scores in the Health and the Survival sub–pillars. Top rankings for life expectancy and years lived in good health help drive the strong rankings. Japan’s training indicators on the Workforce and Employment pillar are also strong, with top ten rankings. Enrolment rates in secondary education rank at the top while the Primary enrolment indicator gives Japan third place. However Japan’s relatively weaker spots in the
Sub–pillar Indicator Weight
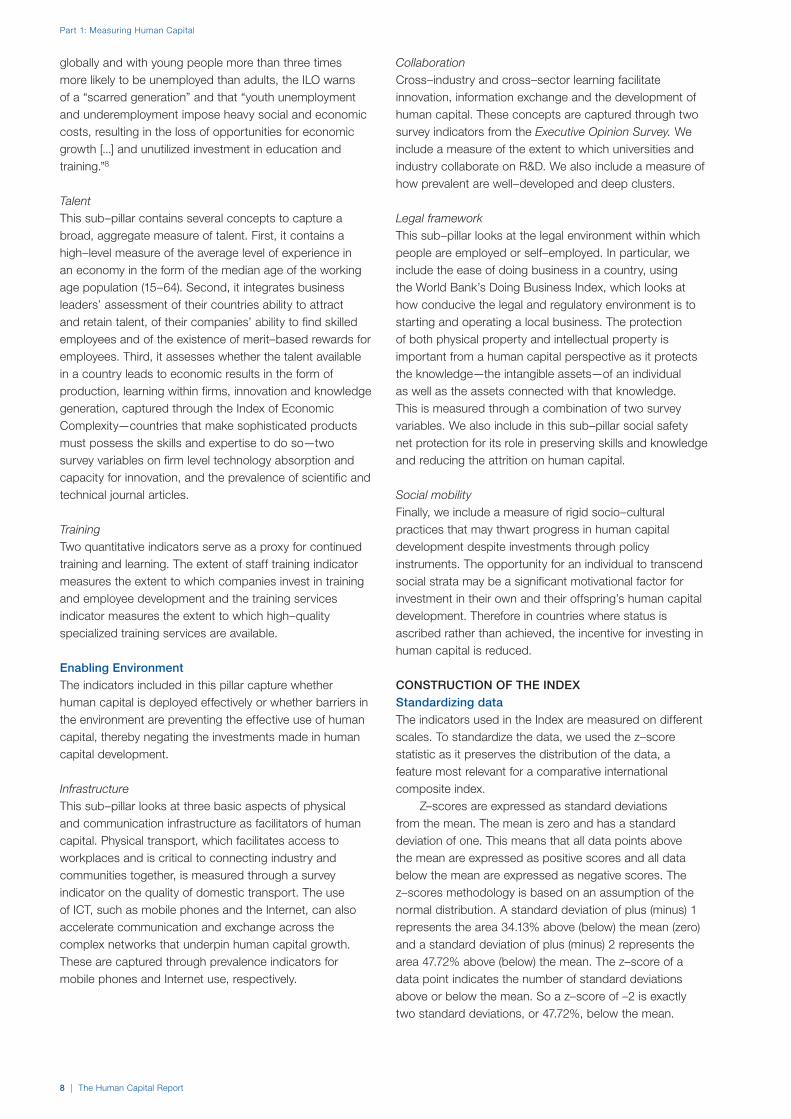
Infrastructure Mobile users 2.78
Internet users 2.78
Quality of domestic transport 2.78
Collaboration State of cluster development 2.78
Business and University R&D collaboration 2.78
Legal framework Ease of Doing Business 2.78
Social safety net protection 2.78
Intellectual property protection and property rights 2.78
Social mobility Social mobility 2.78
TOTAL PILLAR WEIGHT 25.00
Table 2d: Enabling environment subpillars and indicator weights

Part 1: Measuring Human Capital
12 | The Human Capital Report
Overall index Education Health and wellness Workforce and employment Enabling environment
Country Rank Score Rank Score Rank Score Rank Score Rank Score
Switzerland 1 1.455 4 1.313 1 0.977 1 1.736 2 1.793
Finland 2 1.406 1 1.601 9 0.844 3 1.250 1 1.926
Singapore 3 1.232 3 1.348 13 0.762 2 1.345 5 1.471
Netherlands 4 1.161 7 1.106 4 0.901 8 1.150 4 1.484
Sweden 5 1.111 14 0.977 2 0.960 6 1.154 10 1.351
Germany 6 1.109 19 0.888 8 0.877 9 1.149 3 1.522
Norway 7 1.104 15 0.970 6 0.890 5 1.182 8 1.373
United Kingdom 8 1.042 10 1.031 17 0.682 10 1.072 7 1.384
Denmark 9 1.024 18 0.891 3 0.943 12 0.932 11 1.330
Canada 10 0.987 2 1.355 20 0.548 15 0.875 17 1.168
Belgium 11 0.985 6 1.191 11 0.780 21 0.673 14 1.296
New Zealand 12 0.978 5 1.204 15 0.743 17 0.804 18 1.163
Austria 13 0.977 25 0.713 7 0.886 14 0.886 6 1.424
Iceland 14 0.957 8 1.075 5 0.900 16 0.826 20 1.026
Japan 15 0.948 28 0.628 10 0.836 11 1.027 13 1.302
United States 16 0.920 11 1.027 43 0.239 4 1.235 16 1.181
Luxembourg 17 0.881 35 0.522 16 0.704 13 0.928 9 1.372
Qatar 18 0.834 26 0.684 44 0.206 7 1.154 15 1.294
Australia 19 0.831 13 0.988 18 0.663 19 0.675 23 0.999
Ireland 20 0.824 9 1.033 25 0.516 22 0.645 19 1.103
France 21 0.746 22 0.776 14 0.744 25 0.520 24 0.943
Malaysia 22 0.644 34 0.526 39 0.301 18 0.736 22 1.014
Korea, Rep. 23 0.640 17 0.899 27 0.481 23 0.596 30 0.582
United Arab Emirates 24 0.610 29 0.626 70 –0.032 24 0.527 12 1.320
Israel 25 0.587 27 0.651 29 0.457 20 0.674 32 0.568
Barbados 26 0.581 12 1.007 42 0.245 29 0.340 27 0.730
Estonia 27 0.571 20 0.862 22 0.536 39 0.142 26 0.745
Malta 28 0.473 24 0.716 28 0.473 30 0.330 37 0.371
Spain 29 0.465 31 0.590 12 0.778 70 –0.185 28 0.679
Portugal 30 0.453 37 0.411 23 0.532 34 0.243 29 0.624
Cyprus 31 0.452 16 0.938 32 0.352 33 0.252 41 0.268
Slovenia 32 0.445 21 0.825 26 0.516 41 0.106 38 0.332
Czech Republic 33 0.387 36 0.452 36 0.310 36 0.210 31 0.576
Lithuania 34 0.360 23 0.745 41 0.252 56 –0.018 36 0.462
Costa Rica 35 0.320 39 0.382 30 0.445 28 0.378 50 0.077
Chile 36 0.305 49 0.250 38 0.306 37 0.194 35 0.471
Italy 37 0.266 40 0.378 19 0.601 75 –0.243 39 0.329
Latvia 38 0.248 30 0.615 48 0.151 54 –0.011 43 0.237
Saudi Arabia 39 0.245 55 0.098 72 –0.041 61 –0.099 21 1.023
Bahrain 40 0.232 48 0.274 64 0.011 43 0.099 33 0.544
Oman 41 0.220 62 0.032 37 0.307 78 –0.280 25 0.822
Panama 42 0.207 66 –0.006 60 0.055 31 0.301 34 0.477
China 43 0.186 58 0.069 65 0.010 26 0.516 47 0.147
Thailand 44 0.158 79 –0.242 40 0.281 27 0.482 48 0.112
Kazakhstan 45 0.124 43 0.359 69 –0.031 40 0.107 51 0.061
Croatia 46 0.099 38 0.394 24 0.526 88 –0.378 60 –0.146
Mauritius 47 0.099 50 0.234 45 0.202 64 –0.143 49 0.102
Uruguay 48 0.096 67 –0.037 21 0.543 84 –0.340 44 0.219
Poland 49 0.087 42 0.376 47 0.173 63 –0.139 57 –0.064
Sri Lanka 50 0.020 51 0.172 35 0.323 62 –0.127 70 –0.288
Russian Federation 51 0.010 41 0.377 62 0.027 66 –0.163 63 –0.201
Jordan 52 0.005 44 0.350 68 –0.015 97 –0.481 46 0.167
Indonesia 53 0.001 61 0.040 84 –0.215 32 0.262 58 –0.082
Hungary 54 0.000 33 0.530 73 –0.064 77 –0.275 62 –0.190
Greece 55 –0.011 47 0.280 34 0.331 86 –0.365 71 –0.291
Bulgaria 56 –0.048 46 0.282 33 0.333 100 –0.496 74 –0.311
Brazil 57 –0.054 88 –0.497 49 0.150 45 0.078 52 0.054
Mexico 58 –0.057 82 –0.291 56 0.074 48 0.011 53 –0.022
Kuwait 59 –0.059 80 –0.285 58 0.065 80 –0.297 40 0.281
Turkey 60 –0.065 77 –0.220 51 0.117 83 –0.337 45 0.181
Ecuador 61 –0.099 69 –0.090 76 –0.094 47 0.034 68 –0.244
Table 3: Detailed rankings
(Cont’d.)

The Human Capital Report | 13
Part 1: Measuring Human Capital
Table 3: Detailed rankings (cont’d.)
Overall index Education Health and wellness Workforce and employment Enabling environment
Country Rank Score Rank Score Rank Score Rank Score Rank Score
Argentina 62 –0.120 56 0.091 31 0.362 92 –0.408 84 –0.527
Ukraine 63 –0.124 45 0.316 55 0.078 67 –0.166 96 –0.725
Azerbaijan 64 –0.157 71 –0.153 94 –0.414 55 –0.016 55 –0.044
Macedonia, FYR 65 –0.160 52 0.165 63 0.013 115 –0.784 54 –0.033
Philippines 66 –0.161 65 0.011 96 –0.473 38 0.164 78 –0.344
Tunisia 67 –0.165 70 –0.099 46 0.173 101 –0.499 66 –0.236
Jamaica 68 –0.171 81 –0.285 50 0.126 76 –0.246 69 –0.279
Romania 69 –0.176 57 0.077 61 0.048 85 –0.364 83 –0.463
Vietnam 70 –0.202 73 –0.176 88 –0.291 57 –0.040 73 –0.302
Colombia 71 –0.202 72 –0.169 79 –0.116 73 –0.229 72 –0.296
Albania 72 –0.216 54 0.136 54 0.083 71 –0.207 105 –0.874
Armenia 73 –0.218 60 0.042 71 –0.035 113 –0.678 64 –0.201
Lebanon 74 –0.220 32 0.548 77 –0.099 96 –0.458 104 –0.870
Peru 75 –0.227 84 –0.323 82 –0.204 50 –0.003 81 –0.377
Trinidad and Tobago 76 –0.233 53 0.164 121 –1.043 53 –0.008 56 –0.047
Georgia 77 –0.258 74 –0.191 66 –0.005 102 –0.514 76 –0.321
India 78 –0.270 63 0.020 112 –0.868 49 0.005 67 –0.239
Botswana 79 –0.291 85 –0.386 86 –0.270 93 –0.416 59 –0.090
Lao PDR 80 –0.297 83 –0.320 91 –0.407 59 –0.097 80 –0.364
Kenya 81 –0.306 90 –0.503 103 –0.603 35 0.226 79 –0.347
Morocco 82 –0.336 93 –0.590 59 0.061 99 –0.485 77 –0.328
Moldova 83 –0.337 64 0.014 53 0.092 110 –0.654 102 –0.801
Guatemala 84 –0.341 105 –0.968 81 –0.196 46 0.035 65 –0.234
Serbia 85 –0.343 59 0.053 52 0.115 118 –0.945 89 –0.596
South Africa 86 –0.361 92 –0.589 98 –0.533 105 –0.588 42 0.265
Ghana 87 –0.363 91 –0.505 99 –0.533 60 –0.099 75 –0.317
Bhutan 88 –0.370 89 –0.498 83 –0.208 74 –0.231 85 –0.545
Mongolia 89 –0.400 76 –0.198 80 –0.139 106 –0.610 92 –0.651
El Salvador 90 –0.405 95 –0.612 92 –0.409 68 –0.175 82 –0.425
Suriname 91 –0.420 87 –0.423 67 –0.010 109 –0.640 90 –0.607
Kyrgyz Republic 92 –0.440 78 –0.233 75 –0.073 112 –0.673 100 –0.781
Nicaragua 93 –0.446 94 –0.594 78 –0.100 89 –0.386 94 –0.704
Iran, Islamic Rep. 94 –0.487 68 –0.051 87 –0.274 119 –1.059 88 –0.564
Dominican Republic 95 –0.499 97 –0.732 85 –0.223 91 –0.401 91 –0.641
Cambodia 96 –0.505 99 –0.839 102 –0.596 42 0.104 93 –0.688
Namibia 97 –0.539 98 –0.817 100 –0.560 108 –0.620 61 –0.160
Paraguay 98 –0.546 102 –0.906 57 0.072 94 –0.433 108 –0.916
Bolivia 99 –0.552 86 –0.409 113 –0.878 69 –0.185 97 –0.736
Honduras 100 –0.560 103 –0.947 89 –0.335 90 –0.397 87 –0.561
Venezuela 101 –0.564 75 –0.194 74 –0.068 114 –0.746 120 –1.250
Senegal 102 –0.602 112 –1.202 90 –0.404 51 –0.006 101 –0.794
Malawi 103 –0.629 101 –0.897 107 –0.723 52 –0.007 106 –0.890
Tanzania 104 –0.680 100 –0.870 117 –0.957 58 –0.087 103 –0.805
Madagascar 105 –0.725 107 –0.997 109 –0.749 44 0.084 118 –1.238
Uganda 106 –0.727 108 –1.036 118 –0.959 65 –0.147 99 –0.767
Cameroon 107 –0.728 96 –0.687 111 –0.850 79 –0.295 113 –1.082
Lesotho 108 –0.751 110 –1.084 101 –0.588 95 –0.438 107 –0.894
Côte d’Ivoire 109 –0.759 114 –1.302 95 –0.418 72 –0.208 114 –1.107
Bangladesh 110 –0.782 104 –0.959 104 –0.606 103 –0.543 110 –1.019
Egypt 111 –0.790 113 –1.206 97 –0.521 116 –0.878 86 –0.555
Pakistan 112 –0.837 111 –1.166 115 –0.920 104 –0.545 95 –0.718
Benin 113 –0.865 109 –1.044 106 –0.689 98 –0.481 119 –1.244
Nigeria 114 –0.878 116 –1.411 120 –1.034 81 –0.328 98 –0.740
Algeria 115 –0.954 106 –0.991 93 –0.413 121 –1.345 112 –1.066
Ethiopia 116 –0.961 115 –1.380 108 –0.749 111 –0.660 111 –1.056
Mozambique 117 –0.966 117 –1.474 114 –0.916 82 –0.337 115 –1.135
Mali 118 –1.034 120 –1.747 110 –0.826 107 –0.614 109 –0.949
Burkina Faso 119 –1.077 121 –1.817 116 –0.943 87 –0.374 117 –1.173
Guinea 120 –1.272 118 –1.482 119 –1.026 117 –0.911 122 –1.667
Mauritania 121 –1.297 119 –1.744 105 –0.666 122 –1.404 121 –1.373
Yemen 122 –1.395 122 –1.972 122 –1.134 120 –1.320 116 –1.153
Part 1: Measuring Human Capital
14 | The Human Capital Report
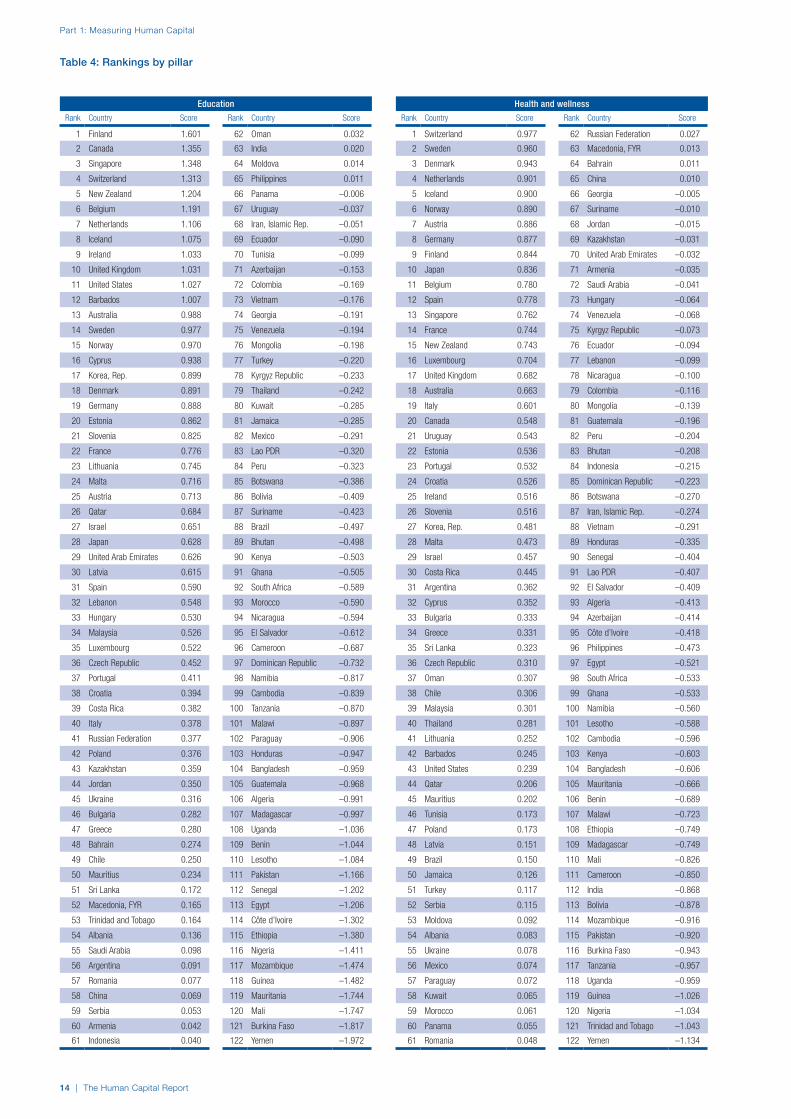
Table 4: Rankings by pillar
Rank Country Score
1 Finland 1.601
2 Canada 1.355
3 Singapore 1.348
4 Switzerland 1.313
5 New Zealand 1.204
6 Belgium 1.191
7 Netherlands 1.106
8 Iceland 1.075
9 Ireland 1.033
10 United Kingdom 1.031
11 United States 1.027
12 Barbados 1.007
13 Australia 0.988
14 Sweden 0.977
15 Norway 0.970
16 Cyprus 0.938
17 Korea, Rep. 0.899
18 Denmark 0.891
19 Germany 0.888
20 Estonia 0.862
21 Slovenia 0.825
22 France 0.776
23 Lithuania 0.745
24 Malta 0.716
25 Austria 0.713
26 Qatar 0.684
27 Israel 0.651
28 Japan 0.628
29 United Arab Emirates 0.626
30 Latvia 0.615
31 Spain 0.590
32 Lebanon 0.548
33 Hungary 0.530
34 Malaysia 0.526
35 Luxembourg 0.522
36 Czech Republic 0.452
37 Portugal 0.411
38 Croatia 0.394
39 Costa Rica 0.382
40 Italy 0.378
41 Russian Federation 0.377
42 Poland 0.376
43 Kazakhstan 0.359
44 Jordan 0.350
45 Ukraine 0.316
46 Bulgaria 0.282
47 Greece 0.280
48 Bahrain 0.274
49 Chile 0.250
50 Mauritius 0.234
51 Sri Lanka 0.172
52 Macedonia, FYR 0.165
53 Trinidad and Tobago 0.164
54 Albania 0.136
55 Saudi Arabia 0.098
56 Argentina 0.091
57 Romania 0.077
58 China 0.069
59 Serbia 0.053
60 Armenia 0.042
61 Indonesia 0.040
Rank Country Score
62 Oman 0.032
63 India 0.020
64 Moldova 0.014
65 Philippines 0.011
66 Panama –0.006
67 Uruguay –0.037
68 Iran, Islamic Rep. –0.051
69 Ecuador –0.090
70 Tunisia –0.099
71 Azerbaijan –0.153
72 Colombia –0.169
73 Vietnam –0.176
74 Georgia –0.191
75 Venezuela –0.194
76 Mongolia –0.198
77 Turkey –0.220
78 Kyrgyz Republic –0.233
79 Thailand –0.242
80 Kuwait –0.285
81 Jamaica –0.285
82 Mexico –0.291
83 Lao PDR –0.320
84 Peru –0.323
85 Botswana –0.386
86 Bolivia –0.409
87 Suriname –0.423
88 Brazil –0.497
89 Bhutan –0.498
90 Kenya –0.503
91 Ghana –0.505
92 South Africa –0.589
93 Morocco –0.590
94 Nicaragua –0.594
95 El Salvador –0.612
96 Cameroon –0.687
97 Dominican Republic –0.732
98 Namibia –0.817
99 Cambodia –0.839
100 Tanzania –0.870
101 Malawi –0.897
102 Paraguay –0.906
103 Honduras –0.947
104 Bangladesh –0.959
105 Guatemala –0.968
106 Algeria –0.991
107 Madagascar –0.997
108 Uganda –1.036
109 Benin –1.044
110 Lesotho –1.084
111 Pakistan –1.166
112 Senegal –1.202
113 Egypt –1.206
114 Côte d’Ivoire –1.302
115 Ethiopia –1.380
116 Nigeria –1.411
117 Mozambique –1.474
118 Guinea –1.482
119 Mauritania –1.744
120 Mali –1.747
121 Burkina Faso –1.817
122 Yemen –1.972
Rank Country Score
1 Switzerland 0.977
2 Sweden 0.960
3 Denmark 0.943
4 Netherlands 0.901
5 Iceland 0.900
6 Norway 0.890
7 Austria 0.886
8 Germany 0.877
9 Finland 0.844
10 Japan 0.836
11 Belgium 0.780
12 Spain 0.778
13 Singapore 0.762
14 France 0.744
15 New Zealand 0.743
16 Luxembourg 0.704
17 United Kingdom 0.682
18 Australia 0.663
19 Italy 0.601
20 Canada 0.548
21 Uruguay 0.543
22 Estonia 0.536
23 Portugal 0.532
24 Croatia 0.526
25 Ireland 0.516
26 Slovenia 0.516
27 Korea, Rep. 0.481
28 Malta 0.473
29 Israel 0.457
30 Costa Rica 0.445
31 Argentina 0.362
32 Cyprus 0.352
33 Bulgaria 0.333
34 Greece 0.331
35 Sri Lanka 0.323
36 Czech Republic 0.310
37 Oman 0.307
38 Chile 0.306
39 Malaysia 0.301
40 Thailand 0.281
41 Lithuania 0.252
42 Barbados 0.245
43 United States 0.239
44 Qatar 0.206
45 Mauritius 0.202
46 Tunisia 0.173
47 Poland 0.173
48 Latvia 0.151
49 Brazil 0.150
50 Jamaica 0.126
51 Turkey 0.117
52 Serbia 0.115
53 Moldova 0.092
54 Albania 0.083
55 Ukraine 0.078
56 Mexico 0.074
57 Paraguay 0.072
58 Kuwait 0.065
59 Morocco 0.061
60 Panama 0.055
61 Romania 0.048
Rank Country Score
62 Russian Federation 0.027
63 Macedonia, FYR 0.013
64 Bahrain 0.011
65 China 0.010
66 Georgia –0.005
67 Suriname –0.010
68 Jordan –0.015
69 Kazakhstan –0.031
70 United Arab Emirates –0.032
71 Armenia –0.035
72 Saudi Arabia –0.041
73 Hungary –0.064
74 Venezuela –0.068
75 Kyrgyz Republic –0.073
76 Ecuador –0.094
77 Lebanon –0.099
78 Nicaragua –0.100
79 Colombia –0.116
80 Mongolia –0.139
81 Guatemala –0.196
82 Peru –0.204
83 Bhutan –0.208
84 Indonesia –0.215
85 Dominican Republic –0.223
86 Botswana –0.270
87 Iran, Islamic Rep. –0.274
88 Vietnam –0.291
89 Honduras –0.335
90 Senegal –0.404
91 Lao PDR –0.407
92 El Salvador –0.409
93 Algeria –0.413
94 Azerbaijan –0.414
95 Côte d’Ivoire –0.418
96 Philippines –0.473
97 Egypt –0.521
98 South Africa –0.533
99 Ghana –0.533
100 Namibia –0.560
101 Lesotho –0.588
102 Cambodia –0.596
103 Kenya –0.603
104 Bangladesh –0.606
105 Mauritania –0.666
106 Benin –0.689
107 Malawi –0.723
108 Ethiopia –0.749
109 Madagascar –0.749
110 Mali –0.826
111 Cameroon –0.850
112 India –0.868
113 Bolivia –0.878
114 Mozambique –0.916
115 Pakistan –0.920
116 Burkina Faso –0.943
117 Tanzania –0.957
118 Uganda –0.959
119 Guinea –1.026
120 Nigeria –1.034
121 Trinidad and Tobago –1.043
122 Yemen –1.134
Education Health and wellness
The Human Capital Report | 15
Part 1: Measuring Human Capital
Rank Country Score
1 Switzerland 1.736
2 Singapore 1.345
3 Finland 1.250
4 United States 1.235
5 Norway 1.182
6 Sweden 1.154
7 Qatar 1.154
8 Netherlands 1.150
9 Germany 1.149
10 United Kingdom 1.072
11 Japan 1.027
12 Denmark 0.932
13 Luxembourg 0.928
14 Austria 0.886
15 Canada 0.875
16 Iceland 0.826
17 New Zealand 0.804
18 Malaysia 0.736
19 Australia 0.675
20 Israel 0.674
21 Belgium 0.673
22 Ireland 0.645
23 Korea, Rep. 0.596
24 United Arab Emirates 0.527
25 France 0.520
26 China 0.516
27 Thailand 0.482
28 Costa Rica 0.378
29 Barbados 0.340
30 Malta 0.330
31 Panama 0.301
32 Indonesia 0.262
33 Cyprus 0.252
34 Portugal 0.243
35 Kenya 0.226
36 Czech Republic 0.210
37 Chile 0.194
38 Philippines 0.164
39 Estonia 0.142
40 Kazakhstan 0.107
41 Slovenia 0.106
42 Cambodia 0.104
43 Bahrain 0.099
44 Madagascar 0.084
45 Brazil 0.078
46 Guatemala 0.035
47 Ecuador 0.034
48 Mexico 0.011
49 India 0.005
50 Peru –0.003
51 Senegal –0.006
52 Malawi –0.007
53 Trinidad and Tobago –0.008
54 Latvia –0.011
55 Azerbaijan –0.016
56 Lithuania –0.018
57 Vietnam –0.040
58 Tanzania –0.087
59 Lao PDR –0.097
60 Ghana –0.099
61 Saudi Arabia –0.099
Rank Country Score
62 Sri Lanka –0.127
63 Poland –0.139
64 Mauritius –0.143
65 Uganda –0.147
66 Russian Federation –0.163
67 Ukraine –0.166
68 El Salvador –0.175
69 Bolivia –0.185
70 Spain –0.185
71 Albania –0.207
72 Côte d’Ivoire –0.208
73 Colombia –0.229
74 Bhutan –0.231
75 Italy –0.243
76 Jamaica –0.246
77 Hungary –0.275
78 Oman –0.280
79 Cameroon –0.295
80 Kuwait –0.297
81 Nigeria –0.328
82 Mozambique –0.337
83 Turkey –0.337
84 Uruguay –0.340
85 Romania –0.364
86 Greece –0.365
87 Burkina Faso –0.374
88 Croatia –0.378
89 Nicaragua –0.386
90 Honduras –0.397
91 Dominican Republic –0.401
92 Argentina –0.408
93 Botswana –0.416
94 Paraguay –0.433
95 Lesotho –0.438
96 Lebanon –0.458
97 Jordan –0.481
98 Benin –0.481
99 Morocco –0.485
100 Bulgaria –0.496
101 Tunisia –0.499
102 Georgia –0.514
103 Bangladesh –0.543
104 Pakistan –0.545
105 South Africa –0.588
106 Mongolia –0.610
107 Mali –0.614
108 Namibia –0.620
109 Suriname –0.640
110 Moldova –0.654
111 Ethiopia –0.660
112 Kyrgyz Republic –0.673
113 Armenia –0.678
114 Venezuela –0.746
115 Macedonia, FYR –0.784
116 Egypt –0.878
117 Guinea –0.911
118 Serbia –0.945
119 Iran, Islamic Rep. –1.059
120 Yemen –1.320
121 Algeria –1.345
122 Mauritania –1.404
Rank Country Score
1 Finland 1.926
2 Switzerland 1.793
3 Germany 1.522
4 Netherlands 1.484
5 Singapore 1.471
6 Austria 1.424
7 United Kingdom 1.384
8 Norway 1.373
9 Luxembourg 1.372
10 Sweden 1.351
11 Denmark 1.330
12 United Arab Emirates 1.320
13 Japan 1.302
14 Belgium 1.296
15 Qatar 1.294
16 United States 1.181
17 Canada 1.168
18 New Zealand 1.163
19 Ireland 1.103
20 Iceland 1.026
21 Saudi Arabia 1.023
22 Malaysia 1.014
23 Australia 0.999
24 France 0.943
25 Oman 0.822
26 Estonia 0.745
27 Barbados 0.730
28 Spain 0.679
29 Portugal 0.624
30 Korea, Rep. 0.582
31 Czech Republic 0.576
32 Israel 0.568
33 Bahrain 0.544
34 Panama 0.477
35 Chile 0.471
36 Lithuania 0.462
37 Malta 0.371
38 Slovenia 0.332
39 Italy 0.329
40 Kuwait 0.281
41 Cyprus 0.268
42 South Africa 0.265
43 Latvia 0.237
44 Uruguay 0.219
45 Turkey 0.181
46 Jordan 0.167
47 China 0.147
48 Thailand 0.112
49 Mauritius 0.102
50 Costa Rica 0.077
51 Kazakhstan 0.061
52 Brazil 0.054
53 Mexico –0.022
54 Macedonia, FYR –0.033
55 Azerbaijan –0.044
56 Trinidad and Tobago –0.047
57 Poland –0.064
58 Indonesia –0.082
59 Botswana –0.090
60 Croatia –0.146
61 Namibia –0.160
Rank Country Score
62 Hungary –0.190
63 Russian Federation –0.201
64 Armenia –0.201
65 Guatemala –0.234
66 Tunisia –0.236
67 India –0.239
68 Ecuador –0.244
69 Jamaica –0.279
70 Sri Lanka –0.288
71 Greece –0.291
72 Colombia –0.296
73 Vietnam –0.302
74 Bulgaria –0.311
75 Ghana –0.317
76 Georgia –0.321
77 Morocco –0.328
78 Philippines –0.344
79 Kenya –0.347
80 Lao PDR –0.364
81 Peru –0.377
82 El Salvador –0.425
83 Romania –0.463
84 Argentina –0.527
85 Bhutan –0.545
86 Egypt –0.555
87 Honduras –0.561
88 Iran, Islamic Rep. –0.564
89 Serbia –0.596
90 Suriname –0.607
91 Dominican Republic –0.641
92 Mongolia –0.651
93 Cambodia –0.688
94 Nicaragua –0.704
95 Pakistan –0.718
96 Ukraine –0.725
97 Bolivia –0.736
98 Nigeria –0.740
99 Uganda –0.767
100 Kyrgyz Republic –0.781
101 Senegal –0.794
102 Moldova –0.801
103 Tanzania –0.805
104 Lebanon –0.870
105 Albania –0.874
106 Malawi –0.890
107 Lesotho –0.894
108 Paraguay –0.916
109 Mali –0.949
110 Bangladesh –1.019
111 Ethiopia –1.056
112 Algeria –1.066
113 Cameroon –1.082
114 Côte d’Ivoire –1.107
115 Mozambique –1.135
116 Yemen –1.153
117 Burkina Faso –1.173
118 Madagascar –1.238
119 Benin –1.244
120 Venezuela –1.250
121 Mauritania –1.373
122 Guinea –1.667
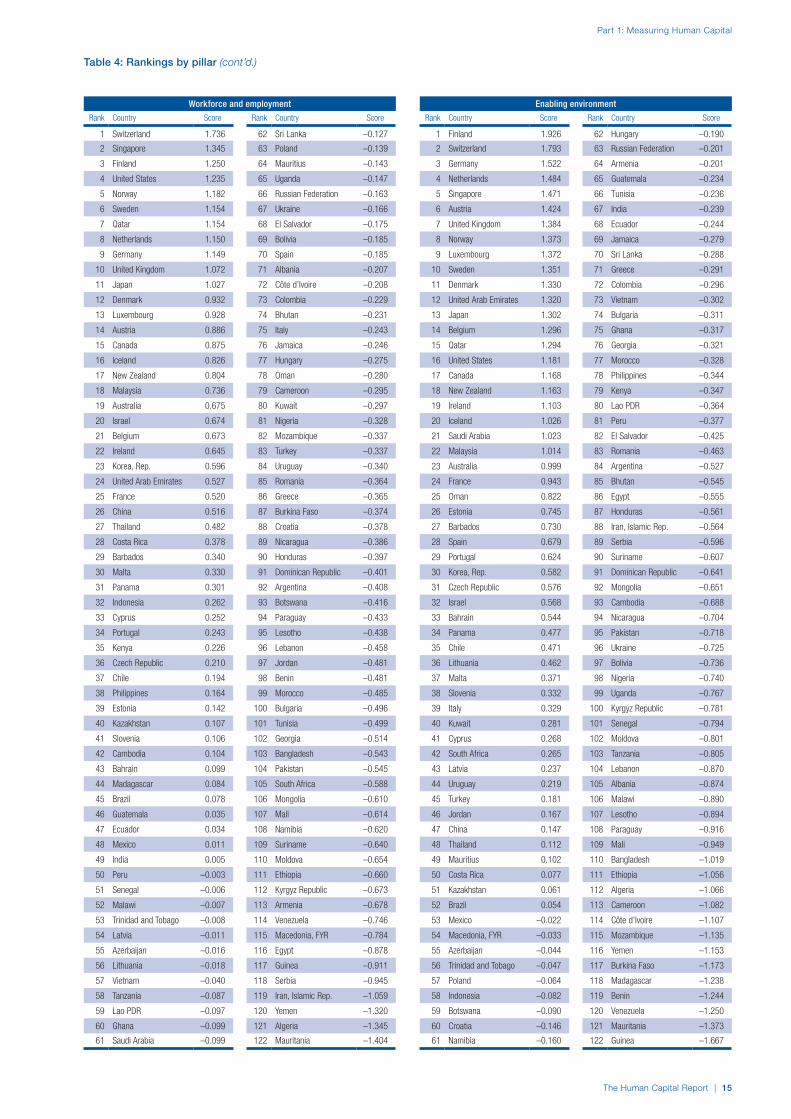
Table 4: Rankings by pillar (cont’d.)
Workforce and employment Enabling environment

Part 1: Measuring Human Capital
16 | The Human Capital Report
Table 5: Rankings by region
Asia and the Pacific
Rank Country Score
3 Singapore 1.232
12 New Zealand 0.978
15 Japan 0.948
19 Australia 0.831
22 Malaysia 0.644
23 Korea, Rep. 0.640
43 China 0.186
44 Thailand 0.158
50 Sri Lanka 0.020
53 Indonesia 0.001
66 Philippines –0.161
70 Vietnam –0.202
78 India –0.270
80 Lao PDR –0.297
88 Bhutan –0.370
89 Mongolia –0.400
94 Iran, Islamic Rep. –0.487
96 Cambodia –0.505
110 Bangladesh –0.782
112 Pakistan –0.837
Europe and Central Asia
Rank Country Score
1 Switzerland 1.455
2 Finland 1.406
4 Netherlands 1.161
5 Sweden 1.111
6 Germany 1.109
7 Norway 1.104
8 United Kingdom 1.042
9 Denmark 1.024
11 Belgium 0.985
13 Austria 0.977
14 Iceland 0.957
17 Luxembourg 0.881
20 Ireland 0.824
21 France 0.746
27 Estonia 0.571
28 Malta 0.473
29 Spain 0.465
30 Portugal 0.453
31 Cyprus 0.452
32 Slovenia 0.445
33 Czech Republic 0.387
34 Lithuania 0.360
37 Italy 0.266
38 Latvia 0.248
45 Kazakhstan 0.124
46 Croatia 0.099
49 Poland 0.087
51 Russian Federation 0.010
54 Hungary 0.000
55 Greece –0.011
56 Bulgaria –0.048
60 Turkey –0.065
63 Ukraine –0.124
64 Azerbaijan –0.157
65 Macedonia, FYR –0.160
69 Romania –0.176
72 Albania –0.216
73 Armenia –0.218
77 Georgia –0.258
83 Moldova –0.337
85 Serbia –0.343
92 Kyrgyz Republic –0.440
Latin America and the Caribbean
Rank Country Score
26 Barbados 0.581
35 Costa Rica 0.320
36 Chile 0.305
42 Panama 0.207
48 Uruguay 0.096
57 Brazil –0.054
58 Mexico –0.057
61 Ecuador –0.099
62 Argentina –0.120
68 Jamaica –0.171
71 Colombia –0.202
75 Peru –0.227
76 Trinidad and Tobago –0.233
84 Guatemala –0.341
90 El Salvador –0.405
91 Suriname –0.420
93 Nicaragua –0.446
95 Dominican Republic –0.499
98 Paraguay –0.546
99 Bolivia –0.552
100 Honduras –0.560
101 Venezuela –0.564
Index include gender gap indicators for education and the workforce, the country’s ability to attract talent, and reported depression in the Well–being sub–pillar.
Australia (19) and Malaysia (22) have almost identical scores on the Workforce and Employment and Enabling Environment pillars, but their performance within the pillars varies. Australia ranks poorly on its labour force participation of those over the age of 65, whereas Malaysia, the highest of the region’s upper–middle income countries, ranks very low for the Economic participation gender gap indicator. Malaysia performs well on most of the qualitative talent and training indicators in the Workforce and Employment pillar. Australia performs well
on the majority of indicators in Enabling Environment, in particular those concerning the legal framework. Australia also performs well on the Educational attainment of the population over 25 indicator.
The Republic of Korea (23) has its strongest performance on the Education pillar, with a rank of 17. Korea’s enrolment rates for tertiary education take the top spot overall and the educational attainment of the adult population has consistently strong ranks. Despite good scores across the qualitative indicators, overall Quality of the education system was particularly low at 52nd position. Korea’s scores on the Enabling Environment pillar are pulled down by low scores on the Social mobility

The Human Capital Report | 17
Part 1: Measuring Human Capital
Table 5: Rankings by region (cont’d.)
Middle East and North Africa
Rank Country Score
18 Qatar 0.834
24 United Arab Emirates 0.610
25 Israel 0.587
39 Saudi Arabia 0.245
40 Bahrain 0.232
41 Oman 0.220
52 Jordan 0.005
59 Kuwait –0.059
67 Tunisia –0.165
74 Lebanon –0.220
82 Morocco –0.336
111 Egypt –0.790
115 Algeria –0.954
121 Mauritania –1.297
122 Yemen –1.395
North America
Rank Country Score
10 Canada 0.987
16 United States 0.920
Sub–Saharan Africa
Rank Country Score
47 Mauritius 0.099
79 Botswana –0.291
81 Kenya –0.306
86 South Africa –0.361
87 Ghana –0.363
97 Namibia –0.539
102 Senegal –0.602
103 Malawi –0.629
104 Tanzania –0.680
105 Madagascar –0.725
106 Uganda –0.727
107 Cameroon –0.728
108 Lesotho –0.751
109 Côte d’Ivoire –0.759
113 Benin –0.865
114 Nigeria –0.878
116 Ethiopia –0.961
117 Mozambique –0.966
118 Mali –1.034
119 Burkina Faso –1.077
120 Guinea –1.272
and Social safety net protection indicators. Korea also has a notably low score on the Business impact of non–communicable diseases indicator, in the Health and Wellness pillar.
China’s (43) positions across the four pillars vary greatly from the 26th rank on the Workforce and Employment pillar to 65th on the Health and Wellness pillar, the latter due in part to weak scores across the Health and Services sub–pillars. China’s overall scores are boosted by good performance on the Talent sub–pillar of indicators, such as the Attraction and Retention of talent. The country’s highest scores are from the Labour force participation of the 15 to 64 age group and Pay relating to productivity measures indicators.
Thailand (44) also has a hugely varied distribution of rankings across the pillars, ranging from 27th on Workforce and Employment to 79th in Education. Thailand ranks 94th on the Enrolment in primary school indicator, and the majority of the education indicators are in the bottom half of the sample countries. Thailand’s very low levels of unemployment yield two top–five rankings for these indicators. Good performances on the qualitative talent indicators are also strong points.
Sri Lanka’s (50) scores are boosted by good performances on the Health and Wellness pillar, but it performs poorly on the labour force participation indicators (103). India (78) performs well on the Workforce and Employment pillar (49) while holding only 112th position for Health and Wellness. India’s high prevalence of stunting and wasting, low scores in sanitation and hygiene and
second–to–bottom rank on the health gender gap indicator are some of the variables driving down the scores for India. India’s Collaboration sub–pillar scores boost its ranking on the Enabling Environment pillar.
Indonesia’s (53) ranks vary between 32nd on the Workforce and Employment pillar to 84th on the Health and Wellness pillar. A relatively low unemployment rate and good labour force participation of the over 65s, as well as a good performance on some of the qualitative talent indicators, support Indonesia’s strong overall performance on the Workforce and Employment pillar. Paradoxically, the country’s strongest performance overall is on the Well–being sub–pillar, with top and second rankings for the Depression and Stress indicators respectively.
The Philippines (66) follows a similar profile to Indonesia with a 38th ranking on the Workforce and Employment pillar and 96th on Health and Wellness. The Philippines has top scores for the education and health gender gap indicators as well as a strong 15th rank for economic participation. Ranks below 100 on Well–being sub–pillar indicators pull down the aggregate Health and Wellness scores.
Vietnam holds 70th position and Lao PDR holds 80th position. Bhutan’s (88) strong labour force participation and in particular low unemployment rates drive strong scores on the Workforce and Employment pillar. However, weak scores in technology absorption and training pull down the overall ranking to 74th spot.
Mongolia’s (89) lowest performance is on the Workforce and Employment pillar, where the country
Part 1: Measuring Human Capital
18 | The Human Capital Report
Low income
Rank Country Score
81 Kenya –0.306
92 Kyrgyz Republic –0.440
96 Cambodia –0.505
103 Malawi –0.629
104 Tanzania –0.680
105 Madagascar –0.725
106 Uganda –0.727
110 Bangladesh –0.782
113 Benin –0.865
116 Ethiopia –0.961
117 Mozambique –0.966
118 Mali –1.034
119 Burkina Faso –1.077
120 Guinea –1.272
Lower–middle income
Rank Country Score
50 Sri Lanka 0.020
53 Indonesia 0.001
63 Ukraine –0.124
66 Philippines –0.161
70 Vietnam –0.202
73 Armenia –0.218
77 Georgia –0.258
78 India –0.270
80 Lao PDR –0.297
82 Morocco –0.336
83 Moldova –0.337
84 Guatemala –0.341
87 Ghana –0.363
88 Bhutan –0.370
89 Mongolia –0.400
90 El Salvador –0.405
93 Nicaragua –0.446
98 Paraguay –0.546
99 Bolivia –0.552
100 Honduras –0.560
102 Senegal –0.602
107 Cameroon –0.728
108 Lesotho –0.751
109 Côte d’Ivoire –0.759
111 Egypt –0.790
112 Pakistan –0.837
114 Nigeria –0.878
121 Mauritania –1.297
122 Yemen –1.395
Upper–middle income
Rank Country Score
22 Malaysia 0.644
35 Costa Rica 0.320
42 Panama 0.207
43 China 0.186
44 Thailand 0.158
45 Kazakhstan 0.124
47 Mauritius 0.099
52 Jordan 0.005
54 Hungary 0.000
56 Bulgaria –0.048
57 Brazil –0.054
58 Mexico –0.057
60 Turkey –0.065
61 Ecuador –0.099
62 Argentina –0.120
64 Azerbaijan –0.157
65 Macedonia, FYR –0.160
67 Tunisia –0.165
68 Jamaica –0.171
69 Romania –0.176
71 Colombia –0.202
72 Albania –0.216
74 Lebanon –0.220
75 Peru –0.227
79 Botswana –0.291
85 Serbia –0.343
86 South Africa –0.361
91 Suriname –0.420
94 Iran, Islamic Rep. –0.487
95 Dominican Republic –0.499
97 Namibia –0.539
101 Venezuela –0.564
115 Algeria –0.954
High income
Rank Country Score
1 Switzerland 1.455
2 Finland 1.406
3 Singapore 1.232
4 Netherlands 1.161
5 Sweden 1.111
6 Germany 1.109
7 Norway 1.104
8 United Kingdom 1.042
9 Denmark 1.024
10 Canada 0.987
11 Belgium 0.985
12 New Zealand 0.978
13 Austria 0.977
14 Iceland 0.957
15 Japan 0.948
16 United States 0.920
17 Luxembourg 0.881
18 Qatar 0.834
19 Australia 0.831
20 Ireland 0.824
21 France 0.746
23 Korea, Rep. 0.640
24 United Arab Emirates 0.610
25 Israel 0.587
26 Barbados 0.581
27 Estonia 0.571
28 Malta 0.473
29 Spain 0.465
30 Portugal 0.453
31 Cyprus 0.452
32 Slovenia 0.445
33 Czech Republic 0.387
34 Lithuania 0.360
36 Chile 0.305
37 Italy 0.266
38 Latvia 0.248
39 Saudi Arabia 0.245
40 Bahrain 0.232
41 Oman 0.220
46 Croatia 0.099
48 Uruguay 0.096
49 Poland 0.087
51 Russian Federation 0.010
55 Greece –0.011
59 Kuwait –0.059
76 Trinidad and Tobago –0.233
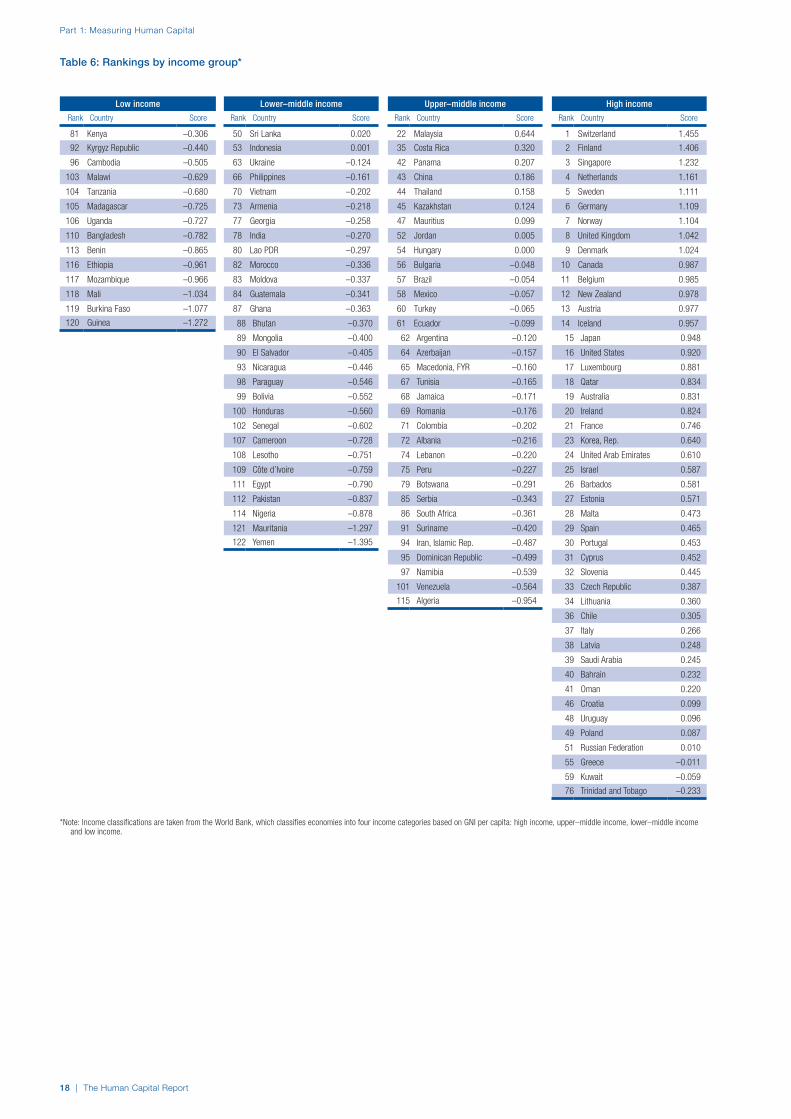
Table 6: Rankings by income group*
*Note: Income classifications are taken from the World Bank, which classifies economies into four income categories based on GNI per capita: high income, upper–middle income, lower–middle income and low income.
The Human Capital Report | 19
Part 1: Measuring Human Capital
Overall index Education Health and wellness Workforce and employment Enabling environment
Country Rank Score Rank Score Rank Score Rank Score Rank Score
BRICS –0.169 –0.173 –0.306 –0.167 –0.030
China 43 0.186 58 0.069 65 0.010 26 0.516 47 0.147
Russian Federation 51 0.010 41 0.377 62 0.027 66 –0.163 63 –0.201
Brazil 57 –0.054 88 –0.497 49 0.150 45 0.078 52 0.054
India 78 –0.270 63 0.020 112 –0.868 49 0.005 67 –0.239
South Africa 86 –0.361 92 –0.589 98 –0.533 105 –0.588 42 0.265
OECD 0.713 0.766 0.599 0.586 0.899
Switzerland 1 1.455 4 1.313 1 0.977 1 1.736 2 1.793
Finland 2 1.406 1 1.601 9 0.844 3 1.250 1 1.926
Netherlands 4 1.161 7 1.106 4 0.901 8 1.150 4 1.484
Sweden 5 1.111 14 0.977 2 0.960 6 1.154 10 1.351
Germany 6 1.109 19 0.888 8 0.877 9 1.149 3 1.522
Norway 7 1.104 15 0.970 6 0.890 5 1.182 8 1.373
United Kingdom 8 1.042 10 1.031 17 0.682 10 1.072 7 1.384
Denmark 9 1.024 18 0.891 3 0.943 12 0.932 11 1.330
Canada 10 0.987 2 1.355 20 0.548 15 0.875 17 1.168
Belgium 11 0.985 6 1.191 11 0.780 21 0.673 14 1.296
New Zealand 12 0.978 5 1.204 15 0.743 17 0.804 18 1.163
Austria 13 0.977 25 0.713 7 0.886 14 0.886 6 1.424
Iceland 14 0.957 8 1.075 5 0.900 16 0.826 20 1.026
Japan 15 0.948 28 0.628 10 0.836 11 1.027 13 1.302
United States 16 0.920 11 1.027 43 0.239 4 1.235 16 1.181
Luxembourg 17 0.881 35 0.522 16 0.704 13 0.928 9 1.372
Australia 19 0.831 13 0.988 18 0.663 19 0.675 23 0.999
Ireland 20 0.824 9 1.033 25 0.516 22 0.645 19 1.103
France 21 0.746 22 0.776 14 0.744 25 0.520 24 0.943
Korea, Rep. 23 0.640 17 0.899 27 0.481 23 0.596 30 0.582
Israel 25 0.587 27 0.651 29 0.457 20 0.674 32 0.568
Estonia 27 0.571 20 0.862 22 0.536 39 0.142 26 0.745
Spain 29 0.465 31 0.590 12 0.778 70 –0.185 28 0.679
Portugal 30 0.453 37 0.411 23 0.532 34 0.243 29 0.624
Slovenia 32 0.445 21 0.825 26 0.516 41 0.106 38 0.332
Czech Republic 33 0.387 36 0.452 36 0.310 36 0.210 31 0.576
Chile 36 0.305 49 0.250 38 0.306 37 0.194 35 0.471
Italy 37 0.266 40 0.378 19 0.601 75 –0.243 39 0.329
Poland 49 0.087 42 0.376 47 0.173 63 –0.139 57 –0.064
Hungary 54 0.000 33 0.530 73 –0.064 77 –0.275 62 –0.190
Greece 55 –0.011 47 0.280 34 0.331 86 –0.365 71 –0.291
Mexico 58 –0.057 82 –0.291 56 0.074 48 0.011 53 –0.022
Turkey 60 –0.065 77 –0.220 51 0.117 83 –0.337 45 0.181
ASEAN 0.109 0.043 –0.080 0.369 0.102
Singapore 3 1.232 3 1.348 13 0.762 2 1.345 5 1.471
Malaysia 22 0.644 34 0.526 39 0.301 18 0.736 22 1.014
Thailand 44 0.158 79 –0.242 40 0.281 27 0.482 48 0.112
Indonesia 53 0.001 61 0.040 84 –0.215 32 0.262 58 –0.082
Philippines 66 –0.161 65 0.011 96 –0.473 38 0.164 78 –0.344
Vietnam 70 –0.202 73 –0.176 88 –0.291 57 –0.040 73 –0.302
Lao PDR 80 –0.297 83 –0.320 91 –0.407 59 –0.097 80 –0.364
Cambodia 96 –0.505 99 –0.839 102 –0.596 42 0.104 93 –0.688
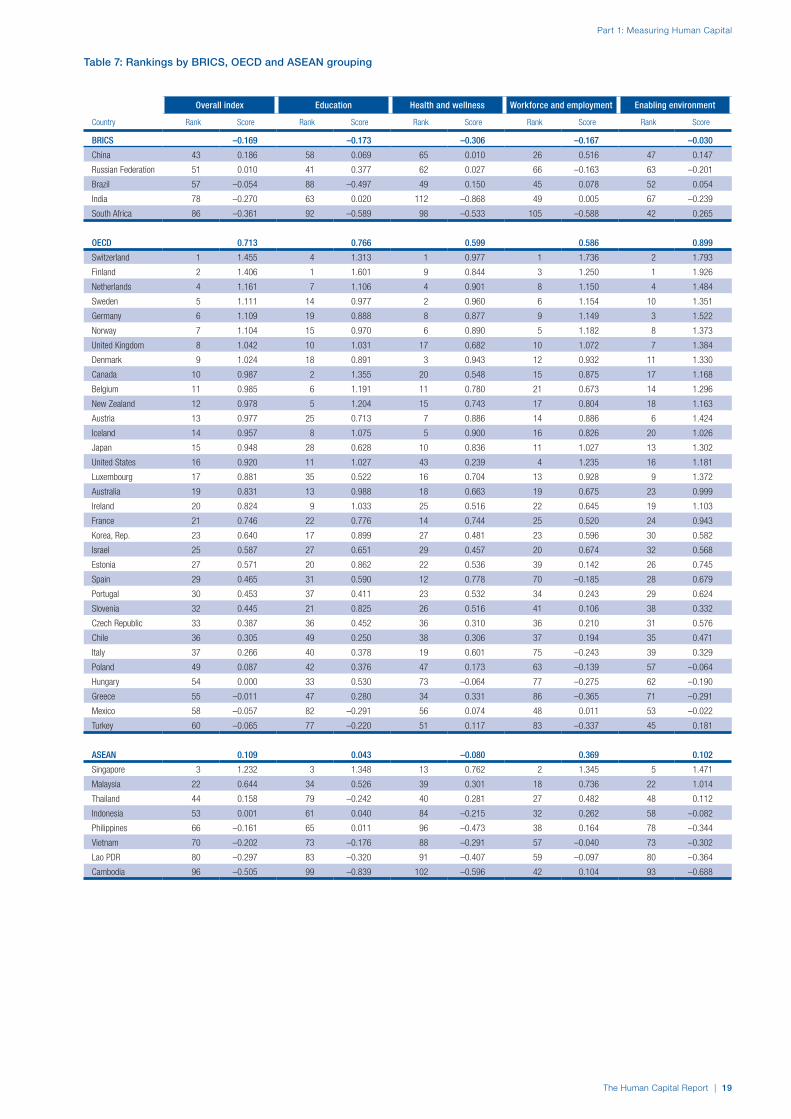
Table 7: Rankings by BRICS, OECD and ASEAN grouping
Part 1: Measuring Human Capital
20 | The Human Capital Report
scores 106th. Although Mongolia takes the top spot for the Economic participation gender gap indicator, Mongolia is in last position for the Training services indicator. Mongolia shows a stronger performance on the Education pillar where its primary and tertiary enrolment rates are both in the top 40 rankings.
Iran (94) is the lowest of the upper–middle income economies represented in the Asia and Pacific region. Iran has a wide distribution of ranks across the four pillars, from 68th for Education to 119th for Workforce and Employment. Strong enrolment rates push up Iran’s scores for the former pillar, whereas bottom five positions for the Economic participation gender gap and Labour force participation (15–64) indicators contribute to driving down the aggregate scores for the latter pillar. Cambodia (96) is followed by Bangladesh (110) and Pakistan (112).
EUROPE AND CENTRAL ASIAEurope and Central Asia holds the second highest overall rank of the six regions in the Index, with a top performance on Health and Wellness and second position on Enabling Environment. Two–thirds of the region’s countries are high–income economies that dominate the top half of the global rankings across all categories. With eight of the top ten in the region and thirteen in the top 20, the Europe and Central Asia region has only fifteen of its countries outside the top 50.
Switzerland (1) and Finland (2) hold the highest ranks on the Index. In addition to investment in human capital
across health, education and employment, both countries are able to leverage strong returns through creating an efficient, effective ecosystem or enabling environment. Switzerland and Finland hold the top four spots across all pillars with the exception of Finland on the Health and Wellness pillar where Finland ranks ninth place.
The Netherlands (4), Sweden (5), Germany (6) and Norway (7) follow next. Sweden, in tenth spot, trails Germany (third) on the Enabling Environment pillar, mainly due to Germany’s more advanced scores on the Cluster development and Internal infrastructure indicators. However Sweden’s second position globally for Health and Wellness, due to low impact of NCDs, nudges the country ahead in the overall rankings. Norway’s Education and Workforce and Employment pillars are similar to Denmark’s, however Norway fares better than its neighbour on the unemployment indicators.
The UK (8) leads Denmark (9) on all but the Health and Wellness pillar. The UK’s Health sub–pillar scores are held back due to obesity and well–being indicators. Belgium (11), Austria (13) and Iceland (14) have good overall performances on the Health and Wellness pillar, due to excellent healthcare systems and, in particular for Iceland, high scores on the communicable and non–communicable disease indicators. Belgium and Iceland both post very strong scores in Education, which supports their overall rankings. Austria’s 25th position on the Education pillar is the weakest performance of the three countries on any of the pillars, but its ICT and physical infrastructure ensures
–1.0
–0.8
–0.6
–0.4
–0.2
0.0
0.2
0.4
0.6
0.8
1.0
Sub-Saharan AfricaMiddle East and North Africa
Latin America and the Caribbean
Asia and the Pacific
Europe and Central Asia
North America
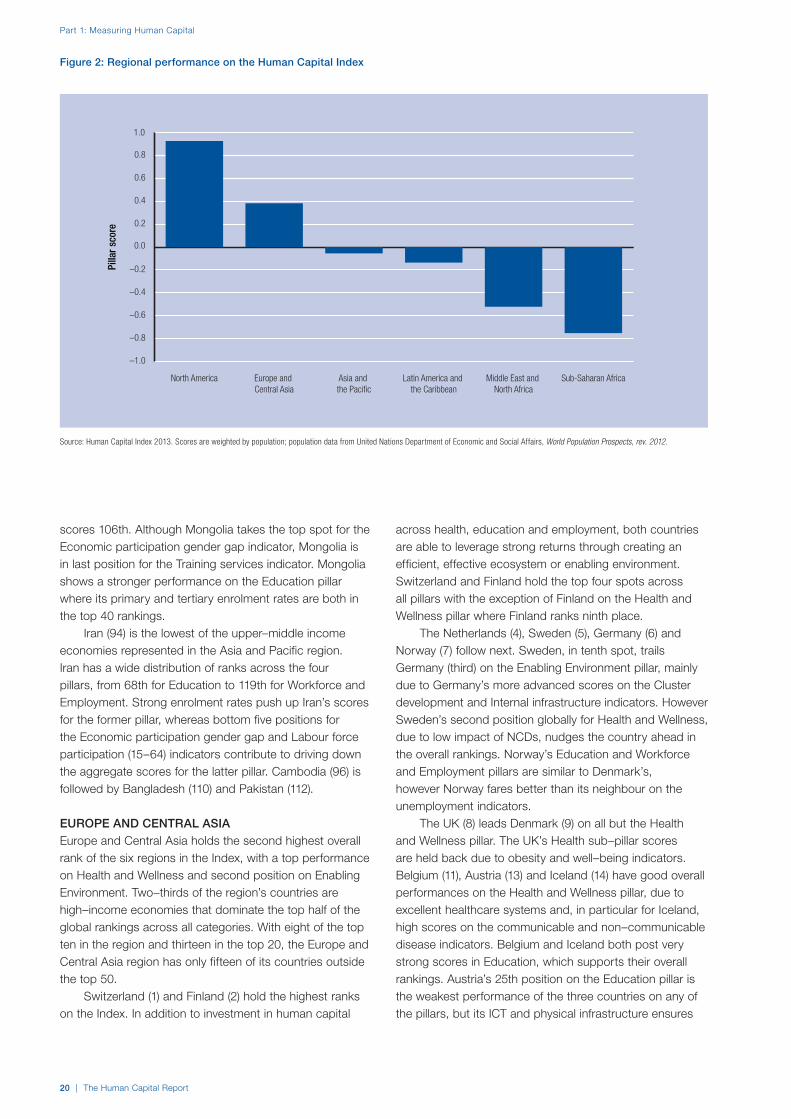
Figure 2: Regional performance on the Human Capital Index
Source: Human Capital Index 2013. Scores are weighted by population; population data from United Nations Department of Economic and Social Affairs, World Population Prospects, rev. 2012.
Pilla
r sco
re
The Human Capital Report | 21
Part 1: Measuring Human Capital
a strong overall ranking on the Enabling Environment pillar at sixth spot, ahead of Belgium in the 14th and Iceland in 20th positions.
Luxembourg (17) ranges from ninth position on the Enabling Environment pillar, due to strengths in Legal infrastructure and Social mobility, to 35th on Education, where enrolment rates and qualitative measures of education have a lower performance. Ireland’s (20) strengths lie in Education, in contrast to France’s (21) performance, which places it 13 positions below Ireland on this pillar.
Estonia (27) has a consistent performance across all pillars except for Workforce and Employment, which has the country in 39th spot. Estonia has excellent scores on the Tertiary attainment and Internet access in schools indicators, helping to drive up the overall results for this pillar, although high rates of unemployment are a weak factor. Malta’s (28) strength is on the Education pillar, while Infrastructure and Collaboration indicators weaken performance on the Enabling Environment pillar.
Spain (29) and Portugal (30) share similar ranks for Enabling Environment, but within this pillar they demonstrate different strengths and weaknesses. Spain performs very well on the Health and Wellness pillar with a 12th spot ranking; however a very poor 70th rank on the Workforce and Employment pillar due to low labour force participation and high unemployment brings the overall scores down significantly. Spain’s participation and access measures for education are strong but qualitative
measures are low in comparison. Portugal’s rankings are supported by the country’s performance on the Health and Wellness pillar, however the Education pillar is Portugal’s main weakness, in particular the relatively low levels of educational attainment in the current workforce.
Cyprus (31) has strong scores on the qualitative education indicators. Below average scores in well–being reduce the performance on the Health and Wellness pillar and several weak indicator scores result in the lowest performance for Cyprus on the Enabling Environment pillar.
Slovenia (32) has a varied performance across the pillars, with Education in 21st position due to high levels of educational attainment of the adult population, and Workforce and Employment in 41st position, where unemployment impacts profoundly on the overall scores. The Czech Republic (33) has a notably homogenous performance across all pillars with a rank of 36 for all pillars, with the exception of a stronger performance on Enabling Environment, in particular for the group of infrastructure–related variables.
Lithuania (34) and its neighbour Latvia (38) both demonstrate similar scores on the Workforce and Employment pillars. Italy’s (37) main strengths lie in the health of its population. With a rank of 19 in the Health and Wellness pillar, Italy has some of the top rankings in several indicators. However Italy’s lowest performance is the Workforce and Employment pillar, where it ranked at 75th, due to low levels of staff training and low perceptions of the use of technology within business. A notable
–1.2
–1.0
–0.8
–0.6
–0.4
–0.2
0.0
0.2
0.4
0.6
0.8
1.0
1.2
Sub-Saharan AfricaMiddle East and North Africa
Latin America and the Caribbean
Asia and the Pacific
Europe and Central Asia
North America
Figure 3: Regional performance on the Education pillar
Source: Human Capital Index 2013. Scores are weighted by population; population data from United Nations Department of Economic and Social Affairs, World Population Prospects, rev. 2012.
Pilla
r sco
re
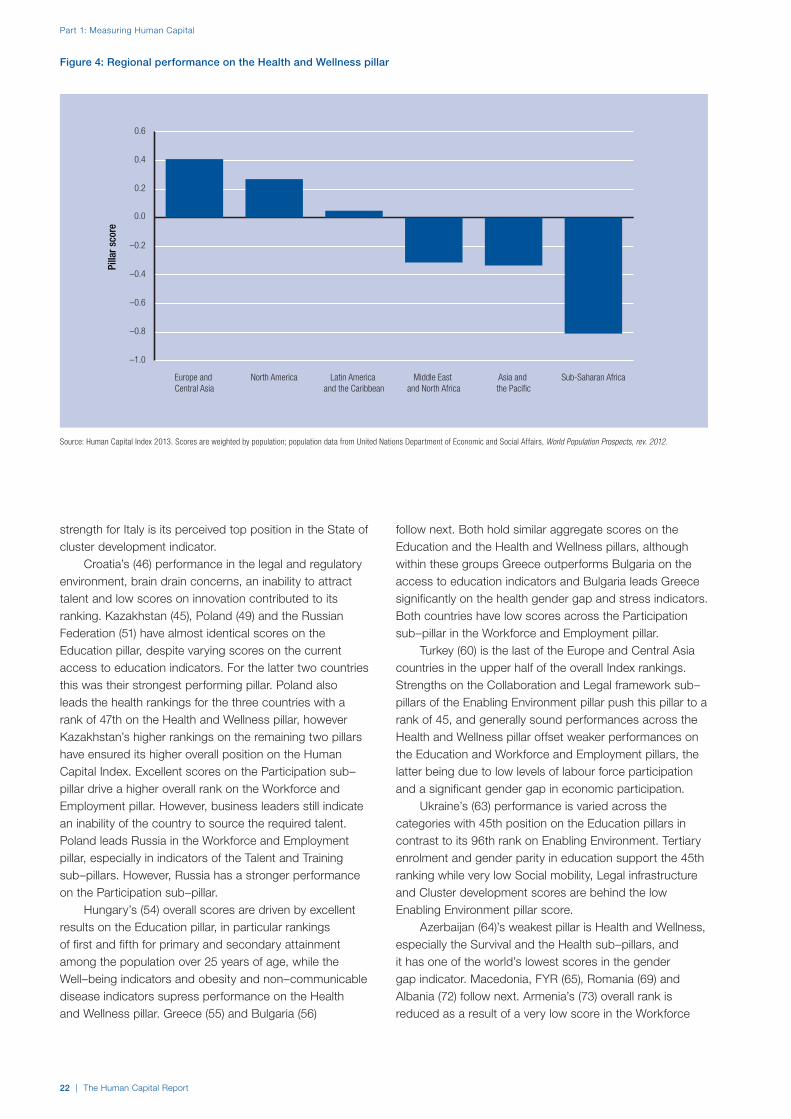
Part 1: Measuring Human Capital
22 | The Human Capital Report
strength for Italy is its perceived top position in the State of cluster development indicator.
Croatia’s (46) performance in the legal and regulatory environment, brain drain concerns, an inability to attract talent and low scores on innovation contributed to its ranking. Kazakhstan (45), Poland (49) and the Russian Federation (51) have almost identical scores on the Education pillar, despite varying scores on the current access to education indicators. For the latter two countries this was their strongest performing pillar. Poland also leads the health rankings for the three countries with a rank of 47th on the Health and Wellness pillar, however Kazakhstan’s higher rankings on the remaining two pillars have ensured its higher overall position on the Human Capital Index. Excellent scores on the Participation sub–pillar drive a higher overall rank on the Workforce and Employment pillar. However, business leaders still indicate an inability of the country to source the required talent. Poland leads Russia in the Workforce and Employment pillar, especially in indicators of the Talent and Training sub–pillars. However, Russia has a stronger performance on the Participation sub–pillar.
Hungary’s (54) overall scores are driven by excellent results on the Education pillar, in particular rankings of first and fifth for primary and secondary attainment among the population over 25 years of age, while the Well–being indicators and obesity and non–communicable disease indicators supress performance on the Health and Wellness pillar. Greece (55) and Bulgaria (56)
follow next. Both hold similar aggregate scores on the Education and the Health and Wellness pillars, although within these groups Greece outperforms Bulgaria on the access to education indicators and Bulgaria leads Greece significantly on the health gender gap and stress indicators. Both countries have low scores across the Participation sub–pillar in the Workforce and Employment pillar.
Turkey (60) is the last of the Europe and Central Asia countries in the upper half of the overall Index rankings. Strengths on the Collaboration and Legal framework sub–pillars of the Enabling Environment pillar push this pillar to a rank of 45, and generally sound performances across the Health and Wellness pillar offset weaker performances on the Education and Workforce and Employment pillars, the latter being due to low levels of labour force participation and a significant gender gap in economic participation.
Ukraine’s (63) performance is varied across the categories with 45th position on the Education pillars in contrast to its 96th rank on Enabling Environment. Tertiary enrolment and gender parity in education support the 45th ranking while very low Social mobility, Legal infrastructure and Cluster development scores are behind the low Enabling Environment pillar score.
Azerbaijan (64)’s weakest pillar is Health and Wellness, especially the Survival and the Health sub–pillars, and it has one of the world’s lowest scores in the gender gap indicator. Macedonia, FYR (65), Romania (69) and Albania (72) follow next. Armenia’s (73) overall rank is reduced as a result of a very low score in the Workforce
–1.0
–0.8
–0.6
–0.4
–0.2
0.0
0.2
0.4
0.6
Sub-Saharan AfricaAsia and the Pacific
Middle East and North Africa
Latin America and the Caribbean
North AmericaEurope and Central Asia
Figure 4: Regional performance on the Health and Wellness pillar
Source: Human Capital Index 2013. Scores are weighted by population; population data from United Nations Department of Economic and Social Affairs, World Population Prospects, rev. 2012.
Pilla
r sco
re

The Human Capital Report | 23
Part 1: Measuring Human Capital
and Employment pillar at 113, where unemployment is among the highest in the world and levels of employee training are low. Georgia (77) also has a weak performance on the Workforce and Employment pillar due to poor rankings on both unemployment and training indicators. A high proportion of years lived in good health and a low prevalence of stunting and wasting in children support stronger scores for the Health and Wellness pillar, where the country ranks 66th overall.
Moldova (83) and Serbia (85) perform significantly better on the Education and Health and Wellness pillars than on the Workforce and Enabling pillar. The education levels of the current workforce boost the pillar’s aggregate scores although performance is weaker on the qualitative measures. Moldova has one of the lowest labour force participation rates in the world, despite above–average rankings on the economic participation gender gap indicators and the two unemployment indicators. Serbia’s lowest scores are on the qualitative talent indicators, while low scores for staff training and high unemployment also bring down the overall score for the Workforce and Employment pillar for the country.
The Kyrgyz Republic (92) is the lowest performing of the Europe and Central Asia countries. Rankings of 78 and 75 for Education and Health and Wellness respectively are offset by lower rankings on the other two pillars. Very weak scores on the Enabling Environment’s Legal framework and the Collaborative sub–pillars negate the top 50 rankings achieved on some of the infrastructure indicators. The
Kyrgyz Republic scores its highest aggregate rankings on the Well–being sub–pillar within the Health and Wellness pillar.
MIDDLE EAST AND NORTH AFRICAThe Middle East and North Africa region has a very diverse profile of countries in terms of wealth. The region comprises 15 countries; of which, seven are high income, four are upper–middle income and four are lower–middle income. The region ranks fourth on Health and Wellness, holds second to last place on the Education and Enabling Environment pillars and is in last place on Workforce and Employment.
Qatar (18) has a broad range of ranks across the four pillars, from the seventh spot on the Workforce and Employment pillar to 44th position on the Health and Wellness pillar. Qatar’s high ranking on the Workforce and Employment pillar is due to top rankings on both unemployment indicators and Country capacity to retain talent as well as top ten rankings on the Staff training, Capacity to attract talent, Pay related to productivity and Labour force participation (15–64) indicators. Other high scores for education quality and collaboration on the Enabling Environment pillar are also important contributing factors.
The United Arab Emirates (24) also benefits from high qualitative Education pillar rankings and Israel’s (25) high educational attainment rates help drive its overall scores. The UAE’s rankings are pulled down by shortfalls on the
-1.2
-1.0
-0.8
-0.6
-0.4
-0.2
0.0
0.2
0.4
0.6
0.8
1.0
1.2
Middle East and North Africa
Sub-Saharan AfricaLatin America and the Caribbean
Europe and Central Asia
Asia and the Pacific
North America
Figure 5: Regional performance on the Workforce and Employment pillar
Source: Human Capital Index 2013. Scores are weighted by population; population data from United Nations Department of Economic and Social Affairs, World Population Prospects, rev. 2012.
Pilla
r sco
re

Part 1: Measuring Human Capital
24 | The Human Capital Report
Health and Wellness pillar with a last place ranking for Deaths under 60 from non–communicable diseases and a weak performance for Obesity. The Collaboration indicators of the Enabling Environment pillar are also helping to push up the overall scores for the UAE. Israel’s Life expectancy, Business impact of non–communicable diseases and health services indicators are strong performers for the country.
Saudi Arabia’s (39) pillar scores ranges from a 21st rank on Enabling Environment to a weaker 72nd spot on Health and Wellness. The country scores well on all indicators of the former, with the exception of Internet access, where usage rates are outside the top 50 rankings. Conversely, Saudi Arabia achieves the top spot for mobile phone use. Bahrain’s (40) strength is also on the Enabling Environment pillar, with a strong performance on the Legal framework and Social mobility sub–pillars. Deaths under 60 from NCDs and Obesity are weak points, both ranking below 100.
In contrast to a number of other countries in the region, Oman (41) has a relatively strong performance on the Health and Wellness pillar, with a rank of 37. Despite a relatively low life expectancy, Oman ranks highly in healthy life years and healthcare services. Oman’s Enabling Environment pillar is in a strong 25th position in part due to good scores in ICT usage and Intellectual property rights and property protection. Weaker scores in labour force participation and the education gender gap measure pull down the country’s overall scores.
Jordan (52) and Kuwait (59) both rank low on the Workforce and Employment pillar. Although Kuwait has good rankings for the unemployment indicators it has significantly lower scores on the qualitative measures. Jordan fares better, in this group, in particularly with the country’s level of technology absorption, but the country’s labour force participation rate among the 15–64 age group is the lowest in the sample and the economic gender gap measure puts the country in the bottom ten for this indicator.
A good overall performance (46th) on the Health and Wellness pillar boosts Tunisia’s (67) overall rankings. High rankings for the business impact of both communicable and non–communicable disease indicators help push up the scores on this pillar. Compared to a number of other countries in the region, Tunisia has very low rankings in labour force participation, economic gender gap and unemployment rates, placing Tunisia in 101st place in the Workforce and Employment pillar.
Lebanon (74) performs well on the Education pillar with a rank of 32nd, significantly higher than its 96th rank for Workforce and Employment and 104th rank for Enabling Environment. With the exception of Internet access in schools, the qualitative measures for Lebanon’s education perform well, at a 13th spot or above. Poor rankings on the Infrastructure, Legal frameworks and Collaboration sub–pillars push down scores on the Enabling Environment pillar.
-1.2
-1.0
-0.8
-0.6
-0.4
-0.2
0.0
0.2
0.4
0.6
0.8
1.0
1.2
Sub-Saharan AfricaMiddle East and North Africa
Latin America and the Caribbean
Asia and the Pacific
Europe and Central Asia
North America
Figure 6: Regional performance on the Enabling Environment pillar
Source: Human Capital Index 2013. Scores are weighted by population; population data from United Nations Department of Economic and Social Affairs, World Population Prospects, rev. 2012.
Pilla
r sco
re

The Human Capital Report | 25
Part 1: Measuring Human Capital
Morocco’s (82) Health and Wellness pillar is the country’s strongest, ranking 59th, boosted by strong performances on the Stunting and wasting in children, Depression and Business impact of non–communicable diseases indicators. Morocco is the highest ranked of the North African countries, significantly ahead of its neighbour Algeria (115) in all pillars, particularly Health and Wellness, where very low scores on the business impact of disease indicators distinctly separate the countries. Algeria’s qualitative measures for education, talent and training impact the overall results significantly and contribute to the overall lower ranking.
The Enabling Environment and Health and Wellness pillars help the low performance of Egypt (111). Stronger results on the Survival gender gap and the Water, sanitation and hygiene indicators are offset by poor results on Obesity and the two qualitative healthcare indicators. Likewise, the better ranking on the State of cluster development indicator is pulled down by the other Collaborative indicator, Business and university R&D collaboration.
Mauritania (121) and Yemen (122) are the lowest ranking countries in the region and in the Index overall, occupying the bottom four pillar spots in all but two instances. Mauritania has marginally better qualitative education results. Yemen has slightly better scores on the Enabling Environment pillar due to its domestic transport and social safety net indicators, although the collaboration variables reduce the overall pillar score to 116th. Mauritania scores well on the Depression indicator, helping to boost the country’s score to 105th on this pillar.
NORTH AMERICANorth America is the highest performing of the six regions and is comprised of only two high–income economies. Canada (10) ranks the highest of the North America region, due to a very strong performance on the Education pillar. The second overall rank raises the aggregate Human Capital Index score from the other three pillars, which rank between 15th for Workforce and Employment to 20th for Health and Wellness. Canada has the highest tertiary attainment levels of all the countries in the Index. Canada’s qualitative measures are significantly higher than that of the United States (16).
Within the Enabling Environment pillar, the United States demonstrates superior collaboration, as it does on the talent group of indicators in the Workforce and Employment pillar. However it is on the Health and Wellness pillar where the greatest difference in performance lies, with Canada scoring higher than the United States on the access and quality of its healthcare, on well–being and on the impact of non–communicable disease indicators.
SUB–SAHARAN AFRICATwenty–one countries are represented in the Sub– Saharan Africa region, which scores at the bottom of the six regions overall, with the lowest scores for each pillar, except for the Workforce and Employment pillar where it ranks fifth, ahead of the Middle East and North Africa region. Mauritius, Botswana, South Africa and Namibia are from the upper–middle income category of economies. There are six countries from the lower– middle income group and the remainder are all low– income economies.
Mauritius (47) is the highest–ranking county in the region and the only country from the region in the top 50. Good performances on Education and Enabling Environment, and in particular Health and Wellness where the country is ranked 45th, mean that the country is significantly ahead of the region’s second and third placed countries, Botswana (79) and Kenya (81). A lower 64th position on the Workforce and Employment pillar is due to low levels of labour force participation and a low ranking on the youth unemployment indicator.
Botswana ranks well on the Enabling Environment pillar with a 59th spot, in comparison with 85th to 93rd on the other three pillars. Better scores in the Legal framework sub–pillar help lift the lower scores in the Collaboration sub–pillar. In contrast, Kenya does well in terms of Collaboration but poorly on Legal framework. Botswana shares the top spot in the education gender gap measure and 40th in economic participation but has a much lower rank for the Survival gender gap indicator. Kenya does well overall on the talent indicators, with a globally high rank for Ease of finding skilled employees.
South Africa (86) ranks 42nd on the Enabling Environment pillar, its highest pillar score by a significant margin, and has rankings of 92nd to 105th on the other pillars. In particular, its Collaboration and Legal framework sub–pillars have strong results but the Infrastructure scores are pulled down by a 104th place rank for the Domestic transport indicator. South Africa’s very poor scores for unemployment, youth unemployment and labour force participation drive down the rankings for the Workforce and Employment pillar. Despite good scores for staff training, South Africa has one of the lowest scores on the Ease of finding skilled employees and Pay relating to productivity indicators.
Ghana (87) has stronger scores across the Workforce and Employment and Enabling Environment pillars than it does on the Education and Health and Wellness pillars. Strong labour force participation rates across the population maintain its ranking despite some weaknesses on the talent and training indicators. Ghana’s Domestic transport indicator performs better than the ICT element within the Infrastructure sub–pillar.
Namibia’s (97) ranking on the Enabling Environment pillar (61) tops that of the other three pillars, where it ranks between 98th and 108th, by a significant margin. Senegal

Part 1: Measuring Human Capital
26 | The Human Capital Report
(102) has a strong 51st spot on the Workforce and Employment pillar that boosts its overall ranking, despite being in 112th position on the Education pillar. Senegal has some of the lowest educational attainment rates within the adult population of any country in the Index and enrolment levels among children today are very low. Nevertheless, the qualitative measures on the Workforce and Employment pillar are relatively strong, and Senegal has a high 21st rank on the Ease of finding skilled employees indicator.
Malawi (103), Tanzania (104) and Madagascar (105) all have rankings lower than 100 on all four pillars, with the exception of Workforce and Employment, due to high labour force participation levels and very good scores on the unemployment indicators. The qualitative measures are in the bottom half of the rankings and technology–related indicators show weak scores for these countries. The Education pillar enrolment scores—particularly for higher education—are very low for these three countries. Malawi has some of the globally lowest scores in the Health and Wellness pillar.
Uganda’s (106) overall scores are enhanced by its high levels of labour force participation and low levels of unemployment, as are the scores for Cameroon (107) and Lesotho (108). Côte d’Ivoire (109) reflects a similar picture. Benin (113) follows next, with the Infrastructure and Collaboration sub–pillars and the Doing Business Index indicator pulling down the overall scores on the Enabling Environment pillar. Nigeria (114), the most populous nation in the African continent, bucks the trend in high levels of labour force participation, with a relatively weak rank of 106th on the 15 to 64 age group, although it ranks higher on the over 65 labour force participation age group indicator. Nigeria’s qualitative measures on the Education and Workforce and Employment pillars and technology–related indicators are relative strengths, but the country has the lowest rankings for primary education enrolment and is just outside the bottom ten for tertiary enrolment.
Ethiopia (116), Mozambique (117) and Mali (118) follow next. Ethiopia’s relatively stronger performing scores on the Workforce and Employment pillar are derived from participation rather than qualitative measures. ICT infrastructure scores for Ethiopia are the lowest globally; however, the Legal framework and Social mobility sub–pillars lead to better scores on the Enabling Environment pillar. Burkina Faso (119) has its overall scores greatly boosted by high rates of labour force participation and low levels of youth unemployment; it ranks fifth on labour force participation of the 15 to 64 year olds and fourth on youth unemployment indicators. However it has very low rankings across the qualitative measures of the talent and training indicators.
Both Burkina Faso and Guinea (120) have low rankings on the technology indicators in the Workforce and Employment and Enabling Environment pillar. Both countries also have low levels of school enrolment, and
Guinea in particular has a number of bottom–10 ranking qualitative indicators in the Education pillar. Guinea is the lowest performing country in the Sub–Saharan Africa region. Its highest rank is 117th on the Workforce and Employment pillar and it is the lowest ranked of all countries on the Enabling Environment pillar at 122nd, with universally low scores on the Infrastructure and Legal framework sub–pillars.
LATIN AMERICA AND THE CARIBBEANLatin America and the Caribbean ranks fourth on the overall Index, ahead of the Middle East and the Sub-Saharan Africa regions respectively. The region comprises predominantly upper–middle income economies, with four high–income economies and six lower–middle income economies.
Barbados (26) is the highest–ranking country in the region due to its strong scores on the Education pillar, where it ranks in 12th place. The country has four indicators in this pillar that rank in the top ten; these are mainly in the Qualitative sub–pillar. The obesity and non–communicable disease indicators in the Health and Wellness pillar pull down the overall scores for this pillar to 42nd place; otherwise, Barbados has good results on the Survival gender gap and Healthcare accessibility indicators.
Costa Rica (35) and Chile (36) are similarly ranked across a number of pillars; however, Chile has particular strengths on the Enabling Environment pillar. Conversely, Costa Rica is substantially stronger than Chile in three of the five qualitative measures of the Education pillar. Costa Rica performs well on the training indicators and better overall on the talent indicators than it does on the participation indicators in the Workforce and Employment pillar. Chile has stronger attainment and enrolment scores except for higher education.
Panama’s (42) Workforce and Employment and Enabling Environment pillars rank at 31st and 34th respectively and are the country’s strongest. The country’s high rankings on the capacity to attract and retain talent indicators help drive the Workforce and Employment pillar scores up, as does the mobile phone penetration indicator within the Enabling Environment pillar. Weaker scores on obesity, stress, and qualitative indicators of math and science education contribute to a reduction in the overall rankings.
Uruguay (48), the last of the region’s countries in the top 50, has good enrolment rates for primary and tertiary education, which help keep the overall Education pillar scores buoyant, despite weaknesses in several of the qualitative indicators. A top rank for the Survival gender gap indicator is in contrast to the bottom rank on Pay relating to productivity measure.
Brazil (57) and Mexico (58) are closely tied, with almost identical scores on the Enabling Environment pillar. Brazil ranks higher on the ICT infrastructure indicators and
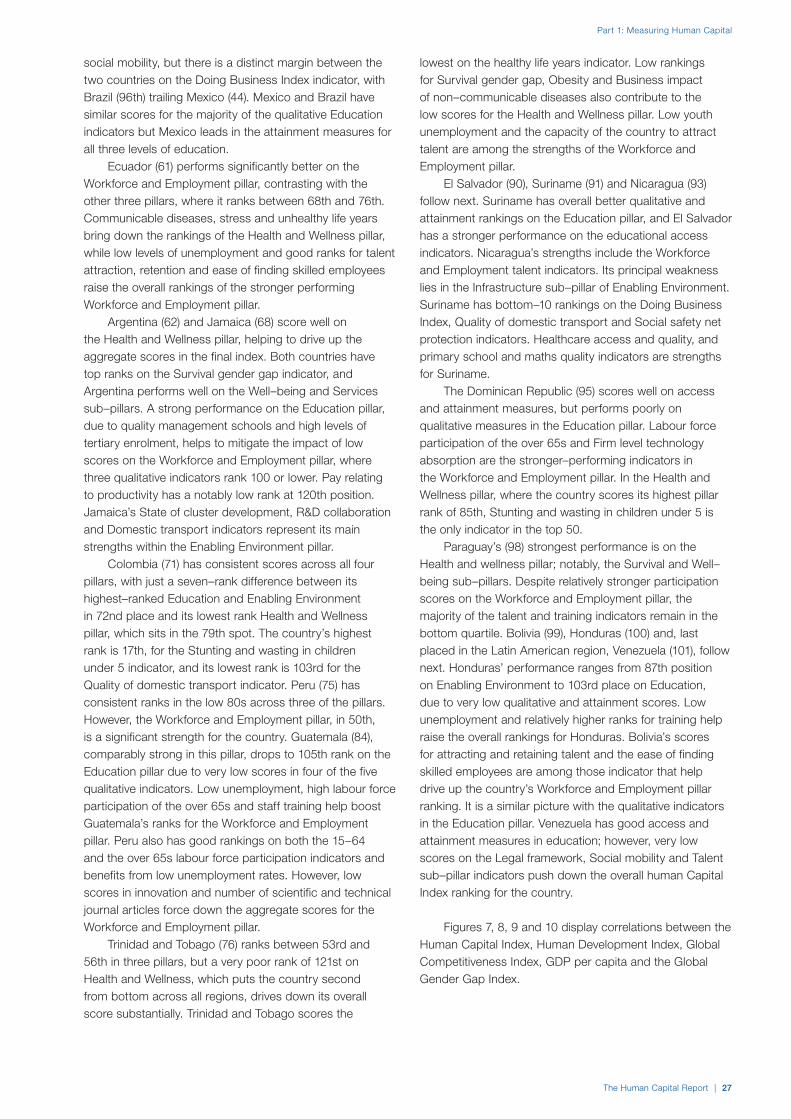
The Human Capital Report | 27
Part 1: Measuring Human Capital
social mobility, but there is a distinct margin between the two countries on the Doing Business Index indicator, with Brazil (96th) trailing Mexico (44). Mexico and Brazil have similar scores for the majority of the qualitative Education indicators but Mexico leads in the attainment measures for all three levels of education.
Ecuador (61) performs significantly better on the Workforce and Employment pillar, contrasting with the other three pillars, where it ranks between 68th and 76th. Communicable diseases, stress and unhealthy life years bring down the rankings of the Health and Wellness pillar, while low levels of unemployment and good ranks for talent attraction, retention and ease of finding skilled employees raise the overall rankings of the stronger performing Workforce and Employment pillar.
Argentina (62) and Jamaica (68) score well on the Health and Wellness pillar, helping to drive up the aggregate scores in the final index. Both countries have top ranks on the Survival gender gap indicator, and Argentina performs well on the Well–being and Services sub–pillars. A strong performance on the Education pillar, due to quality management schools and high levels of tertiary enrolment, helps to mitigate the impact of low scores on the Workforce and Employment pillar, where three qualitative indicators rank 100 or lower. Pay relating to productivity has a notably low rank at 120th position. Jamaica’s State of cluster development, R&D collaboration and Domestic transport indicators represent its main strengths within the Enabling Environment pillar.
Colombia (71) has consistent scores across all four pillars, with just a seven–rank difference between its highest–ranked Education and Enabling Environment in 72nd place and its lowest rank Health and Wellness pillar, which sits in the 79th spot. The country’s highest rank is 17th, for the Stunting and wasting in children under 5 indicator, and its lowest rank is 103rd for the Quality of domestic transport indicator. Peru (75) has consistent ranks in the low 80s across three of the pillars. However, the Workforce and Employment pillar, in 50th, is a significant strength for the country. Guatemala (84), comparably strong in this pillar, drops to 105th rank on the Education pillar due to very low scores in four of the five qualitative indicators. Low unemployment, high labour force participation of the over 65s and staff training help boost Guatemala’s ranks for the Workforce and Employment pillar. Peru also has good rankings on both the 15–64 and the over 65s labour force participation indicators and benefits from low unemployment rates. However, low scores in innovation and number of scientific and technical journal articles force down the aggregate scores for the Workforce and Employment pillar.
Trinidad and Tobago (76) ranks between 53rd and 56th in three pillars, but a very poor rank of 121st on Health and Wellness, which puts the country second from bottom across all regions, drives down its overall score substantially. Trinidad and Tobago scores the
lowest on the healthy life years indicator. Low rankings for Survival gender gap, Obesity and Business impact of non–communicable diseases also contribute to the low scores for the Health and Wellness pillar. Low youth unemployment and the capacity of the country to attract talent are among the strengths of the Workforce and Employment pillar.
El Salvador (90), Suriname (91) and Nicaragua (93) follow next. Suriname has overall better qualitative and attainment rankings on the Education pillar, and El Salvador has a stronger performance on the educational access indicators. Nicaragua’s strengths include the Workforce and Employment talent indicators. Its principal weakness lies in the Infrastructure sub–pillar of Enabling Environment. Suriname has bottom–10 rankings on the Doing Business Index, Quality of domestic transport and Social safety net protection indicators. Healthcare access and quality, and primary school and maths quality indicators are strengths for Suriname.
The Dominican Republic (95) scores well on access and attainment measures, but performs poorly on qualitative measures in the Education pillar. Labour force participation of the over 65s and Firm level technology absorption are the stronger–performing indicators in the Workforce and Employment pillar. In the Health and Wellness pillar, where the country scores its highest pillar rank of 85th, Stunting and wasting in children under 5 is the only indicator in the top 50.
Paraguay’s (98) strongest performance is on the Health and wellness pillar; notably, the Survival and Well–being sub–pillars. Despite relatively stronger participation scores on the Workforce and Employment pillar, the majority of the talent and training indicators remain in the bottom quartile. Bolivia (99), Honduras (100) and, last placed in the Latin American region, Venezuela (101), follow next. Honduras’ performance ranges from 87th position on Enabling Environment to 103rd place on Education, due to very low qualitative and attainment scores. Low unemployment and relatively higher ranks for training help raise the overall rankings for Honduras. Bolivia’s scores for attracting and retaining talent and the ease of finding skilled employees are among those indicator that help drive up the country’s Workforce and Employment pillar ranking. It is a similar picture with the qualitative indicators in the Education pillar. Venezuela has good access and attainment measures in education; however, very low scores on the Legal framework, Social mobility and Talent sub–pillar indicators push down the overall human Capital Index ranking for the country.
Figures 7, 8, 9 and 10 display correlations between the Human Capital Index, Human Development Index, Global Competitiveness Index, GDP per capita and the Global Gender Gap Index.

–1.5 –1.2 –0.9 –0.6 –0.3 0.0 0.3 0.6 0.9 1.2 1.5
0.2
0.4
0.6
0.8
1.0
KenyaYemen
IndiaIndonesia
China
Brazil Qatar
Switzerland
Singapore FinlandJapan
United StatesRussian Federation
Figure 7: Relationship between the Human Development Index and the Human Capital Index
Source: Human Capital Index 2013 and the United Nation’s International Human Development Indicators 2012 online database, accessed September 2013.
Hum
an D
evel
opm
ent I
ndex
201
2 sc
ore
Human Capital Index 2013 score
–1.5 –1.2 –0.9 –0.6 –0.3 0.0 0.3 0.6 0.9 1.2 1.5
1
2
3
4
5
6
7
Kenya
India
Yemen
Indonesia
China
Brazil Qatar
Switzerland
Japan
United States
Singapore
Finland
Russian Federation
Figure 8: Relationship between the Global Competitiveness Index and the Human Capital Index
Source: Human Capital Index 2013 and the World Economic Forum’s Global Competitiveness Index, accessed September 2013.
Glob
al C
ompe
titiv
enes
s In
dex
2012
–201
3 sc
ore
(1
–7 s
cale
)
Human Capital Index 2013 score
Part 1: Measuring Human Capital
28 | The Human Capital Report
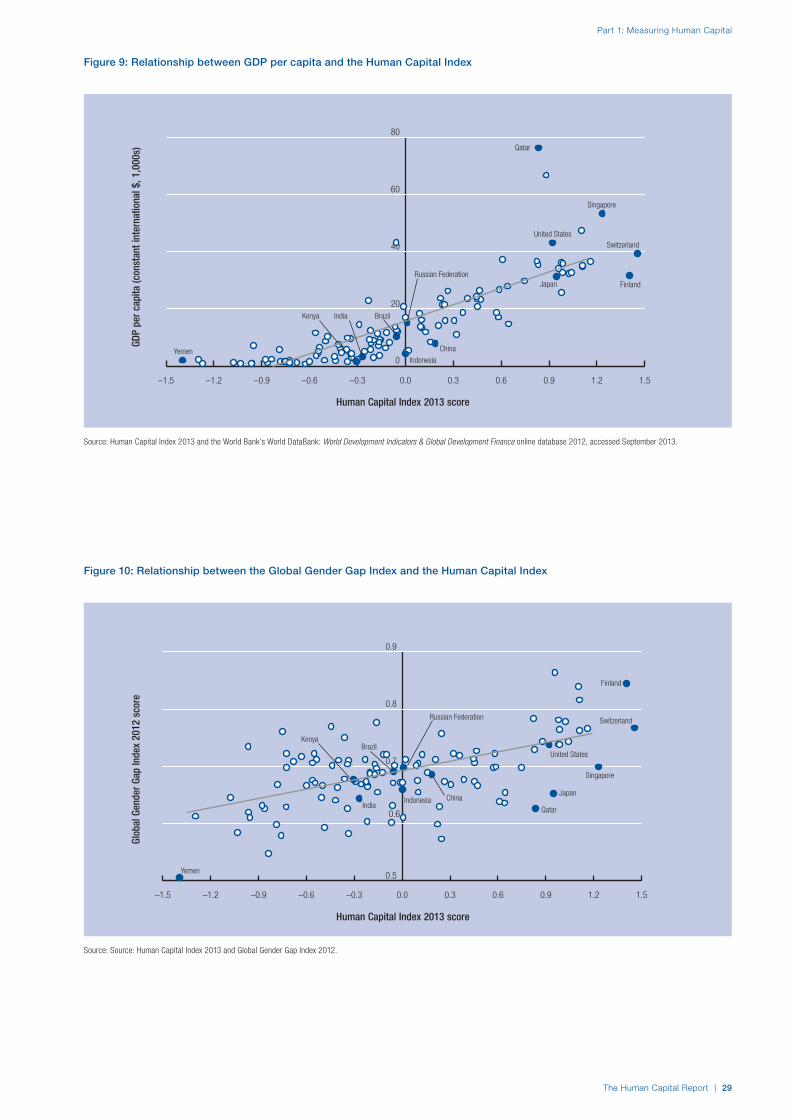
Source: Source: Human Capital Index 2013 and Global Gender Gap Index 2012.
–1.5 –1.2 –0.9 –0.6 –0.3 0.0 0.3 0.6 0.9 1.2 1.5
0.5
0.6
0.7
0.8
0.9
Kenya
IndiaIndonesia China
Brazil
Qatar
Switzerland
Finland
Japan
United States
Singapore
Russian Federation
Yemen
–1.5 –1.2 –0.9 –0.6 –0.3 0.0 0.3 0.6 0.9 1.2 1.5
0
20
40
60
80
Qatar
Kenya India
YemenIndonesia
China
Brazil
Singapore
Switzerland
Japan Finland
United States
Russian Federation
Figure 9: Relationship between GDP per capita and the Human Capital Index
Figure 10: Relationship between the Global Gender Gap Index and the Human Capital Index
Source: Human Capital Index 2013 and the World Bank’s World DataBank: World Development Indicators & Global Development Finance online database 2012, accessed September 2013.
GDP
per c
apita
(con
stan
t int
erna
tiona
l $, 1
,000
s)Gl
obal
Gen
der G
ap In
dex
2012
sco
re
Human Capital Index 2013 score
Human Capital Index 2013 score
The Human Capital Report | 29
Part 1: Measuring Human Capital

Part 1: Measuring Human Capital
30 | The Human Capital Report
CONCLUSIONThe Human Capital Index seeks to create greater awareness among a global audience of human capital as a fundamental pillar of the growth, stability and competitiveness of nations. This Index is a first attempt at measuring human capital holistically and across a large set of countries. We hope to continue to improve methodology in future years and hope that this Report will also foster further research.
The Index seeks to serve as a tool for capturing the complexity of workforce dynamics so that various stakeholders are able to take better–informed decisions. Because human capital is critical not only to the productivity of society but also to the functioning of its political, social and civil institutions, understanding its current capacity is valuable to a wide variety of stakeholders. We hope that this Report can help governments, business, universities and civil society institutions identify key areas for focus and investment. All of these entities have a stake in human capital development, whether their primary goal is to power their businesses, strengthen their communities, or create a population that is better able to contribute to and share in the rewards of growth and prosperity. We thus hope that this Report will also foster collaboration between sectors to address human capital gaps.
NOTES 1 See WHO, Fact sheet no 332: Early child development.
2 See WHO, Health Status Statistics: Mortality.
3 See WHO, Fact sheet: Noncommunicable diseases.
4 See WHO, Fact sheet: Obesity and overweight.
5 See WHO, Investing in Mental Health, page 5.
6 See WHO, 10 Facts on Mental Health: Fact 2.
7 See Sanctuary, M., Tropp, H., et al., “Making water a part of economic development: The economic benefits of improved water management and services”.
8 See ILO, Resource Guide on youth employment.
REFERENCESAccess Economics Pty Limited. The Global Economic Cost of Visual
Impairment. 2010. Sydney: Access Economics Pty Limited.
ACT. A Better Measure of Skills Gaps. 2004. Iowa city: ACT, Inc.Agbor, J.A. and Price, G.N. Does Famine Matter For Aggregate Adolescent Human Capital Acquisition In Sub-Saharan Africa?. ERSA (Economic Research Southern Africa), www.econrsa.org/publications/working-papers/does-famine-matter-aggregate-adolescent-human-capital-acquisition-sub, December 2012.
Aiyar, S. and Mody, A. The Demographic Dividend: Evidence from the Indian States. International Monetary Fund, http://www.imf.org/external/pubs/ft/wp/2011/wp1138.pdf, 2011.
Appleton, S. and Teal, F. Human Capital and Economic Development. Working Paper Series 173. 2000. Abidjan: African Development Bank.
Barclay, S. (2010) The Dubai Initiative Measuring Human Capital for Investment. Student research, 2010. Cambridge: Harvard University, John F. Kennedy School of Government.
Bernal-Verdugo, L.E., Furceri, D., and Guillaume, D. Labor Market Flexibility and Unemployment: New Empirical Evidence of Static and Dynamic Effects. International Monetary Fund, http://www.imf.org/external/pubs/ft/wp/2012/wp1264.pdf, 2012.
Bleakley, H. “Health, Human Capital, and Development”. Annual Review of Economics, 2010, 2(1): 283-310. www.annualreviews.org/doi/abs/10.1146/annurev.economics.102308.124436.
Brown, Tim. “A creative future for education”. Forum Blog (blog), Feb 6, 2013, http://forumblog.org/2013/02/a-creative-future-for-education/#disqus_thread.
Cairncross, F. and Pöysti, K. ICTs for education and building human capital. International Telecommunications Union, www.itu.int/osg/spu/visions/summaries/education.pdf, 2003.
Carneiro, P. and Heckman, J. Human Capital Policy. 2003. Working Paper 9495. Cambridge, MA: National Bureau of Economic Research.
Cisco. Equipping Every Learner for the 21st Century. www.cisco.com/web/about/citizenship/socio-economic/docs/GlobalEdWP.pdf, 2008.
Coulombe, S.,Tremblay, J.F. and Marchand, S. International Adult Literacy Survey Literacy scores, human capital and growth across fourteen OECD countries. 2004. Ottawa: Statistics Canada.
Deaton, A. Income, Health, and Well-Being around the World: Evidence from the Gallup World Poll. NBER Working Paper No. 13317. National Bureau of Economic Research, http://www.nber.org/papers/w13317, 2007.
Donnelly, J. (2011) “How did Sierra Leone provide free health care?” In The Lancet, 2011, 377.
The Economist. “Education and demography: Trimming the dividend”. 17:43, March 15, 2013.
Eidos Institute, The. The Australian Human Capital Project Prospectus. The Human Capital Gateway, http://www.humancapitalgateway.org/HCGProspectusFinal.pdf.
Ederer, P. Innovation at Work: The European Human Capital Index. 2006. Brussels: Lisbon Council Policy Brief.
Gonzalez, G. Karoly, L.A., et al. Facing Human Capital Challenges of the 21st Century: education and labor market initiatives in Lebanon, Oman, Qatar, and the United Arab Emirates. 2008. Doha: Rand-Qatar Policy Institute.
Hausmann, R., Hidalgo, C., et al. The Atlas of Economic Complexity. Cambridge: Puritan Press, 2011.
Hendricks, L. “How Important Is Human Capital for Development? Evidence from Immigrant Earnings”. American Economic Review, 2012, 92(1):198-219. www.aeaweb.org/articles.php?doi=10.1257/000282802760015676.
Institute for Health Metrics and Evaluation. The Global Burden of Disease: Generating evidence, guiding policy. 2013. Seattle: Institute for Health Metrics and Evaluation.
ILO (International Labour Organization). Global Employment Trends for Youth 2012. 2012. Geneva: ILO.
———. International Standard Classification of Occupations: Structure, group definitions and correspondence tables (ISCO-08). 2012. Geneva: ILO.
———. Resource Guide on youth employment. ILO, http://www.ilo.org/public/english/support/lib/resource/subject/youth.htm, August 2013.
Irmen, A. Cross-Country Income Differences and Technology Diffusion in a Competitive World. Discussion Paper Series No. 480. 2008. Heidelberg: University of Heidelberg Department of Economics.
Keeley, B. Human Capital: How what you know shapes your life. 2007. Paris: OECD.
Li, H. Measuring Human Capital in China. Lisbon Council, http://www.lisboncouncil.net/component/downloads/?id=420.
Malawi Ministry of Economic Planning and Development, National Statistics Office, and the Centre for Social Research. Malawi Social Indicators Survey 1995. Chapter 8: Child Malnutrition. http://www.childinfo.org/files/Malintro.pdf, September 1996.
The Human Capital Report | 31
Part 1: Measuring Human Capital
Marope, M.T. Namibia Human Capital and Knowledge Development for Economic Growth with Equity. World Bank, siteresources.worldbank.org/INTAFRICA/Resources/No84.pdf, 2008.
Mourshed, M., Farrell, D., Barton, D. Education to Employment: Designing and education system that works (Executive Summary). McKinsey Centre for Government, http://www.mckinsey.com/client_service/public_sector/mckinsey_center_for_government/education_to_employment, 2010.
Murphy, S. Business and Philanthropy Partnerships for Human Capital Development in the Middle East. Corporate Social Responsibility Initiative Working Paper No. 52. 2009. Cambridge: John F. Kennedy School of Government, Harvard University.
Nayar, R., Gottret, P., et al. More and Better Jobs in South Asia. 2012. Washington, DC: World Bank.
Nkhwa, T. Building Africa’s Human Capital Opportunities and Challenges. Presented at 27th African Association for Public Administration and Management Annual Roundtable Conference. 5-9 December 2005. http://unpan1.un.org/intradoc/groups/public/documents/aapam/unpan025761.pdf.
OECD (Organisation for Economic Co-Operation and Development). OECD Patent Statistics Manual. http://browse.oecdbookshop.org/oecd/pdfs/free/9209021e.pdf.
———. The Creative Society of the 21st Century. http://www.oecd.org/futures/35391171.pdf, 2010.
Oortwijn, W. and Mathijssen, J., et al. Evaluating the Uptake of the Healthy Life Years Indicator. 2006. Santa Monica: RAND.
Riddell, W. C. Investing in Human Capital: Policy Priorities for Canada. Canadian Priorities Agenda Brief No.5: Human Capital. 2008. Montreal: Institute for Research on Public Policy.
Rinne, U. and Zhao, Z. Human Capital vs. Signaling, The German Reunification as a Natural Experiment (preliminary draft, Germany and China). 2010. http://www.iza.org/conference_files/TAM2010/rinne_u1844.pdf.
Ross, J. Understanding the Demographic Dividend. 2004. Washington: Policy Project.
Royal Society, The. Knowledge, networks and nations: Global scientific collaboration in the 21st century. 2011. London: The Royal Society.
Sanctuary, M., Tropp, H., et al. Making water a part of economic development: The economic benefits of improved water management and services. WHO (World Health Organization), http://www.who.int/features/factfiles/mental_health/mental_health_facts/en/index1.html, August 2013.
Steinberg, C. Can Women Save Japan (and Asia too)? International Monetary Fund, www.imf.org/external/pubs/ft/fandd/2012/09/steinberg.htm, 2012.
Souter, D. Towards Inclusive Knowledge Societies: A review of UNESCO’s action in implementing the WSIS outcomes. 2010. Paris: UNESCO.
Thylefors, B. and Négrel A-D, et al. “Global Data on Blindness”. Reproduced from “Global Data on Blindness”, Thylefors B and Négrel A-D., et al. Bulletin of the World Health Organization, 1995, 73(1):115–121.
UNDP (United Nations Development Program). Mobile Technologies and Empowerment: Enhancing human development through participation and innovation. http://www.undpegov.org/mgov-primer.html, 2012.
UNESCO (United Nations Educational, Scientific and Cultural Organization). Education for all the Global Imperative. 2005. Paris: UNESCO.
UNESCO Institute for Statistics. Global Education Digest: Comparing Education Statistics Across the World. 2011. Montreal: UNESCO.
Wail, B., Said, H et al. A New Data Set of Educational Inequality in the World, 1950–2010: Gini Index of Education by Age Group. http://papers.ssrn.com/sol3/papers.cfm?abstract_id=1895496, 2011.
Walpole, S. C., Prieto-Merino, D., et al. “The weight of nations: an estimation of adult human biomass”. In BMC Public Health, 2012, 12:439.
Westervelt, E. The Secret To Germany’s Low Youth Unemployment (National Public Radio podcast), April 04, 2012, http://www.npr.org/2012/04/04/149927290/the-secret-to-germanys-low-youth-unemployment.
WHO (World Health Organization). 10 Facts on Mental Health: Fact 2. http://www.who.int/features/factfiles/mental_health/mental_health_facts/en/index1.html, July 2013.
———. Fact sheet: Obesity and overweight. http://www.who.int/mediacentre/factsheets/fs311/en/, March 2013.
———. Fact sheet no 332: Early child development. http://www.who.int/mediacentre/factsheets/fs332/en/, August 2009.
———. Fact sheet: Noncommunicable diseases. http://www.who.int/mediacentre/factsheets/fs355/en/, March 2013.
———. Global Data On Visual Impairments. 2012. WHO/NMH/PBD/12.01.
———. Health Status Statistics: Mortality. http://www.who.int/healthinfo/statistics/indhale/en/, July 2013.
———. Investing in Mental Health. http://www.who.int/mental_health/media/investing_mnh.pdf, 2003.
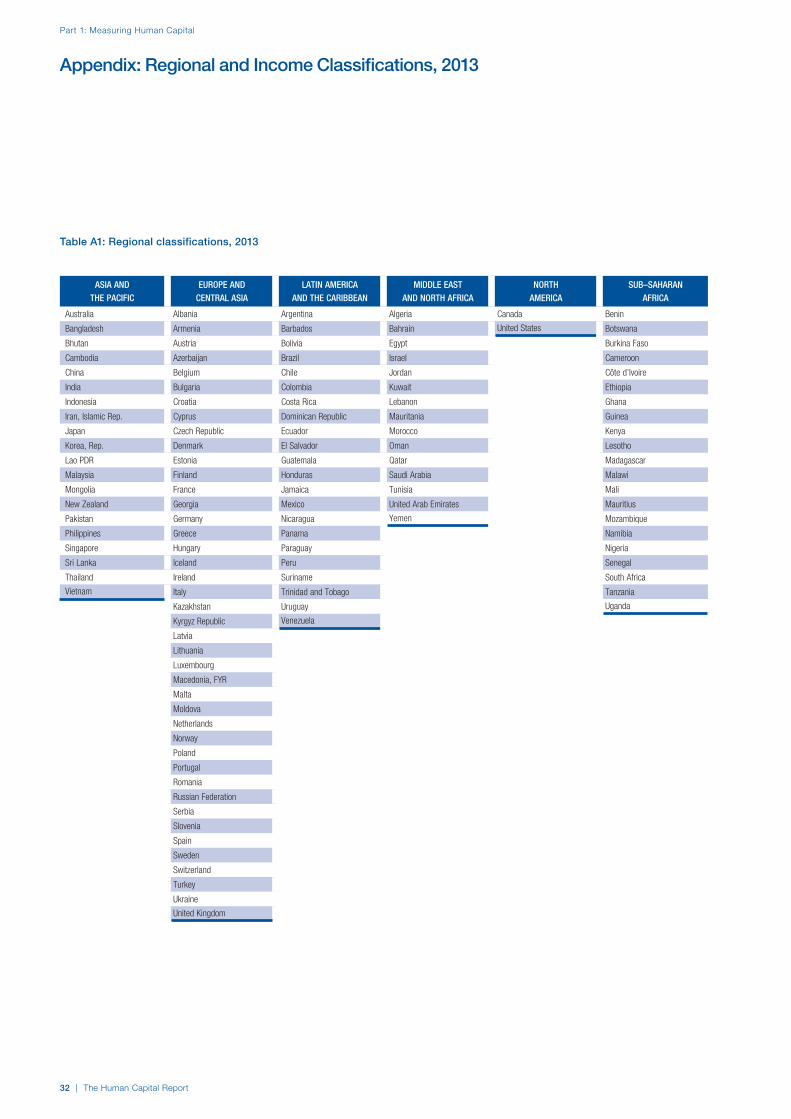
Part 1: Measuring Human Capital
32 | The Human Capital Report
Appendix: Regional and Income Classifications, 2013
Table A1: Regional classifications, 2013
ASIA AND THE PACIFIC
EUROPE AND CENTRAL ASIA
LATIN AMERICA AND THE CARIBBEAN
MIDDLE EAST AND NORTH AFRICA
NORTH AMERICA
SUB–SAHARAN AFRICA
Australia Albania Argentina Algeria Canada Benin
Bangladesh Armenia Barbados Bahrain United States Botswana
Bhutan Austria Bolivia Egypt Burkina Faso
Cambodia Azerbaijan Brazil Israel Cameroon
China Belgium Chile Jordan Côte d’Ivoire
India Bulgaria Colombia Kuwait Ethiopia
Indonesia Croatia Costa Rica Lebanon Ghana
Iran, Islamic Rep. Cyprus Dominican Republic Mauritania Guinea
Japan Czech Republic Ecuador Morocco Kenya
Korea, Rep. Denmark El Salvador Oman Lesotho
Lao PDR Estonia Guatemala Qatar Madagascar
Malaysia Finland Honduras Saudi Arabia Malawi
Mongolia France Jamaica Tunisia Mali
New Zealand Georgia Mexico United Arab Emirates Mauritius
Pakistan Germany Nicaragua Yemen Mozambique
Philippines Greece Panama Namibia
Singapore Hungary Paraguay Nigeria
Sri Lanka Iceland Peru Senegal
Thailand Ireland Suriname South Africa
Vietnam Italy Trinidad and Tobago Tanzania
Kazakhstan Uruguay Uganda
Kyrgyz Republic Venezuela
Latvia
Lithuania
Luxembourg
Macedonia, FYR
Malta
Moldova
Netherlands
Norway
Poland
Portugal
Romania
Russian Federation
Serbia
Slovenia
Spain
Sweden
Switzerland
Turkey
Ukraine
United Kingdom

The Human Capital Report | 33
Part 1: Measuring Human Capital
Appendix: Regional and income classifications, 2013 (cont’d.)
LOW INCOME
US$1,035 or less
Bangladesh
Benin
Burkina Faso
Cambodia
Ethiopia
Guinea
Kenya
Kyrgyz Republic
Madagascar
Malawi
Mali
Mozambique
Tanzania
Uganda
LOWER–MIDDLE INCOME
US$1,036–$4,085
Armenia
Bhutan
Bolivia
Cameroon
Côte d’Ivoire
Egypt
El Salvador
Georgia
Ghana
Guatemala
Honduras
India
Indonesia
Lao PDR
Lesotho
Mauritania
Moldova
Mongolia
Morocco
Nicaragua
Nigeria
Pakistan
Paraguay
Philippines
Senegal
Sri Lanka
Ukraine
Vietnam
Yemen
UPPER–MIDDLE INCOME
US$4,086–$12,615
Albania
Algeria
Argentina
Azerbaijan
Botswana
Brazil
Bulgaria
China
Colombia
Costa Rica
Dominican Republic
Ecuador
Hungary
Iran, Islamic Rep.
Jamaica
Jordan
Kazakhstan
Lebanon
Macedonia, FYR
Malaysia
Mauritius
Mexico
Namibia
Panama
Peru
Romania
Serbia
South Africa
Suriname
Thailand
Tunisia
Turkey
Venezuela
HIGH INCOME
US$ 12,616 or more
Australia
Austria
Bahrain
Barbados
Belgium
Canada
Chile
Croatia
Cyprus
Czech Republic
Denmark
Estonia
Finland
France
Germany
Greece
Iceland
Ireland
Israel
Italy
Japan
Korea, Rep.
Kuwait
Latvia
Lithuania
Luxembourg
Malta
Netherlands
New Zealand
Norway
Oman
Poland
Portugal
Qatar
Russian Federation
Saudi Arabia
Singapore
Slovenia
Spain
Sweden
Switzerland
Trinidad and Tobago
United Arab Emirates
United Kingdom
United States
Uruguay
Table A2: Income classifications, 2013
Note: Income classifications are taken from the World Bank, which classifies economies into four income categories based on 2013 GNI per capita (current US$), high income, upper–middle income, lower–middle income and low income.


![Outline Human capital theory by C. Echevarriahomepage.usask.ca/~ece220/econ221/4-HC [Compatibility Mode].pdf · Human capital theory by C. Echevarria ... Human capital Human capital](https://static.fdocuments.us/doc/165x107/5ae0d5467f8b9a6e5c8df29c/outline-human-capital-theory-by-c-ece220econ2214-hc-compatibility-modepdfhuman.jpg)
