Part 1 Why eSourcing? Speaker... · Procurement Maturity vs eSourcing Maturity Reactive Proactive...
25
Proprietary & Confidential eSourcing Presentation for: Part 1 – Why eSourcing? - What is eSourcing - Best-in-class - eSourcing Maturity - Increasing eSourcing Maturity Part 2 – Next Level eSourcing - Auctions: A Brief History - eAuction Types - 3C Model - Scanmarket Stats Analysis Dan Gianfreda Sales Manager UK and Italy Scanmarket [email protected] Mobile: +44 7766 746196
Transcript of Part 1 Why eSourcing? Speaker... · Procurement Maturity vs eSourcing Maturity Reactive Proactive...
Proprietary & Confidential
eSourcing Presentation for:
Part 1 – Why eSourcing?- What is eSourcing- Best-in-class- eSourcing Maturity- Increasing eSourcing Maturity
Part 2 – Next Level eSourcing- Auctions: A Brief History- eAuction Types- 3C Model- Scanmarket Stats Analysis
Dan GianfredaSales Manager UK and Italy
[email protected]: +44 7766 746196
Proprietary & Confidential
verview of eSourcing…at it’s best
Proprietary & Confidential
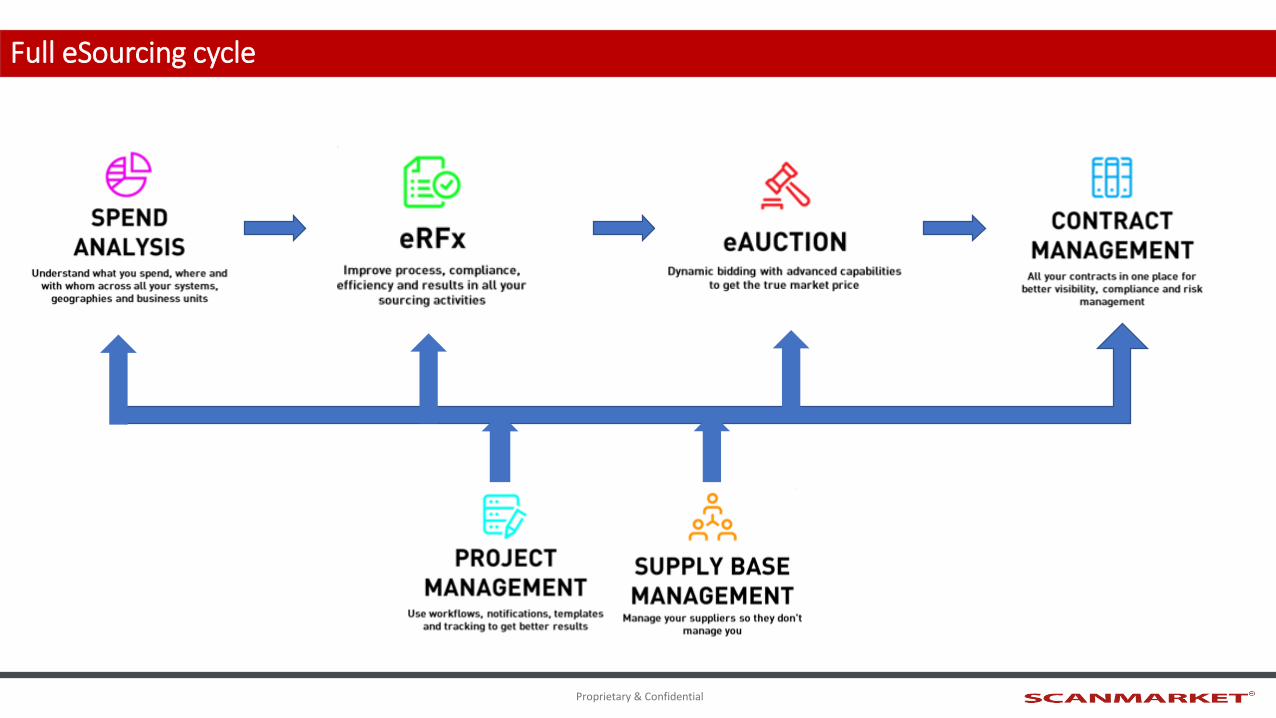
Full eSourcing cycle
Proprietary & Confidential
eSourcing

Proprietary & Confidential
Aberdeen Group: Fact based insights
5
MILLIONS OF BUSINESS PRACTIONERS READ ABERDEEN GROUP PUBLICATIONS THAT INFORM THEIR STRATEGY AND IMPROVE THEIR PERFORMANCE WITH FACT-INSIGHTS
ABOUT ABERDEEN GROUP
Since: 1988
What: Publish content that educate and help businesses improve performance
How: Primary research across industries
Why: Drive smarter decisions and improve business decisions
DEFINITIONS:
▪ BEST IN CLASS: TOP 20%
▪ INDUSTRY AVERAGE: MID 50%
▪ LAGGARDS: BOTTOM 30%
▪ ALL OTHERS: INDUSTRY AVERAGE + LAGGARDS = 80%

Proprietary & Confidential
Best-in-class
Total respondents, N=115, Source: Aberdeen Group
26%
37%
21%
26%
47%
39%
46%
49%
58%
67%
0% 10% 20% 30% 40% 50% 60% 70% 80%
Contract repository
Supplier portal / network
Sourcing optimisation
Spend analysis
eAuctions
How do Best-in-Class use eSourcing?
Proprietary & Confidential
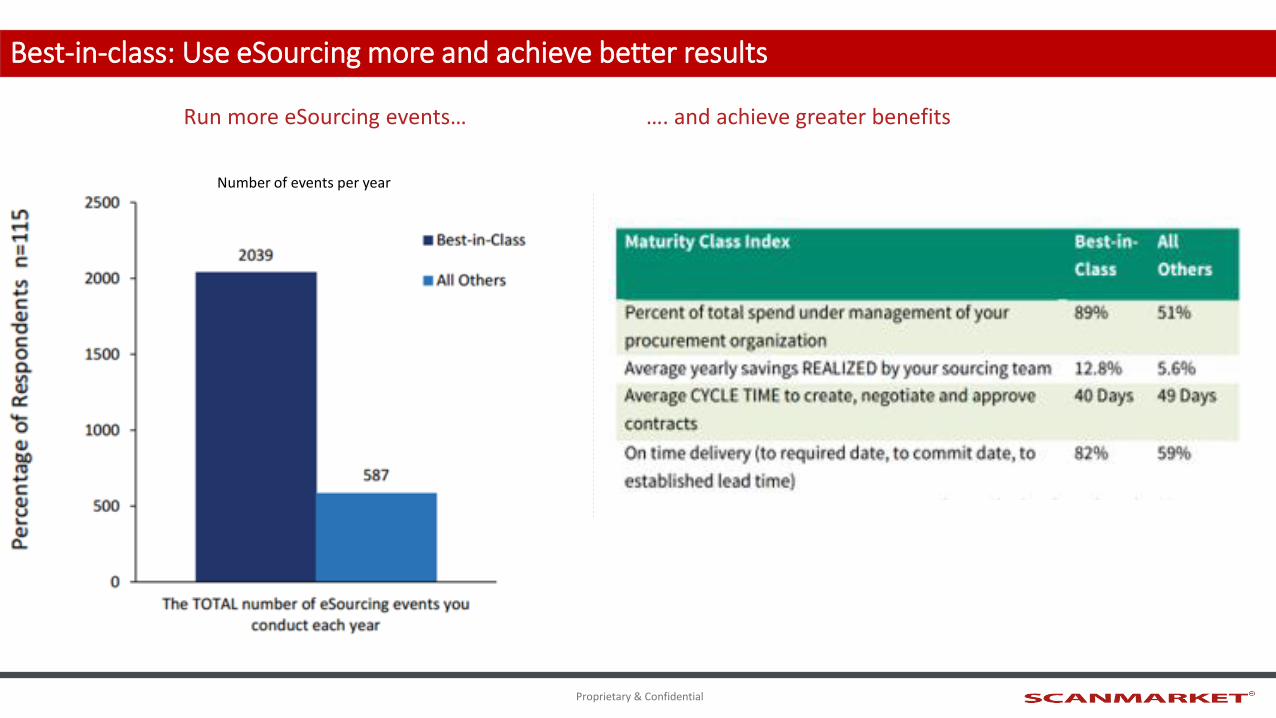
Best-in-class: Use eSourcing more and achieve better results
Run more eSourcing events… …. and achieve greater benefits
Number of events per year

Proprietary & Confidential
eRFx: Process Optimisation - Best-in-Class vs All Others
Use of Automation - DIRECT
Use of Automation - INDIRECT
59% vs 26%
50% vs 25%
Automation and supporting tools:
Proprietary & Confidential
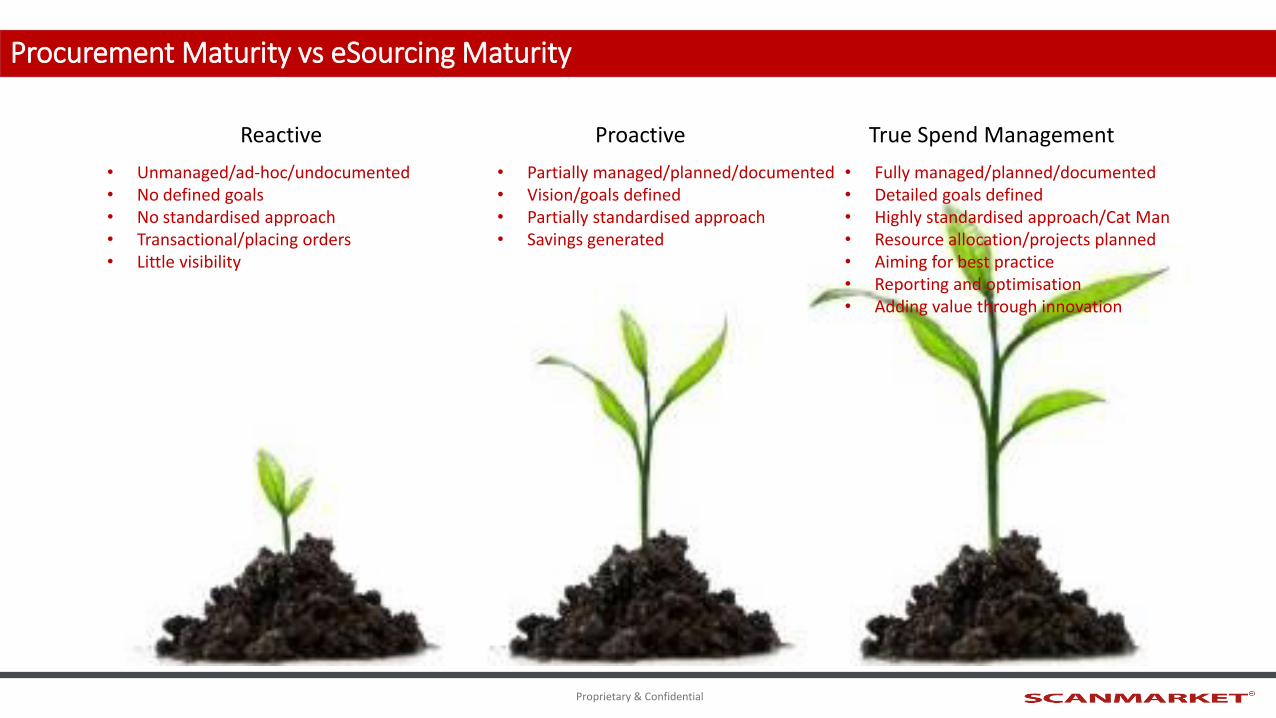
Procurement Maturity vs eSourcing Maturity
Reactive Proactive True Spend Management
• Unmanaged/ad-hoc/undocumented• No defined goals• No standardised approach• Transactional/placing orders• Little visibility
• Partially managed/planned/documented• Vision/goals defined• Partially standardised approach• Savings generated
• Fully managed/planned/documented• Detailed goals defined• Highly standardised approach/Cat Man• Resource allocation/projects planned• Aiming for best practice • Reporting and optimisation• Adding value through innovation
Proprietary & Confidential
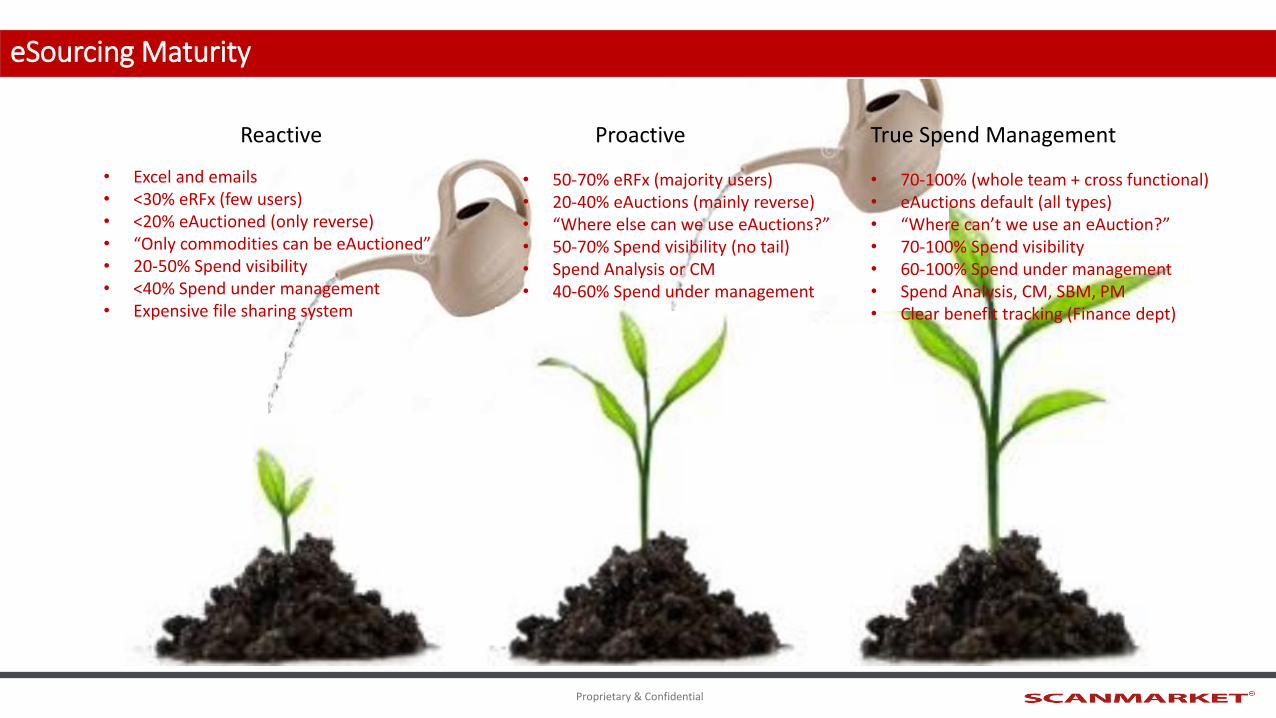
Reactive
• Excel and emails • <30% eRFx (few users)• <20% eAuctioned (only reverse)• “Only commodities can be eAuctioned”• 20-50% Spend visibility • <40% Spend under management• Expensive file sharing system
eSourcing Maturity
• 50-70% eRFx (majority users)• 20-40% eAuctions (mainly reverse)• “Where else can we use eAuctions?”• 50-70% Spend visibility (no tail)• Spend Analysis or CM • 40-60% Spend under management
• 70-100% (whole team + cross functional)• eAuctions default (all types)• “Where can’t we use an eAuction?”• 70-100% Spend visibility• 60-100% Spend under management• Spend Analysis, CM, SBM, PM• Clear benefit tracking (Finance dept)
True Spend ManagementProactive
Proprietary & Confidential
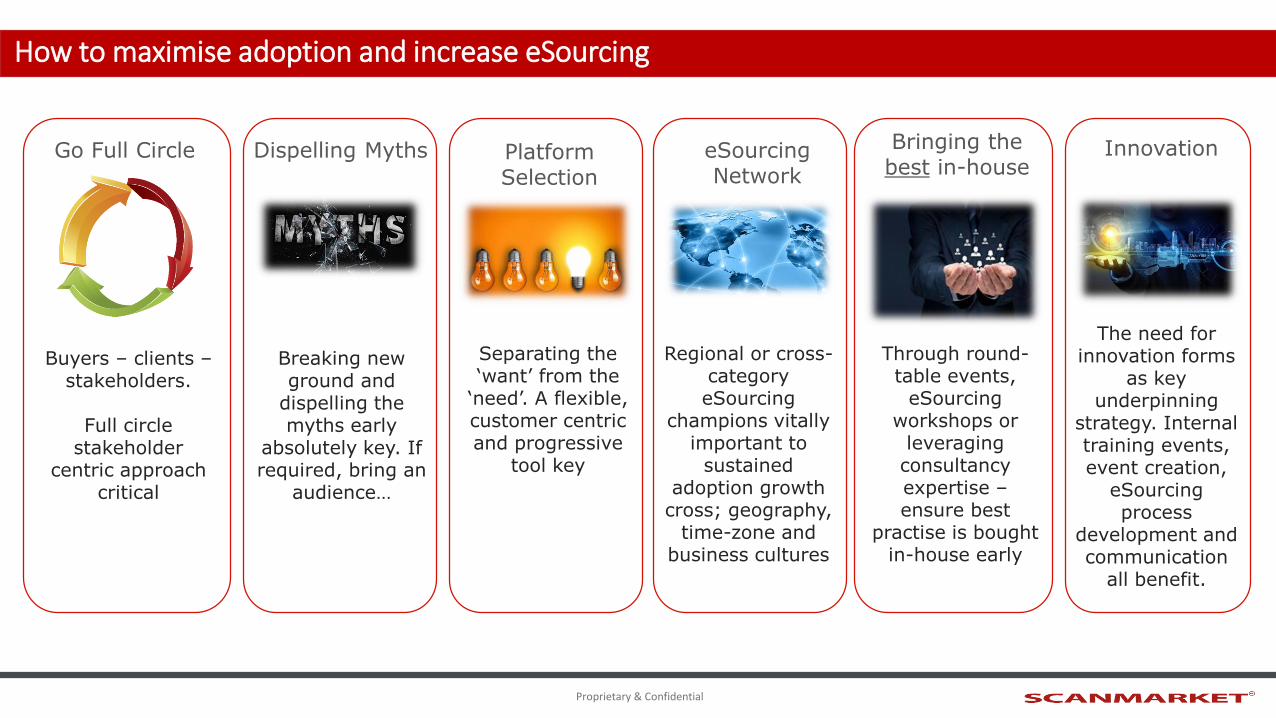
How to maximise adoption and increase eSourcing
Go Full Circle
Buyers – clients –stakeholders.
Full circle stakeholder
centric approach critical
Dispelling Myths
Breaking new ground and
dispelling the myths early
absolutely key. If required, bring an
audience…
Platform Selection
Separating the ‘want’ from the
‘need’. A flexible, customer centric and progressive
tool key
eSourcingNetwork
Regional or cross-category eSourcing
champions vitally important to
sustained adoption growth
cross; geography, time-zone and
business cultures
Bringing the best in-house
Through round-table events,
eSourcingworkshops or
leveraging consultancy expertise –ensure best
practise is bought in-house early
Innovation
The need for innovation forms
as key underpinning
strategy. Internal training events, event creation,
eSourcingprocess
development and communication
all benefit.

Proprietary & Confidential
eSourcing Presentation for:
Part 2 – Next Level eSourcing- Auctions: A Brief History- eAuction Types- 3C Model- Scanmarket Stats Analysis
Dan GianfredaSales Manager UK and Italy

Proprietary & Confidential
Auctions: A Brief History
500 BC – Babylon190 AD - Roman Empire1670s - Sweden 1600s – Dutch Auctions 1700s – London: First Auction Houses 1780s – London: Common place1990s – First eAuctions
Proprietary & Confidential
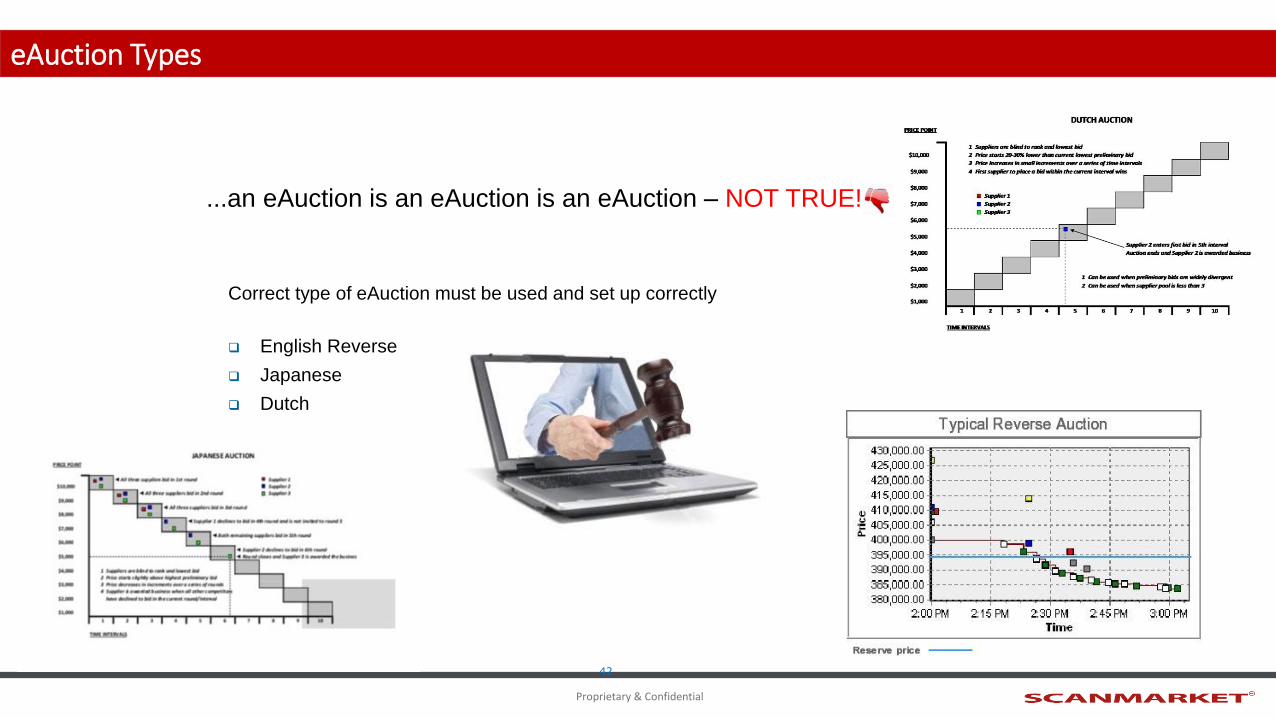
Which type to use
Correct type of eAuction must be used and set up correctly
English Reverse
Japanese
Dutch
42
eAuction Types
...an eAuction is an eAuction is an eAuction – NOT TRUE!
Proprietary & Confidential
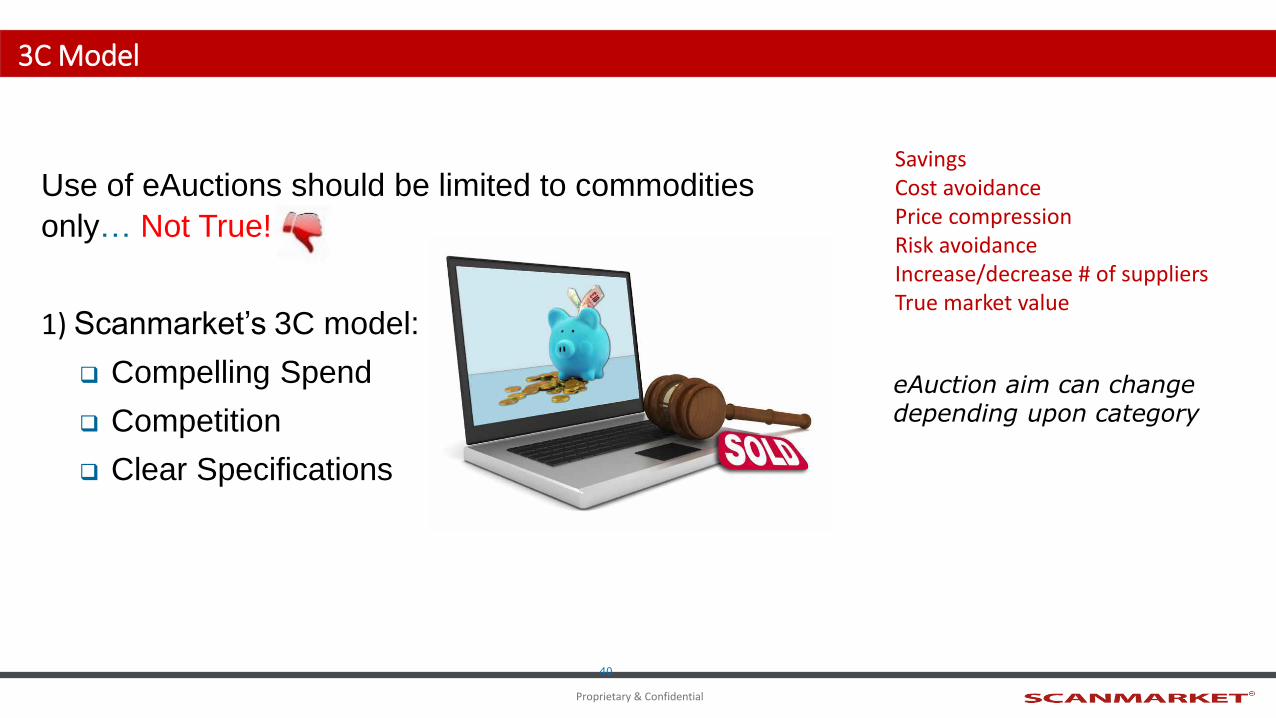
When to use eAuctions
Use of eAuctions should be limited to commodities
only… Not True!
1) Scanmarket’s 3C model:
Compelling Spend
Competition
Clear Specifications
40
3C Model
SavingsCost avoidancePrice compressionRisk avoidanceIncrease/decrease # of suppliersTrue market value
eAuction aim can change depending upon category
Proprietary & Confidential
Scanmarket: eAuction Statistics

Proprietary & Confidential
Savings are compared to current price
eAuction Statistics by year
14.47%
9.29%8.45%
15.26%
12.76%
10.01% 9.69%
12.37%
10.87%
8.66%
12.28%
8.63%
11.06%
0%
2%
4%
6%
8%
10%
12%
14%
16%
18%
2006 2007 2008 2009 2010 2011 2012 2013 2014 2015 2016 2017
Average savings in % compared to current price per year
Savings in % per Year (auctions) Average saving
2006-2017Q3
Proprietary & Confidential
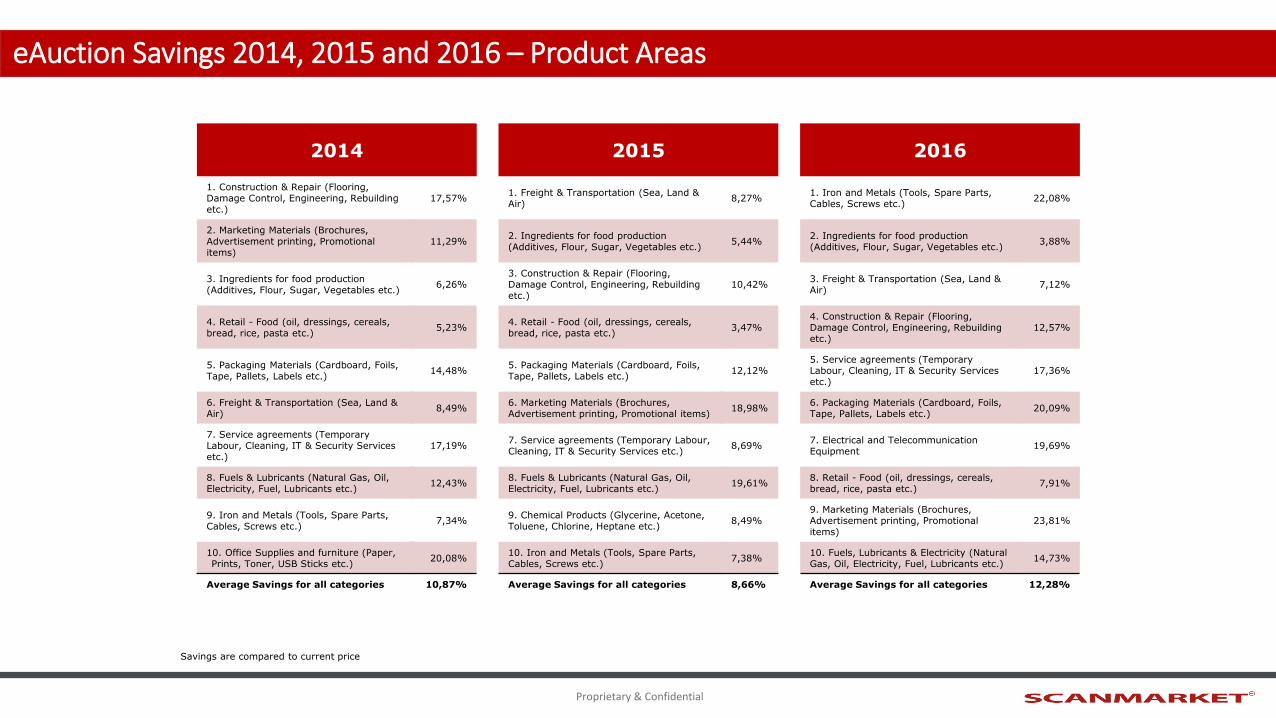
2014 2015 2016
1. Construction & Repair (Flooring, Damage Control, Engineering, Rebuilding etc.)
17,57%1. Freight & Transportation (Sea, Land & Air)
8,27%1. Iron and Metals (Tools, Spare Parts, Cables, Screws etc.)
22,08%
2. Marketing Materials (Brochures, Advertisement printing, Promotional items)
11,29%2. Ingredients for food production (Additives, Flour, Sugar, Vegetables etc.)
5,44%2. Ingredients for food production (Additives, Flour, Sugar, Vegetables etc.)
3,88%
3. Ingredients for food production (Additives, Flour, Sugar, Vegetables etc.)
6,26%3. Construction & Repair (Flooring, Damage Control, Engineering, Rebuilding etc.)
10,42%3. Freight & Transportation (Sea, Land & Air)
7,12%
4. Retail - Food (oil, dressings, cereals, bread, rice, pasta etc.)
5,23%4. Retail - Food (oil, dressings, cereals, bread, rice, pasta etc.)
3,47%4. Construction & Repair (Flooring, Damage Control, Engineering, Rebuilding etc.)
12,57%
5. Packaging Materials (Cardboard, Foils, Tape, Pallets, Labels etc.)
14,48%5. Packaging Materials (Cardboard, Foils, Tape, Pallets, Labels etc.)
12,12%5. Service agreements (Temporary Labour, Cleaning, IT & Security Services etc.)
17,36%
6. Freight & Transportation (Sea, Land & Air)
8,49%6. Marketing Materials (Brochures, Advertisement printing, Promotional items)
18,98%6. Packaging Materials (Cardboard, Foils, Tape, Pallets, Labels etc.)
20,09%
7. Service agreements (Temporary Labour, Cleaning, IT & Security Services etc.)
17,19%7. Service agreements (Temporary Labour, Cleaning, IT & Security Services etc.)
8,69%7. Electrical and Telecommunication Equipment
19,69%
8. Fuels & Lubricants (Natural Gas, Oil, Electricity, Fuel, Lubricants etc.)
12,43%8. Fuels & Lubricants (Natural Gas, Oil, Electricity, Fuel, Lubricants etc.)
19,61%8. Retail - Food (oil, dressings, cereals, bread, rice, pasta etc.)
7,91%
9. Iron and Metals (Tools, Spare Parts, Cables, Screws etc.)
7,34%9. Chemical Products (Glycerine, Acetone, Toluene, Chlorine, Heptane etc.)
8,49%9. Marketing Materials (Brochures, Advertisement printing, Promotional items)
23,81%
10. Office Supplies and furniture (Paper, Prints, Toner, USB Sticks etc.)
20,08%10. Iron and Metals (Tools, Spare Parts, Cables, Screws etc.)
7,38%10. Fuels, Lubricants & Electricity (Natural Gas, Oil, Electricity, Fuel, Lubricants etc.)
14,73%
Average Savings for all categories 10,87% Average Savings for all categories 8,66% Average Savings for all categories 12,28%
eAuction Savings 2014, 2015 and 2016 – Product Areas
Savings are compared to current price
Proprietary & Confidential
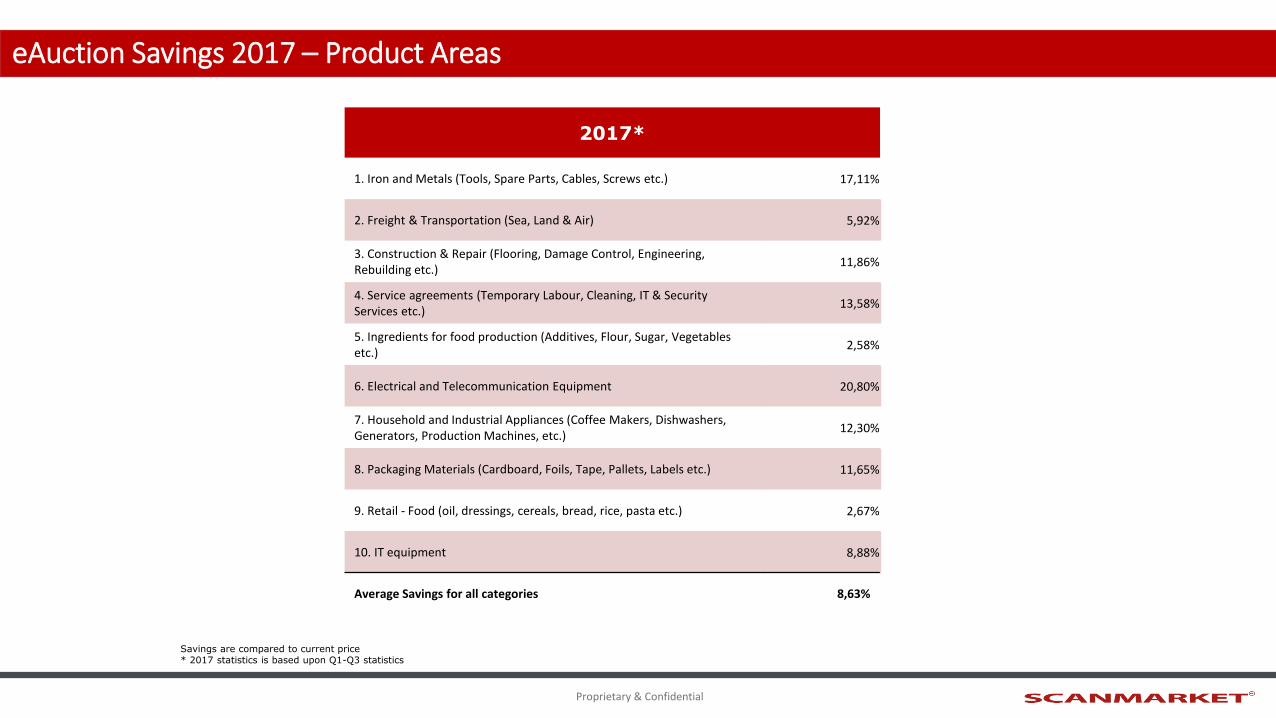
2017*
1. Iron and Metals (Tools, Spare Parts, Cables, Screws etc.) 17,11%
2. Freight & Transportation (Sea, Land & Air) 5,92%
3. Construction & Repair (Flooring, Damage Control, Engineering, Rebuilding etc.)
11,86%
4. Service agreements (Temporary Labour, Cleaning, IT & Security Services etc.)
13,58%
5. Ingredients for food production (Additives, Flour, Sugar, Vegetables etc.)
2,58%
6. Electrical and Telecommunication Equipment 20,80%
7. Household and Industrial Appliances (Coffee Makers, Dishwashers, Generators, Production Machines, etc.)
12,30%
8. Packaging Materials (Cardboard, Foils, Tape, Pallets, Labels etc.) 11,65%
9. Retail - Food (oil, dressings, cereals, bread, rice, pasta etc.) 2,67%
10. IT equipment 8,88%
Average Savings for all categories 8,63%
eAuction Savings 2017 – Product Areas
Savings are compared to current price* 2017 statistics is based upon Q1-Q3 statistics
Proprietary & Confidential
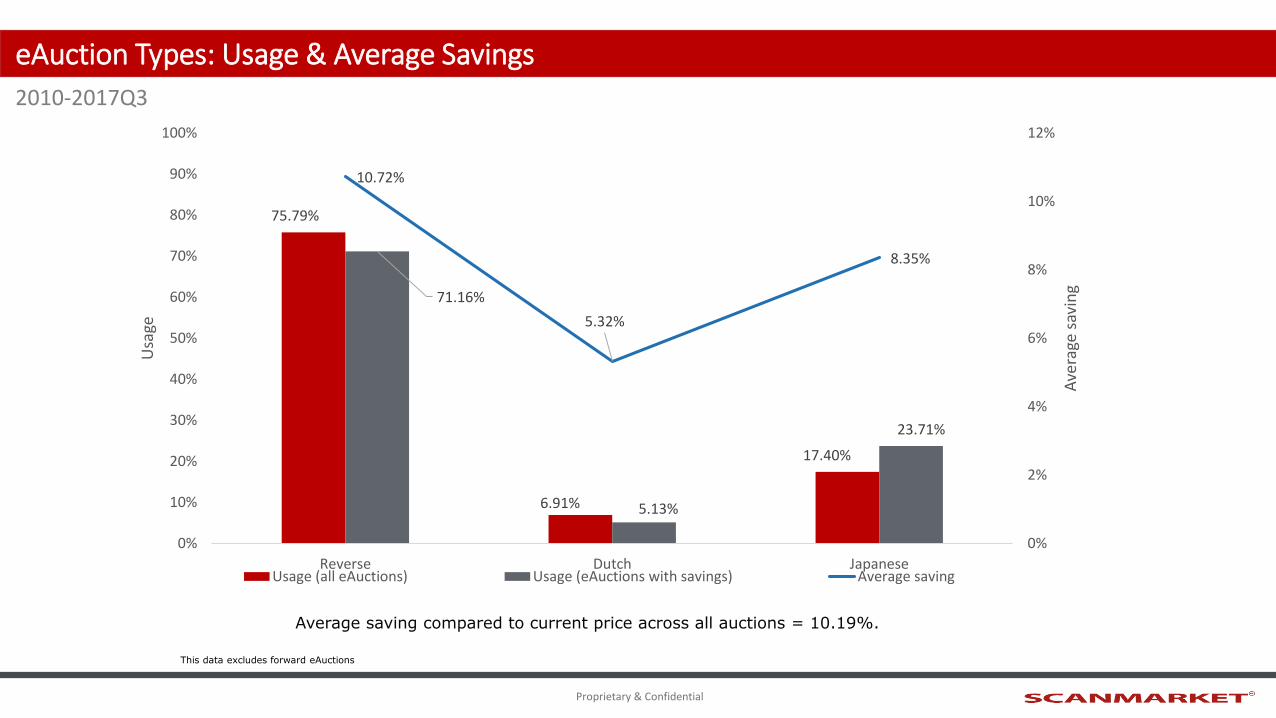
eAuction Types: Usage & Average Savings
Average saving compared to current price across all auctions = 10.19%.
75.79%
6.91%
17.40%
71.16%
5.13%
23.71%
10.72%
5.32%
8.35%
0%
2%
4%
6%
8%
10%
12%
0%
10%
20%
30%
40%
50%
60%
70%
80%
90%
100%
Reverse Dutch Japanese
Ave
rage
sav
ing
Usa
ge
Usage (all eAuctions) Usage (eAuctions with savings) Average saving
This data excludes forward eAuctions
2010-2017Q3
Proprietary & Confidential
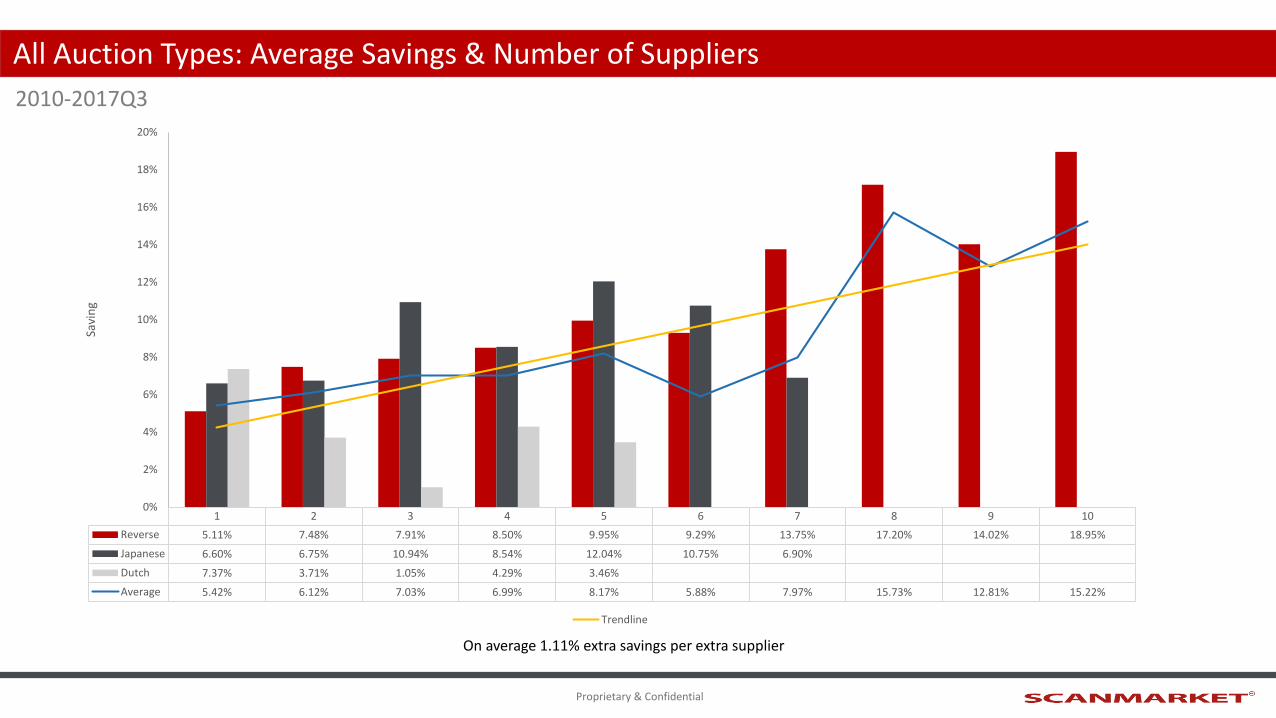
All Auction Types: Average Savings & Number of Suppliers
1 2 3 4 5 6 7 8 9 10
Reverse 5.11% 7.48% 7.91% 8.50% 9.95% 9.29% 13.75% 17.20% 14.02% 18.95%
Japanese 6.60% 6.75% 10.94% 8.54% 12.04% 10.75% 6.90%
Dutch 7.37% 3.71% 1.05% 4.29% 3.46%
Average 5.42% 6.12% 7.03% 6.99% 8.17% 5.88% 7.97% 15.73% 12.81% 15.22%
0%
2%
4%
6%
8%
10%
12%
14%
16%
18%
20%
Savi
ng
Trendline
2010-2017Q3
On average 1.11% extra savings per extra supplier
Proprietary & Confidential
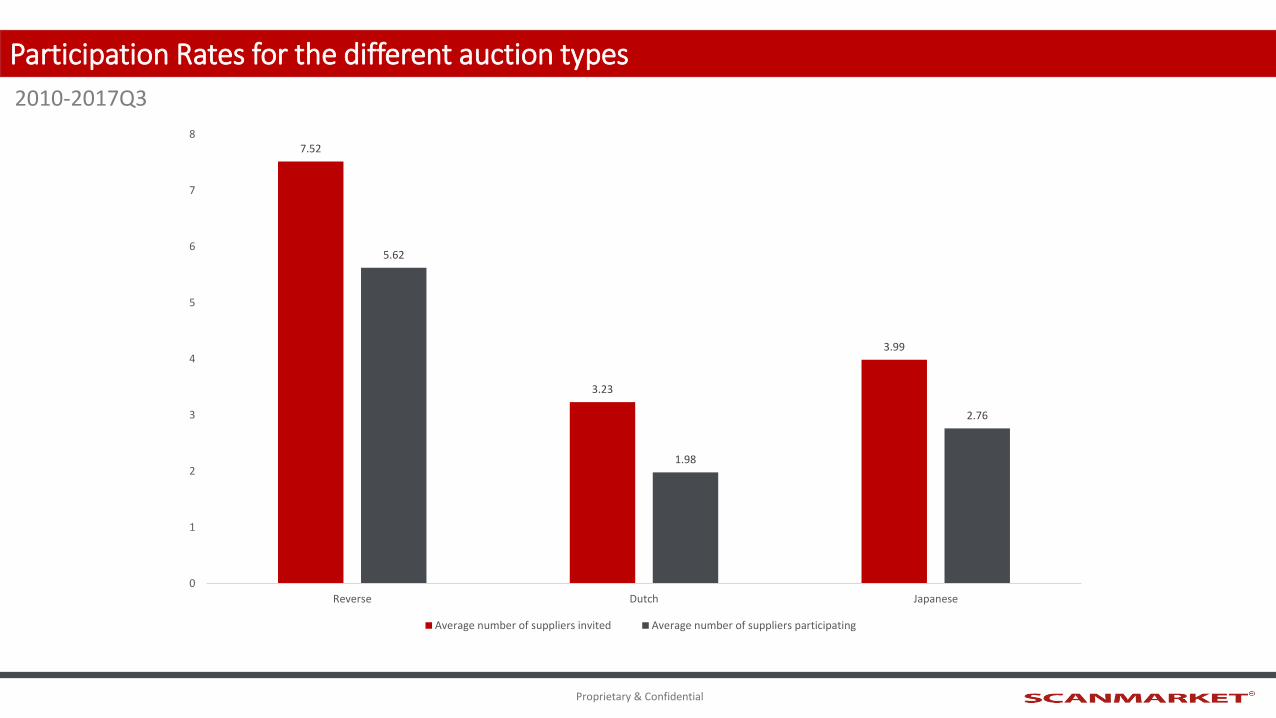
Participation Rates for the different auction types
7.52
3.23
3.99
5.62
1.98
2.76
0
1
2
3
4
5
6
7
8
Reverse Dutch Japanese
Average number of suppliers invited Average number of suppliers participating
2010-2017Q3
Proprietary & Confidential
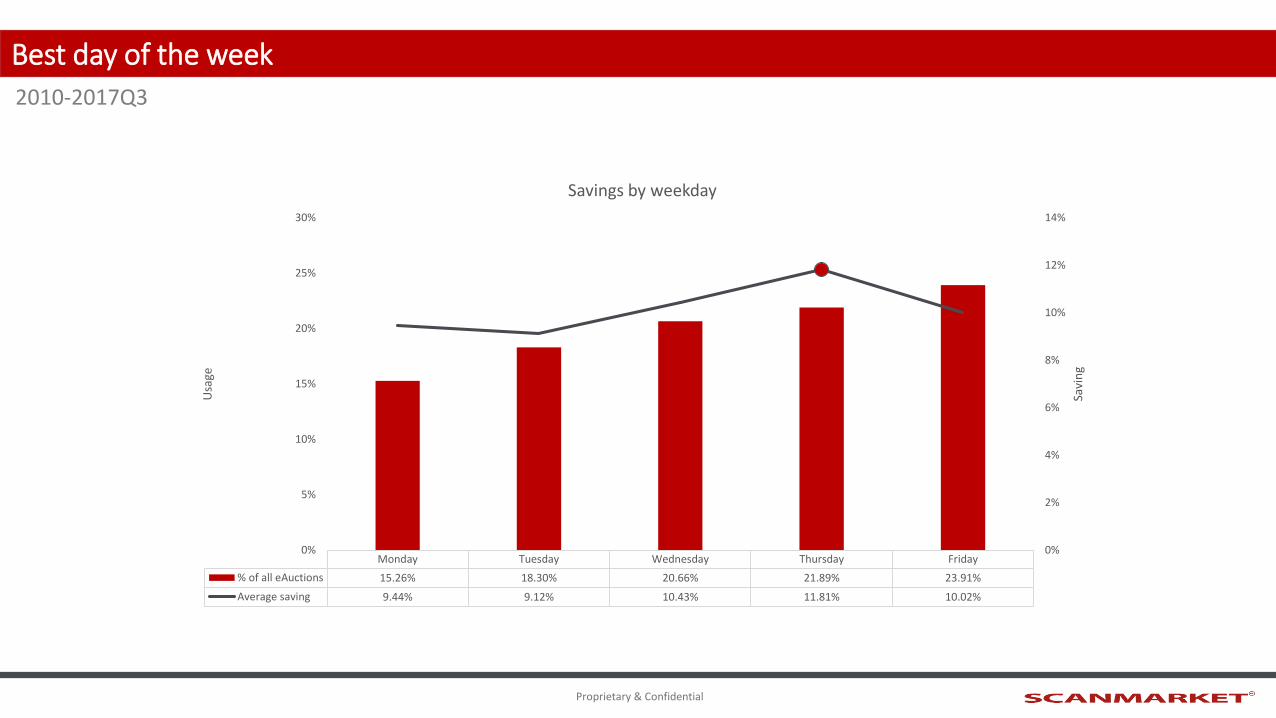
Best day of the week
2010-2017Q3
Monday Tuesday Wednesday Thursday Friday
% of all eAuctions 15.26% 18.30% 20.66% 21.89% 23.91%
Average saving 9.44% 9.12% 10.43% 11.81% 10.02%
0%
2%
4%
6%
8%
10%
12%
14%
0%
5%
10%
15%
20%
25%
30%
Savi
ng
Usa
geSavings by weekday

Proprietary & Confidential
Best month of the year
2010-2017Q3
January February March April May June July August September October November December
% of all eAuctions 6.04% 7.75% 7.69% 8.56% 8.47% 10.48% 7.71% 7.31% 10.46% 7.29% 9.30% 8.96%
Average saving 11.26% 10.49% 9.53% 7.73% 9.43% 12.54% 9.64% 11.77% 10.77% 7.62% 10.27% 10.46%
0%
2%
4%
6%
8%
10%
12%
14%
-1%
1%
3%
5%
7%
9%
11%
13%
15%
Savi
ng
Usa
geSavings by month

Proprietary & Confidential
In Summary
ScanmarketDan Gianfreda
[email protected]: +44 7766 746196
For further information please contact:
• Best-in-class companies are utilising eSourcing to a high degree
• Increasing eSourcing usage will help your organisation’s growth on the procurement maturity model
• Engage and consider all parties
• eAuctions just plain work – across most categories
• Use price and none-price factors to replicate real-life scenario
• Feel free to contact me for any further info or advice