Culture Part 2: Language AP Human Geography Parkview High School.

Armona Union Elementary
© 2013 Evaluation, Research, and Cyber-Technology http://www.ercgrants.com October 11, 2013 p.1
Parkview Middle School After School Program Report Card for 2012-2013
This report describes the participants, participation levels, and outcomes of the 2012-2013
after school program at Parkview Middle School. Participant data includes the gender, ethnicity, English Learner
(EL) status, and grade level of students. Outcomes measured include students’ changes in regular school day
attendance when compared with the previous year and performance on the English-Language Arts (ELA) and Math
portions of the California Standards Test (CST). The relationship between after school program attendance and
these key outcomes were examined.
During the 2012-2013 school year, a total of 66 students participated in the after school program for at least one
day. Participation levels are reported and compared by grade level in the next section of this report.
Section 1.1 – Gender and Ethnicity
Figure 1 Figure 2
California Standards Test (CST) Mathematics
California Standards Test (CST) English Language Arts
Changes in Regular School Day Attendance
Male Female
57.6%
42.4%48.5%
51.5%
Gender Composition2012-2013
After School Participants Non-After School Participants
Asian Black Hispanic White
85.2%
14.8%
0.3% 3.0%
81.7%
15.0%
Ethnic Composition2012-2013
After School Participants Non-After School Participants

Armona Union Elementary
© 2013 Evaluation, Research, and Cyber-Technology http://www.ercgrants.com October 11, 2013 p.2
Section 1.2 – Grade Level and English Learner (EL) Status
Figure 3 Figure 4
Section 2.1 – Program Attendance Categories
After school participants were grouped into five attendance
categories for the after school program (1-47 days, 48-108
days, 109-161 days, 162-171 days, or 172-180 days).
Students were grouped into five quintiles1 based on the
number of days they attended the after school
program. Quintile groupings were determined by assigning
each after school participant a percentile rank and dividing
them into five equal percentile groups (1st-19th, 20th-39th,
40th-59th, 60th-79th, 80th-99th). These quintiles, or “program
attendance categories”, are used in the analysis of
measurable outcomes throughout this report2.
Section 2.2 – Number of Days Students Attended the After School Program
The average after school participant attended the program for approximately 153.5 days. The mean number of days that students attended the after school program is disaggregated by grade level in Figure 5.
Figure 5
K-3rd 4th-6th 7th-8th
66.7%
33.3%
51.2% 48.8%
Grade Level Composition2012-2013
After School Participants Non-After School Participants
EL Non-EL
45.5%54.5%
23.0%
77.0%
English Learner Composition2012-2013
After School Participants Non-After School Participants
K-3 (n=0)
4-6 (n=44)
7-8 (n=22)
Overall (n=66)
146.2
168.3
153.5
Mean Number of Days Students Attended the After School ProgramBy Grade Level, 2012-2013
Student Totals
After School Participants 66
Total Student Population (from CBEDS) 409
After School % of School(s) Population 16.1%
Participant Composition
Gender EL Status Male 38 EL 30
Female 28 Non-EL 36
No Data 0 No Data 0
Grade Days Attended
K-3rd 0 1-47 3
4th-6th 44 48-108 7
7th-8th 22 109-161 8
No Data 0 162-171 17
172-180 31

Armona Union Elementary
© 2013 Evaluation, Research, and Cyber-Technology http://www.ercgrants.com October 11, 2013 p.3
Section 3.1 – Mean Change in Regular Day Attendance by After School Attendance Category
Figure 6 shows the relationship between change in regular school day attendance and attending the after school program. Changes in attendance from the baseline year are shown for each of five attendance categories. Changes represent the difference (+ or -) in the mean number of regular school days after school participants attended in the target year when compared with the baseline year3.
The green line indicates mean changes in regular day attendance for after school participants. Similar data is shown in blue for non-after school participants.
Figure 6
+4.11
-0.21
-5.45
+0.10
+0.89
+0.64
-6.00
-4.00
-2.00
+0.00
+2.00
+4.00
+6.00
1-47 (n=2)
48-108 (n=7)
109-161 (n=7)
162-171 (n=17)
172-180 (n=31)
Day
s
Days Attended the After School Program
Mean Change in Regular School Day AttendanceAfter School Participants vs. Non-Participants, 2012-2013
After School Participants (n)=64 Non-After School Participants (n)=330
Regular School Day Attendance
(per student, 2-years required)+/- Mean Change
in Attendance
Armona Union Elementary
© 2013 Evaluation, Research, and Cyber-Technology http://www.ercgrants.com October 11, 2013 p.4
The relationship between after school program participation and academic achievement in English-Language Arts
(ELA) and Math was analyzed using California Standards Test Results (CST) from May 2013.
Section 4.1 –California Standards Test (CST) Performance in English -Language Arts (ELA)
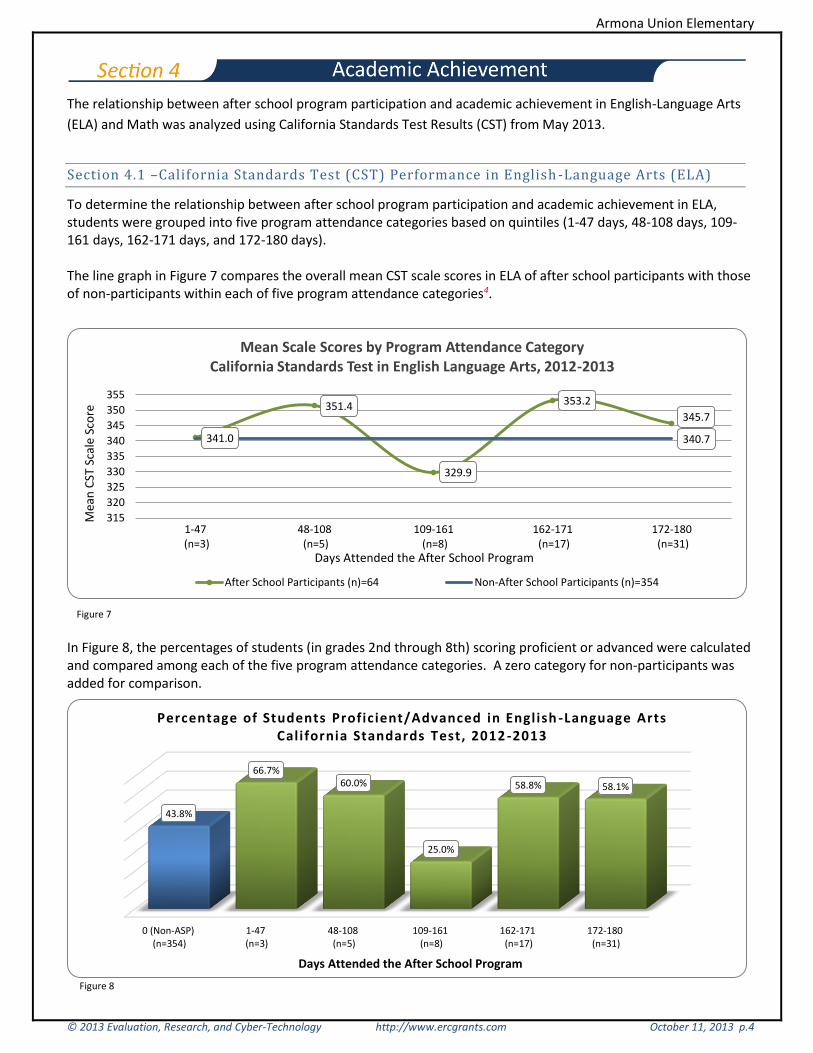
To determine the relationship between after school program participation and academic achievement in ELA, students were grouped into five program attendance categories based on quintiles (1-47 days, 48-108 days, 109-161 days, 162-171 days, and 172-180 days). The line graph in Figure 7 compares the overall mean CST scale scores in ELA of after school participants with those of non-participants within each of five program attendance categories4.
Figure 7 In Figure 8, the percentages of students (in grades 2nd through 8th) scoring proficient or advanced were calculated and compared among each of the five program attendance categories. A zero category for non-participants was added for comparison.
Figure 8
341.0
351.4
329.9
353.2
345.7
340.7
315
320
325
330
335
340
345
350
355
1-47 (n=3)
48-108 (n=5)
109-161 (n=8)
162-171 (n=17)
172-180 (n=31)
Mea
n C
ST S
cale
Sco
re
Days Attended the After School Program
Mean Scale Scores by Program Attendance CategoryCalifornia Standards Test in English Language Arts, 2012-2013
After School Participants (n)=64 Non-After School Participants (n)=354
0 (Non-ASP) (n=354)
1-47 (n=3)
48-108 (n=5)
109-161 (n=8)
162-171 (n=17)
172-180 (n=31)
43.8%
66.7%60.0%
25.0%
58.8% 58.1%
Days Attended the After School Program
Percentage of Students Proficient/Advanced in English -Language ArtsCalifornia Standards Test, 2012 -2013
Armona Union Elementary
© 2013 Evaluation, Research, and Cyber-Technology http://www.ercgrants.com October 11, 2013 p.5
Section 4.2 –California Standards Test (CST) Performance Math
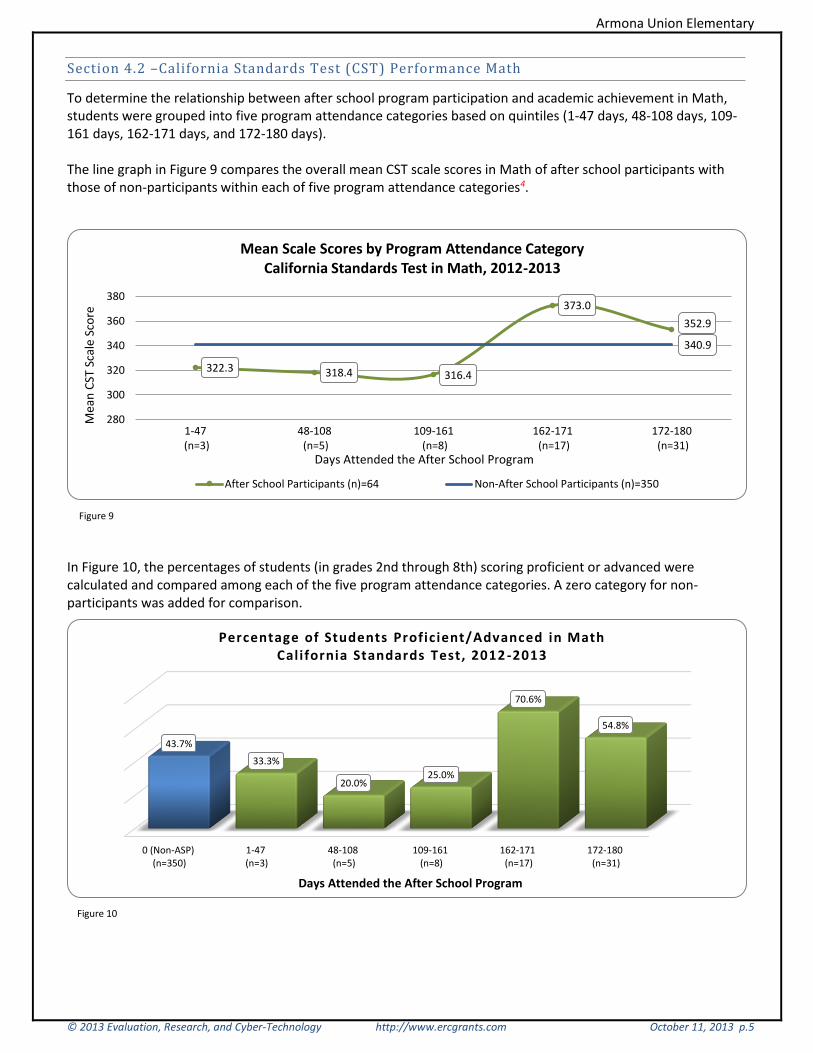
To determine the relationship between after school program participation and academic achievement in Math, students were grouped into five program attendance categories based on quintiles (1-47 days, 48-108 days, 109-161 days, 162-171 days, and 172-180 days). The line graph in Figure 9 compares the overall mean CST scale scores in Math of after school participants with those of non-participants within each of five program attendance categories4.
Figure 9
In Figure 10, the percentages of students (in grades 2nd through 8th) scoring proficient or advanced were calculated and compared among each of the five program attendance categories. A zero category for non-participants was added for comparison.
Figure 10
322.3 318.4 316.4
373.0
352.9
340.9
280
300
320
340
360
380
1-47 (n=3)
48-108 (n=5)
109-161 (n=8)
162-171 (n=17)
172-180 (n=31)
Mea
n C
ST S
cale
Sco
re
Days Attended the After School Program
Mean Scale Scores by Program Attendance CategoryCalifornia Standards Test in Math, 2012-2013
After School Participants (n)=64 Non-After School Participants (n)=350
0 (Non-ASP) (n=350)
1-47 (n=3)
48-108 (n=5)
109-161 (n=8)
162-171 (n=17)
172-180 (n=31)
43.7%
33.3%
20.0%25.0%
70.6%
54.8%
Days Attended the After School Program
Percentage of Students Proficient/Advanced in MathCalifornia Standards Test, 2012 -2013

Armona Union Elementary
© 2013 Evaluation, Research, and Cyber-Technology http://www.ercgrants.com October 11, 2013 p.6
1 A quantile is defined as class of values of a variate that divides the
total frequency of a sample or population into a given number of
equal proportions. Specialized quantiles, those that split the
sample or population into a specific number of groups, are given
special names such as tertiles (3 groups), quartiles (4 groups), and
deciles (10 groups). This report utilizes quintiles (5 groups).
Quintile ranges were determined by assigning each after school
participant a percentile rank based on the number of days they
attended the program and dividing them into five equal percentile
groups (1st-19th, 20th-39th, 40th-59th, 60th-79th, 80th-99th). For
this reason, the number of students in each quintile group may
not be equal. In other words, if you have a very large number of
students with 3 days of attendance in the first quintile and a very
small number of students with 4 days of attendance in the second
quintile you cannot randomly choose some 3-day students to send
over to the second quintile to make the groups equally sized.
2 Summer attendance is ignored for the sake of determining dosage
(in order to base dosage on a 180 day school year). In addition,
students considered as "Summer Only" are not included in either
the after school or non-after school populations.
3 The algorithm for calculating mean change in regular school days
attended over the previous year takes into account school years
with differing days of operation such as years with furlough days.
Only students for whom 2 years of attendance data was available
(for each line respectively) are included in the sample for this
chart.
4 In some instances, the data in a subsequent figure may show a
high % of Proficient/Advanced students while the data in this
figure may show a low mean CST scaled score and vice-versa. This
phenomenon is normally a result of a distribution of scores with
many outliers. For example, a sample with a large numbers of
students scoring Proficient/Advanced and a large number of
students scoring Far Below Basic may yield a high % in a
subsequent figure but a low or average mean in this figure.

Armona Union Elementary
© 2013 Evaluation, Research, and Cyber-Technology http://www.ercgrants.com October 11, 2013 p.7
Program Highlights
Mean Number of Days Students Attended the After School Program (Figure 5)
After school participants attended the program for an average of 153.5 days (4.27 days per week).
Mean Change In Regular School Day Attendance (Figure 6)
High attenders increased their regular school day attendance (over the previous year) by 0.25 days more
than non-after school participants.
CST ELA Mean Scale Score (Figure 7)
High attenders scored an average of 4.7 scale score points higher than low attenders on the CST ELA.
High attenders scored an average of 5.0 scale score points higher than non-after school participants on
the CST ELA.
CST ELA Percent Proficient/Advanced (Figure 8)
The percentage of high attenders scoring Proficient or Advanced on the CST ELA was 14.3% greater than
non-after school participants.
CST Math Mean Scale Score (Figure 9)
High attenders scored an average of 30.6 scale score points higher than low attenders on the CST Math.
High attenders scored an average of 12.0 scale score points higher than non-after school participants on
the CST Math.
CST MATH Percent Proficient/Advanced (Figure 10)
The percentage of high attenders scoring Proficient or Advanced on the CST Math was 21.5% greater than
low attenders.
The percentage of high attenders scoring Proficient or Advanced on the CST Math was 11.1% greater than
non-after school participants.