PARCC Performance Level Setting Maryland State Board of Education Update September 22, 2015 Revised...
20
PARCC Performance Level Setting Maryland State Board of Education Update September 22, 2015 Revised 9/22/15
-
Upload
walter-burke -
Category
Documents
-
view
213 -
download
0
Transcript of PARCC Performance Level Setting Maryland State Board of Education Update September 22, 2015 Revised...

PARCC Performance Level Setting
Maryland State Board of Education Update
September 22, 2015
Revised 9/22/15

Rollout of New Standards
Credit: Education Week
2009:4 states with
common standards
2015:43 state plus DC
common standards
Revised 9/22/15

Transition Timeline Draft and finalized Common Core State Standards,
2009-2010 Launched PARCC Consortium, 2010 Finalized new assessment design and released
Model Content Frameworks, 2011 Defined Performance Level Descriptors for levels 1-5
designating 4 as threshold for college readiness, 2012
Field Tested over 1 million students, 2014
Revised 9/22/15

2014-15 PARCC Administration Over 5 million students tested in 12 states
1.2 Million students test in one day 204,000 students in one hour
Revised 9/22/15
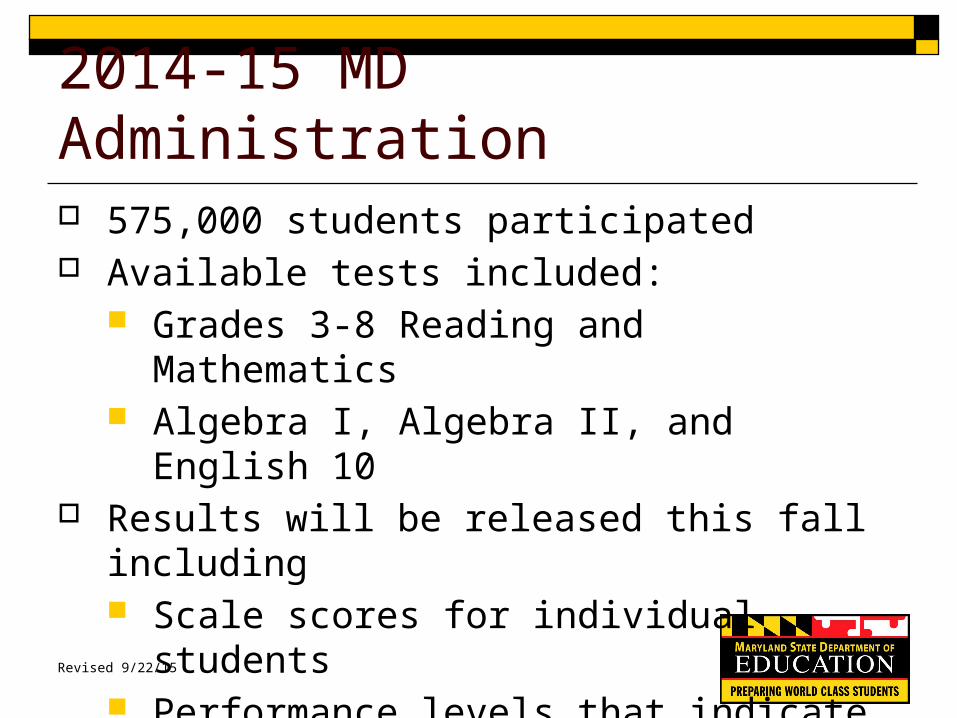
2014-15 MD Administration 575,000 students participated Available tests included:
Grades 3-8 Reading and Mathematics Algebra I, Algebra II, and English 10
Results will be released this fall including Scale scores for individual students Performance levels that indicate how the
scale score compares to performance expectations
Revised 9/22/15

PARCC Performance Levels The final names of the Performance
levels are as follows:
Levels 4 and 5 indicate college and career readiness
PARCC Performance Levels
Level 5 Exceeded expectations
Level 4 Met expectations
Level 3 Approached expectations
Level 2 Partially met expectations
Level 1 Did not yet meet expectations
Revised 9/22/15

What is performance level setting? A systematic process that results in
recommended threshold scores (cut scores) for the 5 performance levels that will be used to report the PARCC results.
Level 1 Level 2 Level 3 Level 4 Level 5
Threshold Scores
Revised 9/22/15

PLS Meetings and Dates
A total of 12 committees of 20 panelists each 6 High School Committees 6 Grades 3-8 Committees
Mathematics ELA/ Literacy Meeting Dates
Algebra II Grade 11
July 27 – 31, 2015Geometry Grade 10
Algebra I Grade 9
Grades 7-8 Grades 7-8 August 17 – 21, 2015
Grades 5-6 Grades 5-6August 24 – 28, 2015
Grades 3-4 Grades 3-4
Revised 9/22/15

Panelist Membership by StateEnglish/Language Arts
State
Grades 3-8 High School
Gd 3/4 Gd 5/6 Gd 7/8 Total Grade 9 Grade 10 Grade 11 Total
AR 1 0 0 1 0 1 2 3
CO 2 2 3 7 2 4 2 8
DC 1 3 2 6 1 1 1 3
IL 1 2 2 5 1 1 1 3
MA 2 2 2 6 2 2 2 6
MD 2 1 2 5 2 3 3 8
MS 1 1 2 4 1 1 1 3
NJ 2 0 2 4 2 1 1 4
NM 1 2 2 5 2 2 2 6
OH 0 1 0 1 2 0 1 3
RI 2 2 1 5 2 1 1 4
National 0 0 0 0 0 0 0 0
Total 15 16 18 49 17 17 17 51Revised 9/22/15

Panelist Membership by RoleEnglish/Language Arts
Position
Grades 3-8 High School
Gd 3/4
Gd 5/6
Gd 7/8 Total Gd
9Gd 10
Gd 11 Total
Teacher (K-12) 6 8 7 21 12 9 6 27
Teacher (Higher Education)
1 0 0 1 0 4 4 8
Administrator 5 3 3 11 2 3 3 8Other 3 5 8 16 3 1 4 8Total 15 16 18 49 17 17 17 51
Revised 9/22/15

Panelist Membership by StateMathematics
State
Grades 3-8 MathGd 3/4 Gd 5/6 Gd 7/8 Total Alg I Geo/ Alg II Total
AR 0 1 2 3 1 1 1 3CO 2 3 1 6 2 1 3 6DC 1 2 2 5 2 1 2 5IL 2 2 2 6 1 2 2 5MA 3 1 2 6 1 2 2 5MD 1 1 3 5 2 1 2 5MS 2 0 2 4 0 0 0 0NJ 2 2 2 6 1 1 2 4NM 1 2 1 4 2 2 1 5OH 1 0 1 2 1 3 3 7RI 2 2 2 6 2 1 2 5National 0 0 0 0 2 2 0 4Total 17 16 20 53 17 17 20 54
Revised 9/22/15

Panelist Membership by RoleMathematics
Position
Grades 3-8 High School
Gd 3/4
Gd 5/6
Gd 7/8 Total Alg I Geo Alg II Total
Teacher (K-12) 6 8 7 21 8 8 10 26
Teacher (Higher Education)
1 0 0 1 3 2 5 10
Administrator 5 3 3 11 2 2 2 6Other 3 5 8 16 4 5 3 12Total 15 16 18 49 17 17 20 54
Revised 9/22/15

How were panelists selected? LEA nominations of 25 K-12 educators
and higher education faculty Based upon their:
Strong content knowledge in ELA and Math Familiarity with the Common Core Standards Current or recent teaching experience Experience with diverse student populations
Revised 9/22/15

The Role of the Panelists Each panelist was tasked with making
recommendations regarding what students at each performance level would be able to demonstrate in terms of their knowledge, skills and abilities.
They did this by evaluating test questions on each test judging how many points a student would likely earn.
Revised 9/22/15

Item-Level Judgment Task
“How many points would a
borderline Level 3 student likely
earn if they answered the question?”
A student whose performance is described by the Level 3 PLDs as adequate command of CCSS for the grade/course
Bottom of the range of Level 3 students (just-barely a Level 3 student)
2 out of 3 times (or 2/3rds of the time)

Item-level Judgment Task Points are summed and thresholds calculated Panelists collaborate sharing their results
forming consensus around recommendations Additional information is presented for
comparison purposes Outside data i.e. SAT, ACT, PISA, NAEP,
other state assessment data Impact data as a result of the
recommendationsRevised 9/22/15

Next steps after PLS meetings? Threshold scores are presented to the PARCC
Governing Board (composed of the Chief State Officers from each member state) and the Advisory Committee on College Readiness (composed of Higher Education Executive Officers from each member state) for adoption August 14, 2015 for High School September 9, 2015 for grades 3-8
Revised 9/22/15

Why aren’t results available now? Data not final until…
High School – early October Grades 3-8 – end of October
Preliminary data limited to only online forms 18.4% Maryland test takers used paper and
would not be represented in data Harford County as a whole would not be
represented in data
Revised 9/22/15

Performance Level Adoption and Reporting Results
PARCC TestMD State Board of
EducationPaper Home Reports Arriving in Districts
High School Results (English 10, Algebra I, and Algebra II)
October 27, 2015 November 3, 2015
Grades 3-8 Results (English/Language Arts and Mathematics)
December 8, 2015November 30, 2015 (embargoed until after BOE meeting)
Revised 9/22/15

Comments/Questions?
Revised 9/22/15