Parasol Level-1 Product Data Format and User Manual flying is formation with Aqua, ... wedge prism...
33
Parasol Level-1 Product Data Format and User Manual Ed. 1 - Rev. 3, Apr 13 th , 2006 Prepared by F.-M. Bréon (CEA/LSCE) With help from the CNES Parasol team
-
Upload
truongquynh -
Category
Documents
-
view
215 -
download
0
Transcript of Parasol Level-1 Product Data Format and User Manual flying is formation with Aqua, ... wedge prism...

Parasol Level-1 Product
Data Format and User Manual
Ed. 1 - Rev. 3, Apr 13th , 2006
Prepared by F.-M. Bréon (CEA/LSCE) With help from the CNES Parasol team

Introduction ................................................................................................................................................2 The Parasol instrument.............................................................................................................................2
Spectral bands..............................................................................................................................2 Polarization measurements ......................................................................................................3 Spatial resolution ........................................................................................................................4
Data acquisition..........................................................................................................................................4 Level-1 processing .....................................................................................................................................5
Calibration ....................................................................................................................................5 Radiometric processing .............................................................................................................5 Geometric processing.................................................................................................................5
Definitions ...................................................................................................................................................6 Parasol product identification..................................................................................................6 Geometry ......................................................................................................................................6 Stokes parameters .......................................................................................................................7 Coding ...........................................................................................................................................7
Leader File Format.....................................................................................................................................9 General structure.........................................................................................................................9 Leader file descriptor .................................................................................................................9 Header ...........................................................................................................................................10 Spatio-Temporal Characteristics..............................................................................................10 Instrument setting parameters .................................................................................................12 Technological parameters .........................................................................................................12 Data processing parameters .....................................................................................................14 Scaling factors ..............................................................................................................................15 Annotations ..................................................................................................................................15
Data File Format.........................................................................................................................................17 Data file descriptor .....................................................................................................................17 Data record ...................................................................................................................................17
References....................................................................................................................................................20 Acronymes ..................................................................................................................................................20 Appendix A : Product identification ....................................................................................................21 Appendix B : POLDER/Parasol Full resolution reference grid ......................................................22 Appendix C : Method for deriving the viewing geometry for each channel ..............................24 Appendix D : Manipulation of polarization parameters .................................................................25 Appendix E : Orbital characteristics .....................................................................................................26 Appendix F : POLDER radiometric model .........................................................................................27 Appendix G : Pixel Quality Index (DQX).............................................................................................30 Appendix H : How to locate a particular pixel in the data file........................................................31

Last modified on April 10th, 2005
Parasol level-1 product
Data format and user manual
The concept of the POLDER instrument was imagined by several researchers from LERTS (Laboratoire
d’Etudes et de Recherche en Télédétection Spatiale), CNES (Centre National d’Etudes Spatiales) and LOA
(Laboratoire d’Optique Atmosphérique). The concept was then validated using an airborne version built
and operated at LOA.
The spaceborne POLDER instrument has been developed by CNES in partnership with industrial
contractors. It was flown on both ADEOS-I and ADEOS-II platforms. Unfortunately, the lifetime of both
platforms was limited to less than a year following the failure of the solar paddle.
The Parasol instrument is similar to that of POLDER. It was launched in December 2004 to be part of the A-
Train, flying is formation with Aqua, Calipso and Cloudsat. Significant changes concern:
- The orientation of the CCD matrix was changed. On POLDER, the long axis of the matrix was cross-
track. On Parasol, it is along track. This results in a lower daily coverage of the Earth, but a larger
directional sampling for the pixel that are in the instrument swath (up to 16 from 14 on POLDER).
- The shorter wavelength polarized channel is at 490 nm instead of 443 nm on POLDER.
- On POLDER there were two channels at 443 nm (for optimized dynamic and signal to noise). There
is a single one on Parasol, but with an additional channel at 1020 nm. This channel may be used for
optimized synergy with the Calipso measurements at 1060 nm.
Scientific algorithms are defined and validated by the following science laboratories:
• Laboratoire d'Optique Atmosphérique (LOA)
• Laboratoire des Sciences du Climat et de l’Environnement (LSCE)
• Medias-France
• Laboratoire de Météorologie Dynamique (LMD)
For questions or comments: [email protected]

Parasol level-1 Standard Product. User manual page 2
Introduction
The purpose of this document is to describe the Parasol level-1 data format, and to provide some
information on how the data were derived from the raw measurements.
The document first gives some information on the Parasol instrument, its observation principle, and the
level-1 data processing. It then describes in details the level-1 data format. The appendices provide some
tools and equations for an in-depth use of the Parasol level-1 data. The so-called Level-2 and Level-2
scientific products are described in other documents.
The Parasol instrument
The POLDER/Parasol radiometer design consists of three principal components: a CCD matrix detector, a
rotating wheel carrying the polarizers and spectral filters, and a wide field of view (FOV) telecentric optics
(Deschamps et al., 1994). The optics have a focal length of 3.57 mm, opening to f:4.5 with a maximum FOV
of 114°.
The CCD sensor array is composed of 242 x 274 independent sensitive areas. The total array detection unit
size is 6.5 x 8.8 mm which, according to the lens focal ratio, corresponds to cross-track and along-track FOVs
of ±43° and ±51°, respectively, and to a diagonal FOV of ±57°. The CCD array is equipped with an
antiblooming device which prevents image degradation when the incident radiance is above the sensor’s
dynamic range. The spectral sensitivity of the CCD array extends between 400 and 1050 nm.
The rotating wheel, which has a steady period of 4.9 s, supports the interference filters and polarizers that
select the spectral bands and polarization directions. It carries 16 slots, one of which is an opaque filter to
estimate the CCD detector dark current. The remaining 15 slots carry 6 unpolarized and 9 polarized filters (3
polarization directions for 3 different wavelengths). Thus, Parasol acquires measurements in 9 bands, 3 of
which are polarized.
Spectral bands Table 1 provides the spectral band characteristics for the Parasol instrument. The 9 bands are defined by
their central wavelength, spectral width, dynamic range and polarization capabilities. The saturation levels
are given, for a specific acquisition integration time, in unit of normalised radiance, i.e. the maximum
spectral radiance divided by the solar spectral irradiance at nadir and multiplied by π. The dynamic reflectance range is subsequently obtained by dividing the range given in Table 1 by cos(θs), where θs is the
Parasol band 443 490 565 670 763 765 865 910 1020
Central Wavelength 443.9 491.5 563.9 669.9 762.8 762.5 863.4 906.9 1019.4
Band Width (FWHM) 13.5 16.5 15.5 15.0 11.0 38.0 33.5 21.0 17.0
Polarization Yes No No Yes No No Yes No No
Saturation level 23.8 ms 1.1 1.1 1.1 1.1 1.1 1.1 1.1 1.1 1.1
Table 1 : Characteristics of the 9 POLDER bands. The central Wavelength λc is derived from the POLDER
spectral transmission T(λ) and the solar spectrum S(λ):
! c =! S !( )T !( )"!
0
#
$S !( )T !( )"!
0
#
$

Parasol level-1 Standard Product. User manual page 3
solar zenith angle. Note that the integration is changed in-flight to optimize the dynamic range of the
detector: It increases with the solar zenith angle so that the saturation levels corresponds to a given
reflectance level.
Polarization measurements For three of the eight spectral bands (490, 670 and 865 nm), a polarizer is added to the filters in order to
assess the degree of linear polarization and the polarization direction (which are equivalent to the
measurements of I, Q, and U in the Stokes vector representation of the polarization). These parameters are
derived by combining measurements in three channels with the same spectral filters but with the polarizer
axes turned by steps of 60°. The three polarization measurements in a spectral band are successive and have
a total time lag of 0.6 s between the first and the third (last) measurement. In order to compensate for
spacecraft motion during the lag and to register the three measurements, a small-angle, wedge prism is used
in each polarizing assembly. As a consequence, the matrix image is translated in the focal plane to offset the
satellite motion, and the three polarization measurements are quasi collocated.
Figure 1: The 9 POLDER channel spectral responses together with the solar irradiance spectum

Parasol level-1 Standard Product. User manual page 4
POLDERFOV
ADEOS satellite motion
Fig. 2
Figure 2: Multidirectional acquisition with POLDER
Spatial resolution The ground size or resolution of a Parasol-measured pixel is close to (6 km)2 at nadir. Due to Earth
curvature, the viewing angle relative to the local nadir is
larger than the viewing angle in the satellite reference frame. Satellite angles (θsat) of 10°, 20°, 30°, 40° and 50°
correspond to local viewing angles (θv) of 11.3°, 22.6°,
34.1°, 45.7° and 57.8°, respectively. This leads to a slight
viewing angle dependence of the pixel size, leading to an
increase of 21% for an incidence angle of 60°.
Data acquisition
The Parasol instrument is in imaging mode on the sunlit
part of the orbit only. The acquisition sequence is repeated
every 19.6 seconds. A sequence is composed of 16 image
acquisitions in the following order : Dark, 490P1, 490P2,
490P3, 443, 1020, 565, 670P1, 670P2, 670P3, 763NP, 765NP,
910NP, 865P1, 865P2, 865P3. The total number of
sequences in one orbit depends on the season and can be
up to 130.
The 16 filter sequence is repeated every 19.6 s which
corresponds to 4 rotations of the filter wheel. During this
interval, a given point on the surface, initially at nadir
viewing, moves by about 9° relative to the satellite (Fig. 2).
The point remains within the Parasol field-of-view. As the
satellite passes over a target, about 13 (up to 16) directional
radiance measurements (for each spectral band) are
performed aiming at the point (Figure 3). Therefore,
Parasol successive observations allow the measurement of
the bidirectional reflectance properties of any target within
the instrument swath.
Fig. 3 : Number of viewing directions
available for each surface pixel. Gray shades
are from one (Black) to sixteen (white).
Fourteen directions are available in the wide
area around the satellite subtrack

Parasol level-1 Standard Product. User manual page 5
Level-1 processing
Parasol data are received by CNES receiving station in Toulouse. The Parasol level-0 data are then processed
at CNES to produce level-1 data. The so called level-1 processing includes calibration, radiometric and
geometric processing.
Calibration The Parasol instrument does not include any onboard calibration device. The instrument calibration is
achieved in flight using geophysical targets of known spectral and angular reflectance properties. The
calibration coefficients are monitored and updated during the satellite life ( Hagolle et al. , 1999). The
calibration coefficients used for the level-1 processing are identified in the leader file (“Data processing
parameters” record) by their version number.
The Parasol measurements are given in units of “normalized radiance” : the radiance (W m-2 sr-1) has been multiplied by π/Eλ where Eλ is the extraterrestrial solar radiance accounting for the variations of sun-Earth
distance. This choice (rather than expressing the measurements in units of W m-2 sr-1) was made because
the Parasol instrument is calibrated in flight against known reflectances rather than known radiances. The
“normalized radiances” data can be converted to reflectances by a simple division by the cosine of the solar
zenith angle.
Radiometric processing The radiometric processing is based in part on the POLDER/Parasol radiometric model described in
Appendix F. Radiometric processing includes :
• Stray light correction
• Subtraction of “dark current”
• Data calibration
• Computation of Stokes parameters (I,Q,U) from the three measurements for the three polarized bands.
• Interpolation of the polarization parameters from the polarized to the unpolarized bands. Correction of
the measurements for the lens polarizing effects (which depends on the input radiance polarization
properties).
Geometric processing All Parasol standard products are Earth-registered. The geometric processing navigates the raw data which
are registered in the instrument reference frame, to an Earth fixed reference frame. After projection on the
Earth frame, accounting for the satellite attitude and the relative orientation of the satellite and radiometer,
the data are interpolated on the Parasol reference grid using a bi-cubic algorithm. The satellite-radiometer
relative orientation is calibrated in-flight using specific targets such as coastlines. The attitude bias
coefficients used for level-1 processing are identified in the leader file (“Data processing parameters” record)
by their version number.
In the level 1 product, the data are sorted by pixel of the Earth frame (from South to North, and from West to
East). Note that the POLDER-1 and 2 products are given from North to South, opposite to those of Parasol,
due to the descending versus ascending daytime node. For each pixel, up to 16 sets of observations (with
varying viewing geometries) are available. The acquisition sequence number and the line-column

Parasol level-1 Standard Product. User manual page 6
coordinates on the CCD matrix are available in the product, which allow to reconstruct the original CCD
acquisition, as shown on the left image of Fig. 4.
The Parasol reference grid is described in Appendix B. The grid has a constant resolution along the
meridians (18 pixels per 1° latitude band), and a variable resolution (when expressed in degrees; nearly
constant in km) along the parallels, with the objective that all pixels have nearly identical dimensions.
Definitions
Parasol product identification A POLDER/Parasol standard product is composed of two files. A leader file and a data file. The leader file
provides some information on the instrument and the data processing. The data file contains the instrument
measurements, after radiometric and geometric processing, together with ancillary data.
A Level-1 product generated from Parasol measurement is identified by P3L1TBG1cccooov where ccc is
the orbit cycle number, ooo the orbit number in the cycle, and v identifies the reprocessing number (See
Appendix A). The leader and data filenames are pppL and pppD respectively, where ppp is the 15 characters
product identificator. Note that the second character “3” is 1 for the POLDER-1 similar products and 2 for
those of POLDER-2.
Geometry Four angles are included in the level-1 product : • The solar azimuth, φs, is relative to the local North direction. It may vary between 0 and 360°. The solar
Fig. 4: A single Parasol acquisition by the CCD yield a bidimensional image of a fraction of
the Earth (left image). For each channel, a similar acquisition is repeated every 19.6 seconds
and the fields of view partially overlap. The center image indicates the borders of every
third acquisitions. Level 1 processing integrates, for each Earth pixel of the reference grid,
the Parasol observations (up to 16) of this pixel and generates a product where
measurements are sorted by pixel (from North to South, and from West to East). The image
on the right is the result of an extraction from a level-1 product. For each pixel, the
observation with the smaller view zenith angle was selected.

Parasol level-1 Standard Product. User manual page 7
azimuth is 90° when the sun is East of the observed pixel. • The solar zenith angle, θs, is relative to the local zenith. It may vary between 0° (sun at zenith) and
approximately 80°. • The view zenith angle, θv, is relative to the local zenith. It may vary between 0° (Parasol at zenith) and
approximately 75°. • The relative azimuth, φ, is the difference in azimuth between the sun and the satellite directions: φ=φs-φv
where φv is defined, as φs, with respect to the North direction. φ may vary between 0° and 360°. φ is
0°/360° for backscattering measurements, and 180° for glitter observation.
Sun
POLDER
Zenith
NS
!
!
v
s
"s
"
Stokes parameters In addition to the total radiance I, the Parasol/POLDER instrument measurements yield the description of
the linear polarization for three spectral bands : 490P, 670P and 865P. In the POLDER level-1 product, this
information is given as the second (Q) and third (U) components of the Stokes vector. The polarized radiance Ip and polarization direction χ can be derived from Q and U through :
Ip = ( Q2 + U2 )1/2
Ip sin( 2 χ ) = U
Ip cos( 2 χ ) = Q
In the equations above, the polarization angle χ is defined with respect to the plane defined by the local
zenith and the viewing direction. Appendix D provides some equations to get the polarization direction
with respect to the scattering plane.
Coding Most parameters of the leader file are written as formatted ASCII characters, whereas the data file has a
binary structure.
In what follows, we make use of the following coding types :
Ax : indicates an ASCII field of length x bytes.
Fx.y indicates a float written on x characters with y digits after the floating point (as in FORTRAN). Ex:
F10.4 for -1234.5678
Ex.y indicates a float written in exponential form on x characters with y digits after the floating point (as in
FORTRAN). Ex: E14.4 for -1234.5678E-08

Parasol level-1 Standard Product. User manual page 8
Bx indicates a succession of bits (for quality flags). x is the number of bytes used.
I4 indicates a four-bytes unsigned Integer (from 0 to 232-1)
SI2 indicates a two-bytes signed integer (from -32768 to +32767)
I2 indicates a two-bytes unsigned Integer (from 0 to +65535)
SI1 indicates a one-byte signed integer (from -128 to +127)
I1 indicates a one-byte unsigned integer (from 0 to +255)
In the format description below, the special character “$” is used to indicate the space character. Upper-case
letters are used for fixed fields, whereas lower-case letters are used for variable fields.
Spare fields are filled with repetition of the “space” character.
For binary parameters, one or two values are reserved for “Dummy” and “Saturated” data. They depend on
the parameter format as indicated in the table below. The “Dummy” value characterizes missing data. The
“Saturated” value characterizes out of range data. Saturation is only expected for the parameters that are
coded in SI2 (Radiances and polarized radiances in the data records).
I1 SI1 I2 SI2
Saturated - - - 32767
Dummy 0 -127 0 -32767

Parasol level-1 Standard Product. User manual page 9
Leader File Format
General structure The leader file is composed of 8 records of variable length. Its total length is 195840 Bytes :
Record Name Record Length (Bytes)
Leader file descriptor 180
Header 360
Spatio-Temporal Characteristics 1620
Instrument setting parameters 180
Technological parameters 166320
Data processing parameters 720
Scaling factors 13140
Annotations 13320
Total 195840
Leader file descriptor This record describes the data structure of the leader file.
Position Type &
Length
Content
1-4 I4 Record Number in the file : 1
5-8 I4 Length of this record : 180
9-20 A12 Reference Document Identification : SPG9N122-316
21-26 A6 Reference Document Version Number : aa/bb$
27-32 A6 Software Version Number : aa.bb$
33-36 A4 File Number : 1$$$
37-52 A16 File Name1 : PwL1TBG1cccooovL
53-56 I4 Number of “header” record in the file : 1
57-60 I4 Length of the “Header” record : 360
61-64 I4 Number of “Spatio-Temporal Characteristics” records in the file : 1
65-68 I4 Length of the “Spatio-Temporal Characteristics” record : 1620
69-72 I4 Number of “Instrument setting parameters” records in the file : 1
73-76 I4 Length of the “Instrument setting parameters” record : 180
77-80 I4 Number of “Technological parameters” records in the file : 1
81-84 I4 Length of the “Technological parameters” record : 166320
85-88 I4 Number of “Data processing parameters” records in the file : 1
1 See Annexe A for the POLDER/Parasol standard for filenames

Parasol level-1 Standard Product. User manual page 10
89-92 I4 Length of the “Data processing parameters” record : 720
93-96 I4 Number of “Scaling factors” records in the file : 1
97-100 I4 Length of the “Scaling factors” record : 13140
101-104 I4 Number of “Annotation” records in the file : 1
105-108 I4 Length of the “Annotation” record : 13320
109-180 A72 Spare
Header The “header” record gives general information on the product and the models used for data registration.
Position Type &
Length
Content
1-4 I4 Record Number in the file : 2
5-8 I4 Length of this record : 360
9-24 A16 Information Point Phone Number
25-40 A16 Product identification : PwL1TBG1cccooov$
41-48 A8 Satellite identificator MYRIADE2
49-56 A8 Instrument identificator (x=1 or 2) : PARASOL1
57-72 A16 Spatial Coverage : VIEWING$SEGMENT$
73-80 A8 Pixel size of the reference grid (km) : 006.180$
81-110 A30 Name of the ellipsoid used for the data registration :
GEODETIC$REFERENCE$SYSTEM$1980
111-122 F12.4 Length of the ellipsoid minor axis (meter) : 6356752.3141
123-134 F12.4 Length of the ellipsoid major axis (meter) : 6378137.0000
135-164 A30 Name of the Digital Elevation Model (DEM) used for the data
registration : TERRAIN-BASE(NOAA)$$$$$$$$$$$$
165-172 A8 Spatial resolution of the DEM along the latitudes (in degrees) :
aaa.aaa$
173-180 A8 Spatial resolution of the DEM along the longitudes (in degrees) :
aaa.aaa$
181-360 A180 Spare
Spatio-Temporal Characteristics This records provides some information on the Earth temporal and spatial coverage for this viewing
segment.
Position Type &
Length
Content
1-4 I4 Record Number in the file : 3
5-8 I4 Length of this record : 1620
9-12 A4 Cycle Number : ccc$

Parasol level-1 Standard Product. User manual page 11
13-16 A4 Orbit Number in the cycle : ooo$
17-20 A4 Sub satellite track number2 : ttt$
21-50 A30 Spare
51-58 A8 Ascending Node Longitude : ddd.ddd$ (0 - 360°)
59-74 A16 Ascending node date and UT time : yyyymmddhhmmsscc
75-100 A26 Spare
101-116 A16 Date and UT time of the first image acquisition for the viewing segment :
yyyymmddhhmmsscc
117-132 A16 Date and UT time of the last image acquisition for the viewing segment :
yyyymmddhhmmsscc
133-200 A68 Spare
201-204 A4 Number of sequences in the viewing segment (1≤Nseq≤130)
205-300 A96 Spare
301-304 A4 Line Number of the northern most pixel observed by Parasol in the
viewing segment: nnnn (0001≤nnnn≤3240)3
305-308 A4 Line Number of the southern most pixel observed by Parasol in the
viewing segment: nnnn (0001≤nnnn≤3240)
309-400 A92 Spare
8 (is4-1)+401
-
8 (is-1) + 404
A4
Line Number of the Earth pixel located at the Parasol nadir during
acquisition of filter 670P2 of sequence #is : nnnn
1≤nnnn≤3240 if 1≤is≤Nseq ; nnnn=0000 if is>Nseq
8 (is-1) + 405
-
8 (is-1) + 408
A4
Column Number of the Earth pixel located at the Parasol nadir during
acquisition of filter 670P2 of sequence #is : nnnn
1≤nnnn≤6480 if 1≤is≤Nseq ; nnnn=0000 if is>Nseq
1441-1620 A180 Spare
2 See Appendix E for Parasol orbital characteristics and useful relationships on cycle, orbit and track numbers. 3 If only a given geographical area is ordered from the Parasol processing center, this field and the next one are
automatically updated in agreement with the area selection. 4 is is the sequence number. 1 ≤ is ≤ 130

Parasol level-1 Standard Product. User manual page 12
Instrument setting parameters This record describes the integration time sequencing (Short Integration Acquisition versus Long Integration
Acquisition) used for this viewing segment, as well as the gain.
Position Type &
Length
Content
1-4 I4 Record Number in the file : 4
5-8 I4 Length of this record : 180
9-16 A8 Short Integration Acquisition (SIA) duration (ms) : mmm.mmm$
17-24 A8 Long Integration Acquisition (LIA) duration (ms) : mmm.mmm$
25-40 A16 Integration Time definition for sequence type A :
tttttttttttttttt with t=S (SIA duration) or t=L (LIA duration).
The 16 characters correspond to the 16 Parasol filters in the following
order :
Dark , 490P1, 490P2, 490P3, 443NP, 1020NP,
565NP, 670P1, 670P2, 670P3, 763NP, 765NP,
910NP, 865P1, 865P2, 865P3
41-56 A16 Integration Time definition for sequence type B :
tttttttttttttttt with t=S (SIA duration) or t=L (LIA duration).
Same as above
57-72 B16 Sequence type (A or B) for the 128 first sequences of the orbit (for a total
maximum of 130).
The 16 bytes include 128 bits. Each bit is for one sequence
Bit=0 : Sequence type A
Bit=1 : Sequence type B
73-74 A2 Analogic gain number : g$ (1≤g≤7)
75-180 A106 Spare
Technological parameters In this record the temperature of the lens are given for each -up to 130- acquisition sequence. The two
temperatures are for the internal lens (L5 to L10) and the external lens (L1 and L2).
The record also contains the position, speed vector and attitude parameters of the Parasol satellite for each -
up to 130- acquisition sequences, and 9 images per sequence. The 9 images correspond to the spectral bands
490P, 443NP, 1020NP, 565NP, 670P, 763NP, 765NP, 910NP, 865P. For each of the 3 polarized bands, only the
values corresponding to the central filter are given.
The position and speed vectors are given in a referential fixed to the Earth with the Earth centre as the origin
: The Z vector is from the Earth centre to the North Pole, X is from the Earth centre to intersection of the equator and the Greenwich line, and Y=Z^X.

Parasol level-1 Standard Product. User manual page 13
The attitude parameters, yaw, roll and pitch, are given as right handed rotation around respectively the X, Y,
and Z axis of the orbital reference frame. The Z vector is from the satellite to the Earth centre. X is perpendicular to Z, in the plan containing X and the satellite speed vector, along the speed vector. Y=Z^X.
The default value (no data) for the date, temperature, position, speed vector and attitude is 0.
Position Type &
length
Content
1-4 I4 Record Number in the file : 5
5-8 I4 Length of this record : 166320
1278 (is-1) + 95
1278 (is-1) + 12
A4
Sequence Number : sss$ (0≤sss≤130). sss=is if the
sequence was acquired and processed; sss=0 otherwise
1278 (is-1) + 13
1278 (is-1) + 20
F8.3 Internal lens temperature during the sequence (°C) : ±ttt.ttt
1278 (is-1) + 21
1278 (is-1) + 28
F8.3 External lens temperature during the sequence (°C) :
±ttttttt.ttttttt
1278 (is-1) + 29
1278 (is-1) + 36
F8.3 Short Acquisition Time duration (ms) : ±sss.sss
1278 (is-1) + 37
1278 (is-1) + 44
F8.3 Long Acquisition Time duration (ms) : ±sss.sss
1278 (is-1)+
138 (im-1)+456
A2 Image Number : i$ (0≤i≤9). i=im if the sequence was
acquired and processed; i=0 otherwise
1278 (is-1)+
138 (im-1)+47
A16 Date and UT time of the acquisition of image im in sequence is :
yyyymmddhhmmsscc
1278 (is-1)+
138 (im-1)+63
F16.7 X component of the Parasol position during acquisition of image
im in sequence is (km): ±ppppppp.ppppppp
1278 (is-1)+
138 (im-1)+79
F16.7 Y component of the Parasol position during acquisition of image
im in sequence is (km): ±ppppppp.ppppppp
1278 (is-1)+
138 (im-1)+451)+95
F16.7 Z component of the Parasol position during acquisition of image
im in sequence is (km): ±ppppppp.ppppppp 1278 (is-1)+
138 (im-1)+451)+111
F16.7 Vx component of the Parasol speed vector during the acquisition
(km s-1): ±vvvvvvv.vvvvvvv
1278 (is-1)+
138 (im-1)+451)+127
F16.7 Vy component of the Parasol speed vector during the acquisition
(km s-1): ±vvvvvvv.vvvvvvv
1278 (is-1)+
138 (im-1)+451)+143
F16.7 Vz component of the Parasol speed vector during the acquisition
(km s-1): ±vvvvvvv.vvvvvvv
1278 (is-1)+ F8.3 Yaw of the Parasol instrument during acquisition of image im in
5is is the sequence number. 1 ≤ is ≤ 130 6im is the image number. 1 ≤ im ≤ 9

Parasol level-1 Standard Product. User manual page 14
138 (im-1)+451)+159 sequence is : ±yyy.yyy
1278 (is-1)+
138 (im-1)+451)+167
F8.3 Pitch of the Parasol instrument during acquisition of image im in
sequence is : ±ppp.ppp
1278 (is-1)+
138 (im-1)+451)+175
F8.3 Roll of the Parasol instrument during acquisition of image im in
sequence is : ±rrr.rrr
166149-166320 A127 Spare
Data processing parameters This record provides information on the input data and the software version used to generate the Level-1
Parasol data.
Position Type &
Length
Content
1-4 I4 Record Number in the file : 6
5-8 I4 Length of this record : 720
9-16 A8 Level-0 data creation country : FRANCE$$
17-24 A8 Level-0 data creation agency : CNES$$$$
25-40 A16 Level-0 data creation facility : CMSN1-PARASOL$$$
41-56 A16 Level-0 data creation date and UT time yyyymmddhhmmss$$
57-64 A8 Level-0 processing software version : e.r$$$$$
65-200 A136 Spare
201-208 A8 Level-1 data creation country : FRANCE$$
209-216 A8 Level-1 data creation agency : CNES$$$$
217-232 A16 Level-1 data creation facility : CST-PGS$$$$$$$$$
233-248 A16 Level-1 data creation date and UT time yyyymmddhhmmss$$
249-256 A8 Level-1 processing software version : ee.rr$$$
257-272 A16 Identificator of the Parasol Level-0 data used as input :
aaaaaaaaaaaaaaaa
273-280 A8 Version of the data used for radiometric calibration: ee.rr$$$
281-296 A16 Date and UT time of creation of the radiometric calibration input file :
yyyymmddhhmmss$$
297-312 A16 Date and UT time of the beginning of applicability of the radiometric
calibration: yyyymmddhhmmss$$
313-320 A8 Version of the data used for geometric processing : ee.rr$$$
321-336 A16 Date and UT time of creation of the geometric data input file :
yyyymmddhhmmss$$
337-352 A16 Date and UT time of the beginning of applicability of the geometric data :
yyyymmddhhmmss$$
353-356 B4 Product Confidence Data. This field contains several indicators on the

Parasol level-1 Standard Product. User manual page 15
product quality
357-720 A364 Spare
Scaling factors This record describes the coding of the parameters in the data file. Most parameters are given using integer
binary coding with either 1 or 2 bytes. The physical values (PV) can be computed from the Binary Values
(BV) through :
PV = Slope x BV + Offset
The Slope and the Offset are given for each parameter in this record.
Position Type &
Length
Content
1-4 I4 Record Number in the file : 7
5-8 I4 Length of this record : 13140
9-16 A8 Interleaving indicator : BIP$$$$$
17-32 A16 Byte ordering standard (BIG ENDIAN or LITTLE ENDIAN):
BIG$ENDIAN$$$$$$ (as on IBM mainframes)
33-36 A4 Number of parameters per pixel : 373$
37-44 A8 Number of bytes per pixel : 00000738
26 (ip-1) + 457
26 (ip-1) + 46
A2 Number of bytes for parameter #ip : nn
26 (ip-1) + 47
26 (ip-1) + 58
E12.5 Slope for the computation of physical value for parameter #ip :
±s.sssssE±bb
26 (ip-1) + 59
26 (ip-1) + 70
E12.5 Offset for the computation of physical value for parameter #ip :
±o.oooooE±cc
9743-13140 A4594 Spare
Annotations This record gives some statistical information on the results of the level-1 processing. The percentages of
“land”, “water” and “mixed” pixels in the viewing segment are given. A rough cloud mask is applied to the
data, and the percentage of cloud covered pixels for each 10° latitude band (first : 90N-80N, last : 80S-90S) is
given. Finally, this record gives the number of observed pixels for each of the 3240 lines of the Parasol
reference grid.
Position Type Content
1-4 I4 Record Number in the file : 8
5-8 I4 Length of this record : 13320
9-12 A4 Percentage of Dummy data found in level-0 : ppp$ (0≤ppp≤100)
13-16 A4 Percentage of saturated observations : ppp$ (0≤ppp≤100)
7ip is the parameter number. 1 ≤ ip ≤ 373

Parasol level-1 Standard Product. User manual page 16
17-20 A4 Percentage of “land” pixels in the viewing segment : ppp$
(0≤ppp≤100)
21-24 A4 Percentage of “ocean” pixels in the viewing segment : ppp$
(0≤ppp≤100)
25-28 A4 Percentage of “coast” pixels in the viewing segment : ppp$
(0≤ppp≤100)
4 (ib-1) + 298
4 (ib-1) + 32
A4 Percentage of pixels recognised as “cloudy” in the 10° latitude band #ib
: ppp$ (0≤ppp≤100)
101-200 A100 Spare
201-204 A4 Number of lines in the Parasol grid for which at least one pixel is present
in the data file9: nnnn
4 (il-1)+20510
4 (il-1)+208
A4
Number of pixels (or records) in the data file for line #il (1≤il≤3240,
from North to South) : nnnn (0≤nnnn≤6480)
13165-13320 A156 Spare
8ib is the 10° latitude band number (from North to South). 1 ≤ ib ≤ 18 9If only a given geographical area is ordered from the Parasol processing center, this field and the next one are
automatically updated in agreement with the area selection. 10il is the line number in the POLDER/Parasol reference grid. 1 ≤ il ≤ 3240

Parasol level-1 Standard Product. User manual page 17
Data File Format
The Data file is composed of a first record of length 180 bytes, and a variable number of data records (equal
to the number of pixels observed in the viewing segment, i.e. Npixels).
Record Name Number of
records
Record Length
(Bytes)
Data file descriptor 1 180
Data record Npixels 738
Data file descriptor This record describes the data structure of the data file.
Position Type &
Length
Content
1-4 I4 Record Number in the file : 1
5-8 I4 Length of this record : 180
9-20 A12 Reference Document Identification : SPG9N122-316$
21-26 A6 Reference Document Version Number : aa/bb$
27-32 A6 Software Version Number : aa.bb$
33-36 A4 File Number : 2$$$
37-52 A16 File Name11 : PwL1TBG1cccooovD
53-56 I4 Number of “data” records in the file : (0 ≤ Npixels ≤ 1.2 106)
57-60 I4 Length of one “data” record : 738
61-100 A40 Spare
101-104 I4 Length of the prefix in the “data” record (bytes) : 712
105-108 I4 Length of data in the “data” record : 725
109-112 I4 Length of the suffix in the “data” record (bytes) : 0
113-180 A68 Spare
Data record A data record is composed of 11 non-directional parameters (including the prefix), followed by 16 sets of 23
parameters. 16 observation directions is a maximum for Parasol, while it was 14 for POLDER onbord
ADEOS-1 and 2. Most pixels have either 14 or 15 directional sets of observations; other have less, in
particular on both ends of the viewing segment. In the data record, if less than 16 directions are available
(Ndir<16), the available directions are stacked first, and the end of the record is filled with Dummy values.
Note that the Ndir sets of measurements do not necessarily correspond to consecutive observation
sequences.
11 See Annexe A for the POLDER/Parasol standard for filenames 12Note that the sum of the prefix, data and suffix lengths do not yield the record length because there are 6 additional
bytes before the prefix.

Parasol level-1 Standard Product. User manual page 18
In the table below, the parameter number is the number used in the “scaling factor” record of the leader file.
As of April 2005, the Offset for the conversion of binary to physical values is 0 for all parameters. The Slope
is indicated in the table below. At this time, there is no plan to change these Slope values, nevertheless a
careful user should verify that they agree with the values given in the leader file (scaling factors record).
The radiances and Stokes parameters are given in “normalized radiance” units : the radiance (in W m-2 sr-1)
has been divided by the top of atmosphere incoming irradiance and multiplied by π. It is necessary to divide the parameter by cos(θs) to transform the measurement to reflectance units.
Position Param
#
Type &
Length
Slope Content
1-4 I4 Record Number in the file : 2≤RecNum≤Nrec+1
5-6 I2 Length of this record (bytes): 648
7-8 I2 Line Number of the pixel in the POLDER grid
9-10 I2 Column Number of the pixel in the POLDER grid
11-12 SI2 Pixel altitude from the DEM (meters)
13 I1 Land (100), Water (0) or Mixed (50) indicator
14-41 1 B 32 1 Pixel Quality Index. See Appendix G
46 2 I1 1 Rough Cloud Indicator : Clear (0), Cloudy (100) or
Undetermined (50)
47 3 I1 1.4 Solar Azimuth Angle (°)
48 4 I1 1 Number of available viewing directions : Ndir
In the following 1 ≤ id ≤ Ndir
49-50 5 B2 1 Sequence Arrangement Indicator13
43 (id-1)+51 23 id -17 I1 1 Sequence Number in the orbit14 : sn (1≤sn≤130)
43 (id-1)+52
43 (id-1)+53
23 id -16 SI2 10-2 Line number of the CCD matrix detector which has
observed the pixel for filter 670P2
43 (id-1)+54
43 (id-1)+55
23 id -15 SI2 10-2 Column number of the CCD matrix detector which
has observed the pixel for filter 670P2
43 (id-1)+56 23 id -14 I2 1.5 10-3 Solar Zenith Angle (°)
43 (id-1)+58 23 id -13 I2 1.5 10-3 View Zenith Angle (°) for filter #8 (670P2)15
43 (id-1)+60 23 id - I2 6. 10-3 Relative Azimuth Angle (°) for filter #8 (670P2)
13 This two bytes indicator describes, for the 16 directions, whether the acquisition sequence is type A or type B (see the
Instrument Setting record in the leader file). bit 0 is for direction #1, bit 15 is for direction #14. The bit is set to 0 (resp. 1)
for sequence acquisition type A (resp. B). 14 This sequence number is needed to identify measurements that have been acquired simultaneously (i.e. during one
acquisition), or to retrieve some information about the instrument position, attitude and state during the acquisition
(information found in the “Technological parameters” record of the leader file). 15 Due to the satellite velocity and the fact that the 15 measurements are not strictly coincident in time, there is a small
variation of view angle between the spectral filters. See Annexe C for details.

Parasol level-1 Standard Product. User manual page 19
43 (id-1)+61 12
43 (id-1)+62 23 id -11 SI1 1.6 10-3 ∆[θv cos(φ)] : Relative variation of viewing geometry
between the filters (°). See Appendix C
43 (id-1)+63 23 id -10 SI1 1.6 10-3 ∆[θv sin(φ)] : Relative variation of viewing geometry
between the filters (°). See Appendix C
43 (id-1)+64
43 (id-1)+65
23 id - 9 SI2 10-4 Normalised Radiance for channel 443NP
43 (id-1)+66
43 (id-1)+67
23 id - 8 SI2 10-4 Normalised Radiance for channel 490P
43 (id-1)+68
43 (id-1)+69
23 id - 7 SI2 10-4 Normalised Radiance for channel 1020NP
43 (id-1)+70
43 (id-1)+71
23 id - 6 SI2 10-4 Normalised Radiance for channel 565NP
43 (id-1)+72
43 (id-1)+73
23 id - 5 SI2 10-4 Normalised Radiance for channel 670P
43 (id-1)+74
43 (id-1)+75
23 id - 4 SI2 10-4 Normalised Radiance for channel 763NP
43 (id-1)+76
43 (id-1)+77
23 id - 3 SI2 10-4 Normalised Radiance for channel 765NP
43 (id-1)+78
43 (id-1)+79
23 id - 2 SI2 10-4 Normalised Radiance for channel 865P
43 (id-1)+80
43 (id-1)+81
23 id - 1 SI2 10-4 Normalised Radiance for channel 910NP
43 (id-1)+82
43 (id-1)+83
23 id SI2 10-4 Second component of Stokes Vector (Q) for channel
490P
43 (id-1)+84
43 (id-1)+85
23 id +1 SI2 10-4 Second component of Stokes Vector (Q) for channel
670P
43 (id-1)+86
43 (id-1)+87
23 id + 2 SI2 10-4 Second component of Stokes Vector (Q) for channel
865P
43 (id-1)+88
43 (id-1)+89
23 id +3 SI2 10-4 Third component of Stokes Vector (U) for channel
490P
43 (id-1)+90
43 (id-1)+91
23 id +4 SI2 10-4 Third component of Stokes Vector (U) for channel
670P
43 (id-1)+92
43 (id-1)+93
23 id + 5 SI2 10-4 Third component of Stokes Vector (U) for channel
865P
43 Ndir + 51
738
Spare

Parasol level-1 Standard Product. User manual page 20
References
Hagolle O, Goloub P, Deschamps PY, et al., Results of POLDER in-flight calibration, IEEE Trans Geosci. Rem. Sens. 37 (3) 1550-1566 (1999)
Deschamps, P.Y., F.M. Bréon, M. Leroy, A. Podaire, A. Bricaud, J.C. Buriez, and G. Sèze; 1994: The POLDER Mission: Instrument Characteristics and Scientific Objectives. IEEE Trans. Geosc. Rem. Sens. 32, 598-615.
Acronymes
ADEOS Advanced Earth Observing Satellite
CCD Charge Coupled Device
CNES Centre National d’Etudes Spatiales
DEM Digital Elevation Model
ECMWF European Center for Medium Range Weather Forecast
ERBE Earth Radiation Budget Experiment
ISCCP International Satellite Cloud Climatology Project
LERTS Laboratoire d’Etudes et de Recherche en Télédétection Spatiale
LIA Long Integration Acquisition
LOA Laboratoire d’Optique Atmosphérique
LSCE Laboratoire des Sciences du Climat et de l’Environnement
LMD Laboratoire de Météorologie Dynamique
LPCM Laboratoire de Physique et Chimie Marines
NDVI Normalized Difference Vegetation Index
NRE Normalized Radiant Exitence
NWM Numerical Weather Model
NASDA National Space Development Agency of Japan
POLDER Polarization and Directionality of the Earth Reflectances
SIA Short Integration Acquisition
TOA Top of the Atmosphere
TOMS Total Ozone Mapping Spectrometer
UT Universal Time

Parasol level-1 Standard Product. User manual page 21
Appendix A : Product identification This Appendix describes the POLDER/Parasol standard for product identification. A standard Parasol/POLDER product identificator (15 characters) takes the form :
PwLxTyGzcccooov (Browse, level 1 or level 2) PwLxTyGzaammddv (level 3) where w is the instrument number (1 for POLDER-1 on ADEOS-1, 2 for POLDER-2 on ADEOS-2, 3 for
Parasol)
x indicates the product level (1, 2, 3, or 1 for the Browse product)
y indicates the product thematic (B (as Basic) for level 1 and Browse products, R (as Radiation
and clouds) L (as Land surfaces) or O (as Ocean Color) for Level 2 and 3 products)
z is a code for product type (see table below)
ccc is the satellite cycle number ( 1 ≤ ccc ≤ 999 )
ooo is the orbit number in the cycle( 1 ≤ ooo ≤ 585 for POLDER-1; 057 for POLDER-2, 233
for Parasol)
aammdd is the reference date for the temporal synthesis (year-month-day)
v indicates the reprocessing number (from A to Z)
Level Thematic Product Type x y z Grid
Browse 1 B B
1 1 B 1 Full
Clouds & Rad. Budget 2 R B Medium
Directional parameters (surface) 2 O A Full
2 Ocean & Atm. Non-Directional param. (surface) 2 O B Full
Aerosols parameters 2 O C Medium
Land & Atm. Directional parameters (surface) 2 L A Full
Aerosols parameters 2 L C Medium
Clouds & Rad. Budget Synthesis 3 R B Medium
Ocean & Atm. Marine parameters 3 O B Full
3 Aerosol parameters 3 O C Medium
Directional signature param (surf.) 3 L A Full
Land & Atm. Albedo & Vegetation parameters 3 L B Full
Atmospheric parameters 3 L C Medium
A product consists of two files. A leader file and a data file. The leader file filename takes the form aaaL where
aaa is the product identificator (15 characters). Similarly, the data file filename is aaaD.
In the table above, the last column indicates the resolution of the grid used for the corresponding product.

Parasol level-1 Standard Product. User manual page 22
Appendix B : POLDER/Parasol Full resolution reference grid
The POLDER/Parasol Full resolution grid is used for level 1 products as well as surface parameters of the
level 2 and 3 products.
The POLDER/Parasol reference grid is based on the sinusoidal equal area projection (Sanson-Flamsted).
The step is constant along a meridian with a resolution of 1/18 degrees. Thus, there are 180x18 = 3240 lines
from pole to pole. Along a parallel, the step is chosen in order to have a resolution as constant as possible.
The number of pixels from 180 W to 180 E is chosen equal to 2 x NINT[3240 cos(latitude)] where NINT
stands for nearest integer.
lin is 1 to 3240 from top to bottom
col is 1 to 6480 from left to right
Note that, in the real world, the coordinates of the neighbours of a given pixel (lin , col) are not necessarily
given by (lin ± 1 , col ± 1). It is necessary to account for the deformation of the projection with the longitude.
The following equations yield the latitude and longitude of a pixel given by its (lin,col) coordinates in the
POLDER reference grid :
lat = 90 !lin ! 0.5
18
Ni = NINT[3240 cos(lat )]
lon =180
Ni
col ! 3240.5( )
The following equations yield the (lin,col) coordinates in the POLDER reference grid for a pixel of given
latitude and longitude :
lin = NINT[18(90 ! lat ) + 0. 5]
Ni = NINT[3240 sin(lin ! 0.5
18)]

Parasol level-1 Standard Product. User manual page 23
col =NINT[3240.5 +Ni
180lon]
This POLDER reference grid is centered on the Greenwich meridian. For the extraction and visualisation of
POLDER data close to the 180° longitude line, it may be easier to work with a similar grid centered on this
meridian. A simple formula allows to switch from one (lin,col) coordinate system to the other (lin’,col’) :
lin '= lin
Ni = NINT[3240 sin(lin ! 0.5
18)]
col ' = 3241! Ni +MOD2Ni
(col + 2Ni ! 3241)
where MOD2Ni returns the remainder of the integer division by 2Ni.

Parasol level-1 Standard Product. User manual page 24
Appendix C : Method for deriving the viewing geometry for each channel
With the POLDER/Parasol imaging concept, the 15 spectral/polarized measurements are acquired
sequentially. Therefore, a given surface target is observed, for the various spectral bands, with slightly
different viewing angles. The differences are very small, but can be significant for some applications that
need a very high angular accuracy, such as the atmospheric correction over the ocean. The view zenith angle (θ0=VZA) and relative azimuth (ϕ0=RelAzim) that are given in the level 1 product are
for the central filter, i.e. 670P2. The two parameters DVzC=∆[θv cos(φ)] and DVzS=∆[θv sin(φ)], which are
given for each viewing direction in the data file, are necessary to derive these angles for other spectral bands θj and ϕj. The formulae are as follows:
! j = (!0 cos"0 + X j DVzC)2+ (!0 sin"0 + Xj DVzS)
2
= !02+ 2Xj !0 cos"0 DVzC + sin "0 DVzS[ ] + X j( )
2
DVzC2+ DVzS
2[ ]
! j = arctan"0 sin!0 + Xj DVzS
"0 cos!0 + Xj DVzC
#
$ %
&
' (
IF
!0 cos"0 + Xj DVzC < 0 THEN ϕj = ϕj + 180°
where Xj is given in the table below:
Xj= -6 -4 -3 -2 0 2 3 4 6
Channel 443P 443NP 1020 565 670 763 765 910 865
Note: This formulation is based on the simple principle that the 15 measurements are acquired equally spaced and on a straight line in an angular system of orthogonal axis (! sin " ,! cos" )

Parasol level-1 Standard Product. User manual page 25
Appendix D : Manipulation of polarization parameters
The POLDER/Parasol level-1 product provides the second, Q, and third, U, parameters of the Stokes vector.
The Stokes vector is defined with respect to the reference frame defined by the viewing direction and the
local zenith. The polarized radiance Ip and polarization direction χ can be derived from Q and U through :
Ip = ( Q2 + U2 )1/2
Ip sin( 2 χ ) = U
Ip cos( 2 χ ) = Q
In the equations above, the polarization angle χ is referred to the plane defined by the local zenith and the
viewing direction. The following equations yield the polarization angle referred to the scattering plane
(defined by the sun and view directions).
χ = arctan (U / Q) / 2
IF (Q<0) χ = χ + π/2
tan !( ) =sin "( )
sin #v( )
tan #s
( )$ cos #
v( ) cos "( )
ψ = χ - α
where ψ is the polarization direction defined with respect to the scattering plane.
Note that both ψ and χ are defined modulo π.
In general, ψ is close to ±π/2.

Parasol level-1 Standard Product. User manual page 26
Appendix E : Orbital characteristics
Sat Symbol ADEOS-1 ADEOS-2 Parasol
Repeat Cycle C 41 4 16
Number of Revolutions Norb 585 57 233
Origin of Longitudes LonEq0 191.980 185.394 TBD
Origin of times (Julian) J0 2450308.41216167 2452619.41641050 TBD
Local Time at origin of
times
Hloc0 10.690525 10.3534 TBD
Correction factor for local
time
corH [-0.0077771851,
1.2939654e-05,
-3.9683356e-09,
2.2428582e-13]
[-0.0361971,
4.949845e-05,
-1.82803e-09,
0.]
TBD
ADEOS(1 and 2) are sun-synchronous polar satellites. The satellite subtracks are repeated with a period of
respectively 41 and 4 days, which defines an orbit repeat cycle. During this period, the ADEOS 1 and 2
satellite makes 585 and 57 revolutions around the Earth respectively.
The following equations allow an easy computation of equator crossing time, local time at equator and date.
They make use of the Julian day, which is an integer at noon.
The accumulated orbit number is defined as aaa = (ooo-1)*Norb + ccc
where ccc and ooo are the cycle and orbit number respectively
From aaa, the longitude at the equator is given by lonEq = lonEq0 - aaa*360*C/Norb
The Julian day for the equator crossing time is given by : Jul = J0 + aaa*C/Norb + sum/24
where sum = corH[0] + corH[1]*aaa + corH[2]*aaa^2 + corH[3]*aaa^3
Inversely, one can retrieve the accumulated orbit number from a Julian date Jday through: bbb = (jday - J0)*Norb/C
sum = corH[0] + corH[1]*bbb + corH[2]*bbb^2 + corH[3]*bbb^3
aaa = ROUND(bbb -sum/24.*Norb/C )
where ROUND returns the closest integer

Parasol level-1 Standard Product. User manual page 27
Appendix F : POLDER radiometric model
The POLDER CCD pixels are numbered (i, j) as seen in Figure 1. For the polarized bands, analysor 2 is
parallel to axis j (matrix smaller axis) and analysors 1 and 3 are turned by about ±60° from analysor 2.
i
j j
a=1
Analysor
directions
POLDER Matrix
a=2
a=3
Approximative
crosstrack direction
i=j=1General
direction
of ADEOS
motion
Figure 1
The matrix pixel (i, j) images the incident radiance corresponding to zenith viewing angle ! and azimuth
viewing angle ! such that
! = Arctg( dc
2(i " i0)2+ da
2( j " j0)2 / f ) ,
tg(! ) =
da ( j " j0)
dc (i " i0)
,
where (i0, j0) correspond to the central pixel, f is the instrument focal length, and (da, dc) are the CCD pixel
sizes (a CCD pixel is not square). Note that these angles are defined in the instrument reference frame, not
in the target Earth-fixed frame.
Analysor (a) direction
Matrix pixel
χ
αka
Electric field direction
Meridian plane direction
Figure 2
The incident light is assumed to be linearly polarized, and its Stokes parameters (I,Q,U ) are defined with
respect to axes (l,r ) respectively parallel and perpendicular to the meridian plane. For a perfect instrument, the numerical count
CNij
ka corresponding to pixel (i, j) in wavelength filter k (k = 1, 2, ..., 9), and polarizer
number a , (a = 1,2, 3) writes:
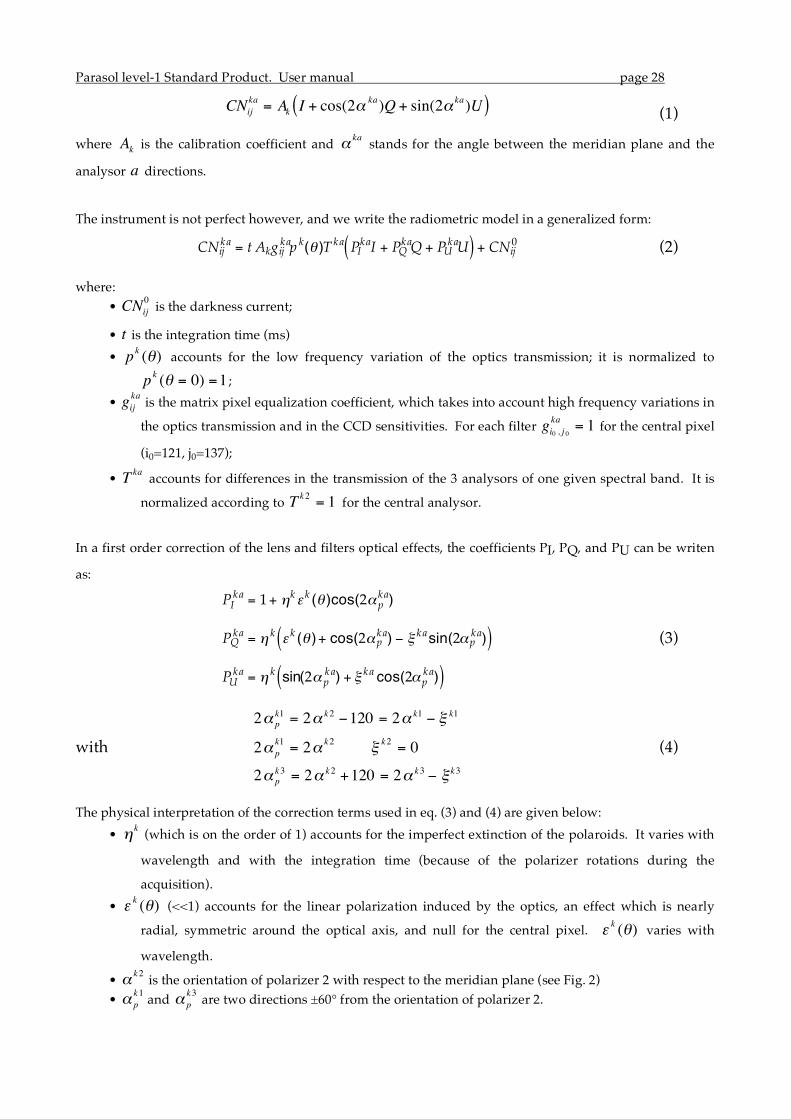
Parasol level-1 Standard Product. User manual page 28
CNij
ka= Ak I + cos(2!
ka)Q + sin(2!
ka)U( ) (1)
where Ak
is the calibration coefficient and ! ka stands for the angle between the meridian plane and the
analysor a directions.
The instrument is not perfect however, and we write the radiometric model in a generalized form:
CNij
ka = t Akgijkap k(! )T ka PI
kaI + PQkaQ + PU
kaU( ) + CNij0 (2)
where: • CNij
0 is the darkness current;
• t is the integration time (ms) • pk (!) accounts for the low frequency variation of the optics transmission; it is normalized to
pk(! = 0) =1 ;
• gijka is the matrix pixel equalization coefficient, which takes into account high frequency variations in
the optics transmission and in the CCD sensitivities. For each filter gi0 , j 0ka
= 1 for the central pixel
(i0=121, j0=137);
• Tka accounts for differences in the transmission of the 3 analysors of one given spectral band. It is
normalized according to Tk2= 1 for the central analysor.
In a first order correction of the lens and filters optical effects, the coefficients PI, PQ, and PU can be writen
as:
PIka = 1+ !k" k (# )cos(2$ p
ka)
PQka = ! k " k (# )+ cos(2$p
ka) % & kasin(2$pka)( )
PUka = ! k sin(2$ p
ka) + & ka cos(2$pka)( )
(3)
with
2! p
k1 = 2! k2 "120 = 2! k1 " # k1
2! p
k1= 2!
k2#k2= 0
2! p
k3 = 2! k2 +120 = 2! k3 " # k3
(4)
The physical interpretation of the correction terms used in eq. (3) and (4) are given below: • !k (which is on the order of 1) accounts for the imperfect extinction of the polaroids. It varies with
wavelength and with the integration time (because of the polarizer rotations during the
acquisition). • ! k (") (<<1) accounts for the linear polarization induced by the optics, an effect which is nearly
radial, symmetric around the optical axis, and null for the central pixel. ! k (") varies with
wavelength.
• ! k2 is the orientation of polarizer 2 with respect to the meridian plane (see Fig. 2) • ! p
k1 and ! p
k3 are two directions ±60° from the orientation of polarizer 2.

Parasol level-1 Standard Product. User manual page 29
• ! k1 and ! k3 account for the departures of polarisers 1 and 3 with respect to their ideal positioning,
±60° from polarizer 2.
Note that, the formulation used in (3) yields:
cos(2! p
ka)
a=1
3
" = 0 sin(2! p
ka)
a=1
3
" = 0 (5)
The signal modeling defined by eqs.(1) to (4) was tested with laboratory measurements, using an integrating
sphere, which provided incident unpolarised light, and a transmission device capable of polarizing the incident light by a calibrated, adjustable amount. Level 1 radiometric processing yields the (I,Q,U ) Stokes parameters from the
CNij
ka numerical counts. The various calibration coefficients that are needed for this
inversion have been measured before launch, and are monitored in flight using geophysical targets of
known reflectance, spectral signature and polarization properties.
Parasol level-1 Standard Product. User manual page 30
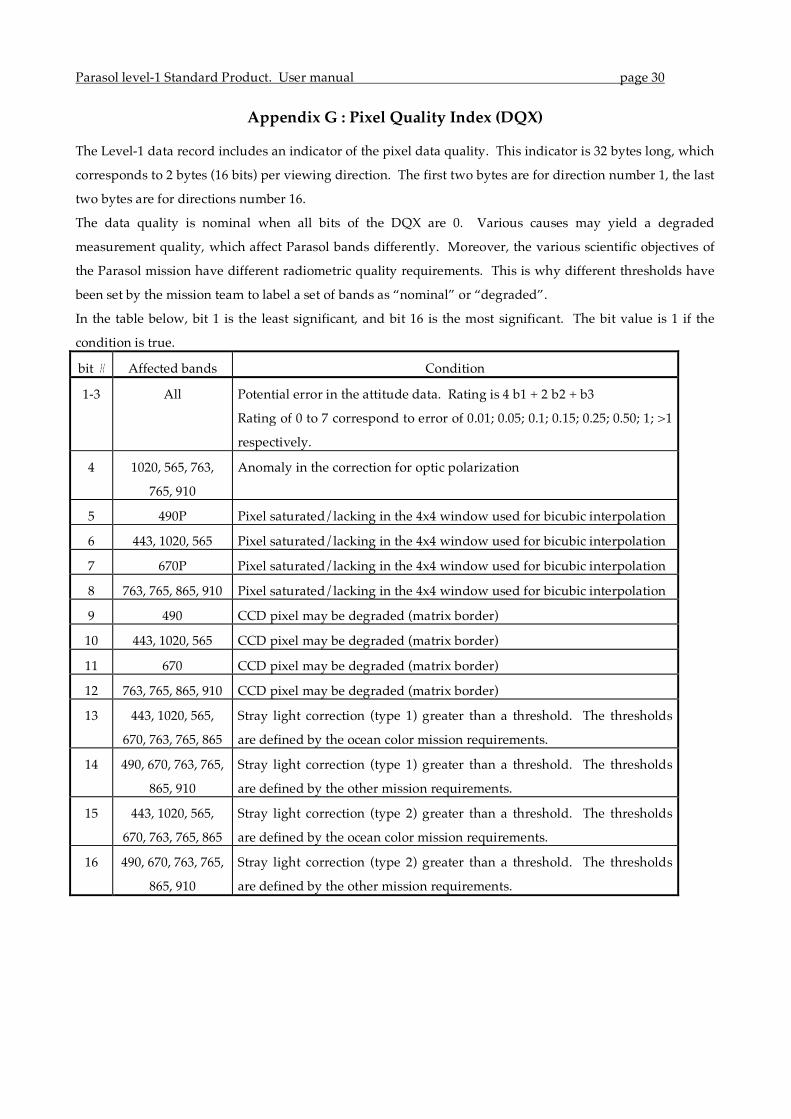
Appendix G : Pixel Quality Index (DQX)
The Level-1 data record includes an indicator of the pixel data quality. This indicator is 32 bytes long, which
corresponds to 2 bytes (16 bits) per viewing direction. The first two bytes are for direction number 1, the last
two bytes are for directions number 16.
The data quality is nominal when all bits of the DQX are 0. Various causes may yield a degraded
measurement quality, which affect Parasol bands differently. Moreover, the various scientific objectives of
the Parasol mission have different radiometric quality requirements. This is why different thresholds have
been set by the mission team to label a set of bands as “nominal” or “degraded”.
In the table below, bit 1 is the least significant, and bit 16 is the most significant. The bit value is 1 if the
condition is true.
bit # Affected bands Condition
1-3 All Potential error in the attitude data. Rating is 4 b1 + 2 b2 + b3
Rating of 0 to 7 correspond to error of 0.01; 0.05; 0.1; 0.15; 0.25; 0.50; 1; >1
respectively.
4 1020, 565, 763,
765, 910
Anomaly in the correction for optic polarization
5 490P Pixel saturated/lacking in the 4x4 window used for bicubic interpolation
6 443, 1020, 565 Pixel saturated/lacking in the 4x4 window used for bicubic interpolation
7 670P Pixel saturated/lacking in the 4x4 window used for bicubic interpolation
8 763, 765, 865, 910 Pixel saturated/lacking in the 4x4 window used for bicubic interpolation
9 490 CCD pixel may be degraded (matrix border)
10 443, 1020, 565 CCD pixel may be degraded (matrix border)
11 670 CCD pixel may be degraded (matrix border)
12 763, 765, 865, 910 CCD pixel may be degraded (matrix border)
13 443, 1020, 565,
670, 763, 765, 865
Stray light correction (type 1) greater than a threshold. The thresholds
are defined by the ocean color mission requirements.
14 490, 670, 763, 765,
865, 910
Stray light correction (type 1) greater than a threshold. The thresholds
are defined by the other mission requirements.
15 443, 1020, 565,
670, 763, 765, 865
Stray light correction (type 2) greater than a threshold. The thresholds
are defined by the ocean color mission requirements.
16 490, 670, 763, 765,
865, 910
Stray light correction (type 2) greater than a threshold. The thresholds
are defined by the other mission requirements.

Parasol level-1 Standard Product. User manual page 31
Appendix H : How to locate a particular pixel in the data file
The pixels of the POLDER/Parasol reference grid are arranged in the data file line by line and column by
column. The last record of the leader file includes an array Npix[3240] which gives the number of pixels
in the data file for each of the 3240 lines of the POLDER grid. This array can be used for a fast location of a
particular pixel in the data file :
Let il0 and ic0 be the line and column coordinates of the pixel in the POLDER reference grid. The
POLDER measurements for this pixel are located in the data file in record number rec0. The following
relation apply :
2 + Npix[il]il =1
il0!1
" # rec0 # 1 + Npix[il]il=1
il0
"
One method to retrieve the pixel is to read all records that satisfy the relation above, and to read the
corresponding column number.
Another, faster, method uses the dicotomy and it is shown below :
irecmin = 2 + Npix[il]il =1
il0!1
"
irecmax = 1 + Npix[il]il =1
il0
!
rec0 = 0 WHILE [ (rec0 = 0) AND (irecmax ≥ irecmin) ] DO irec=(irecmax+irecmin)/2 (if the ratio is not an integer, perform an integer truncation) READ record number irec, and get the corresponding column number ic. IF (ic = ic0) rec0 = irec IF (ic > ic0) irecmax = irec IF (ic < ic0) irecmin = irec + 1 END DO If (rec0 = 0), there is no data corresponding to the selected pixel in the data file.