Paramount Resources Ltd. Announces Third Quarter 2017 ...
57
Paramount Resources Ltd. Announces Third Quarter 2017 Results; 2018 Production and Capital Guidance; October 2017 Sales Volumes Exceed 98,000 Boe/d Calgary, Alberta – November 9, 2017 OIL AND GAS OPERATIONS • Paramount completed two major transactions in the third quarter of 2017, acquiring Apache Canada Ltd. (ʺApache Canadaʺ) in August and completing a merger with Trilogy Energy Corp. (ʺTrilogyʺ) in September. • During October 2017, the first full month of operations for the combined entities, Paramount’s estimated sales volumes averaged over 98,000 Boe/d (38 percent Liquids). • Average sales volumes for the fourth quarter are expected to exceed 95,000 Boe/d, with greater than 38 percent Liquids volumes. • Paramount’s third quarter 2017 sales volumes averaged 49,023 Boe/d (40 percent Liquids). • In the Grande Prairie Region, the 2016/17 Karr-Gold Creek capital program is wrapping up with the the final six wells of the 27-well Montney program scheduled to be completed and brought on production before year-end 2017. Paramount expects fourth quarter production from the Grande Prairie Region to exceed 35,000 Boe/d (approximately 50 percent Liquids). • In the Kaybob Region, a total of seven wells were rig released and twelve wells were completed in the third quarter of 2017, including the completion and tie-in of a six (3.1 net) well pad at Kaybob South Duvernay in September. The Company expects fourth quarter production from the Kaybob Region to exceed 40,000 Boe/d (approximately 33 percent Liquids). • The Central Alberta and Other Region includes assets and production in the Northwest Territories, northeast British Columbia, northwest Alberta, and central Alberta. Drilling and completion activity in the Region during the third quarter took place at the Birch joint-venture in northeast British Columbia. Paramount expects fourth quarter production from the Central and Other Region to be approximately 20,000 Boe/d (30 percent Liquids). • Capital expenditures in the third quarter of 2017 totaled $122.0 million. The majority of the capital spending was directed towards the Karr-Gold Creek Montney development program in the Grande Prairie Region.
Transcript of Paramount Resources Ltd. Announces Third Quarter 2017 ...

Paramount Resources Ltd. Announces Third Quarter 2017 Results; 2018 Production and Capital Guidance; October 2017 Sales Volumes Exceed 98,000 Boe/d
Calgary, Alberta – November 9, 2017
OIL AND GAS OPERATIONS
• Paramount completed two major transactions in the third quarter of 2017, acquiring Apache Canada
Ltd. (ʺApache Canadaʺ) in August and completing a merger with Trilogy Energy Corp. (ʺTrilogyʺ) in
September.
• During October 2017, the first full month of operations for the combined entities, Paramount’s
estimated sales volumes averaged over 98,000 Boe/d (38 percent Liquids).
• Average sales volumes for the fourth quarter are expected to exceed 95,000 Boe/d, with greater than
38 percent Liquids volumes.
• Paramount’s third quarter 2017 sales volumes averaged 49,023 Boe/d (40 percent Liquids).
• In the Grande Prairie Region, the 2016/17 Karr-Gold Creek capital program is wrapping up with the
the final six wells of the 27-well Montney program scheduled to be completed and brought on
production before year-end 2017. Paramount expects fourth quarter production from the Grande
Prairie Region to exceed 35,000 Boe/d (approximately 50 percent Liquids).
• In the Kaybob Region, a total of seven wells were rig released and twelve wells were completed in
the third quarter of 2017, including the completion and tie-in of a six (3.1 net) well pad at Kaybob
South Duvernay in September. The Company expects fourth quarter production from the Kaybob
Region to exceed 40,000 Boe/d (approximately 33 percent Liquids).
• The Central Alberta and Other Region includes assets and production in the Northwest Territories,
northeast British Columbia, northwest Alberta, and central Alberta. Drilling and completion activity in
the Region during the third quarter took place at the Birch joint-venture in northeast British Columbia.
Paramount expects fourth quarter production from the Central and Other Region to be approximately
20,000 Boe/d (30 percent Liquids).
• Capital expenditures in the third quarter of 2017 totaled $122.0 million. The majority of the capital
spending was directed towards the Karr-Gold Creek Montney development program in the Grande
Prairie Region.
CORPORATE
• Paramount’s revolving bank credit facility (the ʺFacilityʺ) was increased from $300 million to $700
million in November 2017. At Paramount’s request, the size of the Facility can be further increased
by $300 million to $1.0 billion.
• Approximately $315 million was drawn on the Facility as of November 6, 2017.
• Trilogy’s $285 million bank credit facility has been repaid and cancelled.
• Third quarter 2017 funds flow from operations totaled $45.3 million compared to $3.8 million in the
third quarter of 2016.
• Transition efforts are in full swing with a management team comprised of representation from all three
companies. The Company has reorganized into three operating regions while also creating discipline-
based leadership roles to facilitate project execution and best practices and to ensure integration
across the organization.
• Since October 1, 2017, Paramount has entered into hedges for 10,000 Bbl/d of Liquids for 2018 at
an average WTI price of C$69.84/Bbl. For the remainder of 2017, the Company has 4,000 Bbl/d of
Liquids hedged at an average WTI price of C$70.80/Bbl and 2,000 Bbl/d hedged at a WTI price of
US$54.48/Bbl.
• The Company has secured firm service transportation capacity for approximately 60,000 GJ/d of
natural gas for delivery to the Dawn natural gas hub in Ontario for sale to eastern natural gas markets.
OIL AND GAS OPERATIONS
In the third quarter of 2017 sales volumes averaged 49,023 Boe/d, including 40 percent Liquids volumes.
This includes 46 days of production from the Apache Canada assets and 19 days of production from the
Trilogy assets. For the full month of October, the Company’s estimated monthly sales averaged over
98,000 Boe/d, including approximately 38 percent Liquids volumes. Average sales volumes for the fourth
quarter of 2017 are expected to exceed 95,000 Boe/d, with 38 percent Liquids volumes.
Capital expenditures for the Company in the third quarter of 2017 were $122.0 million. Paramount estimates
approximately $130 million of capital will be spent in the fourth quarter, bringing total projected annual
spending for 2017 to approximately $510 million, excluding land and property acquisitions.
Following the acquisition of Apache Canada (the ʺApache Canada Acquisitionʺ) and the merger with Trilogy
(the ʺTrilogy Mergerʺ), Paramount has divided its oil and gas operating areas into three operating regions:
i) the Grande Prairie Region; ii) the Kaybob Region and iii) the Central Alberta and Other Region.
In the third quarter of 2017 the combined entities rig released 11 wells, completed 16 wells, and had 12
wells in the process of being completed.
Grande Prairie Region
The focus within the Grande Prairie Region is the over-pressure liquids-rich Deep Basin Montney trend. In
the third quarter Paramount added approximately 45,000 net acres to its land position through the Apache
Canada Acquisition and increased its total land holding to approximately 147,000 net acres. In addition,
the Company has a material position of Deep Basin Cretaceous rights of approximately 150,000 net
effective acres targeting the Dunvegan, Falher, Gething and Wilrich formations.
Paramount Resources Ltd. Third Quarter 2017
2

Production for the quarter averaged 24,000 Boe/d with approximately 50 percent Liquids, despite a 20-day
planned outage at a third-party gas processing plant. Paramount expects fourth quarter production from
the Grande Prairie Region to continue to exceed 35,000 Boe/d, comprised of approximately 50 percent
Liquids.
During the third quarter, a total of four wells were rig released, four wells were completed and brought on
production, and 12 wells were in the process of being completed and brought on production.
The 2016/17 Karr Montney capital program is wrapping up with six wells in-progress and scheduled to be
on production before year-end 2017. This will complete the successful 27 (27.0 net) well program, which
delivered average sales volumes of around 26,600 Boe/d in October 2017, including approximately 52
percent Liquids volumes. Peak wellhead throughput in the month of October reached 30,500 Boe/d, with
approximately 55 percent Liquids volumes.
The table below summarizes the average peak 30-day initial wellhead production rates for 21 of the 27
wells in the 2016/17 Karr Montney capital program:
Well Pad
Peak 30 Day Total (1)
(Boe/d)
Peak 30 Day Condensate (1)
(Bbl/d) % Condensate Days on
Production
00/15-14-065-06W6/0 15-02 2,628 1,340 51 307 00/04-07-065-05W6/0 04-19 2,550 1,815 71 266 02/04-07-065-05W6/0 04-19 2,844 2,176 77 238 02/01-12-065-06W6/0 04-19 2,633 1,795 68 229 00/03-22-066-05W6/0 03-22 1,949 946 49 203 00/01-12-065-06W6/0 04-19 2,218 1,532 69 196 00/09-32-065-04W6/0 16-36 2,159 1,401 65 158 00/16-32-065/04W6/0 16-36 2,122 1,263 60 143 00/04-34-065-05W6/0 16-04 2,137 994 47 132 00/01-33-065-05W6/0 16-04 1,912 805 42 127 00/08-32-065-04W6/0 16-36 1,856 1,176 63 119 02/16-24-066-05W6/0 13-07 1,341 694 52 94 00/04-06-066-04W6/0 13-07 1,815 900 50 93 02/04-06-066-04W6/0 13-07 2,050 1,414 69 91 00/16-24-066-05W6/0 13-07 1,352 647 48 91 00/03-06-066-04W6/0 13-07 1,839 942 51 89 02/09-32-065-04W6/0 16-36 1,529 950 62 80 00/13-14-065-06W6/0 15-02 1,723 1,072 62 56 02/16-14-065-06W6/0 15-02 2,018 1,346 67 48 02/14-14-065-06W6/0 15-02 1,702 1,003 59 30 02/15-14-065-06W6/0 15-02 1,855 1,270 67 30
Average 2,011 1,212 59 134
(1) Peak 30 Day is the highest daily average production rate over a 30-day consecutive period for an individual well, measured at the wellhead. Natural gas sales volumes are approximately 10 percent lower and stabilized condensate sales volumes are approximately 15 percent lower due to shrinkage. The production rates and volumes shown are 30 day peak rates over a short period of time and, therefore, are not necessarily indicative of average daily production, long-term performance or of ultimate recovery from the wells.
Drilling costs for the 21 wells averaged $3.7 million per well ($622 per meter of total depth or $1,281 per
meter of lateral length) and completion costs averaged $7.1 million per well ($103,000 per stage or $1,032
per tonne of proppant placed). Paramount increased the number of average fracs pumped per day from
about five on the 04-19 pad to an average of more than 10 per day on the most recent pad, with as many
as 17 frac stages pumped in a single 24-hour period.
The Karr 06-18 compression and dehydration facility (the ʺ06-18 Facilityʺ) produces to a nearby third party
sour gas processing plant where Paramount has firm natural gas transportation on TCPL and downstream
contracts for our condensate and NGLs volumes.
Paramount Resources Ltd. Third Quarter 2017
3

The 2016/17 delineation and land tenure program at the Wapiti Montney property is nearly complete, with
two wells rig released and one well completed and tested in the third quarter of 2017. To date, the property
has been delineated with nine wells that have tested three landing zones in the Middle and Lower Montney.
A new third party sour gas processing plant, trunk lines, and compression nodes are at various stages of
engineering, procurement and construction, with the first 150 MMcf/d of sour gas processing capacity
scheduled to be commissioned in the spring of 2019.
In the Resthaven/Jayar area, the 2016/17 program of five (4.5 net) Cretaceous wells and one (1.0 net)
Montney well is near completion. In the third quarter, one well was rig released, four wells were completed
and put on production, and one well is in the process of being completed, tested and brought on production.
The Montney well at Resthaven was drilled, completed and tied-in during the third quarter with encouraging
results. This Montney well was completed with a similar design to those of the Karr Montney program and
had a completed length of approximately 2,700 meters with 70 x 100 tonne frac stages for proppant loading
intensity of about 2.6 tonnes per meter. The well continues to flow on cleanup and has achieved an initial
30-day production rate of approximately 1,314 Boe/d at the wellhead, about 33 percent condensate.
Wellhead production rates over the first 30 days have increased day-over-day with the 30th day delivering
approximately 1,780 Boe/d with 34 percent condensate. The Company plans to closely monitor the well’s
longer-term performance and may accelerate the development of the Montney in this area.
All of the new Resthaven/Jayar production is being processed either in the 300 MMcf/d Pembina 08-11
deep cut gas plant where Paramount holds a 16 percent interest (54 MMcf/d net capacity), or the Resthaven
01-36 gas plant, where Paramount holds a 50 percent interest (10 MMcf/d net capacity). Paramount has
firm service natural gas transportation on TCPL and downstream contracts for condensate and NGLs to
handle egress for production from the Resthaven/Jayar area.
Kaybob Region
The focus in the Kaybob Region is Montney oil at Kaybob and Ante Creek, Montney gas at Presley, liquids-
rich Duvernay at Kaybob South and Smoky River and Gething oil. Paramount has added about 900,000
net acres of land at Kaybob as a result of the Apache Canada Acquisition and the Trilogy Merger, including
approximately 88,000 net acres of tier one Montney oil acreage, 122,000 net acres of liquids-rich Montney
gas, and 136,000 net acres of Duvernay rights, more than half of which are in the liquids-rich trends. In
addition to these Montney and Duvernay land positions, Paramount added additional acreage in stacked
Cretaceous plays within the Deep Basin at Kaybob.
Through the Apache Canada Acquisition and the Trilogy Merger, Paramount also added strategically
owned and operated facilities including six natural gas processing plants and three oil batteries. The natural
gas processing capacity totals greater than 150 MMcf/d and the oil batteries can process more than 40,000
Bbl/d of liquids.
During the third quarter, a total of seven wells were rig released and 12 wells completed in the Kaybob
Region, including a six-well pad at Kaybob South Duvernay which tested completion intensities up to 4.5
tonnes per meter. Production for the Kaybob Region in the third quarter averaged approximately 13,500
Boe/d, approximately 31 percent Liquids volumes. Paramount expects fourth quarter 2017 production from
the Kaybob Region to exceed 40,000 Boe/d, with about 33 percent Liquids volumes.
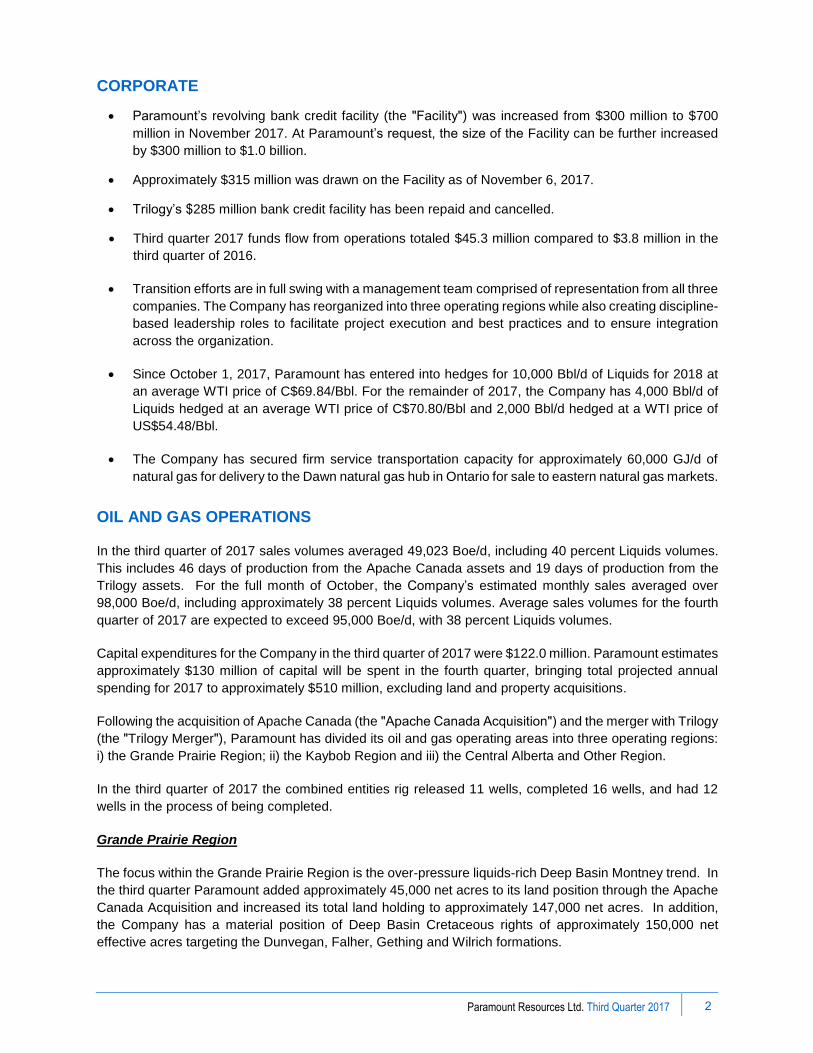
The Company has implemented a new completion design in the Kaybob Montney oil pool which on average
has 45 percent more stages and 290 percent higher proppant loading than the original wells. The table
below summarizes the average peak 30-day initial wellhead rates for wells with the new completion design.
Paramount Resources Ltd. Third Quarter 2017
4
Well
Peak 30 Day Total (1) (Boe/d)
Peak 30 Day Oil (1)
(Bbl/d) % Oil Days on
Production
02/05-06-064-18W5/0 2,301 1,928 84 299 03/04-06-064-18W5/0 1,059 759 72 298 02/04-06-064-18W5/0 1,202 1,082 90 270 00/13-31-064-18W5/0 1,174 990 84 210 02/13-31-064-18W5/0 811 605 75 208 00/14-31-064-18W5/0 756 578 76 208 00/14-12-064-19W5/2 539 475 88 198 02/15-12-064-19W5/0 683 587 86 195 03/15-12-064-19W5/0 754 620 82 157 02/08-05-064-18W5/0 1,007 929 92 137 03/09-05-064-18W5/0 815 758 93 136 02/08-29-064-18W5/0 1,573 599 38 114
Average 1,056 826 80 203
(1) Peak 30 Day is the highest daily average production rate over a 30 day consecutive period for an individual well, measured at the wellhead. Natural gas sales volumes are approximately 10 percent lower and stabilized oil sales volumes are approximately 15 percent lower due to shrinkage. The production rates and volumes shown are 30 day peak rates over a short period of time and, therefore, are not necessarily indicative of average daily production, long-term performance or of ultimate recovery from the wells.
Drilling costs for the 17 wells that were completed in the Kaybob Region averaged $1.7 million per well
($440 per meter of total depth or $926 per meter of lateral length), with completion costs averaging $0.9
million per well ($29,233 per stage or $1,500 per tonne of proppant placed). Paramount will continue to
operate a drilling rig through the fourth quarter on this play.
The Kaybob Montney oil asset produces through owned and operated sour natural gas processing and oil
handling facilities that are coupled with firm transportation for the solution gas and downstream contracts
for oil and NGLs volumes. The facilities are dually connected to both the TCPL and Alliance systems for
natural gas volumes and the Pembina gathering system for crude oil.
During the quarter, the Company brought on a new six-well pad on its Kaybob South Duvernay lands and
is excited by the results. The wells on this pad had an average daily wellhead production rate of
approximately 1,600 Boe/d per well with about 51 percent condensate volumes over their first 30 days of
production. The production rates from this new pad are over a brief period of time and not necessarily
indicative of the long-term performance. The average drill cost was $4.6 million per well ($842 per meter
of total depth or $2,030 per meter of lateral length) and the average completion cost was $6.0 million per
well ($147,000 per stage or $711 per tonne of proppant placed). The six-well pad tested two proppant
loading intensities at approximately 55-meter stage spacing and the Company is currently evaluating the
results to determine the optimal proppant loading intensity.
The Kaybob South Duvernay asset produces through third party facilities under firm agreements, again
coupled with firm transportation for natural gas and downstream contracts for condensate and NGLs
volumes.
Central Alberta and Other Region
The Central Alberta and Other Region includes assets and production in the Northwest Territories,
northeast British Columbia, northwest Alberta, and central Alberta. There are a number of material land
and resource positions in the region including Willesden Green and East Shale Basin Duvernay. The
following table summarizes the noteworthy positions in the region:
Paramount Resources Ltd. Third Quarter 2017
5

Description Approximate Net Acres
Willesden Green Duvernay 63,000 East Shale Basin Duvernay 30,000 Fee Simple Lands 176,000 Cardium 187,000 Glauconite 76,000 Ellerslie 95,000
During the third quarter, drilling and completion activity in the Central Alberta and Other Region took place
at the non-operated Birch joint-venture lands in northeast British Columbia.
Production for the region for the third quarter averaged about 11,000 Boe/d (28 percent Liquids).
Paramount expects fourth quarter 2017 production from the Central Alberta and Other Region to be
approximately 20,000 Boe/d with approximately 30 percent Liquids.
2018 GUIDANCE AND OUTLOOK
Paramount’s 2018 capital budget is focused on liquids-rich growth opportunities while maintaining a strong
balance sheet. Paramount expects sales volumes to average approximately 100,000 Boe/d in 2018,
including 40 percent Liquids volumes. The Company’s sales volumes are expected to remain at this level
until production at Wapiti begins to ramp up in the spring of 2019 when 150 MMcf/d of new third-party gas
processing capacity is scheduled to come on-stream.
Capital expenditures for 2018 are expected to be approximately $600 million including maintenance,
optimization and exploration expenses, excluding acquisitions or divestitures. In addition, the Company
intends to spend approximately $28 million on abandonment and suspension activities in 2018.
Approximately 50 percent of the $130 million of capital expenditures the Company expects to incur in the
fourth quarter of 2017 are related to the planned 2018 development program and include lease
construction, drilling operations and ordering of long-lead items.
The 2018 capital allocation is expected to be as follows: 68 percent liquids-rich Montney, 23 percent liquids-
rich Duvernay, six percent for maintenance/optimization projects and three percent for other liquids-rich
projects. Capital allocation by region is forecast to be about 54 percent Grande Prairie, 36 percent Kaybob
and 10 percent Central/Other.
In 2018 the Company plans to drill between 70 and 75 net development wells and complete up to 55 of
those net wells. The 55 net well completions will account for about 13 percent of Paramount’s proved plus
probable booked undeveloped locations (as at June 1, 2017). As the Company furthers the development
of its plays, additional locations will be added to Paramount’s reserves.
At an average drilling duration of 30 days and 270 operating days per year per drilling rig, Paramount’s
wholly-owned Fox Drilling fleet of seven rigs can accommodate approximately 1,900 of the up to 2,500
drilling days that may be required for these development wells. The remaining drilling days will be
contracted out based on cost of service, availability, reliability and functionality of equipment.
In 2016/17 Paramount contracted pumping services for extended periods of up to 12 months, and plans to
employ the same strategy in 2018 to ensure access to quality crews, equipment, and materials. Paramount
has a water management team and greater than five million barrels of existing fresh water storage capacity
in Wapiti, Karr and Kaybob.
During the period from late-2016 through to the present, Paramount has seen between 10 and 15 percent
cost inflation in drilling and completion activities. These increases have been included in future development
Paramount Resources Ltd. Third Quarter 2017
6
planning with any additional cost inflation anticipated to be offset by savings due to multi-well pad drilling,
fresh water storage and economies of scale from the combined businesses.
For budgeting and planning purposes, Paramount uses constant prices and costs with US$50/Bbl WTI,
US$3.00/MMbtu NYMEX, US$1.00/MMbtu AECO basis, and a foreign exchange rate of 1.25 Canadian
dollars per US dollar. Operating costs through the 2018 period are estimated to be approximately $10.00
per Boe. Transportation costs are expected to average $3.10 per Boe with royalties of approximately $1.65
per Boe. Operating costs per Boe and general and administrative costs are expected to decline in the
fourth quarter of 2018 as optimization and synergistic benefits start to be realized.
Paramount expects to fund the portion of its 2018 budgeted capital expenditures that are in excess of cash
flow through non-core asset divestitures and by drawings on the Company’s expanded bank credit facility.
Paramount has a portfolio of very profitable projects and intends to invest in these while maintaining
financial strength and flexibility. This will provide the Company with the flexibility to accelerate capital
investments should macro conditions continue to improve.
2018 Capital Program By Property
Wapiti Montney
In 2018 the Company will allocate about 25 percent of the capital program to the Wapiti Montney asset in
the form of drilling, completions, water management, land tenure, and geological studies. A 24-well drilling
campaign (100 percent working interest) will be kicked off with most of the well completions to follow in
early 2019 to align with the commissioning and startup of the first phase of the third-party Wapiti gas plant.
The Wapiti gas plant, trunk line connecting the east and west blocks and compression nodes are in various
stages of engineering, procurement and construction with an anticipated onstream date in the spring of
2019 as per the third party schedule. This third-party infrastructure is complimented by a Leduc water
disposal scheme which Paramount will commence drilling the first of a series of water disposal wells in
2018.
Paramount has firm natural gas transportation on TCPL which ramps up from 50 MMcf/d in 2019 to 130
MMcf/d in early 2021 with the potential to accelerate these volumes should Paramount choose to do so.
Karr Montney
The Karr Montney asset is expected to be allocated approximately 27 percent of the 2018 capital program
in the form of drilling, completions, optimizations and facility expansions. Paramount plans to expand the
existing 06-18 Facility from its current 80 MMcf/d throughput capacity to about 100 MMcf/d of capacity in
the latter half of 2018. The 2018 program will see about 15 wells drilled (five to be spud in the fourth quarter
of 2017) and up to 10 wells completed. Paramount has a 100 percent working interest in the wells in the
2018 program.
In addition to expanding the existing 06-18 Facility from 80 to 100 MMcf/d, the Company has kicked off
front-end engineering design and site clearing on a 50 MMcf/d expansion, which will see Karr achieve
throughput capacity of 150 MMcf/d in 2020. This new owned and operated facility is being designed to
allow for a further 50 MMcf/d expansion, which would bring total owned and contracted natural gas
processing at Karr to 200 MMcf/d. Firm transportation with TCPL is in place to achieve the goal of 150
MMcf/d of throughput capacity by the third quarter of 2020.
Paramount Resources Ltd. Third Quarter 2017
7

Kaybob Montney Oil
Approximately 13 percent of the 2018 capital program has been assigned to the Kaybob Montney oil asset.
This will consist of drilling, completions, optimizations and infield infrastructure projects to handle growth in
oil production from the current 6,000 Bbl/d to approximately 8,000 Bbl/d. The 2018 program will see about
22 new wells (100 percent working interest) drilled and completed, plus an additional five completions from
late-2017 drills.
The solution gas from the asset is produced into Paramount’s operated Kaybob North 08-09 gas plant (the
ʺ08-09 Plantʺ) where firm natural gas transportation is secured with TCPL. The gas plant is dually
connected to both TCPL and Alliance, providing for future optionality.
Oil emulsion is treated at Paramount’s owned and operated 12-10 oil battery with capacity of 20,000 Bbl/d,
which is pipeline connected to Pembina. The Company has downstream contracts in place to match
throughput at the battery.
Paramount’s development strategy at the Kaybob Montney Oil asset is to maintain oil production flat at
about 8,000 Bbl/d, with optionality to increase throughput in the event of higher oil prices.
Kaybob Smoky Duvernay
The 2018 capital program for the Kaybob Smoky Duvernay will see a new four well pad (100 percent
working interest, average 2,600 meter lateral length with proppant loading intensities up to 4.5 tonnes per
meter) spudded in late-2017 (part of the fourth quarter 2017 capital spend estimate) and come on-stream
in middle of 2018.
The new four well pad will produce to Paramount’s owned and operated Smoky 06-16 gas plant, which will
have approximately 12 MMcf/d of throughput capacity after some minor capital investments. The Smoky
06-16 plant is TCPL connected with firm transportation to accommodate natural gas production.
Condensate and NGLs will be trucked to the 08-09 Plant and the 12-10 oil battery, which is located about
15 miles east.
The 2018 capital program is Phase 1 of the development of the Kaybob Smoky Duvernay asset. Phase 2
will consist of further modifications to the Smoky 06-16 gas plant to increase throughput capacity to about
20 MMcf/d in 2019. Phase 3 of the development will include a pipeline connection to the Kaybob North 08-
09 gas plant and some modifications/enhancements to the Kaybob North 08-09 gas plant for handling
Duvernay liquids. Phase 3 will add incremental throughput capacity of approximately 40 MMcf/d, bringing
the total throughput capacity for the asset up to 60 MMcf/d for middle of 2020.
The growth plan at the Kaybob Smoky Duvernay asset is supported by firm natural gas transportation on
TCPL and downstream contracts for the condensate and NGLs.
Kaybob South Duvernay
In 2018 the Company will allocate up to $50 million to the Kaybob South Duvernay asset. Paramount’s
average working interest in the asset is about 60 percent and the 2018 program average working interest
is 51 percent. The program will consist of drilling up to 11 gross wells and completing five of those wells in
2018 with the remainder being completed in early-2019.
The asset produces through third party facilities under firm contracts with current throughput capacity
limited to 40 MMcf/d at the 15-28 compression and dehydration facility. The 15-28 facility is expandable
Paramount Resources Ltd. Third Quarter 2017
8
and the Company has firm service natural gas processing capacity in excess of 80 MMcf/d at a downstream
third-party natural gas processing plant.
Paramount has firm natural gas transportation on TCPL that aligns with the current third-party facilities
solution and would be addressed in an expansion scenario.
Other Exploration and Development Capital
The 2018 capital program includes about $60 million for other high-graded development projects including
Birch Montney, Willesden Green Duvernay, Hoadley Glauconite, Gething oil and Ante Creek Montney. In
total, the Company plans to drill around 11 gross wells (7.8 net wells) and complete 10 gross wells (6.8 net
wells). All but one of the completed wells will produce through owned and operated infrastructure which is
accompanied by firm transportation contracts for natural gas. The exception is Birch Montney, where
Paramount has ownership in facilities that are operated by a joint-venture partner.
The 2018 capital plan excludes non-operated opportunities which may arise throughout the year, which will
be evaluated on a case-by-case basis to determine the economic feasibility, risk profile, and strategic
rationale.
Optimization Capital
In 2018 the Company has allocated approximately $45 million to maintenance and optimization projects to
add production, reduce base decline, and achieve operating cost savings. The focus of these optimization
projects is in the Kaybob area, where there are a number of opportunities to re-route production from third
party facilities to owned and operated facilities. These investment opportunities are possible due to the
overlap of the Trilogy and Apache Canada land and infrastructure positions in Kaybob, which provide
significant opportunities for cost saving synergies.
TECHNOLOGY UPDATE
Over the course of three years Paramount has evolved completion designs from open-hole packer systems
with oil-based fluid to cased hole designs with slickwater fluid and pump rates more than 14 m3/min. Stage
spacing has decreased from up to 100m down to as low as 40m with proppant loading intensities increasing
from 0.6 t/m to as high as 4.5 t/m.
Paramount continues to investigate and research the evolution of well design and will test concepts around
plug optimization, zipper fracturing techniques, casing string design, and artificial lift technologies in 2018.
In 2018 a key focus for Paramount is data acquisition projects including micro-seismic, production logging
with fiber, pilot wells and coring, landing zone optimization, well density tests, stacked development tests
and water reuse applications.
Paramount strives to be a leader in well completion designs and optimizing well performance with a specific
focus on condensate recoveries. The Company has embraced data analytics and is monitoring competitors
in its own basin and plays as well as operators south of the border. Paramount is focused on the optimal
asset allocation and maximizing oil and condensate recovery from our liquids-rich resource plays.
SUBSEQUENT EVENTS
Since October 1, 2017, Paramount has entered into hedges for 10,000 Bbl/d of Liquids for 2018 at an
average WTI price of C$69.84/Bbl. For the remainder of 2017, the Company has 4,000 Bbl/d of Liquids
hedged at an average WTI price of C$70.80/Bbl and 2,000 Bbl/d hedged at a WTI price of US$54.48/Bbl.
Paramount Resources Ltd. Third Quarter 2017
9

The Company will receive US$1.1 million of locked-in gains on natural gas hedging contracts in the fourth
quarter of 2017 and has an additional 20,000 MMBtu/d hedged at a NYMEX price of US$3.40/MMbtu until
the end of the year.
The Company has secured firm service transportation capacity for approximately 60,000 GJ/d of natural
gas for delivery to the Dawn natural gas hub in Ontario for sale to eastern natural gas markets.
OPERATING AND FINANCIAL RESULTS (1)
($ millions, except as noted)
Three months ended September 30
Nine months ended September 30
2017 2016 % Change 2017 2016 % Change
Sales Volumes (Boe/d)
PRL (2) 25,294 11,148 127 19,975 11,583 72
Apache Canada 18,960 - 100 6,389 - 100
Trilogy 4,769 - 100 1,607 - 100
Ongoing Operations 49,023 11,148 340 27,971 11,583 141
Musreau Assets (2) - 13,638 (100) - 26,979 (100)
Total 49,023 24,786 98 27,971 38,562 (27)
Netback
Natural gas revenue 30.9 21.6 43 62.9 68.6 (8)
Condensate and oil revenue 74.2 25.1 196 152.2 121.7 25
Other NGLs revenue (3) 9.8 4.8 104 15.2 25.3 (40)
Royalty and sulphur revenue 1.6 0.2 700 2.3 0.9 156
Petroleum and natural gas sales 116.5 51.7 125 232.6 216.5 7
Royalties (5.0) (0.1) NM (7.8) (2.1) 271
Operating expense (47.8) (25.0) 91 (79.8) (86.1) (7)
Transportation and NGLs processing (4) (12.3) (12.7) (3) (26.6) (52.2) (49)
Netback 51.4 13.9] 270 118.4 ]76.1 56
($/Boe) 11.40 6.12 86 15.49 7.20 115
Exploration and Capital Expenditures
Wells and exploration 100.6 46.5 116 330.1 83.1 297
Facilities and gathering 21.4 0.1 NM 50.8 9.8 418
Principal Properties Capital (5) 122.0 46.6 162 380.9 92.9 310
Net income 223.5 1,029.4 (78) 289.5 952.9 (70) per share – diluted ($/share) 1.97 9.64 (80) 2.65 8.97 (70)
Funds flow from operations 45.3 3.8 NM 108.6 21.3 410 per share – diluted ($/share) 0.40 0.04 NM 0.99 0.20 395
Total assets 5,020.9 2,130.3 136
Net debt (cash) 564.3 (385.3) (246)
Investments in other entities – market value (6) 56.5 466.7 (88)
Common shares outstanding (thousands) 134.8 106.3 27
(1) Readers are referred to the advisories concerning Non-GAAP Measures and Oil and Gas Measures and Definitions in the Advisories section of this document. (2) In 2016, the Company sold its natural gas processing facilities and the majority of its oil and gas properties in the Musreau/Kakwa area of west central Alberta (the
ʺMusreau Assetsʺ). Disclosures of results for the three and nine months ended September 30, 2016 for "Ongoing Operations" exclude amounts attributable to these sold facilities and oil and gas properties. “PRL” means Paramount’s existing operations prior to the Apache Canada Acquisition and the Trilogy Merger exc luding the Musreau Assets.
(3) Other NGLs means ethane, propane and butane. (4) Includes downstream natural gas, NGLs and oil transportation costs and NGLs fractionation costs incurred by the Company. (5) Principal Properties Capital includes capital expenditures and geological and geophysical costs related to the Company’s Principal Properties and excludes
land acquisitions. (6) Based on the period-end closing prices of publicly-traded investments and the book value of the remaining investments. (7) NM Not meaningful
Paramount Resources Ltd. Third Quarter 2017
10

Paramount is an independent, publicly traded, Canadian energy company that explores and develops
conventional and unconventional petroleum and natural gas prospects, including long-term unconventional
exploration and pre-development projects, and holds a portfolio of investments in other entities. The
Company’s principal properties are primarily located in Alberta and British Columbia. Paramount’s Class A
common shares are listed on the Toronto Stock Exchange under the symbol "POU".
Paramount’s third quarter 2017 results, including Management’s Discussion and Analysis and the
Company’s Consolidated Financial Statements will be made available shortly through Paramount’s website
at www.paramountres.com and SEDAR at www.sedar.com.
For further information, please contact:
Paramount Resources Ltd.
J.H.T. (Jim) Riddell, President and Chief Executive Officer
B.K. (Bernie) Lee, Chief Financial Officer
www.paramountres.com
Phone: (403) 290-3600
ADVISORIES
Forward-looking Information
Certain statements in this document constitute forward-looking information under applicable securities legislation. Forward-looking information typically contains statements with words such as "anticipate", "believe", "estimate", "will", "expect", "plan", "schedule", "intend", "propose", or similar words suggesting future outcomes or an outlook. Forward-looking information in this document includes, but is not limited to:
• projected production and sales volumes (including the Liquids component thereof);
• forecast capital expenditures (including the plays, regions and activities where, or in respect of which, this capital is expected to be spent), royalties, operating costs, abandonment and suspension costs, and transportation costs;
• exploration, development, and associated operational plans and strategies (including planned drilling and completion programs, well tie-ins, and facility expansions, and the anticipated timing thereof) and the Company’s anticipated sources of funds to carry out such plans and strategies (including planned non-core asset divestitures);
• plans for securing the necessary drilling, completion and other services required to carry out the Company’s 2018 development program;
• anticipated levels of cost inflation for drilling and completion services and the Company’s anticipated ability to offset any additional cost increases by various means including increased economies of scale;
• the percentage of Paramount’s currently booked proved and probable and high-graded Montney and Duvernay locations that its expects to drill in 2018;
• the Company’s continued financial flexibility to accelerate its capital programs if industry conditions warrant; and
• general business strategies and objectives.
Such forward-looking information is based on a number of assumptions which may prove to be incorrect. Assumptions have been made with respect to the following matters, in addition to any other assumptions identified in this document:
• future natural gas and Liquids prices;
• royalty rates, taxes and capital, operating, general & administrative and other costs;
• foreign currency exchange rates and interest rates;
• general business, economic and market conditions;
• the ability of Paramount to obtain the required capital to finance its exploration, development and other operations and meet its commitments and financial obligations;
• the ability of Paramount to obtain equipment, services, supplies and personnel in a timely manner and at an acceptable cost to carry out its activities;
• the ability of Paramount to secure adequate product processing, transportation, de-ethanization, fractionation, and storage capacity on acceptable terms;
• the ability of Paramount to market its natural gas and Liquids successfully to current and new customers;
• the ability of Paramount and its industry partners to obtain drilling success (including in respect of anticipated production volumes, reserves additions, Liquids yields and resource recoveries) and operational improvements, efficiencies and results consistent with expectations;
Paramount Resources Ltd. Third Quarter 2017
11

• the timely receipt of required governmental and regulatory approvals; and
• anticipated timelines and budgets being met in respect of drilling programs and other operations (including well completions and tie-ins andthe construction, commissioning and start-up of new and expanded facilities).
Although Paramount believes that the expectations reflected in such forward-looking information are reasonable, undue reliance should not be placed on them as Paramount can give no assurance that such expectations will prove to be correct. Forward-looking information is based on expectations, estimates and projections that involve a number of risks and uncertainties which could cause actual results to differ materially from those anticipated by Paramount and described in the forward-looking information. The material risks and uncertainties include, but are not limited to:
• fluctuations in natural gas and Liquids prices;
• changes in foreign currency exchange rates and interest rates;
• the uncertainty of estimates and projections relating to future revenue, future production, reserve additions, Liquids yields (including condensate to natural gas ratios), resource recoveries, royalty rates, taxes and costs and expenses;
• the ability to secure adequate product processing, transportation, de-ethanization, fractionation, and storage capacity on acceptable terms;
• operational risks in exploring for, developing and producing, natural gas and Liquids;
• the ability to obtain equipment, services, supplies and personnel in a timely manner and at an acceptable cost;
• potential disruptions, delays or unexpected technical or other difficulties in designing, developing, expanding or operating new, expandedor existing facilities (including third-party facilities);
• processing, pipeline, de-ethanization, and fractionation infrastructure outages, disruptions and constraints;
• risks and uncertainties involving the geology of oil and gas deposits;
• the uncertainty of reserves and resources estimates;
• general business, economic and market conditions;
• the ability to generate sufficient cash flow from operations and obtain financing to fund planned exploration, development and operationalactivities and meet current and future commitments and obligations (including product processing, transportation, de-ethanization,fractionation and similar commitments and obligations);
• changes in, or in the interpretation of, laws, regulations or policies (including environmental laws);
• the ability to obtain required governmental or regulatory approvals in a timely manner, and to enter into and maintain leases and licenses;
• the effects of weather;
• the timing and cost of future abandonment and reclamation obligations and potential liabilities for environmental damage and contamination;
• uncertainties regarding aboriginal claims and in maintaining relationships with local populations and other stakeholders;
• the outcome of existing and potential lawsuits, regulatory actions, audits and assessments; and
• other risks and uncertainties described elsewhere in this document and in Paramount’s other filings with Canadian securities authorities.
The foregoing list of risks is not exhaustive. For more information relating to risks, see the section titled "RISK FACTORS" in Paramount's current annual information form. The forward-looking information contained in this document is made as of the date hereof and, except as required by applicable securities law, Paramount undertakes no obligation to update publicly or revise any forward-looking statements or information, whether as a result of new information, future events or otherwise.
Non-GAAP Measures
In this document "Funds flow from operations", "Netback", ʺNet Debt (Cash)ʺ, ʺAdjusted Working Capitalʺ, "Exploration and Capital Expenditures", "Principal Properties Capital" and "Investments in other entities – market value", collectively the "Non-GAAP measures", are used and do not have any standardized meanings as prescribed by International Financial Reporting Standards.
Funds flow from operations refers to cash from (used in) operating activities before net changes in operating non-cash working capital, geological and geophysical expenses, asset retirement obligation settlements and corporate acquisition and merger costs. Funds flow from operations is commonly used in the oil and gas industry to assist management and investors in measuring the Company’s ability to fund capital programs and meet financial obligations. Refer to the Consolidated Results section of the Company’s Management’s Discussion and Analysis for the three and nine months ended September 30, 2017 for the calculation of funds flow from operations. Netback equals petroleum and natural gas sales less royalties, operating costs and transportation and NGLs processing costs. Netback is commonly used by management and investors to compare the results of the Company’s oil and gas operations between periods. Refer to the Principal Properties section of the Company’s Management’s Discussion and Analysis for the three and nine months ended September 30, 2017 for the calculation of netback. Net debt (cash) is a measure of the Company’s overall debt position after adjusting for certain working capital and other amounts and is used by management to assess the Company’s overall leverage position. Refer to the Liquidity and Capital Resources section of the Company’s Management’s Discussion and Analysis for the calculation of Net debt (cash) and Adjusted working capital. Exploration and capital expenditures consist of the Company’s spending on wells and infrastructure projects, other property, plant and equipment, land and property acquisitions and geological and geophysical costs incurred. The closest GAAP measure to exploration and development expenditures is property, plant and equipment and exploration cash flows under investing activities in the Company’s Consolidated Statement of Cash Flows, which includes all of the items included in exploration and capital expenditures, except for geological and geophysical costs, which are expensed as incurred. Principal properties capital includes capital expenditures and geological and geophysical costs related to the Company’s Principal Properties business segment, and excludes land acquisitions. The principal properties capital measure provides management and investors with information regarding the Company’s Principal Properties spending on wells and infrastructure projects separate from land acquisition activity
Paramount Resources Ltd. Third Quarter 2017
12
and capitalized interest. Refer to the Advisories section of the Company’s Management’s Discussion and Analysis for the three and nine months ended September 30, 2017 for the calculation of exploration and capital expenditures and principal properties capital. Investments in other entities – market value reflects the Company’s investments in enterprises whose securities trade on a public stock exchange at their period end closing price (e.g. Trilogy Energy Corp. (2016), MEG Energy Corp., Blackbird Energy Inc., Marquee Energy Ltd., RMP Energy Inc., Strategic Oil & Gas Ltd. and others) and investments in all other entities at book value. Paramount provides this information because the market values of equity-accounted investments, which are significant assets of the Company, are often materially different than their carrying values. Refer to the Strategic Investments section of the Company’s Management’s Discussion and Analysis for the three and nine months ended September 30, 2017 for information on carrying and market values.
Non-GAAP measures should not be considered in isolation or construed as alternatives to their most directly comparable measure calculated in accordance with GAAP, or other measures of financial performance calculated in accordance with GAAP. The Non-GAAP measures are unlikely to be comparable to similar measures presented by other issuers.
Oil and Gas Measures and Definitions
The term "Liquids" means oil, condensate and Other NGLs (ethane, propane and butane).
Abbreviations
Liquids Natural Gas
Bbl Barrels Mcf Thousands of cubic feet Bbl/d Barrels per day MMcf Millions of cubic feet MBbl Thousands of barrels MMcf/d Millions of cubic feet per day NGLs Natural gas liquids MMbtu Millions of British thermal units Condensate Pentane and heavier hydrocarbons
Oil Equivalent
Boe Barrels of oil equivalent Boe/d Barrels of oil equivalent per day
Natural gas equivalency volumes have been derived using the ratio of six thousand cubic feet of natural gas to one barrel of oil. Equivalency measures may be misleading, particularly if used in isolation. A conversion ratio of six thousand cubic feet of natural gas to one barrel of oil is based on an energy equivalency conversion method primarily applicable at the burner tip and does not represent a value equivalency at the well head. For the nine months ended September 30, 2017, the value ratio between crude oil and natural gas was approximately 23:1. This value ratio is significantly different from the energy equivalency ratio of 6:1. Using a 6:1 ratio would be misleading as an indication of value.
Paramount Resources Ltd. Third Quarter 2017
13
Management’s Discussion and Analysis
For the three and nine months ended September 30, 2017
This Management’s Discussion and Analysis ("MD&A"), dated November 8, 2017, should be read in
conjunction with the unaudited Interim Condensed Consolidated Financial Statements of Paramount
Resources Ltd. ("Paramount" or the "Company") as at and for the three and nine months ended September
30, 2017 and Paramount’s audited Consolidated Financial Statements as at and for the year ended
December 31, 2016. Financial data included in this MD&A has been prepared in accordance with
International Financial Reporting Standards ("IFRS" or "GAAP") and is stated in millions of Canadian
dollars, unless otherwise noted. The Company’s accounting policies have been applied consistently to all
periods presented.
The disclosures in this document include forward-looking information, non-GAAP measures and certain oil
and gas measures. Readers are referred to the Advisories section of this document concerning such
matters. Certain comparative figures have been reclassified to conform to the current years’ presentation.
Additional information concerning Paramount, including its Annual Information Form, can be found on the
SEDAR website at www.sedar.com.
ABOUT PARAMOUNT
Paramount is an independent, publicly traded, Canadian energy company that explores and develops
conventional and unconventional petroleum and natural gas prospects, including long-term unconventional
exploration and pre-development projects, and holds a portfolio of investments in other entities. The
Company’s principal properties are primarily located in Alberta and British Columbia. Paramount’s Class A
Common Shares ("Common Shares") are listed on the Toronto Stock Exchange under the symbol "POU".
Paramount’s operations are grouped into three business segments, which have been established by
management to assist in resource allocation, to assess operating performance and to achieve long-term
strategic objectives: i) Principal Properties; ii) Strategic Investments; and iii) Corporate.
Principal Properties include the Company’s exploration, development, production and marketing
operations. Paramount is primarily focused on the development of liquids-rich resource plays targeting the
Montney and Duvernay formations in the Alberta Deep Basin and has material resource positions and
production in central Alberta and northeast British Columbia.
Strategic Investments include: (i) investments in other entities; (ii) investments in exploration and
development stage assets, where there is no near-term expectation of commercial production, but a longer-
term value proposition based on spin-outs, dispositions, or future revenue generation, including oil sands
and carbonate bitumen interests held by Paramount’s wholly-owned subsidiary Cavalier Energy
("Cavalier"), and prospective shale gas acreage in the Liard and Horn River Basins (the "Shale Gas
Properties"); and (iii) drilling rigs owned by Paramount’s wholly-owned subsidiary, Fox Drilling Limited
Partnership ("Fox Drilling").
The Corporate segment is comprised of income and expense items, including general and administrative
expense, share-based compensation expense and interest expense, which have not been specifically
allocated to Principal Properties or Strategic Investments.
Paramount Resources Ltd. Third Quarter 2017 15
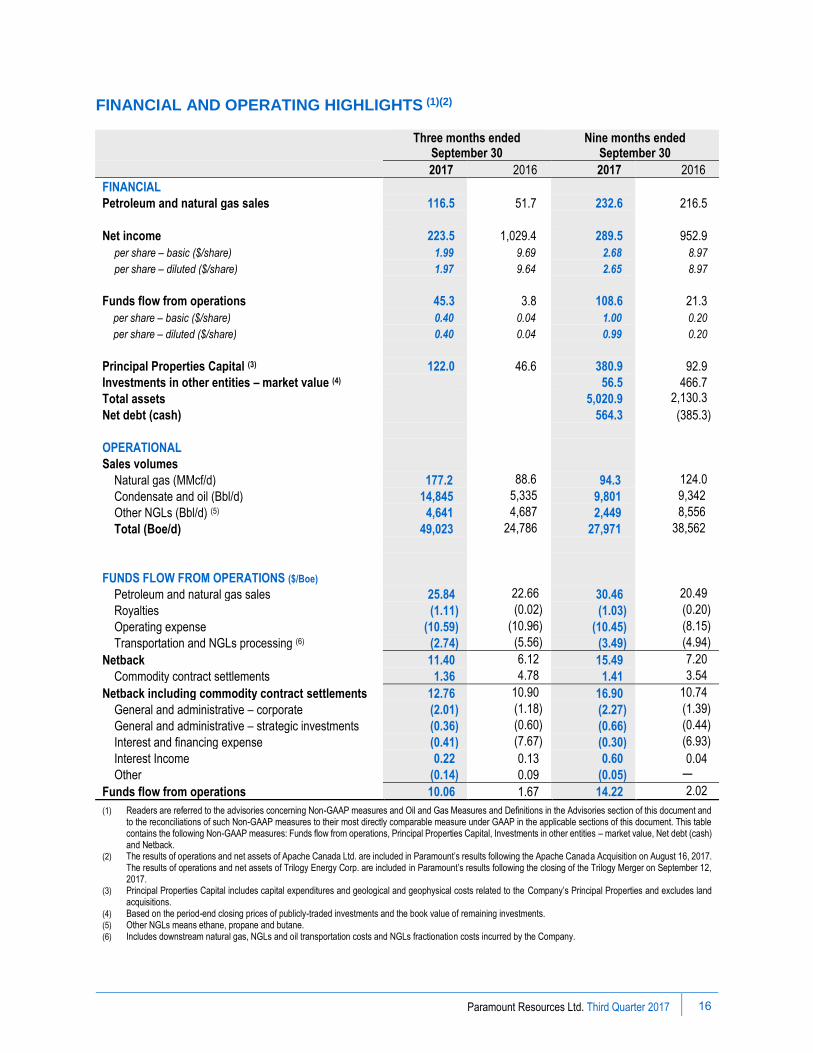
FINANCIAL AND OPERATING HIGHLIGHTS (1)(2)
Three months ended
September 30 Nine months ended
September 30
2017 2016 2017 2016
FINANCIAL
Petroleum and natural gas sales 116.5 51.7 232.6 216.5
Net income 223.5 1,029.4 289.5 952.9
per share – basic ($/share) 1.99 9.69 2.68 8.97
per share – diluted ($/share) 1.97 9.64 2.65 8.97
Funds flow from operations 45.3 3.8 108.6 21.3
per share – basic ($/share) 0.40 0.04 1.00 0.20
per share – diluted ($/share) 0.40 0.04 0.99 0.20
Principal Properties Capital (3) 122.0 46.6 380.9 92.9
Investments in other entities – market value (4) 56.5 466.7
Total assets 5,020.9 2,130.3
Net debt (cash) 564.3 (385.3)
OPERATIONAL
Sales volumes
Natural gas (MMcf/d) 177.2 88.6 94.3 124.0
Condensate and oil (Bbl/d) 14,845 5,335 9,801 9,342
Other NGLs (Bbl/d) (5) 4,641 4,687 2,449 8,556
Total (Boe/d) 49,023 24,786 27,971 38,562
FUNDS FLOW FROM OPERATIONS ($/Boe)
Petroleum and natural gas sales 25.84 22.66 30.46 20.49
Royalties (1.11) (0.02) (1.03) (0.20)
Operating expense (10.59) (10.96) (10.45) (8.15)
Transportation and NGLs processing (6) (2.74) (5.56) (3.49) (4.94)
Netback 11.40 6.12 15.49 7.20
Commodity contract settlements 1.36 4.78 1.41 3.54
Netback including commodity contract settlements 12.76 10.90 16.90 10.74
General and administrative – corporate (2.01) (1.18) (2.27) (1.39)
General and administrative – strategic investments (0.36) (0.60) (0.66) (0.44)
Interest and financing expense (0.41) (7.67) (0.30) (6.93)
Interest Income 0.22 0.13 0.60 0.04
Other (0.14) 0.09 (0.05) ─
Funds flow from operations 10.06 1.67 14.22 2.02
(1) Readers are referred to the advisories concerning Non-GAAP measures and Oil and Gas Measures and Definitions in the Advisories section of this document and to the reconciliations of such Non-GAAP measures to their most directly comparable measure under GAAP in the applicable sections of this document. This table contains the following Non-GAAP measures: Funds flow from operations, Principal Properties Capital, Investments in other entities – market value, Net debt (cash) and Netback.
(2) The results of operations and net assets of Apache Canada Ltd. are included in Paramount’s results following the Apache Canada Acquisition on August 16, 2017. The results of operations and net assets of Trilogy Energy Corp. are included in Paramount’s results following the closing of the Trilogy Merger on September 12, 2017.
(3) Principal Properties Capital includes capital expenditures and geological and geophysical costs related to the Company’s Principal Properties and excludes land acquisitions.
(4) Based on the period-end closing prices of publicly-traded investments and the book value of remaining investments. (5) Other NGLs means ethane, propane and butane. (6) Includes downstream natural gas, NGLs and oil transportation costs and NGLs fractionation costs incurred by the Company.
Paramount Resources Ltd. Third Quarter 2017
16
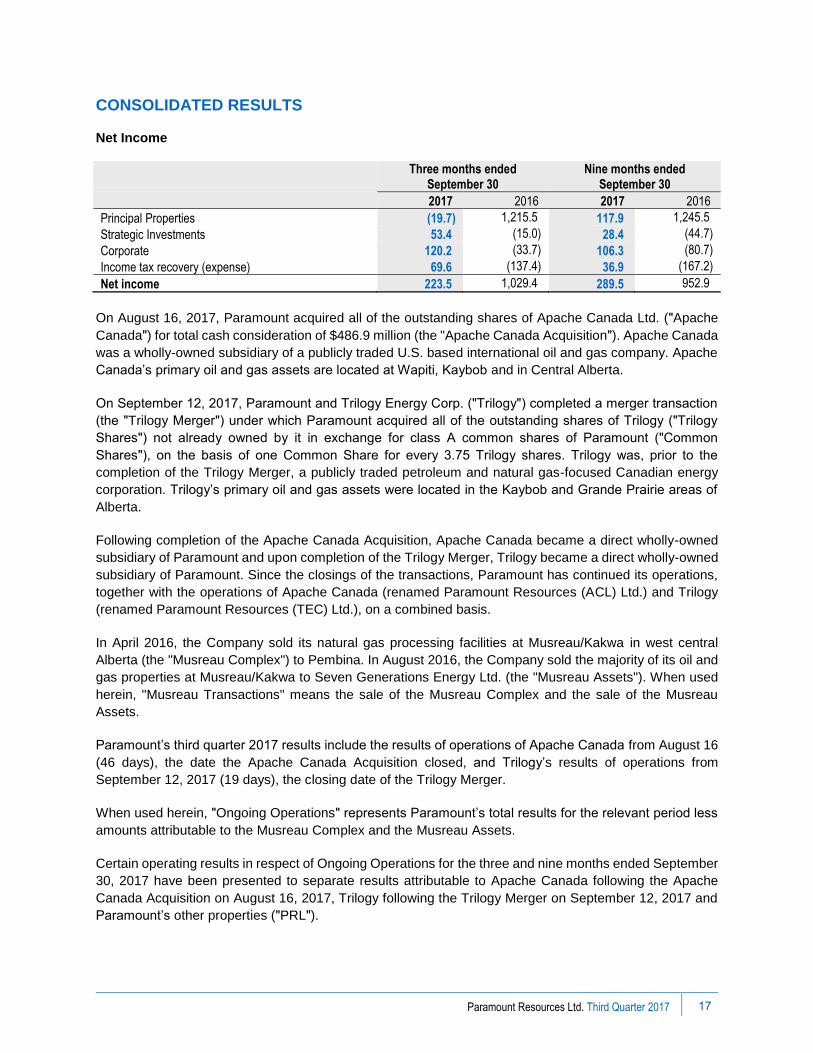
CONSOLIDATED RESULTS
Net Income
Three months ended September 30
Nine months ended September 30
2017 2016 2017 2016
Principal Properties (19.7) 1,215.5 117.9 1,245.5
Strategic Investments 53.4 (15.0) 28.4 (44.7)
Corporate 120.2 (33.7) 106.3 (80.7)
Income tax recovery (expense) 69.6 (137.4) 36.9 (167.2)
Net income 223.5 1,029.4 289.5 952.9
On August 16, 2017, Paramount acquired all of the outstanding shares of Apache Canada Ltd. (ʺApache
Canadaʺ) for total cash consideration of $486.9 million (the "Apache Canada Acquisitionʺ). Apache Canada
was a wholly-owned subsidiary of a publicly traded U.S. based international oil and gas company. Apache
Canada’s primary oil and gas assets are located at Wapiti, Kaybob and in Central Alberta.
On September 12, 2017, Paramount and Trilogy Energy Corp. (ʺTrilogyʺ) completed a merger transaction
(the ʺTrilogy Mergerʺ) under which Paramount acquired all of the outstanding shares of Trilogy (ʺTrilogy
Sharesʺ) not already owned by it in exchange for class A common shares of Paramount (ʺCommon
Sharesʺ), on the basis of one Common Share for every 3.75 Trilogy shares. Trilogy was, prior to the
completion of the Trilogy Merger, a publicly traded petroleum and natural gas-focused Canadian energy
corporation. Trilogy’s primary oil and gas assets were located in the Kaybob and Grande Prairie areas of
Alberta.
Following completion of the Apache Canada Acquisition, Apache Canada became a direct wholly-owned
subsidiary of Paramount and upon completion of the Trilogy Merger, Trilogy became a direct wholly-owned
subsidiary of Paramount. Since the closings of the transactions, Paramount has continued its operations,
together with the operations of Apache Canada (renamed Paramount Resources (ACL) Ltd.) and Trilogy
(renamed Paramount Resources (TEC) Ltd.), on a combined basis.
In April 2016, the Company sold its natural gas processing facilities at Musreau/Kakwa in west central
Alberta (the "Musreau Complex") to Pembina. In August 2016, the Company sold the majority of its oil and
gas properties at Musreau/Kakwa to Seven Generations Energy Ltd. (the "Musreau Assets"). When used
herein, "Musreau Transactions" means the sale of the Musreau Complex and the sale of the Musreau
Assets.
Paramount’s third quarter 2017 results include the results of operations of Apache Canada from August 16
(46 days), the date the Apache Canada Acquisition closed, and Trilogy’s results of operations from
September 12, 2017 (19 days), the closing date of the Trilogy Merger.
When used herein, ʺOngoing Operationsʺ represents Paramount’s total results for the relevant period less
amounts attributable to the Musreau Complex and the Musreau Assets.
Certain operating results in respect of Ongoing Operations for the three and nine months ended September
30, 2017 have been presented to separate results attributable to Apache Canada following the Apache
Canada Acquisition on August 16, 2017, Trilogy following the Trilogy Merger on September 12, 2017 and
Paramount’s other properties (ʺPRLʺ).
Paramount Resources Ltd. Third Quarter 2017 17
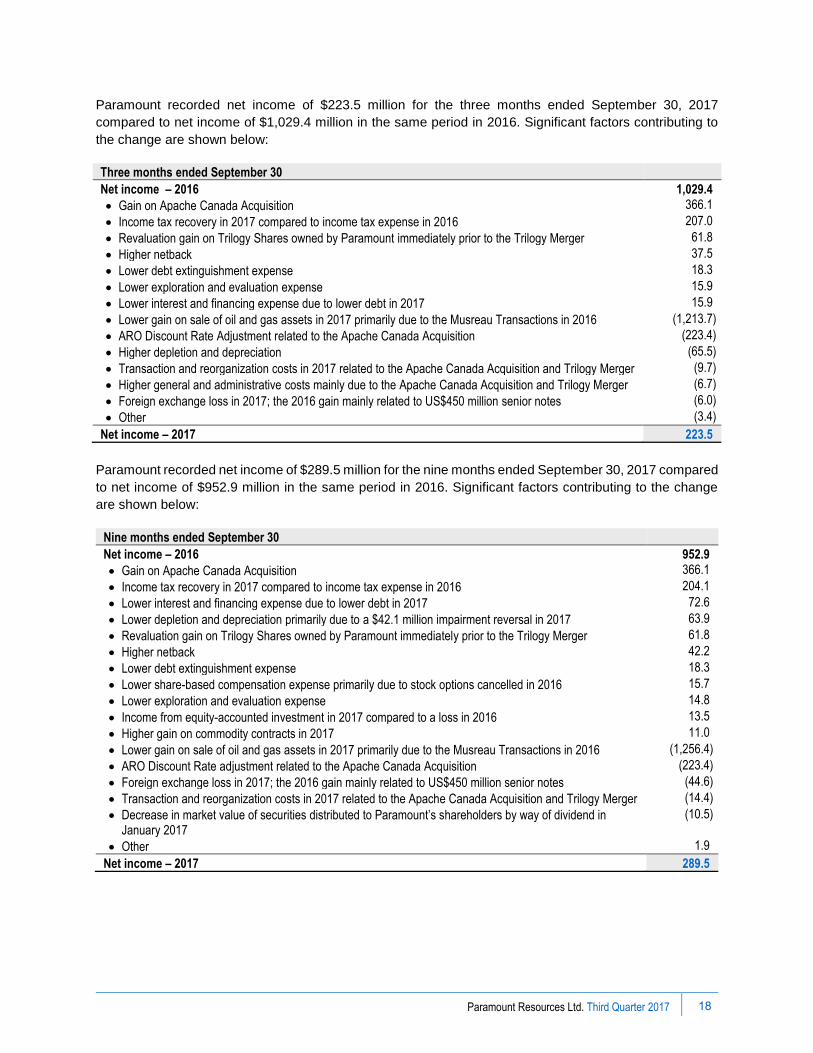
Paramount recorded net income of $223.5 million for the three months ended September 30, 2017
compared to net income of $1,029.4 million in the same period in 2016. Significant factors contributing to
the change are shown below:
Three months ended September 30
Net income – 2016 1,029.4
• Gain on Apache Canada Acquisition 366.1
• Income tax recovery in 2017 compared to income tax expense in 2016 207.0
• Revaluation gain on Trilogy Shares owned by Paramount immediately prior to the Trilogy Merger 61.8
• Higher netback 37.5
• Lower debt extinguishment expense 18.3
• Lower exploration and evaluation expense 15.9
• Lower interest and financing expense due to lower debt in 2017 15.9
• Lower gain on sale of oil and gas assets in 2017 primarily due to the Musreau Transactions in 2016 (1,213.7)
• ARO Discount Rate Adjustment related to the Apache Canada Acquisition (223.4)
• Higher depletion and depreciation (65.5)
• Transaction and reorganization costs in 2017 related to the Apache Canada Acquisition and Trilogy Merger (9.7)
• Higher general and administrative costs mainly due to the Apache Canada Acquisition and Trilogy Merger (6.7)
• Foreign exchange loss in 2017; the 2016 gain mainly related to US$450 million senior notes (6.0)
• Other (3.4)
Net income – 2017 223.5
Paramount recorded net income of $289.5 million for the nine months ended September 30, 2017 compared
to net income of $952.9 million in the same period in 2016. Significant factors contributing to the change
are shown below:
Nine months ended September 30
Net income – 2016 952.9
• Gain on Apache Canada Acquisition 366.1
• Income tax recovery in 2017 compared to income tax expense in 2016 204.1
• Lower interest and financing expense due to lower debt in 2017 72.6
• Lower depletion and depreciation primarily due to a $42.1 million impairment reversal in 2017 63.9
• Revaluation gain on Trilogy Shares owned by Paramount immediately prior to the Trilogy Merger 61.8
• Higher netback 42.2
• Lower debt extinguishment expense 18.3
• Lower share-based compensation expense primarily due to stock options cancelled in 2016 15.7
• Lower exploration and evaluation expense 14.8
• Income from equity-accounted investment in 2017 compared to a loss in 2016 13.5
• Higher gain on commodity contracts in 2017 11.0
• Lower gain on sale of oil and gas assets in 2017 primarily due to the Musreau Transactions in 2016 (1,256.4)
• ARO Discount Rate adjustment related to the Apache Canada Acquisition (223.4)
• Foreign exchange loss in 2017; the 2016 gain mainly related to US$450 million senior notes (44.6)
• Transaction and reorganization costs in 2017 related to the Apache Canada Acquisition and Trilogy Merger (14.4)
• Decrease in market value of securities distributed to Paramount’s shareholders by way of dividend in January 2017
(10.5)
• Other 1.9
Net income – 2017 289.5
Paramount Resources Ltd. Third Quarter 2017
18

Funds Flow from Operations (1)
The following is a reconciliation of funds flow from operations to the nearest GAAP measure:
Three months ended
September 30 Nine months ended
September 30
2017 2016 2017 2016
Cash from operating activities 49.4 9.7 82.9 52.1
Change in non-cash working capital (23.7) (7.8) (5.7) (35.5)
Transaction and reorganization costs 9.7 – 14.4 –
Geological and geophysical expenses 2.2 1.7 4.5 3.9
Asset retirement obligations settled 7.7 0.2 12.5 0.8
Funds flow from operations 45.3 3.8 108.6 21.3
Funds flow from operations ($/Boe) 10.06 1.67 14.22 2.02
(1) Refer to the advisories concerning non-GAAP measures in the Advisories section of this document.
Funds flow from operations for the three months ended September 30, 2017 was $45.3 million compared
to $3.8 million for the same period in 2016. Significant factors contributing to the change are shown below:
Three months ended September 30
Funds flow from operations – 2016 3.8
• Higher netback 37.5
• Lower interest and financing expense due to lower debt in 2017 15.6
• Higher interest income in 2017 0.7
• Higher general and administrative expense (6.7)
• Lower receipts from commodity contract settlements (4.7)
• Other (0.9)
Funds flow from operations – 2017 45.3
Funds flow from operations for the nine months ended September 30, 2017 was $108.6 million compared
to $21.3 million in the same period in 2016. Significant factors contributing to the change are shown below:
Nine months ended September 30
Funds flow from operations – 2016 21.3
• Lower interest and financing expense due to lower debt in 2017 70.9
• Higher netback 42.2
• Higher interest income in 2017 4.4
• Lower receipts from commodity contract settlements (26.6)
• Higher general and administrative expense (3.0)
• Other (0.6)
Funds flow from operations – 2017 108.6
Paramount Resources Ltd. Third Quarter 2017
19
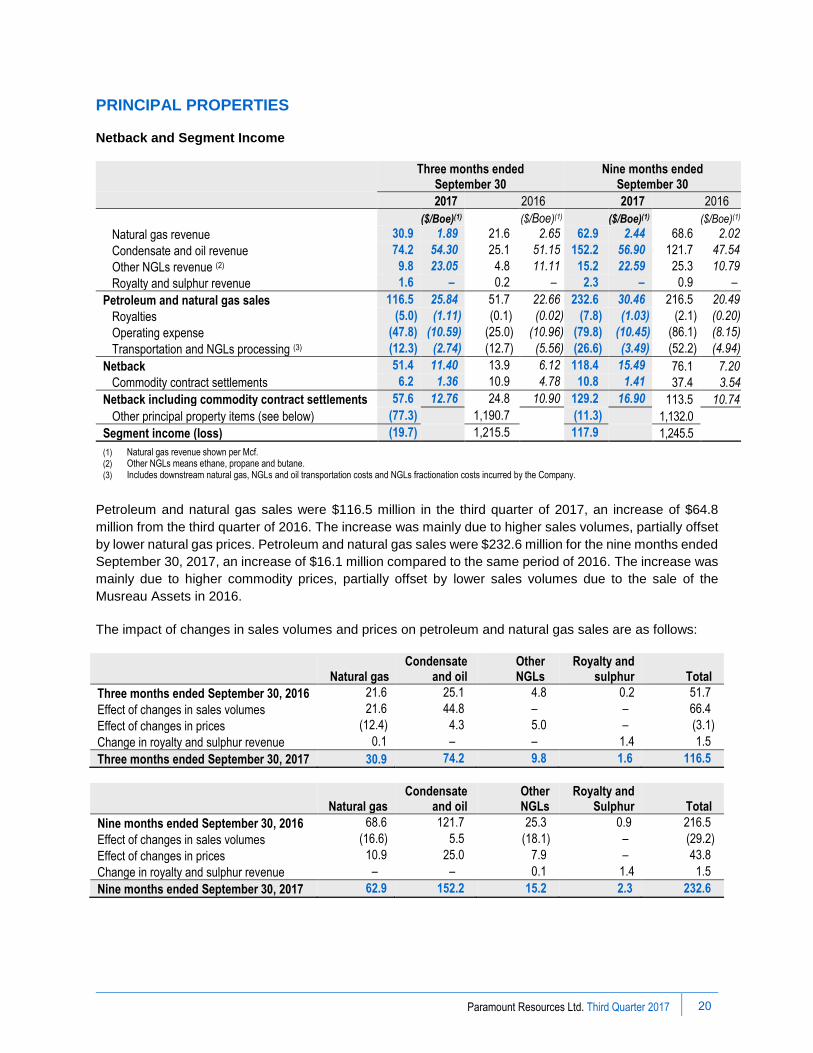
PRINCIPAL PROPERTIES
Netback and Segment Income
Three months ended September 30
Nine months ended September 30
2017 2016 2017 2016
($/Boe)(1) ($/Boe)(1) ($/Boe)(1) ($/Boe)(1)
Natural gas revenue 30.9 1.89 21.6 2.65 62.9 2.44 68.6 2.02
Condensate and oil revenue 74.2 54.30 25.1 51.15 152.2 56.90 121.7 47.54
Other NGLs revenue (2) 9.8 23.05 4.8 11.11 15.2 22.59 25.3 10.79
Royalty and sulphur revenue 1.6 – 0.2 – 2.3 – 0.9 –
Petroleum and natural gas sales 116.5 25.84 51.7 22.66 232.6 30.46 216.5 20.49
Royalties (5.0) (1.11) (0.1) (0.02) (7.8) (1.03) (2.1) (0.20)
Operating expense (47.8) (10.59) (25.0) (10.96) (79.8) (10.45) (86.1) (8.15)
Transportation and NGLs processing (3) (12.3) (2.74) (12.7) (5.56) (26.6) (3.49) (52.2) (4.94)
Netback 51.4 11.40 13.9 6.12 118.4 15.49 76.1 7.20
Commodity contract settlements 6.2 1.36 10.9 4.78 10.8 1.41 37.4 3.54
Netback including commodity contract settlements 57.6 12.76 24.8 10.90 129.2 16.90 113.5 10.74
Other principal property items (see below) (77.3) 1,190.7 (11.3) 1,132.0
Segment income (loss) (19.7) 1,215.5 117.9 1,245.5
(1) Natural gas revenue shown per Mcf. (2) Other NGLs means ethane, propane and butane.(3) Includes downstream natural gas, NGLs and oil transportation costs and NGLs fractionation costs incurred by the Company.
Petroleum and natural gas sales were $116.5 million in the third quarter of 2017, an increase of $64.8
million from the third quarter of 2016. The increase was mainly due to higher sales volumes, partially offset
by lower natural gas prices. Petroleum and natural gas sales were $232.6 million for the nine months ended
September 30, 2017, an increase of $16.1 million compared to the same period of 2016. The increase was
mainly due to higher commodity prices, partially offset by lower sales volumes due to the sale of the
Musreau Assets in 2016.
The impact of changes in sales volumes and prices on petroleum and natural gas sales are as follows:
Natural gas Condensate
and oil Other NGLs
Royalty and sulphur Total
Three months ended September 30, 2016 21.6 25.1 4.8 0.2 51.7
Effect of changes in sales volumes 21.6 44.8 – – 66.4
Effect of changes in prices (12.4) 4.3 5.0 – (3.1)
Change in royalty and sulphur revenue 0.1 – – 1.4 1.5
Three months ended September 30, 2017 30.9 74.2 9.8 1.6 116.5
Natural gas Condensate
and oil Other NGLs
Royalty and Sulphur Total
Nine months ended September 30, 2016 68.6 121.7 25.3 0.9 216.5
Effect of changes in sales volumes (16.6) 5.5 (18.1) – (29.2)
Effect of changes in prices 10.9 25.0 7.9 – 43.8
Change in royalty and sulphur revenue – – 0.1 1.4 1.5
Nine months ended September 30, 2017 62.9 152.2 15.2 2.3 232.6
Paramount Resources Ltd. Third Quarter 2017 20
Sales Volumes
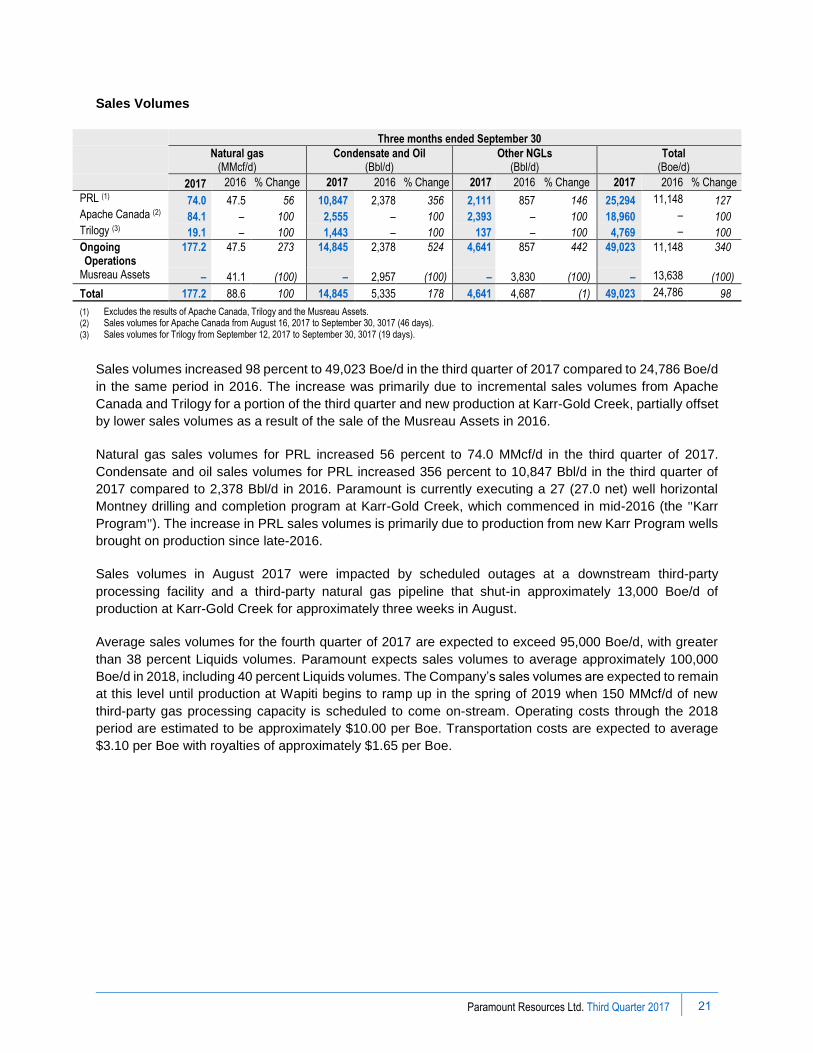
Sales volumes increased 98 percent to 49,023 Boe/d in the third quarter of 2017 compared to 24,786 Boe/d
in the same period in 2016. The increase was primarily due to incremental sales volumes from Apache
Canada and Trilogy for a portion of the third quarter and new production at Karr-Gold Creek, partially offset
by lower sales volumes as a result of the sale of the Musreau Assets in 2016.
Natural gas sales volumes for PRL increased 56 percent to 74.0 MMcf/d in the third quarter of 2017.
Condensate and oil sales volumes for PRL increased 356 percent to 10,847 Bbl/d in the third quarter of
2017 compared to 2,378 Bbl/d in 2016. Paramount is currently executing a 27 (27.0 net) well horizontal
Montney drilling and completion program at Karr-Gold Creek, which commenced in mid-2016 (the "Karr
Program"). The increase in PRL sales volumes is primarily due to production from new Karr Program wells
brought on production since late-2016.
Sales volumes in August 2017 were impacted by scheduled outages at a downstream third-party
processing facility and a third-party natural gas pipeline that shut-in approximately 13,000 Boe/d of
production at Karr-Gold Creek for approximately three weeks in August.
Average sales volumes for the fourth quarter of 2017 are expected to exceed 95,000 Boe/d, with greater
than 38 percent Liquids volumes. Paramount expects sales volumes to average approximately 100,000
Boe/d in 2018, including 40 percent Liquids volumes. The Company’s sales volumes are expected to remain
at this level until production at Wapiti begins to ramp up in the spring of 2019 when 150 MMcf/d of new
third-party gas processing capacity is scheduled to come on-stream. Operating costs through the 2018
period are estimated to be approximately $10.00 per Boe. Transportation costs are expected to average
$3.10 per Boe with royalties of approximately $1.65 per Boe.
Three months ended September 30
Natural gas (MMcf/d)
Condensate and Oil (Bbl/d)
Other NGLs (Bbl/d)
Total (Boe/d)
2017 2016 % Change 2017 2016 % Change 2017 2016 % Change 2017 2016 % Change
PRL (1) 74.0 47.5 56 10,847 2,378 356 2,111 857 146 25,294 11,148 127 Apache Canada (2) 84.1 – 100 2,555 – 100 2,393 – 100 18,960 – 100 Trilogy (3) 19.1 – 100 1,443 – 100 137 – 100 4,769 – 100
Ongoing Operations
177.2 47.5 273 14,845 2,378 524 4,641 857 442 49,023 11,148 340
Musreau Assets – 41.1 (100) – 2,957 (100) – 3,830 (100) – 13,638 (100)
Total 177.2 88.6 100 14,845 5,335 178 4,641 4,687 (1) 49,023 24,786 98
(1) Excludes the results of Apache Canada, Trilogy and the Musreau Assets. (2) Sales volumes for Apache Canada from August 16, 2017 to September 30, 3017 (46 days). (3) Sales volumes for Trilogy from September 12, 2017 to September 30, 3017 (19 days).
Paramount Resources Ltd. Third Quarter 2017
21
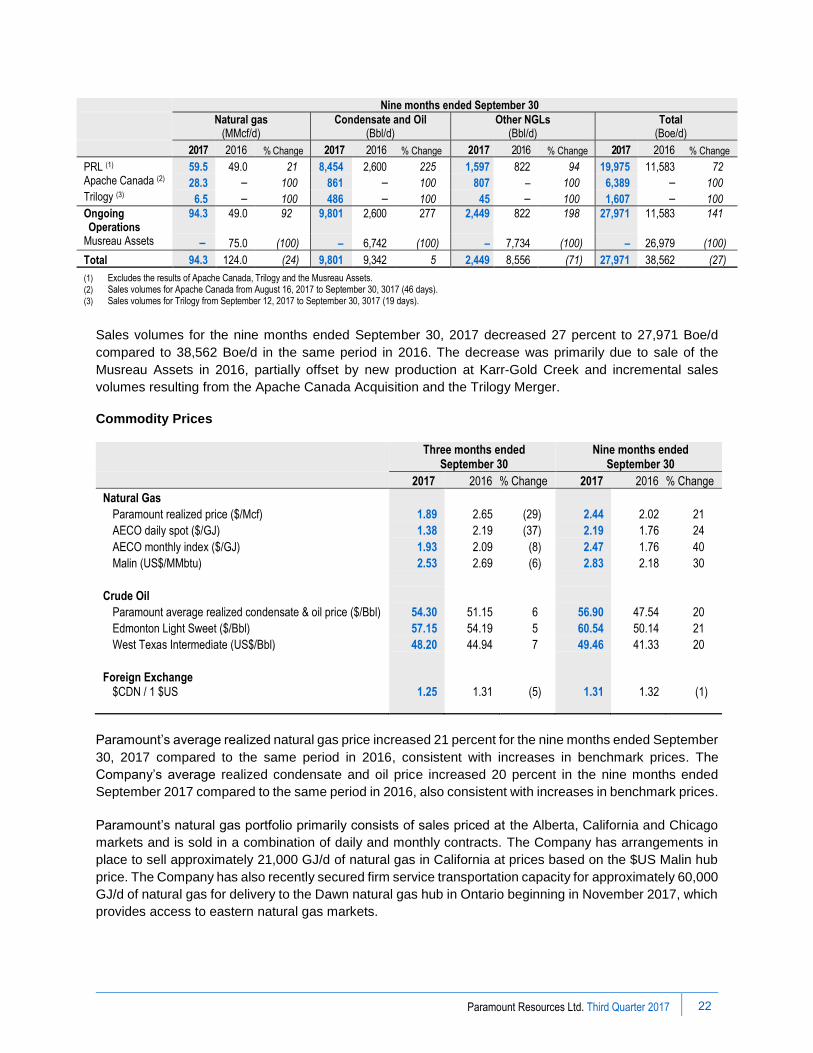
Sales volumes for the nine months ended September 30, 2017 decreased 27 percent to 27,971 Boe/d
compared to 38,562 Boe/d in the same period in 2016. The decrease was primarily due to sale of the
Musreau Assets in 2016, partially offset by new production at Karr-Gold Creek and incremental sales
volumes resulting from the Apache Canada Acquisition and the Trilogy Merger.
Commodity Prices
Three months ended
September 30 Nine months ended
September 30
2017 2016 % Change 2017 2016 % Change
Natural Gas
Paramount realized price ($/Mcf) 1.89 2.65 (29) 2.44 2.02 21
AECO daily spot ($/GJ) 1.38 2.19 (37) 2.19 1.76 24
AECO monthly index ($/GJ) 1.93 2.09 (8) 2.47 1.76 40
Malin (US$/MMbtu) 2.53 2.69 (6) 2.83 2.18 30
Crude Oil
Paramount average realized condensate & oil price ($/Bbl) 54.30 51.15 6 56.90 47.54 20
Edmonton Light Sweet ($/Bbl) 57.15 54.19 5 60.54 50.14 21
West Texas Intermediate (US$/Bbl) 48.20 44.94 7 49.46 41.33 20
Foreign Exchange $CDN / 1 $US
1.25 1.31 (5) 1.31 1.32 (1)
Paramount’s average realized natural gas price increased 21 percent for the nine months ended September
30, 2017 compared to the same period in 2016, consistent with increases in benchmark prices. The
Company’s average realized condensate and oil price increased 20 percent in the nine months ended
September 2017 compared to the same period in 2016, also consistent with increases in benchmark prices.
Paramount’s natural gas portfolio primarily consists of sales priced at the Alberta, California and Chicago
markets and is sold in a combination of daily and monthly contracts. The Company has arrangements in
place to sell approximately 21,000 GJ/d of natural gas in California at prices based on the $US Malin hub
price. The Company has also recently secured firm service transportation capacity for approximately 60,000
GJ/d of natural gas for delivery to the Dawn natural gas hub in Ontario beginning in November 2017, which
provides access to eastern natural gas markets.
Nine months ended September 30
Natural gas (MMcf/d)
Condensate and Oil (Bbl/d)
Other NGLs (Bbl/d)
Total (Boe/d)
2017 2016 % Change 2017 2016 % Change 2017 2016 % Change 2017 2016 % Change
PRL (1) 59.5 49.0 21 8,454 2,600 225 1,597 822 94 19,975 11,583 72 Apache Canada (2) 28.3 – 100 861 – 100 807 – 100 6,389 – 100 Trilogy (3) 6.5 – 100 486 – 100 45 – 100 1,607 – 100
Ongoing Operations
94.3 49.0 92 9,801 2,600 277 2,449 822 198 27,971 11,583 141
Musreau Assets – 75.0 (100) – 6,742 (100) – 7,734 (100) – 26,979 (100)
Total 94.3 124.0 (24) 9,801 9,342 5 2,449 8,556 (71) 27,971 38,562 (27)
(1) Excludes the results of Apache Canada, Trilogy and the Musreau Assets. (2) Sales volumes for Apache Canada from August 16, 2017 to September 30, 3017 (46 days). (3) Sales volumes for Trilogy from September 12, 2017 to September 30, 3017 (19 days).
Paramount Resources Ltd. Third Quarter 2017
22
Paramount sells its condensate volumes in both stabilized and unstabilized condition, depending upon the
location of production and the availability of stabilization capacity. Stabilized condensate volumes delivered
through pipelines typically receive prices for condensate quoted at Edmonton, which are generally higher
than prices for unstabilized condensate volumes, and are adjusted for applicable transportation, quality and
density differentials. Prices for unstabilized condensate volumes trucked to terminals are based on crude
oil or condensate prices quoted at Edmonton, depending on the terminal to which volumes are delivered,
and are adjusted for transportation, quality and density differentials.
Commodity Price Management
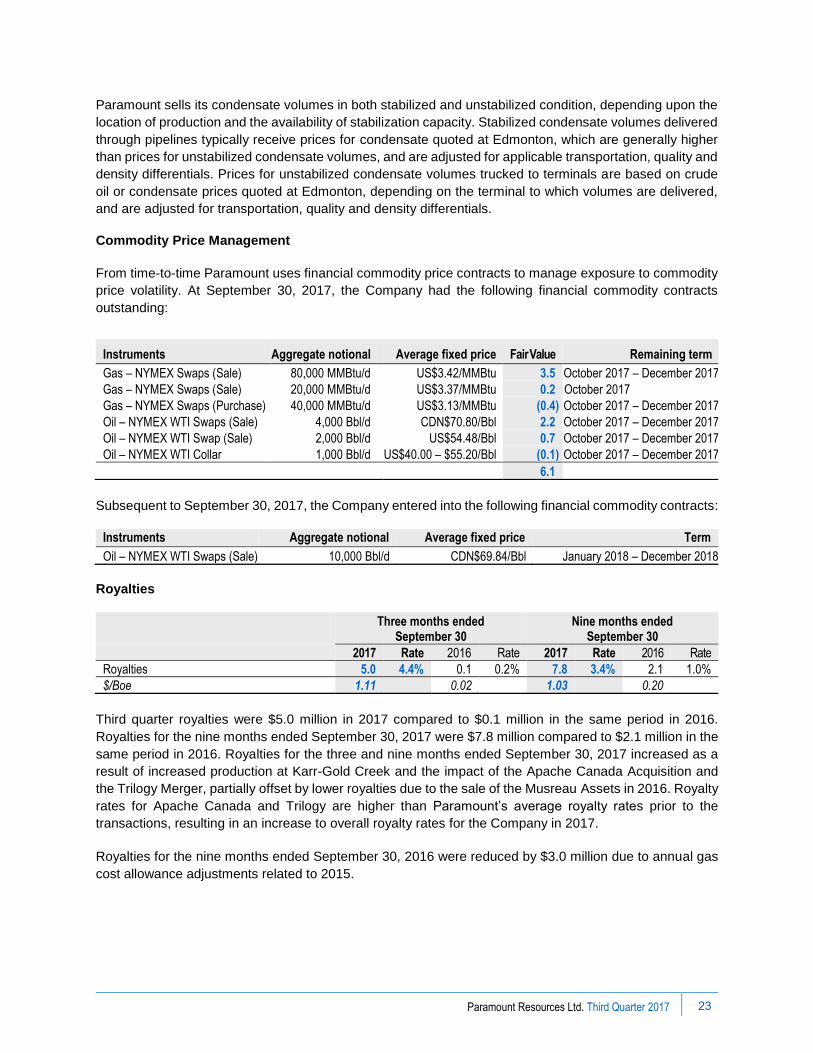
From time-to-time Paramount uses financial commodity price contracts to manage exposure to commodity
price volatility. At September 30, 2017, the Company had the following financial commodity contracts
outstanding:
Subsequent to September 30, 2017, the Company entered into the following financial commodity contracts:
Instruments Aggregate notional Average fixed price Term
Oil – NYMEX WTI Swaps (Sale) 10,000 Bbl/d CDN$69.84/Bbl January 2018 – December 2018
Royalties
Three months ended September 30
Nine months ended September 30
2017 Rate 2016 Rate 2017 Rate 2016 Rate
Royalties 5.0 4.4% 0.1 0.2% 7.8 3.4% 2.1 1.0%
$/Boe 1.11 0.02 1.03 0.20
Third quarter royalties were $5.0 million in 2017 compared to $0.1 million in the same period in 2016.
Royalties for the nine months ended September 30, 2017 were $7.8 million compared to $2.1 million in the
same period in 2016. Royalties for the three and nine months ended September 30, 2017 increased as a
result of increased production at Karr-Gold Creek and the impact of the Apache Canada Acquisition and
the Trilogy Merger, partially offset by lower royalties due to the sale of the Musreau Assets in 2016. Royalty
rates for Apache Canada and Trilogy are higher than Paramount’s average royalty rates prior to the
transactions, resulting in an increase to overall royalty rates for the Company in 2017.
Royalties for the nine months ended September 30, 2016 were reduced by $3.0 million due to annual gas
cost allowance adjustments related to 2015.
Instruments Aggregate notional Average fixed price Fair Value Remaining term
Gas – NYMEX Swaps (Sale) 80,000 MMBtu/d US$3.42/MMBtu 3.5 October 2017 – December 2017
Gas – NYMEX Swaps (Sale) 20,000 MMBtu/d US$3.37/MMBtu 0.2 October 2017
Gas – NYMEX Swaps (Purchase) 40,000 MMBtu/d US$3.13/MMBtu (0.4) October 2017 – December 2017
Oil – NYMEX WTI Swaps (Sale) 4,000 Bbl/d CDN$70.80/Bbl 2.2 October 2017 – December 2017
Oil – NYMEX WTI Swap (Sale) 2,000 Bbl/d US$54.48/Bbl 0.7 October 2017 – December 2017
Oil – NYMEX WTI Collar 1,000 Bbl/d US$40.00 – $55.20/Bbl (0.1) October 2017 – December 2017
6.1
Paramount Resources Ltd. Third Quarter 2017 23
Operating Expense
Three months ended
September 30 Nine months ended
September 30
2017 2016 % Change 2017 2016 % Change
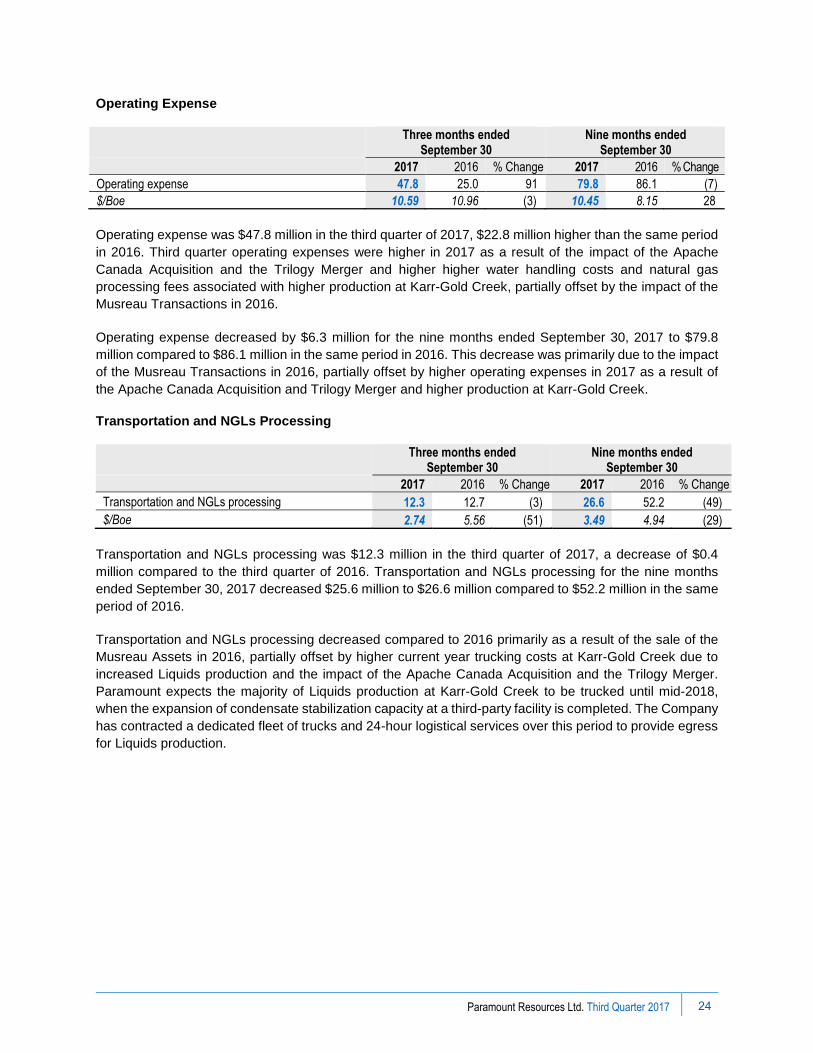
Operating expense 47.8 25.0 91 79.8 86.1 (7)
$/Boe 10.59 10.96 (3) 10.45 8.15 28
Operating expense was $47.8 million in the third quarter of 2017, $22.8 million higher than the same period
in 2016. Third quarter operating expenses were higher in 2017 as a result of the impact of the Apache
Canada Acquisition and the Trilogy Merger and higher higher water handling costs and natural gas
processing fees associated with higher production at Karr-Gold Creek, partially offset by the impact of the
Musreau Transactions in 2016.
Operating expense decreased by $6.3 million for the nine months ended September 30, 2017 to $79.8
million compared to $86.1 million in the same period in 2016. This decrease was primarily due to the impact
of the Musreau Transactions in 2016, partially offset by higher operating expenses in 2017 as a result of
the Apache Canada Acquisition and Trilogy Merger and higher production at Karr-Gold Creek.
Transportation and NGLs Processing
Three months ended
September 30 Nine months ended
September 30
2017 2016 % Change 2017 2016 % Change
Transportation and NGLs processing 12.3 12.7 (3) 26.6 52.2 (49)
$/Boe 2.74 5.56 (51) 3.49 4.94 (29)
Transportation and NGLs processing was $12.3 million in the third quarter of 2017, a decrease of $0.4
million compared to the third quarter of 2016. Transportation and NGLs processing for the nine months
ended September 30, 2017 decreased $25.6 million to $26.6 million compared to $52.2 million in the same
period of 2016.
Transportation and NGLs processing decreased compared to 2016 primarily as a result of the sale of the
Musreau Assets in 2016, partially offset by higher current year trucking costs at Karr-Gold Creek due to
increased Liquids production and the impact of the Apache Canada Acquisition and the Trilogy Merger.
Paramount expects the majority of Liquids production at Karr-Gold Creek to be trucked until mid-2018,
when the expansion of condensate stabilization capacity at a third-party facility is completed. The Company
has contracted a dedicated fleet of trucks and 24-hour logistical services over this period to provide egress
for Liquids production.
Paramount Resources Ltd. Third Quarter 2017
24
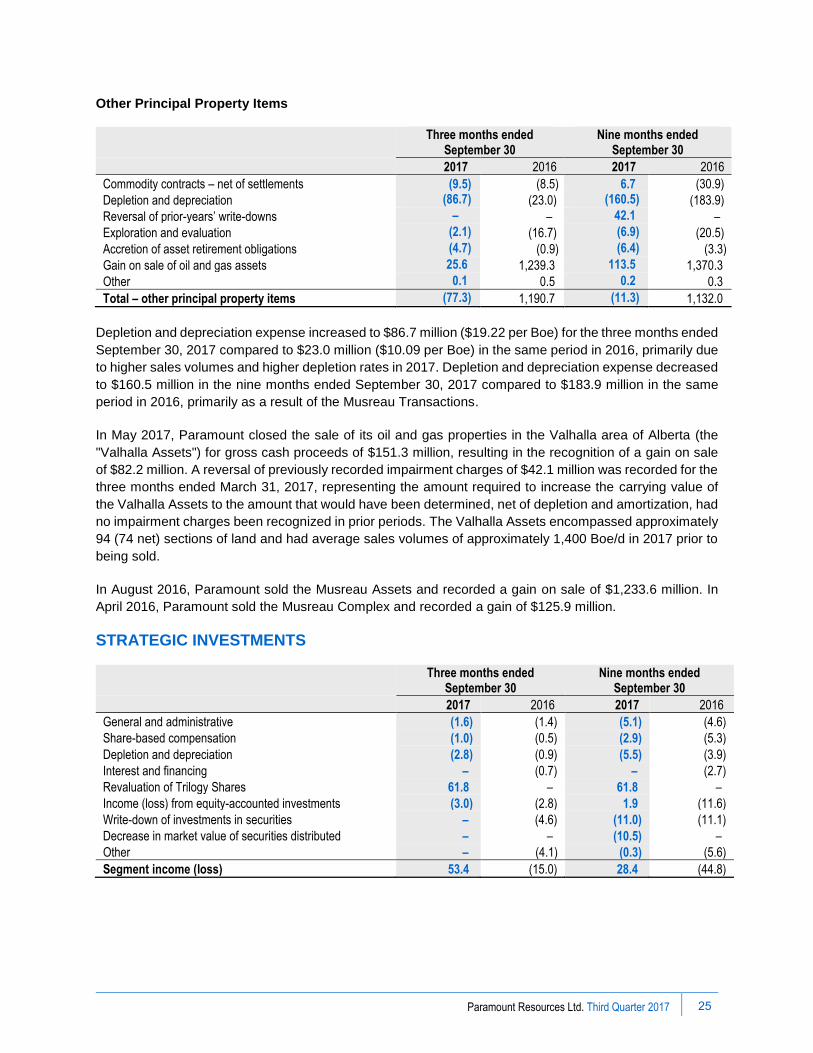
Other Principal Property Items
Three months ended September 30
Nine months ended September 30
2017 2016 2017 2016
Commodity contracts – net of settlements (9.5) (8.5) 6.7 (30.9)
Depletion and depreciation (86.7) (23.0) (160.5) (183.9)
Reversal of prior-years’ write-downs – – 42.1 –
Exploration and evaluation (2.1) (16.7) (6.9) (20.5)
Accretion of asset retirement obligations (4.7) (0.9) (6.4) (3.3)
Gain on sale of oil and gas assets 25.6 1,239.3 113.5 1,370.3
Other 0.1 0.5 0.2 0.3
Total – other principal property items (77.3) 1,190.7 (11.3) 1,132.0
Depletion and depreciation expense increased to $86.7 million ($19.22 per Boe) for the three months ended
September 30, 2017 compared to $23.0 million ($10.09 per Boe) in the same period in 2016, primarily due
to higher sales volumes and higher depletion rates in 2017. Depletion and depreciation expense decreased
to $160.5 million in the nine months ended September 30, 2017 compared to $183.9 million in the same
period in 2016, primarily as a result of the Musreau Transactions.
In May 2017, Paramount closed the sale of its oil and gas properties in the Valhalla area of Alberta (the
"Valhalla Assets") for gross cash proceeds of $151.3 million, resulting in the recognition of a gain on sale
of $82.2 million. A reversal of previously recorded impairment charges of $42.1 million was recorded for the
three months ended March 31, 2017, representing the amount required to increase the carrying value of
the Valhalla Assets to the amount that would have been determined, net of depletion and amortization, had
no impairment charges been recognized in prior periods. The Valhalla Assets encompassed approximately
94 (74 net) sections of land and had average sales volumes of approximately 1,400 Boe/d in 2017 prior to
being sold.
In August 2016, Paramount sold the Musreau Assets and recorded a gain on sale of $1,233.6 million. In
April 2016, Paramount sold the Musreau Complex and recorded a gain of $125.9 million.
STRATEGIC INVESTMENTS
Three months ended September 30
Nine months ended September 30
2017 2016 2017 2016
General and administrative (1.6) (1.4) (5.1) (4.6)
Share-based compensation (1.0) (0.5) (2.9) (5.3)
Depletion and depreciation (2.8) (0.9) (5.5) (3.9)
Interest and financing – (0.7) – (2.7)
Revaluation of Trilogy Shares 61.8 – 61.8 –
Income (loss) from equity-accounted investments (3.0) (2.8) 1.9 (11.6)
Write-down of investments in securities – (4.6) (11.0) (11.1)
Decrease in market value of securities distributed – – (10.5) –
Other – (4.1) (0.3) (5.6)
Segment income (loss) 53.4 (15.0) 28.4 (44.8)
Paramount Resources Ltd. Third Quarter 2017 25

Strategic Investments at September 30, 2017 include:
• investments in the shares of MEG Energy Corp. ("MEG"), Blackbird Energy Inc. ("Blackbird"), Marquee
Energy Ltd. ("Marquee"), RMP Energy Inc. ("RMP Energy"), Strategic Oil & Gas Ltd. ("SOG"), and other
public and private corporations;
• oil sands and carbonate bitumen interests owned by Cavalier, including at Hoole, in the western portion
of the Athabasca Oil Sands region, and carbonate bitumen holdings in northeast Alberta;
• seven triple-sized drilling rigs, including four built-for-purpose walking rigs, owned and operated by Fox
Drilling; and
• Shale Gas Properties in the Liard and Horn River Basins in northeast British Columbia and the
Northwest Territories.
The carrying value of the 19.1 million Trilogy shares held by Paramount immediately prior to the Trilogy
Merger was increased to fair value, resulting in the recognition of a gain of $61.8 million.
The aggregate write-downs of investments in securities of $11.0 million for the nine months ended
September 30, 2017 and $11.1 million for the nine months ended September 30, 2016 resulted from
decreases in the market value of certain of the Company’s publicly traded investments.
In December 2016, the Company’s Board of Directors declared a dividend of the Company’s remaining 3.8
million class A common shares of Seven Generations Energy Ltd. ("7Gen Shares") to holders of record of
Paramount’s Common Shares on January 9, 2017. The decrease in the fair value of the 7Gen Shares of
$10.5 million between the acquisition date and the date of the dividend, January 16, 2017, was reclassified
to net income from accumulated other comprehensive income in respect of the distribution of the 7Gen
Shares.
Investments
Paramount holds investments in a number of publicly-traded and private corporations as part of its portfolio
of Strategic Investments. These investments, including MEG, were primarily received as consideration for
properties sold to the entities. Paramount’s investments are summarized as follows:
Carrying Value Market Value (1)
As at September 30, 2017 September 30, 2016 September 30, 2017 September 30, 2016
Seven Generations – 277.9 – 277.9
Trilogy (2) – 46.8 – 138.0
MEG 20.3 21.9 20.3 21.9
Other (3) 36.2 28.9 36.2 28.9
Total 56.5 375.5 56.5 466.7
(1) Based on the period-end closing price of publicly traded investments and the book value of remaining investments. (2) On September 12, 2017, Paramount acquired all of the outstanding Trilogy Shares not already owned by it pursuant to the Trilogy Merger. As a result, no carrying
value or market value is shown as at September 30, 2017 as Trilogy is now a wholly-owned subsidiary of Paramount and its results of operations and net assets have been reflected in Paramount’s consolidated financial statements.
(3) Includes investments in Blackbird, Marquee, RMP Energy, SOG and other public and private corporations.
Paramount Resources Ltd. Third Quarter 2017
26
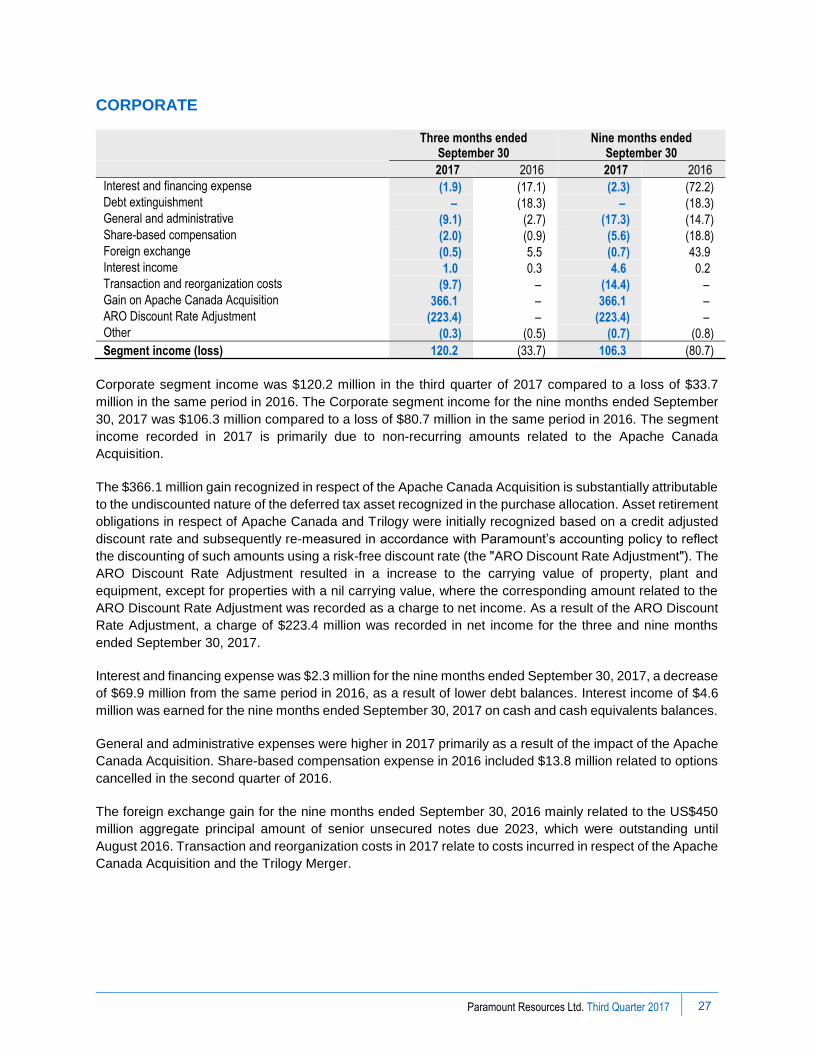
CORPORATE
Three months ended September 30
Nine months ended September 30
2017 2016 2017 2016
Interest and financing expense (1.9) (17.1) (2.3) (72.2) Debt extinguishment – (18.3) – (18.3)General and administrative (9.1) (2.7) (17.3) (14.7)Share-based compensation (2.0) (0.9) (5.6) (18.8)Foreign exchange (0.5) 5.5 (0.7) 43.9Interest income 1.0 0.3 4.6 0.2 Transaction and reorganization costs (9.7) – (14.4) – Gain on Apache Canada Acquisition 366.1 – 366.1 – ARO Discount Rate Adjustment (223.4) – (223.4) – Other (0.3) (0.5) (0.7) (0.8)
Segment income (loss) 120.2 (33.7) 106.3 (80.7)
Corporate segment income was $120.2 million in the third quarter of 2017 compared to a loss of $33.7
million in the same period in 2016. The Corporate segment income for the nine months ended September
30, 2017 was $106.3 million compared to a loss of $80.7 million in the same period in 2016. The segment
income recorded in 2017 is primarily due to non-recurring amounts related to the Apache Canada
Acquisition.
The $366.1 million gain recognized in respect of the Apache Canada Acquisition is substantially attributable
to the undiscounted nature of the deferred tax asset recognized in the purchase allocation. Asset retirement
obligations in respect of Apache Canada and Trilogy were initially recognized based on a credit adjusted
discount rate and subsequently re-measured in accordance with Paramount’s accounting policy to reflect
the discounting of such amounts using a risk-free discount rate (the ʺARO Discount Rate Adjustmentʺ). The
ARO Discount Rate Adjustment resulted in a increase to the carrying value of property, plant and
equipment, except for properties with a nil carrying value, where the corresponding amount related to the
ARO Discount Rate Adjustment was recorded as a charge to net income. As a result of the ARO Discount
Rate Adjustment, a charge of $223.4 million was recorded in net income for the three and nine months
ended September 30, 2017.
Interest and financing expense was $2.3 million for the nine months ended September 30, 2017, a decrease
of $69.9 million from the same period in 2016, as a result of lower debt balances. Interest income of $4.6
million was earned for the nine months ended September 30, 2017 on cash and cash equivalents balances.
General and administrative expenses were higher in 2017 primarily as a result of the impact of the Apache
Canada Acquisition. Share-based compensation expense in 2016 included $13.8 million related to options
cancelled in the second quarter of 2016.
The foreign exchange gain for the nine months ended September 30, 2016 mainly related to the US$450
million aggregate principal amount of senior unsecured notes due 2023, which were outstanding until
August 2016. Transaction and reorganization costs in 2017 relate to costs incurred in respect of the Apache
Canada Acquisition and the Trilogy Merger.
Paramount Resources Ltd. Third Quarter 2017 27
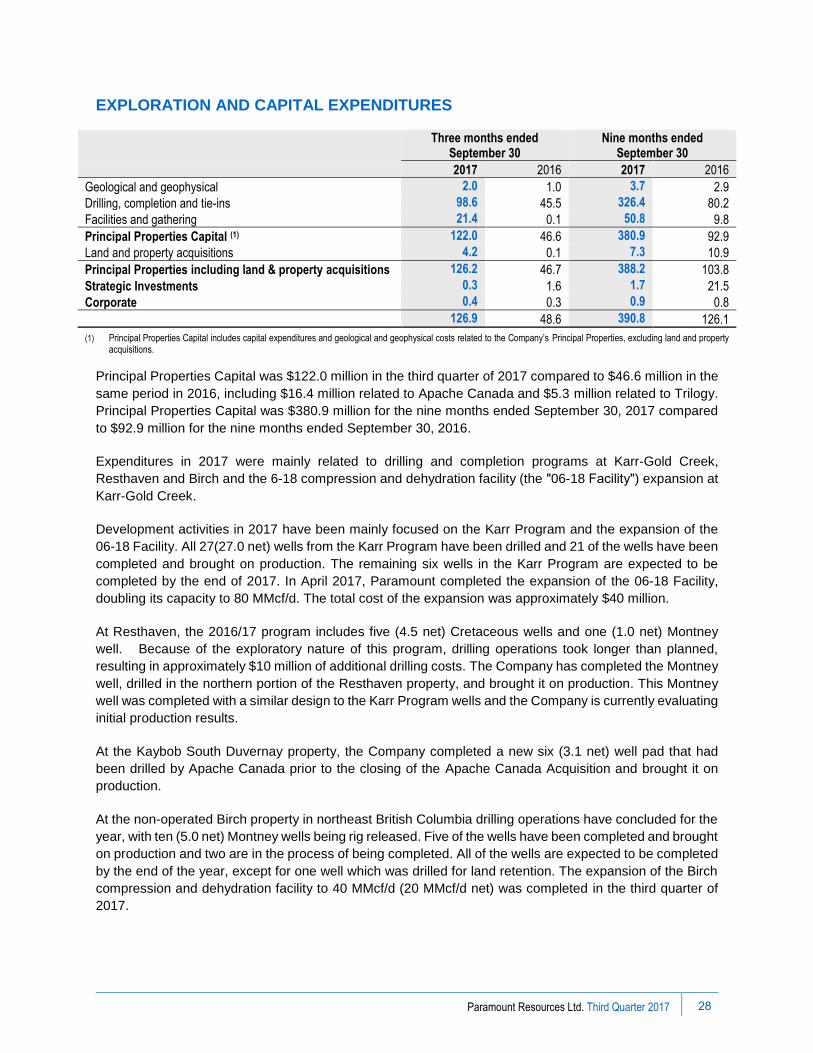
EXPLORATION AND CAPITAL EXPENDITURES
Three months ended
September 30 Nine months ended
September 30
2017 2016 2017 2016
Geological and geophysical 2.0 1.0 3.7 2.9
Drilling, completion and tie-ins 98.6 45.5 326.4 80.2
Facilities and gathering 21.4 0.1 50.8 9.8
Principal Properties Capital (1) 122.0 46.6 380.9 92.9
Land and property acquisitions 4.2 0.1 7.3 10.9
Principal Properties including land & property acquisitions 126.2 46.7 388.2 103.8
Strategic Investments 0.3 1.6 1.7 21.5
Corporate 0.4 0.3 0.9 0.8
126.9 48.6 390.8 126.1
(1) Principal Properties Capital includes capital expenditures and geological and geophysical costs related to the Company’s Principal Properties, excluding land and property acquisitions.
Principal Properties Capital was $122.0 million in the third quarter of 2017 compared to $46.6 million in the
same period in 2016, including $16.4 million related to Apache Canada and $5.3 million related to Trilogy.
Principal Properties Capital was $380.9 million for the nine months ended September 30, 2017 compared
to $92.9 million for the nine months ended September 30, 2016.
Expenditures in 2017 were mainly related to drilling and completion programs at Karr-Gold Creek,
Resthaven and Birch and the 6-18 compression and dehydration facility (the ʺ06-18 Facilityʺ) expansion at
Karr-Gold Creek.
Development activities in 2017 have been mainly focused on the Karr Program and the expansion of the
06-18 Facility. All 27(27.0 net) wells from the Karr Program have been drilled and 21 of the wells have been
completed and brought on production. The remaining six wells in the Karr Program are expected to be
completed by the end of 2017. In April 2017, Paramount completed the expansion of the 06-18 Facility,
doubling its capacity to 80 MMcf/d. The total cost of the expansion was approximately $40 million.
At Resthaven, the 2016/17 program includes five (4.5 net) Cretaceous wells and one (1.0 net) Montney
well. Because of the exploratory nature of this program, drilling operations took longer than planned,
resulting in approximately $10 million of additional drilling costs. The Company has completed the Montney
well, drilled in the northern portion of the Resthaven property, and brought it on production. This Montney
well was completed with a similar design to the Karr Program wells and the Company is currently evaluating
initial production results.
At the Kaybob South Duvernay property, the Company completed a new six (3.1 net) well pad that had
been drilled by Apache Canada prior to the closing of the Apache Canada Acquisition and brought it on
production.
At the non-operated Birch property in northeast British Columbia drilling operations have concluded for the
year, with ten (5.0 net) Montney wells being rig released. Five of the wells have been completed and brought
on production and two are in the process of being completed. All of the wells are expected to be completed
by the end of the year, except for one well which was drilled for land retention. The expansion of the Birch
compression and dehydration facility to 40 MMcf/d (20 MMcf/d net) was completed in the third quarter of
2017.
Paramount Resources Ltd. Third Quarter 2017
28
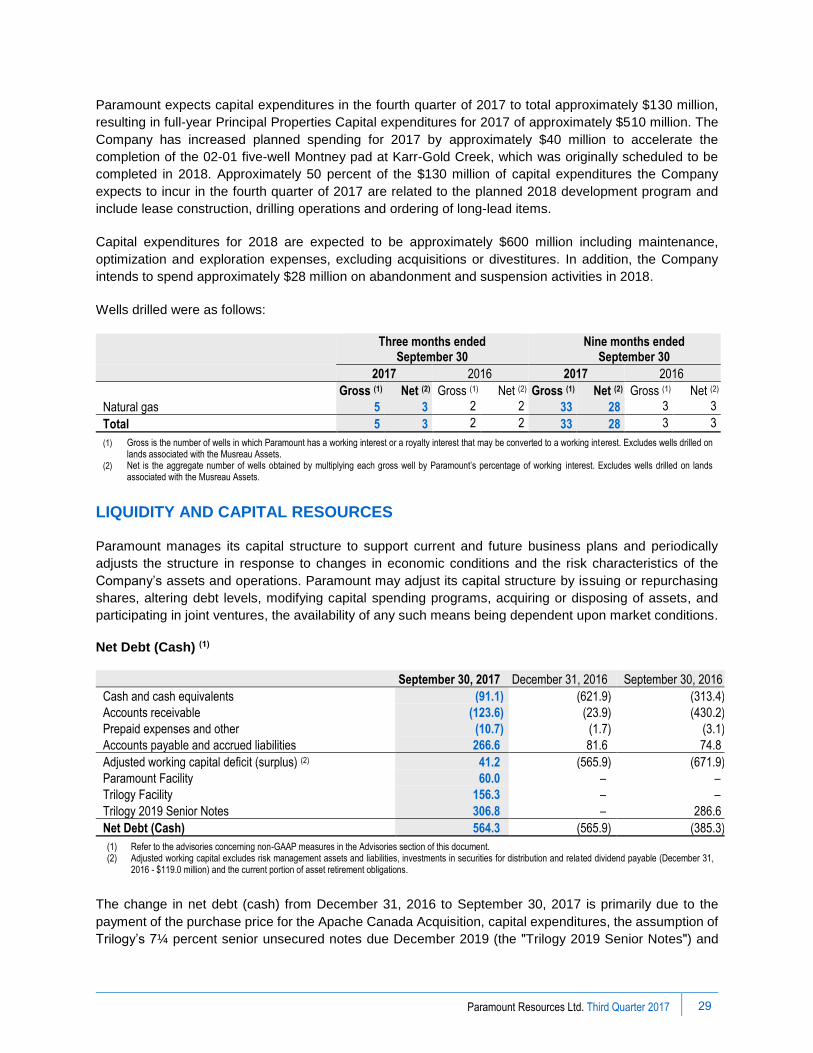
Paramount expects capital expenditures in the fourth quarter of 2017 to total approximately $130 million,
resulting in full-year Principal Properties Capital expenditures for 2017 of approximately $510 million. The
Company has increased planned spending for 2017 by approximately $40 million to accelerate the
completion of the 02-01 five-well Montney pad at Karr-Gold Creek, which was originally scheduled to be
completed in 2018. Approximately 50 percent of the $130 million of capital expenditures the Company
expects to incur in the fourth quarter of 2017 are related to the planned 2018 development program and
include lease construction, drilling operations and ordering of long-lead items.
Capital expenditures for 2018 are expected to be approximately $600 million including maintenance,
optimization and exploration expenses, excluding acquisitions or divestitures. In addition, the Company
intends to spend approximately $28 million on abandonment and suspension activities in 2018.
Wells drilled were as follows:
Three months ended September 30
Nine months ended September 30
2017 2016 2017 2016
Gross (1) Net (2) Gross (1) Net (2) Gross (1) Net (2) Gross (1) Net (2)
Natural gas 5 3 2 2 33 28 3 3
Total 5 3 2 2 33 28 3 3
(1) Gross is the number of wells in which Paramount has a working interest or a royalty interest that may be converted to a working interest. Excludes wells drilled on lands associated with the Musreau Assets.
(2) Net is the aggregate number of wells obtained by multiplying each gross well by Paramount’s percentage of working interest. Excludes wells drilled on lands associated with the Musreau Assets.
LIQUIDITY AND CAPITAL RESOURCES
Paramount manages its capital structure to support current and future business plans and periodically
adjusts the structure in response to changes in economic conditions and the risk characteristics of the
Company’s assets and operations. Paramount may adjust its capital structure by issuing or repurchasing
shares, altering debt levels, modifying capital spending programs, acquiring or disposing of assets, and
participating in joint ventures, the availability of any such means being dependent upon market conditions.
Net Debt (Cash) (1)
September 30, 2017 December 31, 2016 September 30, 2016
Cash and cash equivalents (91.1) (621.9) (313.4)
Accounts receivable (123.6) (23.9) (430.2)
Prepaid expenses and other (10.7) (1.7) (3.1)
Accounts payable and accrued liabilities 266.6 81.6 74.8
Adjusted working capital deficit (surplus) (2) 41.2 (565.9) (671.9)
Paramount Facility 60.0 – –
Trilogy Facility 156.3 – –
Trilogy 2019 Senior Notes 306.8 – 286.6
Net Debt (Cash) 564.3 (565.9) (385.3)
(1) Refer to the advisories concerning non-GAAP measures in the Advisories section of this document.(2) Adjusted working capital excludes risk management assets and liabilities, investments in securities for distribution and related dividend payable (December 31,
2016 - $119.0 million) and the current portion of asset retirement obligations.
The change in net debt (cash) from December 31, 2016 to September 30, 2017 is primarily due to the
payment of the purchase price for the Apache Canada Acquisition, capital expenditures, the assumption of
Trilogy’s 7¼ percent senior unsecured notes due December 2019 (the ʺTrilogy 2019 Senior Notesʺ) and
Paramount Resources Ltd. Third Quarter 2017 29

amounts drawn on Trilogy’s bank credit facility, partially offset by proceeds from sales of oil and gas assets
and funds flow from operations. Paramount expects to fund its operations, obligations and capital
expenditures for the remainder of 2017 with funds flow from operations and available capacity under its
bank credit facility.
Trilogy Facility
As of September 30, 2017, Trilogy had a $285 million senior secured revolving credit facility with a syndicate
of Canadian banks (the ʺTrilogy Facilityʺ). The Trilogy Facility was secured by a charge over the assets of
Trilogy.
In November 2017, the Trilogy Facility was repaid in full and cancelled.
Paramount Facility
In November 2017, Paramount’s senior secured revolving bank credit facility was increased to $700 million and was changed from a reserves-based structure to a financial covenant-based structure (the ʺParamount Facilityʺ). In addition, the tenure of the Paramount Facility was changed from a ʺone plus oneʺ extendible facility to a ʺfour yearʺ extendible facility. The maturity date of the Paramount Facility is currently November 6, 2021, which may be extended from time-to-time at the option of Paramount and with the agreement of the lenders. At Paramount’s request, the size of the Paramount Facility may be further increased by up to $300 million pursuant to an accordion feature in the facility, subject to securing incremental lender commitments.
Borrowings under the Paramount Facility bear interest at the lenders’ prime lending rate, US base rate,
bankers’ acceptance rates, or LIBOR rates, as selected at the discretion of the Company, plus an applicable
margin which is dependent upon the Company’s Senior Secured Debt to Consolidated EBITDA ratio. The
Paramount Facility is secured by a charge over substantially all of the assets of Paramount, excluding the
assets of Cavalier and Fox Drilling. The assets of Trilogy are also excluded from the security on an interim
basis until not later than March 2, 2018.
Paramount is subject to the following two financial covenants under the Paramount Facility, tested at the
end of each fiscal quarter:
i. Senior Secured Debt to Consolidated EBITDA to be 3.00 to 1.00 or less (or 3.50 to 1.00 or
less for two fiscal quarters after completion of a material acquisition); and
ii. Consolidated EBITDA to Consolidated Interest Expense to be 2.50 to 1.00 or greater.
Senior Secured Debt currently consists of amounts drawn under the Paramount Facility and outstanding letters of credit. Consolidated EBITDA is determined on a trailing twelve month basis, is adjusted for material acquisitions and dispositions, and is generally calculated as net income before Consolidated Interest Expense, taxes, depletion, depreciation, amortization, impairment and exploration and evaluation expense and is also adjusted to exclude non-recurring items and other non-cash items including unrealized mark-to-market amounts on derivatives, unrealized foreign exchange, share-based compensation expense and accretion. Consolidated Interest Expense is reduced by any interest income and other customary exclusions and is calculated on a trailing twelve month basis. Paramount is in compliance with the covenants under the Paramount Facility.
Paramount Resources Ltd. Third Quarter 2017
30

At November 6, 2017, following repayment of the Trilogy Facility, $315.0 million was drawn on the Paramount Facility. Paramount had undrawn letters of credit outstanding totaling $34.7 million at November 6, 2017 that reduce the amount available to be drawn on the facility.
Trilogy 2019 Senior Notes
Trilogy has outstanding $300 million principal amount of senior unsecured notes due 2019. The Trilogy
2019 Senior Notes bear interest at 7¼ percent per annum, payable semi-annually in arrears on June 13
and December 13 of each year, and mature on December 13, 2019.
The Trilogy 2019 Senior Notes are direct senior unsecured obligations of Trilogy. The Trilogy 2019 Senior
Notes are redeemable in whole or in part at par, plus accrued and unpaid interest to the date of redemption,
plus a redemption premium, if applicable, which varies based on the date of redemption.
At September 30, 2017, the Trilogy 2019 Senior Notes had a market value of 102.0 percent of their principal
amount. The market value of the Trilogy 2019 Senior Notes were estimated using a market approach
based on prices quoted from financial institutions, which are level two fair value hierarchy inputs.
Shareholders’ Equity
September 30, 2017 December 31, 2016
Share capital 2,248.6 1,639.5
Retained earnings (accumulated deficit) 156.5 (152.2)
Reserves 141.6 147.5
Total shareholders’ equity 2,546.7 1,634.8
Share Capital
In September 2017, Paramount issued 28,537,134 Common Shares pursuant to the Trilogy Merger.
On October 13, 2016, Paramount implemented a normal course issuer bid (“NCIB”) under which the Company could purchase up to 5,441,602 Common Shares for cancellation. In 2016, the Company purchased and cancelled 622,900 Common Shares at a total cost of $9.7 million under the NCIB. The NCIB expired on October 12, 2017.
At November 6, 2017, Paramount had 134,937,241 Common Shares outstanding and 5,747,740 options
to acquire Common Shares outstanding, of which 948,360 options are exercisable.
Paramount Resources Ltd. Third Quarter 2017 31

QUARTERLY INFORMATION
2017 2016 2015
Q3 Q2 Q1 Q4 Q3 Q2 Q1 Q4
Petroleum and natural gas sales 116.5 61.3 54.7 32.3 51.7 73.6 91.2 91.3
Net income (loss) 223.5 45.3 20.7 212.4 1,029.4 (30.6) (46.0) (599.0) Per share – basic ($/share) 1.99 0.43 0.20 2.01 9.69 (0.29) (0.43) (5.64)
Per share – diluted ($/share) 1.97 0.42 0.19 1.99 9.64 (0.29) (0.43) (5.64)
Funds flow from operations 45.3 35.2 28.0 14.3 3.8 (4.9) 22.4 21.0 Per share – basic ($/share) 0.40 0.33 0.26 0.14 0.04 (0.05) 0.21 0.20
Per share – diluted ($/share) 0.40 0.33 0.26 0.13 0.04 (0.05) 0.21 0.20
Sales volumes
Natural gas (MMcf/d) 177.2 53.0 51.4 47.5 88.6 129.8 153.9 157.8
Condensate and oil (Bbl/d) 14,845 8,118 6,348 2,943 5,335 9,490 13,245 9,991
Other NGLs (Bbl/d) 4,641 1,414 1,255 1,046 4,687 9,764 11,259 9,175
Total (Boe/d) 49,023 18,367 16,163 11,901 24,786 40,890 50,161 45,466
Average realized price
Natural gas ($/Mcf) 1.89 3.24 3.55 3.10 2.65 1.49 2.09 2.57
Condensate and oil ($/Bbl) 54.30 57.95 61.75 60.49 51.15 52.83 42.28 46.60
Other NGLs ($/Bbl) 23.05 20.09 23.69 22.16 11.11 11.19 10.31 12.59
Total ($/Boe) 25.84 36.69 37.61 29.52 22.66 19.79 19.98 21.82
Significant Items Impacting Quarterly Results
Quarterly earnings variances include the impacts of changing production volumes and market prices.
• Third quarter 2017 earnings include a $366.1 million gain related to the Apache Canada Acquisition, a
$223.4 million charge related to the ARO Discount Rate Adjustment and a $61.8 million gain related to
a fair value adjustment in respect of the Trilogy Shares held prior to the Trilogy Merger.
• Second quarter 2017 earnings include an $80.9 million gain on the sale of oil and gas assets primarily
related to the sale of the Valhalla Assets.
• First quarter 2017 earnings include a $42.1 million reversal of impairments of oil and gas assets
recorded in prior years related to the Valhalla Assets and a $10.5 million loss on the distribution of 3.8
million 7Gen Shares to Paramount shareholders by way of dividend.
• Fourth quarter 2016 earnings include a $133.2 million reversal of impairments of oil and gas assets
recorded in prior years, a $99.2 million gain recorded in respect of the royalty granted by Cavalier and
the recognition of $61.0 million of previously unrecognized deferred tax assets.
• Third quarter 2016 earnings include the impact of the sale of the Musreau Assets, including a $1.2
billion gain on sale, lower depletion and depreciation expense, higher income tax expense and lower
netback.
• Second quarter 2016 earnings include a $131.8 million gain on the sale of oil and gas assets primarily
in respect of the sale of the Musreau Complex, partially offset by $17.7 million of share-based
compensation expense.
• First quarter 2016 earnings include a foreign exchange gain of $40.3 million and a $13.7 million gain
on commodity contracts.
Paramount Resources Ltd. Third Quarter 2017 32
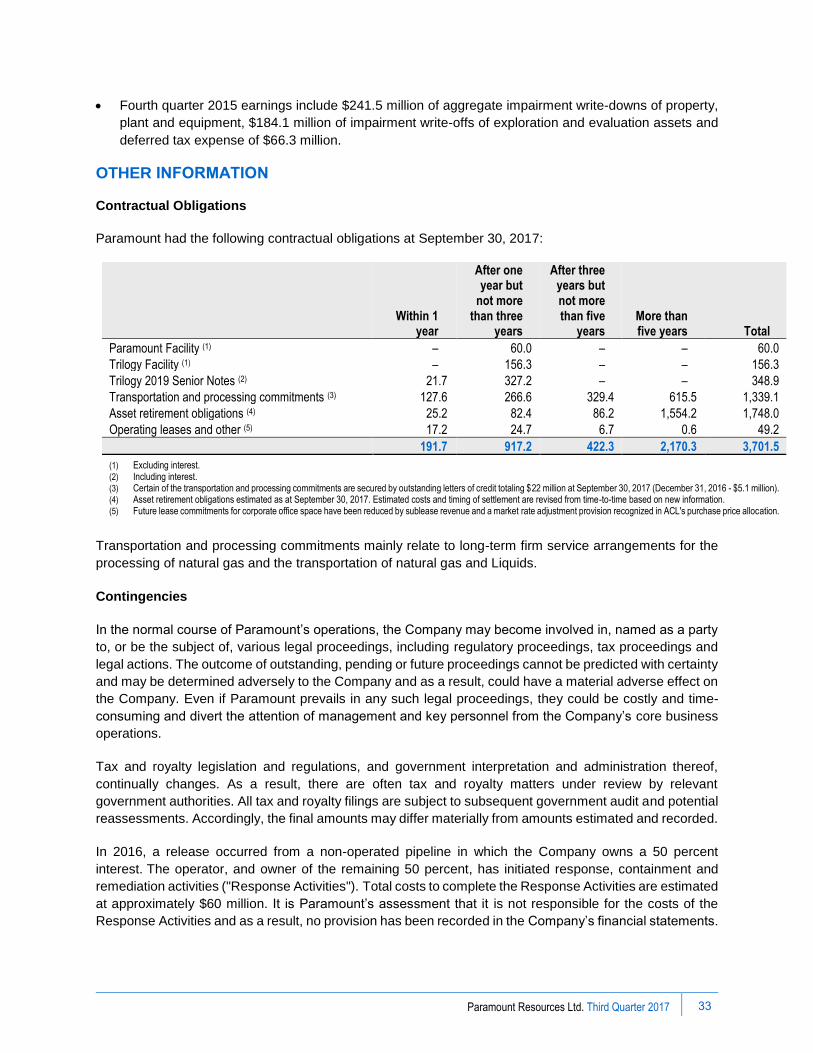
• Fourth quarter 2015 earnings include $241.5 million of aggregate impairment write-downs of property,
plant and equipment, $184.1 million of impairment write-offs of exploration and evaluation assets and
deferred tax expense of $66.3 million.
OTHER INFORMATION
Contractual Obligations
Paramount had the following contractual obligations at September 30, 2017:
Within 1
year
After one year but
not more than three
years
After three years but not more than five
years More than five years Total
Paramount Facility (1) – 60.0 – – 60.0
Trilogy Facility (1) – 156.3 – – 156.3
Trilogy 2019 Senior Notes (2) 21.7 327.2 – – 348.9
Transportation and processing commitments (3) 127.6 266.6 329.4 615.5 1,339.1
Asset retirement obligations (4) 25.2 82.4 86.2 1,554.2 1,748.0
Operating leases and other (5) 17.2 24.7 6.7 0.6 49.2
191.7 917.2 422.3 2,170.3 3,701.5
(1) Excluding interest. (2) Including interest. (3) Certain of the transportation and processing commitments are secured by outstanding letters of credit totaling $22 million at September 30, 2017 (December 31, 2016 - $5.1 million). (4) Asset retirement obligations estimated as at September 30, 2017. Estimated costs and timing of settlement are revised from time-to-time based on new information. (5) Future lease commitments for corporate office space have been reduced by sublease revenue and a market rate adjustment provision recognized in ACL's purchase price allocation.
Transportation and processing commitments mainly relate to long-term firm service arrangements for the
processing of natural gas and the transportation of natural gas and Liquids.
Contingencies
In the normal course of Paramount’s operations, the Company may become involved in, named as a party
to, or be the subject of, various legal proceedings, including regulatory proceedings, tax proceedings and
legal actions. The outcome of outstanding, pending or future proceedings cannot be predicted with certainty
and may be determined adversely to the Company and as a result, could have a material adverse effect on
the Company. Even if Paramount prevails in any such legal proceedings, they could be costly and time-
consuming and divert the attention of management and key personnel from the Company’s core business
operations.
Tax and royalty legislation and regulations, and government interpretation and administration thereof,
continually changes. As a result, there are often tax and royalty matters under review by relevant
government authorities. All tax and royalty filings are subject to subsequent government audit and potential
reassessments. Accordingly, the final amounts may differ materially from amounts estimated and recorded.
In 2016, a release occurred from a non-operated pipeline in which the Company owns a 50 percent
interest. The operator, and owner of the remaining 50 percent, has initiated response, containment and
remediation activities ("Response Activities"). Total costs to complete the Response Activities are estimated
at approximately $60 million. It is Paramount’s assessment that it is not responsible for the costs of the
Response Activities and as a result, no provision has been recorded in the Company’s financial statements.
Paramount Resources Ltd. Third Quarter 2017
33

CHANGE IN ACCOUNTING POLICIES
There were no new or amended accounting standards adopted by the Company for the nine months ended
September 30, 2017. A description of accounting standards that will be effective in the future is included in
the notes to the Company’s audited Consolidated Financial Statements as at and for the year ended
December 31, 2016.
INTERNAL CONTROLS OVER FINANCIAL REPORTING
There have been no significant changes to the Company’s internal control over financial reporting (ʺICFRʺ)
during the period beginning on July 1, 2017 and ended September 30, 2017 that have materially affected,
or are reasonably likely to materially affect, the Company’s ICFR.
Paramount closed the Apache Canada Acquisition on August 16, 2017 and the Trilogy Merger on
September 12, 2017. Management has limited the scope of their design of disclosure controls and
procedures (ʺDC&Pʺ) and ICFR to exclude the controls, policies and procedures of Apache Canada and
Trilogy, pursuant to Section 3.3(1)(b) of National Instrument 52-109. Amounts in respect of Apache Canada
and Trilogy included in Paramount’s interim consolidated financial statements as at and for the three and
nine months ended September 30, 3017 are as follows:
Apache Canada Trilogy
Revenue 31.7 9.9 Current Assets 86.4 33.6 Total Assets 2,063.7 1,553.4 Current Liabilities 86.8 66.9 Total Liabilities 1,388.3 848.2
Management is currently evaluating and integrating Apache Canada’s and Trilogy’s controls, policies and
procedures with Paramount’s DC&P and ICFR and expects to complete the integration in 2018.
ADVISORIES
Forward-looking Information
Certain statements in this document constitute forward-looking information under applicable securities
legislation. Forward-looking information typically contains statements with words such as "anticipate",
"believe", "estimate", "will", "expect", "plan", "schedule", "intend", "propose", or similar words suggesting
future outcomes or an outlook. Forward-looking information in this document includes, but is not limited to:
• projected production and sales volumes (including the Liquids component thereof);
• forecast capital expenditures, royalties, operating costs, abandonment and suspension costs, andtransportation costs;
• exploration, development, and associated operational plans and strategies (including planneddrilling and completion programs, well tie-ins, and facility expansions, and the anticipated timingthereof) and the Company’s anticipated sources of funds to carry out such plans and strategies; and
• general business strategies and objectives.
Such forward-looking information is based on a number of assumptions which may prove to be incorrect.
Assumptions have been made with respect to the following matters, in addition to any other assumptions
identified in this document:
Paramount Resources Ltd. Third Quarter 2017 34
• future natural gas and Liquids prices;
• royalty rates, taxes and capital, operating, general & administrative and other costs;
• foreign currency exchange rates and interest rates;
• general business, economic and market conditions;
• the ability of Paramount to obtain the required capital to finance its exploration, development andother operations and meet its commitments and financial obligations;
• the ability of Paramount to obtain equipment, services, supplies and personnel in a timely mannerand at an acceptable cost to carry out its activities;
• the ability of Paramount to secure adequate product processing, transportation, de-ethanization,fractionation, and storage capacity on acceptable terms;
• the ability of Paramount to market its natural gas and Liquids successfully to current and newcustomers;
• the ability of Paramount and its industry partners to obtain drilling success (including in respect ofanticipated production volumes, reserves additions, Liquids yields and resource recoveries) andoperational improvements, efficiencies and results consistent with expectations;
• the timely receipt of required governmental and regulatory approvals; and
• anticipated timelines and budgets being met in respect of drilling programs and other operations(including well completions and tie-ins and the construction, commissioning and start-up of new andexpanded facilities).
Although Paramount believes that the expectations reflected in such forward-looking information is
reasonable, undue reliance should not be placed on them as Paramount can give no assurance that such
expectations will prove to be correct. Forward-looking information is based on expectations, estimates and
projections that involve a number of risks and uncertainties which could cause actual results to differ
materially from those anticipated by Paramount and described in the forward-looking information. The
material risks and uncertainties include, but are not limited to:
• fluctuations in natural gas and Liquids prices;
• changes in foreign currency exchange rates and interest rates;
• the uncertainty of estimates and projections relating to future revenue, future production, reserveadditions, Liquids yields (including condensate to natural gas ratios), resource recoveries, royaltyrates, taxes and costs and expenses;
• the ability to secure adequate product processing, transportation, de-ethanization, fractionation, andstorage capacity on acceptable terms;
• operational risks in exploring for, developing and producing, natural gas and Liquids;
• the ability to obtain equipment, services, supplies and personnel in a timely manner and at anacceptable cost;
• potential disruptions, delays or unexpected technical or other difficulties in designing, developing,expanding or operating new, expanded or existing facilities (including third-party facilities);
• processing, pipeline, de-ethanization, and fractionation infrastructure outages, disruptions andconstraints;
• risks and uncertainties involving the geology of oil and gas deposits;
• the uncertainty of reserves and resources estimates;
• general business, economic and market conditions;
• the ability to generate sufficient cash flow from operations and obtain financing to fund plannedexploration, development and operational activities and meet current and future commitments andobligations (including product processing, transportation, de-ethanization, fractionation and similarcommitments and obligations);
• changes in, or in the interpretation of, laws, regulations or policies (including environmental laws);
• the ability to obtain required governmental or regulatory approvals in a timely manner, and to enterinto and maintain leases and licenses;
• the effects of weather;
Paramount Resources Ltd. Third Quarter 2017 35

• the timing and cost of future abandonment and reclamation obligations and potential liabilities forenvironmental damage and contamination;
• uncertainties regarding aboriginal claims and in maintaining relationships with local populations andother stakeholders;
• the outcome of existing and potential lawsuits, regulatory actions, audits and assessments; and
• other risks and uncertainties described elsewhere in this document and in Paramount’s other filingswith Canadian securities authorities.
The foregoing list of risks is not exhaustive. For more information relating to risks, see the section titled
"RISK FACTORS" in Paramount's current annual information form. The forward-looking information
contained in this document is made as of the date hereof and, except as required by applicable securities
law, Paramount undertakes no obligation to update publicly or revise any forward-looking statements or
information, whether as a result of new information, future events or otherwise.
Non-GAAP Measures
In this document "Funds flow from operations", "Netback", "Net Debt (Cash)", "Adjusted working capital",
"Exploration and Capital Expenditures", "Principal Properties Capital" and "Investments in other entities –
market value", collectively the "Non-GAAP Measures", are used and do not have any standardized
meanings as prescribed by IFRS.
Funds flow from operations refers to cash from (used in) operating activities before net changes in
operating non-cash working capital, geological and geophysical expenses, asset retirement obligation
settlements and transaction and reorganization costs. Funds flow from operations is commonly used in the
oil and gas industry to assist management and investors in measuring the Company’s ability to fund capital
programs and meet financial obligations. Refer to the Consolidated Results section of the Company’s
Management’s Discussion and Analysis for the calculation thereof. Netback equals petroleum and natural
gas sales less royalties, operating costs and transportation and NGLs processing costs. Netback is
commonly used by management and investors to compare the results of the Company’s oil and gas
operations between periods. Refer to the Principal Properties section of the Company’s Management’s
Discussion and Analysis for the calculation thereof. Net Debt (Cash) is a measure of the Company’s overall
debt position after adjusting for certain working capital and other amounts and is used by management to
assess the Company’s overall leverage position. Refer to the Liquidity and Capital Resources section of
the Company’s Management’s Discussion and Analysis for the calculation of Net Debt (Cash) and
Adjusted working capital. Exploration and capital expenditures consist of the Company’s spending on
wells and infrastructure projects, other property, plant and equipment, land and property acquisitions and
geological and geophysical costs incurred. The closest GAAP measure to exploration and development
expenditures is property, plant and equipment and exploration cash flows under investing activities in the
Company’s Consolidated Statement of Cash Flows, which includes all of the items included in exploration
and capital expenditures, except for geological and geophysical costs, which are expensed as incurred.
Principal Properties Capital includes capital expenditures and geological and geophysical costs related
to the Company’s Principal Properties business segment, and excludes land acquisitions. The Principal
Properties Capital measure provides management and investors with information regarding the Company’s
Principal Properties spending on wells and infrastructure projects separate from land acquisition activity
and capitalized interest. The following is the calculation of exploration and capital expenditures and
Principal Properties for the periods:
Paramount Resources Ltd. Third Quarter 2017 36
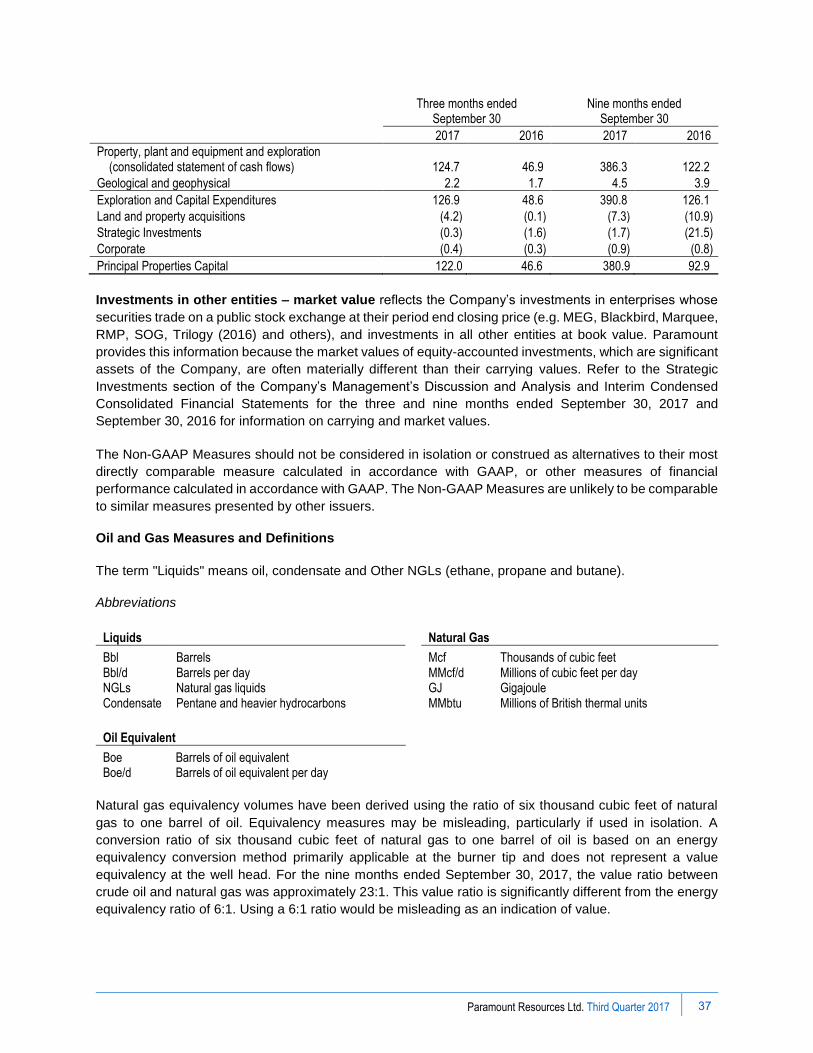
Three months ended
September 30 Nine months ended
September 30
2017 2016 2017 2016
Property, plant and equipment and exploration (consolidated statement of cash flows) 124.7 46.9 386.3 122.2
Geological and geophysical 2.2 1.7 4.5 3.9
Exploration and Capital Expenditures 126.9 48.6 390.8 126.1
Land and property acquisitions (4.2) (0.1) (7.3) (10.9)
Strategic Investments (0.3) (1.6) (1.7) (21.5)
Corporate (0.4) (0.3) (0.9) (0.8)
Principal Properties Capital 122.0 46.6 380.9 92.9
Investments in other entities – market value reflects the Company’s investments in enterprises whose
securities trade on a public stock exchange at their period end closing price (e.g. MEG, Blackbird, Marquee,
RMP, SOG, Trilogy (2016) and others), and investments in all other entities at book value. Paramount
provides this information because the market values of equity-accounted investments, which are significant
assets of the Company, are often materially different than their carrying values. Refer to the Strategic
Investments section of the Company’s Management’s Discussion and Analysis and Interim Condensed
Consolidated Financial Statements for the three and nine months ended September 30, 2017 and
September 30, 2016 for information on carrying and market values.
The Non-GAAP Measures should not be considered in isolation or construed as alternatives to their most
directly comparable measure calculated in accordance with GAAP, or other measures of financial
performance calculated in accordance with GAAP. The Non-GAAP Measures are unlikely to be comparable
to similar measures presented by other issuers.
Oil and Gas Measures and Definitions
The term "Liquids" means oil, condensate and Other NGLs (ethane, propane and butane).
Abbreviations
Liquids Natural Gas
Bbl Barrels Mcf Thousands of cubic feet Bbl/d Barrels per day MMcf/d Millions of cubic feet per day NGLs Natural gas liquids
GJ Gigajoule
Condensate Pentane and heavier hydrocarbons MMbtu Millions of British thermal units
Oil Equivalent
Boe Barrels of oil equivalent Boe/d Barrels of oil equivalent per day
Natural gas equivalency volumes have been derived using the ratio of six thousand cubic feet of natural
gas to one barrel of oil. Equivalency measures may be misleading, particularly if used in isolation. A
conversion ratio of six thousand cubic feet of natural gas to one barrel of oil is based on an energy
equivalency conversion method primarily applicable at the burner tip and does not represent a value
equivalency at the well head. For the nine months ended September 30, 2017, the value ratio between
crude oil and natural gas was approximately 23:1. This value ratio is significantly different from the energy
equivalency ratio of 6:1. Using a 6:1 ratio would be misleading as an indication of value.
Paramount Resources Ltd. Third Quarter 2017
37
Interim Condensed Consolidated Financial Statements (Unaudited)
September 30, 2017
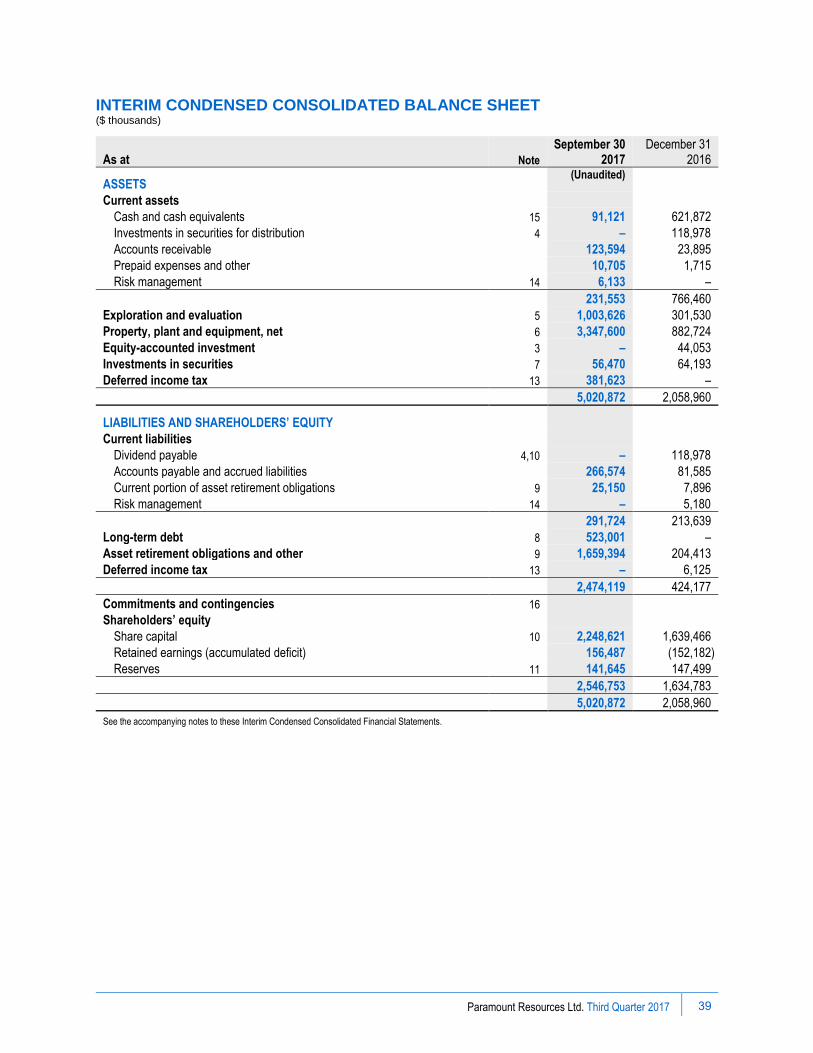
INTERIM CONDENSED CONSOLIDATED BALANCE SHEET ($ thousands)
As at Note
September 30 2017
December 31 2016
ASSETS (Unaudited)
Current assets
Cash and cash equivalents 15 91,121 621,872
Investments in securities for distribution 4 – 118,978
Accounts receivable 123,594 23,895
Prepaid expenses and other 10,705 1,715
Risk management 14 6,133 –
231,553 766,460
Exploration and evaluation 5 1,003,626 301,530
Property, plant and equipment, net 6 3,347,600 882,724
Equity-accounted investment 3 – 44,053
Investments in securities 7 56,470 64,193
Deferred income tax 13 381,623 –
5,020,872 2,058,960
LIABILITIES AND SHAREHOLDERS’ EQUITY
Current liabilities
Dividend payable 4,10 – 118,978
Accounts payable and accrued liabilities 266,574 81,585
Current portion of asset retirement obligations 9 25,150 7,896
Risk management 14 – 5,180
291,724 213,639
Long-term debt 8 523,001 –
Asset retirement obligations and other 9 1,659,394 204,413
Deferred income tax 13 – 6,125
2,474,119 424,177
Commitments and contingencies 16
Shareholders’ equity
Share capital 10 2,248,621 1,639,466
Retained earnings (accumulated deficit) 156,487 (152,182)
Reserves 11 141,645 147,499
2,546,753 1,634,783
5,020,872 2,058,960
See the accompanying notes to these Interim Condensed Consolidated Financial Statements.
Paramount Resources Ltd. Third Quarter 2017 39

INTERIM CONDENSED CONSOLIDATED STATEMENT OF COMPREHENSIVE INCOME (Unaudited) ($ thousands, except as noted)
Three months ended September 30
Nine months ended September 30
Note 2017 2016 2017 2016
Petroleum and natural gas sales 116,539 51,681 232,570 216,505
Royalties (5,029) (51) (7,834) (2,128)
Revenue 111,510 51,630 224,736 214,377
Gain (loss) on commodity contracts 14 (3,379) 2,389 17,484 6,519
108,131 54,019 242,220 220,896
Expenses
Operating expense 47,758 25,001 79,814 86,097
Transportation and NGLs processing 12,328 12,675 26,640 52,170
General and administrative 10,692 4,040 22,386 19,381
Share-based compensation 12 3,075 1,421 8,506 24,164
Depletion and depreciation 6 89,707 24,171 124,577 188,463
Exploration and evaluation 5 1,461 17,337 6,757 21,561
Gain on sale of oil and gas assets 6 (25,581) (1,239,304) (113,927) (1,370,299)
Interest and financing 1,864 17,808 2,304 74,862
Accretion of asset retirement obligations 9 4,766 1,003 6,715 3,614
Foreign exchange 484 (5,548) 674 (43,947)
Debt extinguishment – 18,283 – 18,283
Transaction and reorganization costs 2,3 9,709 – 14,446 –
156,263 (1,123,113) 178,892 (925,651)
Income (loss) from equity-accounted investment 58,795 (2,829) 63,729 (11,578)
Gain on Apache Canada Acquisition 2 366,062 – 366,062 –
ARO Discount Rate Adjustment 9 (223,375) – (223,375) –
Other 4 496 (7,532) (17,090) (14,913)
Income before tax 153,846 1,166,771 252,654 1,120,056
Income tax expense (recovery) 13
Deferred (69,609) 137,367 (36,869) 167,180
(69,609) 137,367 (36,869) 167,180
Net income 223,455 1,029,404 289,523 952,876
Other comprehensive income (loss), net of tax Items that may be reclassified to net income (loss):
Change in market value of securities 5,517 53,890 (36,737) 50,581 Reclassification of accumulated losses on securities to net income (loss) – (32,371) 21,480 (25,877) Deferred tax on other comprehensive income (loss) related to securities – (3,079) 948 (3,079)
Comprehensive income 228,972 1,047,844 275,214 974,501
Net income per common share ($/share) 10
Basic 1.99 9.69 2.68 8.97
Diluted 1.97 9.64 2.65 8.97
See the accompanying notes to these Interim Condensed Consolidated Financial Statements.
Paramount Resources Ltd. Third Quarter 2017 40

INTERIM CONDENSED CONSOLIDATED STATEMENT OF CASH FLOWS (Unaudited) ($ thousands)
Three months ended September 30
Nine months ended September 30
Note 2017 2016 2017 2016
Operating activities
Net income 223,455 1,029,404 289,523 952,876
Add (deduct):
Items not involving cash 15 (190,009) (1,045,582) (199,850) (953,713)
Asset retirement obligations settled 9 (7,737) (207) (12,503) (823)
Debt extinguishment – 18,283 – 18,283
Change in non-cash working capital 23,703 7,839 5,716 35,524
Cash from operating activities 49,412 9,737 82,886 52,147
Financing activities
Net repayment of limited-recourse demand facilities – (58,710) – (100,911)
Net draw (repayment) of revolving long-term debt 57,535 (224,369) 57,535 (695,384)
Redemption of senior notes – (169,648) – (169,648)
Common shares issued, net of issue costs 634 257 4,042 338
Cash from (used in) financing activities 58,169 (452,470) 61,577 (965,605)
Investing activities
Property, plant and equipment and exploration (124,675) (46,904) (386,267) (122,218)
Proceeds on sale of oil and gas assets 3,356 496,077 153,829 1,060,994
Proceeds on sale of investments, net of costs – 306,192 – 306,192
Corporate acquisition 2 (486,852) – (486,852) –
Cash acquired on corporate acquisition 2 25,468 – 25,468 –
Change in non-cash working capital 1,548 (10,901) 20,233 (29,693)
Cash from (used in) investing activities (581,155) 744,464 (673,589) 1,215,275
Net increase (decrease) (473,574) 301,731 (529,126) 301,817
Foreign exchange on cash and cash equivalents (926) 4 (1,625) (403) Cash and cash equivalents, beginning of period 565,621 11,620 621,872 11,941
Cash and cash equivalents, end of period 91,121 313,355 91,121 313,355
Supplemental cash flow information 15
See the accompanying notes to these Interim Condensed Consolidated Financial Statements.
Paramount Resources Ltd. Third Quarter 2017 41

INTERIM CONDENSED CONSOLIDATED STATEMENT OF SHAREHOLDERS’ EQUITY (Unaudited) ($ thousands, except as noted)
Nine months ended September 30 Note 2017 2016
Shares (000’s)
Shares (000’s)
Share Capital
Balance, beginning of period 105,784 1,639,466 106,212 1,646,984
Issued 12 511 6,061 41 474
Issued on Trilogy Merger, net of issuance costs 3 28,537 603,085 – – Change in vested and unvested common shares for stock incentive plan 12 3 9 19 118
Balance, end of period 134,835 2,248,621 106,272 1,647,576
Retained Earnings (Accumulated Deficit)
Balance, beginning of period (152,182) (1,197,627)
Net income 289,523 952,876
Decrease in value of securities prior to distribution 4 19,146 –
Balance, end of period 156,487 (244,751)
Reserves 11
Balance, beginning of period 147,499 99,337
Other comprehensive income (loss) (14,309) 21,625
Contributed surplus 8,455 23,910
Balance, end of period 141,645 144,872
Total Shareholders’ Equity 2,546,753 1,547,697
See the accompanying notes to these Interim Condensed Consolidated Financial Statements.
Paramount Resources Ltd. Third Quarter 2017 42

(Unaudited) (Tabular amounts stated in $ thousands, except as noted)
1. Basis of Presentation
Paramount Resources Ltd. ("Paramount" or the "Company") is an independent, publicly traded, Canadian
energy company that explores and develops conventional and unconventional petroleum and natural gas
prospects, including long-term unconventional exploration and pre-development projects, and holds a
portfolio of investments in other entities. The Company’s principal properties are primarily located in Alberta
and British Columbia. Paramount’s operations are divided into three business segments: i) Principal
Properties; ii) Strategic Investments; and iii) Corporate.
Paramount is the ultimate parent company of a consolidated group of companies and is incorporated and
domiciled in Canada. The address of its registered office is 4700, 888 3rd Street S.W., Calgary, Alberta,
Canada, T2P 5C5. The consolidated group includes wholly-owned subsidiaries Paramount Resources
(ACL) Ltd. (formerly Apache Canada Ltd.) following the acquisition of Apache Canada Ltd. on August 16,
2017 (see note 2), Paramount Resources (TEC) Ltd. (formerly Trilogy Energy Corp.) ("Trilogy") following
the merger with Trilogy on September 12, 2017 (see note 3), Fox Drilling Limited Partnership ("Fox Drilling"),
Cavalier Energy ("Cavalier") and MGM Energy. The financial statements of Paramount’s subsidiaries and
partnerships are prepared for the same reporting periods as the parent in accordance with the Company’s
accounting policies. All intercompany balances and transactions have been eliminated.
These unaudited Interim Condensed Consolidated Financial Statements of the Company, as at and for the
three and nine months ended September 30, 2017 (the "Interim Financial Statements"), were authorized
for issuance by the Audit Committee of Paramount’s Board of Directors on November 7, 2017.
These Interim Financial Statements have been prepared in accordance with International Accounting
Standard 34 – Interim Financial Reporting on a basis consistent with the accounting, estimation and
valuation policies described in the Company’s audited Consolidated Financial Statements as at and for the
year ended December 31, 2016 (the "Annual Financial Statements"). These Interim Financial Statements
are stated in thousands of Canadian dollars, unless otherwise noted, and have been prepared on a
historical cost basis, except for certain financial instruments which are stated at fair value. Certain
information and disclosures normally required to be included in the notes to the Annual Financial
Statements prepared in accordance with International Financial Reporting Standards have been condensed
or omitted. These Interim Financial Statements should be read in conjunction with the Annual Financial
Statements.
Changes in Accounting Standards
There were no new accounting standards adopted by the Company for the nine months ended September
30, 2017.
Future Changes in Accounting Standards
In May 2014, the International Accounting Standards Board ("IASB") issued IFRS 15 – Revenue From
Contracts With Customers, which establishes a single revenue recognition framework that applies to
contracts with customers. The standard requires an entity to recognize revenue to reflect the transfer of
goods and services for the amount it expects to receive when control is transferred to the purchaser. IFRS
15 is effective for years beginning on or after January 1, 2018. Paramount does not expect that the adoption
of this standard will have a material impact on the Company’s Consolidated Financial Statements.
In July 2014, the IASB issued IFRS 9 – Financial Instruments, which sets out the recognition and
measurement requirements for financial instruments and some contracts to buy or sell non-financial items.
Paramount Resources Ltd. Third Quarter 2017 43

(Unaudited) (Tabular amounts stated in $ thousands, except as noted)
IFRS 9 proposes a single model of classifying and measuring financial assets and liabilities and provides
for only two classification categories: amortized cost and fair value. IFRS 9 is effective for years beginning
on or after January 1, 2018. Paramount does not expect that the adoption of this standard will have a
material impact on the Company’s Consolidated Financial Statements.
In January 2016, the IASB issued IFRS 16 – Leases, which replaces IAS 17 – Leases and related
interpretations. IFRS 16 eliminates the classification of leases as finance or operating and introduces a
single lessee accounting model for recognition and measurement, which will require the recognition of
assets and liabilities for most leases. IFRS 16 is effective for years beginning on or after January 1, 2019.
The Company is currently evaluating the impact of the IFRS on its Consolidated Financial Statements.
2. Apache Canada Ltd. Acquisition
On August 16, 2017, Paramount acquired all of the outstanding shares of Apache Canada Ltd. (ʺApache
Canadaʺ) for cash consideration of $486.9 million (the ʺApache Canada Acquisitionʺ).
Apache Canada was a wholly-owned subsidiary of a publicly traded U.S. based international oil and gas
company. Apache Canada’s primary oil and gas assets were located at Wapiti, Kaybob and in Central
Alberta. These Interim Financial Statements include the results of operations of Apache Canada for the
period following the closing of the transaction on August 16, 2017.
The Apache Canada Acquisition was accounted for as a business combination in accordance with IFRS 3,
Business Combinations (ʺIFRS 3ʺ), using the acquisition method of accounting whereby all of the assets
acquired and liabilities assumed were recorded at fair value. The allocation of the total consideration is
preliminary and was based on estimates of fair value, except for deferred income tax amounts, and such
estimates may be adjusted in future periods. The following table summarizes the net assets acquired:
Cash consideration $ 486,852
Cash $ 25,468 Accounts receivable 36,113
Prepaids 5,015
Exploration and evaluation 295,095
Property, plant and equipment 825,309
Deferred income tax asset 450,634
Accounts payable (59,632)
Asset retirement obligations (see also - note 9) (712,176)
Provision (12,912)
Net assets acquired 852,914
Gain on Apache Canada Acquisition (366,062)
$ 486,852
The estimated asset retirement obligations were discounted using a credit-adjusted discount rate of
approximately 6 percent. These obligations will be settled over the useful lives of the assets, which exceed
40 years. A $12.9 million provision was recorded as a result of the difference between current market rates
and rates associated with Apache Canada’s head office lease, which expires in 2023. The gain on
acquisition of $366.1 million is substantially attributable to the undiscounted nature of the deferred tax asset
recognized in the purchase allocation.
Paramount Resources Ltd. Third Quarter 2017 44
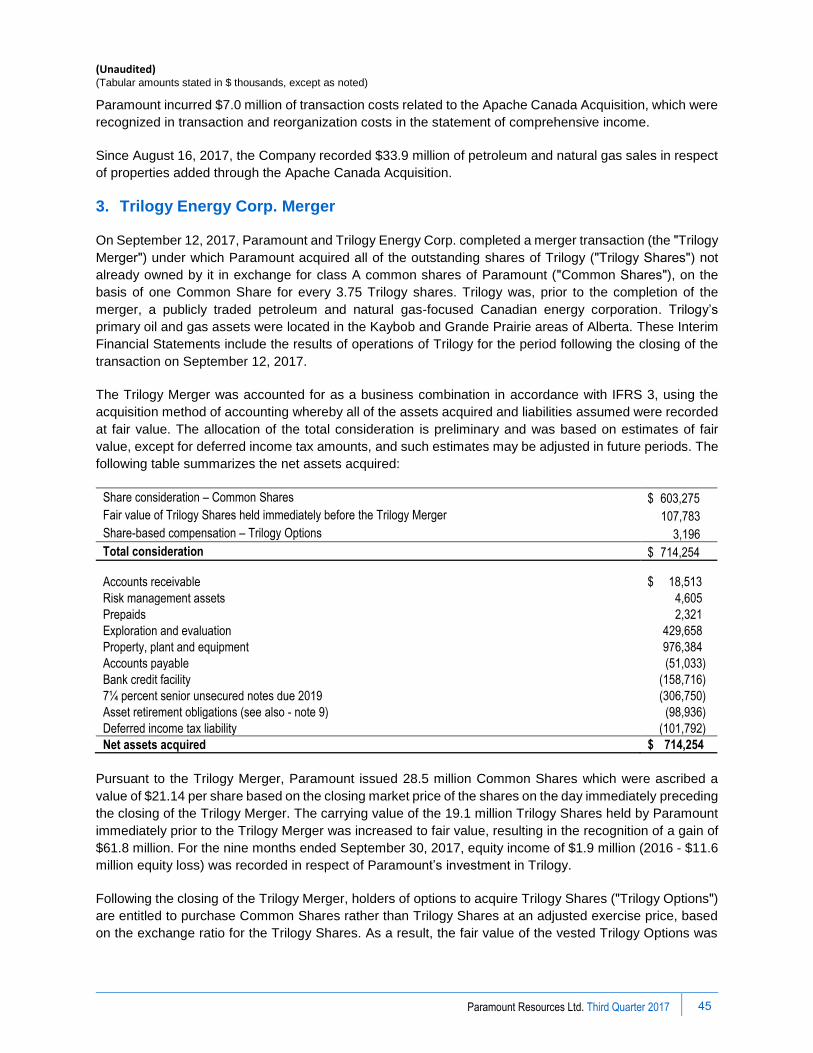
(Unaudited) (Tabular amounts stated in $ thousands, except as noted)
Paramount incurred $7.0 million of transaction costs related to the Apache Canada Acquisition, which were
recognized in transaction and reorganization costs in the statement of comprehensive income.
Since August 16, 2017, the Company recorded $33.9 million of petroleum and natural gas sales in respect
of properties added through the Apache Canada Acquisition.
3. Trilogy Energy Corp. Merger
On September 12, 2017, Paramount and Trilogy Energy Corp. completed a merger transaction (the ʺTrilogy
Mergerʺ) under which Paramount acquired all of the outstanding shares of Trilogy (ʺTrilogy Sharesʺ) not
already owned by it in exchange for class A common shares of Paramount (ʺCommon Sharesʺ), on the
basis of one Common Share for every 3.75 Trilogy shares. Trilogy was, prior to the completion of the
merger, a publicly traded petroleum and natural gas-focused Canadian energy corporation. Trilogy’s
primary oil and gas assets were located in the Kaybob and Grande Prairie areas of Alberta. These Interim
Financial Statements include the results of operations of Trilogy for the period following the closing of the
transaction on September 12, 2017.
The Trilogy Merger was accounted for as a business combination in accordance with IFRS 3, using the
acquisition method of accounting whereby all of the assets acquired and liabilities assumed were recorded
at fair value. The allocation of the total consideration is preliminary and was based on estimates of fair
value, except for deferred income tax amounts, and such estimates may be adjusted in future periods. The
following table summarizes the net assets acquired:
Share consideration – Common Shares $ 603,275
Fair value of Trilogy Shares held immediately before the Trilogy Merger 107,783
Share-based compensation – Trilogy Options 3,196
Total consideration $ 714,254
Accounts receivable $ 18,513
Risk management assets 4,605
Prepaids 2,321
Exploration and evaluation 429,658
Property, plant and equipment 976,384
Accounts payable (51,033)
Bank credit facility (158,716)
7¼ percent senior unsecured notes due 2019 (306,750)
Asset retirement obligations (see also - note 9) (98,936)
Deferred income tax liability (101,792)
Net assets acquired $ 714,254
Pursuant to the Trilogy Merger, Paramount issued 28.5 million Common Shares which were ascribed a
value of $21.14 per share based on the closing market price of the shares on the day immediately preceding
the closing of the Trilogy Merger. The carrying value of the 19.1 million Trilogy Shares held by Paramount
immediately prior to the Trilogy Merger was increased to fair value, resulting in the recognition of a gain of
$61.8 million. For the nine months ended September 30, 2017, equity income of $1.9 million (2016 - $11.6
million equity loss) was recorded in respect of Paramount’s investment in Trilogy.
Following the closing of the Trilogy Merger, holders of options to acquire Trilogy Shares (ʺTrilogy Optionsʺ)
are entitled to purchase Common Shares rather than Trilogy Shares at an adjusted exercise price, based
on the exchange ratio for the Trilogy Shares. As a result, the fair value of the vested Trilogy Options was
Paramount Resources Ltd. Third Quarter 2017
45
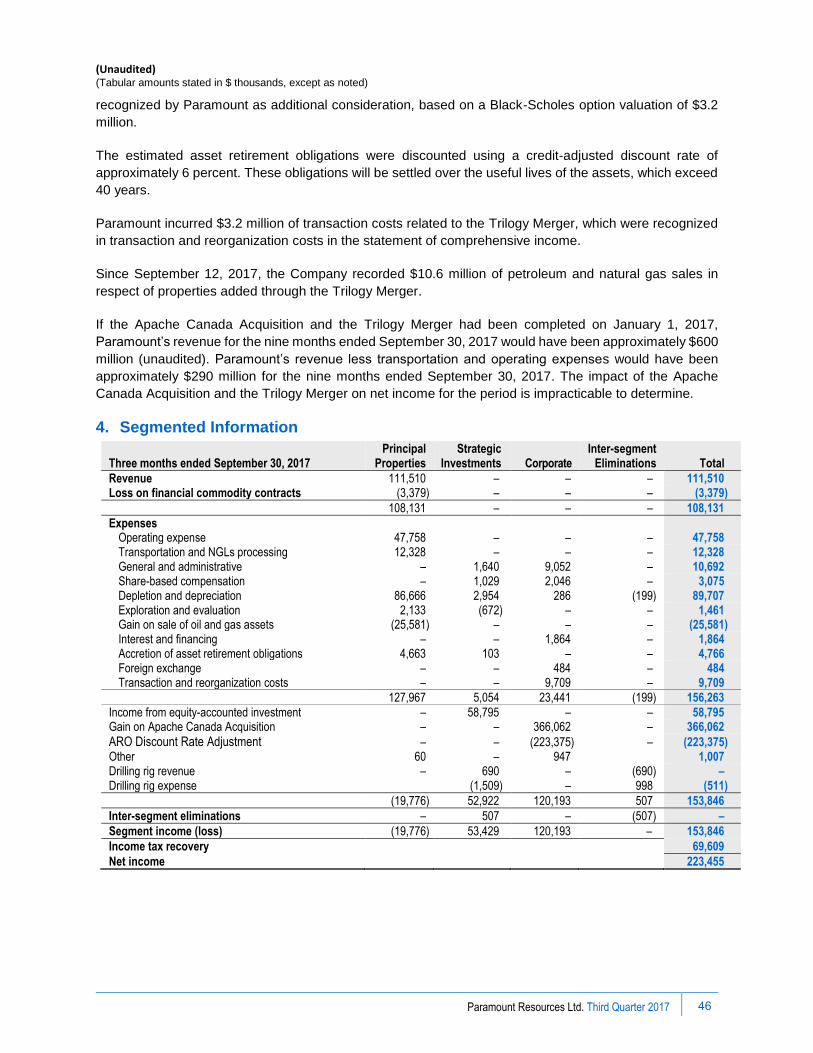
(Unaudited) (Tabular amounts stated in $ thousands, except as noted)
recognized by Paramount as additional consideration, based on a Black-Scholes option valuation of $3.2
million.
The estimated asset retirement obligations were discounted using a credit-adjusted discount rate of
approximately 6 percent. These obligations will be settled over the useful lives of the assets, which exceed
40 years.
Paramount incurred $3.2 million of transaction costs related to the Trilogy Merger, which were recognized
in transaction and reorganization costs in the statement of comprehensive income.
Since September 12, 2017, the Company recorded $10.6 million of petroleum and natural gas sales in
respect of properties added through the Trilogy Merger.
If the Apache Canada Acquisition and the Trilogy Merger had been completed on January 1, 2017,
Paramount’s revenue for the nine months ended September 30, 2017 would have been approximately $600
million (unaudited). Paramount’s revenue less transportation and operating expenses would have been
approximately $290 million for the nine months ended September 30, 2017. The impact of the Apache
Canada Acquisition and the Trilogy Merger on net income for the period is impracticable to determine.
4. Segmented Information
Three months ended September 30, 2017 Principal
Properties Strategic
Investments Corporate Inter-segment
Eliminations Total
Revenue 111,510 – – – 111,510 Loss on financial commodity contracts (3,379) – – – (3,379)
108,131 – – – 108,131
Expenses Operating expense 47,758 – – – 47,758 Transportation and NGLs processing 12,328 – – – 12,328 General and administrative – 1,640 9,052 – 10,692 Share-based compensation – 1,029 2,046 – 3,075 Depletion and depreciation 86,666 2,954 286 (199) 89,707 Exploration and evaluation 2,133 (672) – – 1,461 Gain on sale of oil and gas assets (25,581) – – – (25,581) Interest and financing – – 1,864 – 1,864 Accretion of asset retirement obligations 4,663 103 – – 4,766 Foreign exchange – – 484 – 484 Transaction and reorganization costs – – 9,709 – 9,709
127,967 5,054 23,441 (199) 156,263
Income from equity-accounted investment – 58,795 – – 58,795 Gain on Apache Canada Acquisition – – 366,062 – 366,062
ARO Discount Rate Adjustment – – (223,375) – (223,375) Other 60 – 947 1,007 Drilling rig revenue – 690 – (690) – Drilling rig expense (1,509) – 998 (511)
(19,776) 52,922 120,193 507 153,846
Inter-segment eliminations – 507 – (507) –
Segment income (loss) (19,776) 53,429 120,193 – 153,846
Income tax recovery 69,609
Net income 223,455
Paramount Resources Ltd. Third Quarter 2017
46
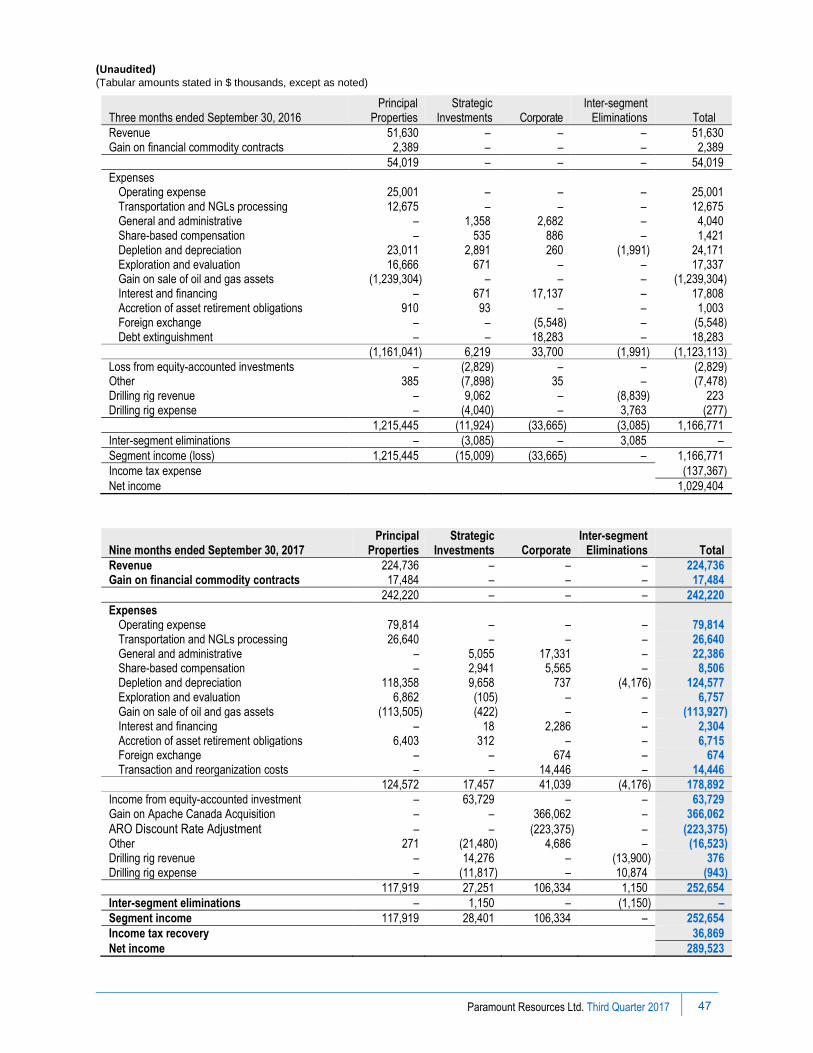
(Unaudited) (Tabular amounts stated in $ thousands, except as noted)
Three months ended September 30, 2016 Principal
Properties Strategic
Investments Corporate Inter-segment
Eliminations Total
Revenue 51,630 – – – 51,630 Gain on financial commodity contracts 2,389 – – – 2,389
54,019 – – – 54,019
Expenses Operating expense 25,001 – – – 25,001 Transportation and NGLs processing 12,675 – – – 12,675 General and administrative – 1,358 2,682 – 4,040 Share-based compensation – 535 886 – 1,421 Depletion and depreciation 23,011 2,891 260 (1,991) 24,171 Exploration and evaluation 16,666 671 – – 17,337 Gain on sale of oil and gas assets (1,239,304) – – – (1,239,304) Interest and financing – 671 17,137 – 17,808 Accretion of asset retirement obligations 910 93 – – 1,003 Foreign exchange – – (5,548) – (5,548) Debt extinguishment – – 18,283 – 18,283
(1,161,041) 6,219 33,700 (1,991) (1,123,113)
Loss from equity-accounted investments – (2,829) – – (2,829) Other 385 (7,898) 35 – (7,478) Drilling rig revenue – 9,062 – (8,839) 223 Drilling rig expense – (4,040) – 3,763 (277)
1,215,445 (11,924) (33,665) (3,085) 1,166,771
Inter-segment eliminations – (3,085) – 3,085 –
Segment income (loss) 1,215,445 (15,009) (33,665) – 1,166,771
Income tax expense (137,367)
Net income 1,029,404
Nine months ended September 30, 2017 Principal
Properties Strategic
Investments Corporate Inter-segment
Eliminations Total
Revenue 224,736 – – – 224,736 Gain on financial commodity contracts 17,484 – – – 17,484
242,220 – – – 242,220
Expenses Operating expense 79,814 – – – 79,814 Transportation and NGLs processing 26,640 – – – 26,640 General and administrative – 5,055 17,331 – 22,386 Share-based compensation – 2,941 5,565 – 8,506 Depletion and depreciation 118,358 9,658 737 (4,176) 124,577 Exploration and evaluation 6,862 (105) – – 6,757 Gain on sale of oil and gas assets (113,505) (422) – – (113,927) Interest and financing – 18 2,286 – 2,304 Accretion of asset retirement obligations 6,403 312 – – 6,715 Foreign exchange – – 674 – 674 Transaction and reorganization costs – – 14,446 – 14,446
124,572 17,457 41,039 (4,176) 178,892
Income from equity-accounted investment – 63,729 – – 63,729 Gain on Apache Canada Acquisition – – 366,062 – 366,062
ARO Discount Rate Adjustment – – (223,375) – (223,375) Other 271 (21,480) 4,686 – (16,523) Drilling rig revenue – 14,276 – (13,900) 376 Drilling rig expense – (11,817) – 10,874 (943)
117,919 27,251 106,334 1,150 252,654
Inter-segment eliminations – 1,150 – (1,150) –
Segment income 117,919 28,401 106,334 – 252,654
Income tax recovery 36,869
Net income 289,523
Paramount Resources Ltd. Third Quarter 2017
47

(Unaudited) (Tabular amounts stated in $ thousands, except as noted)
Nine months ended September 30, 2016 Principal
Properties Strategic
Investments Corporate Inter-segment
Eliminations Total
Revenue 214,377 – – – 214,377 Gain on financial commodity contracts 6,519 – – – 6,519
220,896 – – – 220,896
Expenses Operating expense 86,097 – – – 86,097 Transportation and NGLs processing 52,170 – – – 52,170 General and administrative – 4,648 14,733 – 19,381 Share-based compensation – 5,334 18,830 – 24,164 Depletion and depreciation 183,881 6,993 648 (3,059) 188,463 Exploration and evaluation 20,545 1,016 – – 21,561 Gain on sale of oil and gas assets (1,370,279) (20) – – (1,370,299) Interest and financing – 2,706 72,156 – 74,862 Accretion of asset retirement obligations 3,338 276 – – 3,614 Foreign exchange – – (43,947) – (43,947) Debt extinguishment – – 18,283 – 18,283
(1,024,248) 20,953 80,703 (3,059) (925,651)
Loss from equity-accounted investment – (11,578) – – (11,578) Other 344 (14,391) 35 – (14,012) Drilling rig revenue – 17,978 – (17,755) 223 Drilling rig expense – (7,258) – 6,134 (1,124)
1,245,488 (36,202) (80,668) (8,562) 1,120,056
Inter-segment eliminations – (8,562) – 8,562 –
Segment income (loss) 1,245,488 (44,764) (80,668) – 1,120,056
Income tax expense (167,180)
Net income 952,876
Other Income (Loss)
Three months ended
September 30 Nine months ended
September 30
2017 2016 2017 2016
Interest income 982 328 4,593 164
Drilling rig revenue – 223 376 223
Drilling rig expense (511) (277) (943) (1,124)
Decrease in market value of securities distributed – – (10,450) –
Write-down of investments in securities – (4,602) (11,030) (11,095)
Other 25 (3,204) 364 (3,081)
496 (7,532) (17,090) (14,913)
In December 2016, the Company’s Board of Directors declared a dividend of 3.8 million class A common
shares of Seven Generations Energy Ltd. ("7Gen Shares") to holders of record of Common Shares on
January 9, 2017, resulting in an entitlement of approximately 0.036 of a 7Gen Share for each Common
Share, subject to rounding for fractions. The dividend was paid on January 16, 2017.
The decrease in the fair value of Paramount’s investment in 3.8 million 7Gen Shares of $10.5 million
between the acquisition date and the date of the dividend was reclassified from accumulated other
comprehensive income to earnings in January 2017. An associated income tax recovery of $1.4 million
was also reclassified to earnings. The value ascribed to the dividend as at December 31, 2016 of $119.0
million was reduced by $19.1 million in January 2017 due to a decrease in the market price of 7Gen Shares
prior to distribution, which was recorded as an increase in Retained Earnings.
Paramount Resources Ltd. Third Quarter 2017
48
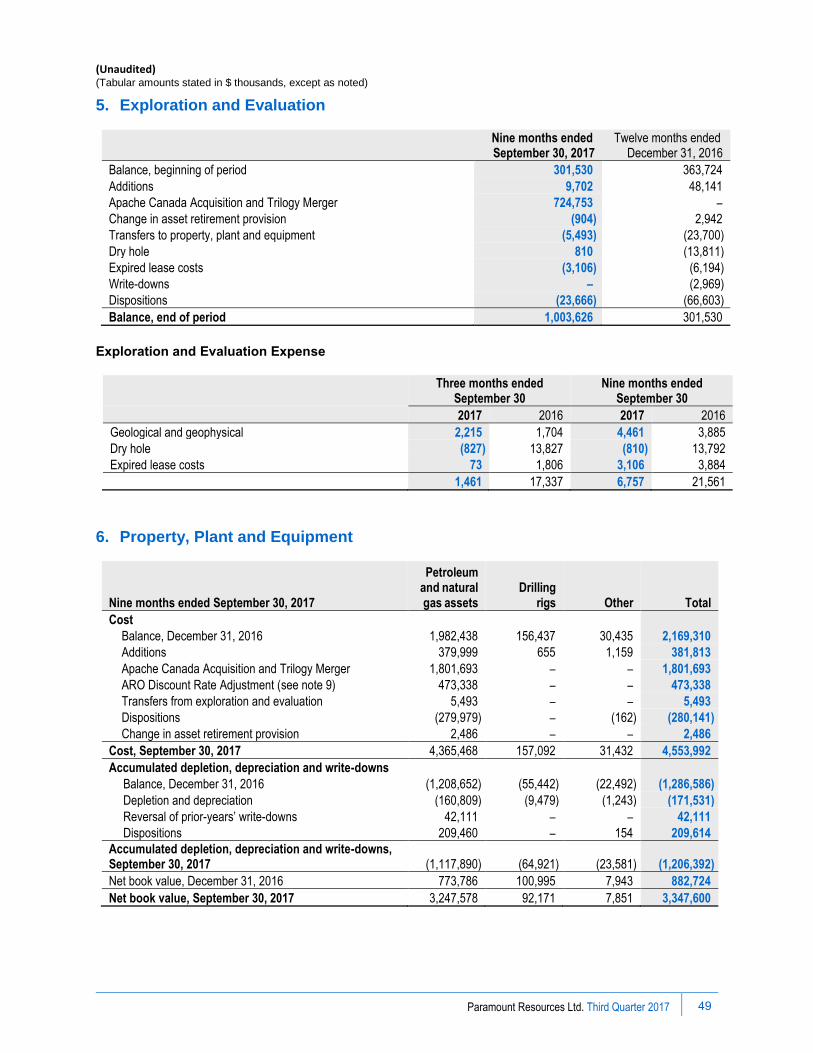
(Unaudited) (Tabular amounts stated in $ thousands, except as noted)
5. Exploration and Evaluation
Nine months ended September 30, 2017
Twelve months ended December 31, 2016
Balance, beginning of period 301,530 363,724
Additions 9,702 48,141
Apache Canada Acquisition and Trilogy Merger 724,753 –
Change in asset retirement provision (904) 2,942
Transfers to property, plant and equipment (5,493) (23,700)
Dry hole 810 (13,811)
Expired lease costs (3,106) (6,194)
Write-downs – (2,969)
Dispositions (23,666) (66,603)
Balance, end of period 1,003,626 301,530
Exploration and Evaluation Expense
Three months ended
September 30 Nine months ended
September 30
2017 2016 2017 2016
Geological and geophysical 2,215 1,704 4,461 3,885
Dry hole (827) 13,827 (810) 13,792
Expired lease costs 73 1,806 3,106 3,884
1,461 17,337 6,757 21,561
6. Property, Plant and Equipment
Nine months ended September 30, 2017
Petroleum and natural gas assets
Drilling rigs Other Total
Cost
Balance, December 31, 2016 1,982,438 156,437 30,435 2,169,310
Additions 379,999 655 1,159 381,813
Apache Canada Acquisition and Trilogy Merger 1,801,693 – – 1,801,693
ARO Discount Rate Adjustment (see note 9) 473,338 – – 473,338
Transfers from exploration and evaluation 5,493 – – 5,493
Dispositions (279,979) – (162) (280,141)
Change in asset retirement provision 2,486 – – 2,486
Cost, September 30, 2017 4,365,468 157,092 31,432 4,553,992
Accumulated depletion, depreciation and write-downs
Balance, December 31, 2016 (1,208,652) (55,442) (22,492) (1,286,586)
Depletion and depreciation (160,809) (9,479) (1,243) (171,531)
Reversal of prior-years’ write-downs 42,111 – – 42,111
Dispositions 209,460 – 154 209,614
Accumulated depletion, depreciation and write-downs, September 30, 2017 (1,117,890) (64,921) (23,581) (1,206,392)
Net book value, December 31, 2016 773,786 100,995 7,943 882,724
Net book value, September 30, 2017 3,247,578 92,171 7,851 3,347,600
Paramount Resources Ltd. Third Quarter 2017
49
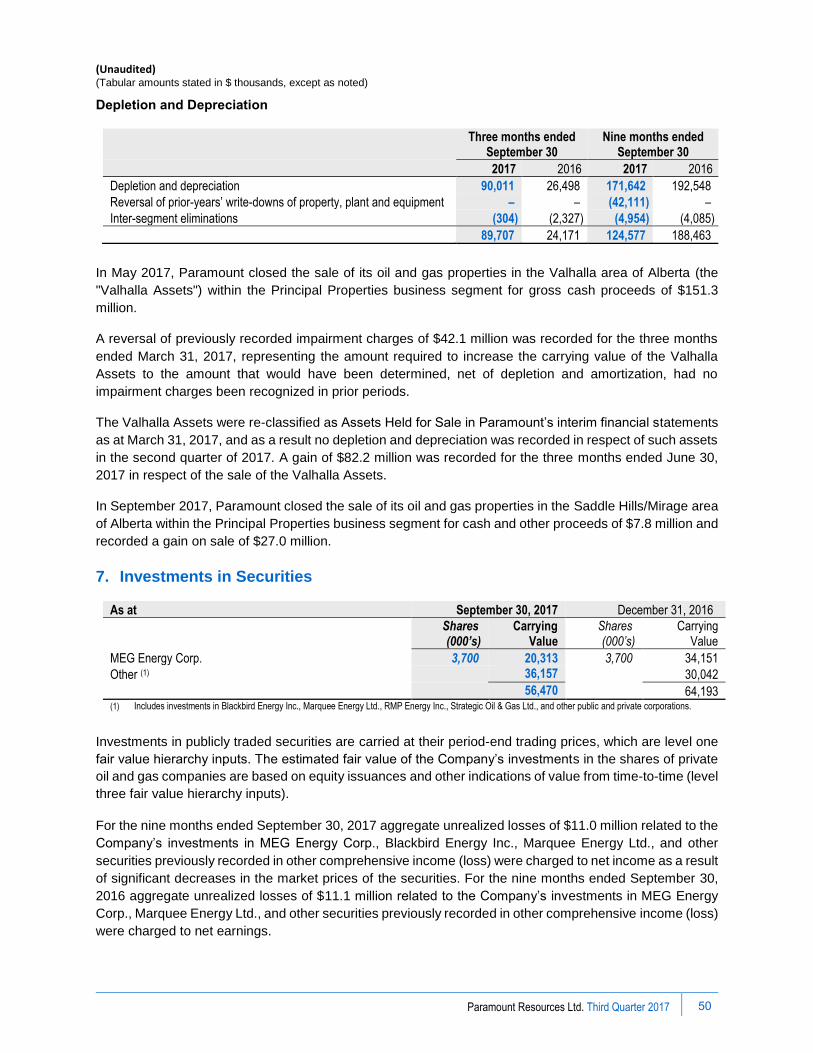
(Unaudited) (Tabular amounts stated in $ thousands, except as noted)
Depletion and Depreciation
Three months ended
September 30 Nine months ended
September 30
2017 2016 2017 2016
Depletion and depreciation 90,011 26,498 171,642 192,548
Reversal of prior-years’ write-downs of property, plant and equipment – – (42,111) –
Inter-segment eliminations (304) (2,327) (4,954) (4,085)
89,707 24,171 124,577 188,463
In May 2017, Paramount closed the sale of its oil and gas properties in the Valhalla area of Alberta (the
"Valhalla Assets") within the Principal Properties business segment for gross cash proceeds of $151.3
million.
A reversal of previously recorded impairment charges of $42.1 million was recorded for the three months
ended March 31, 2017, representing the amount required to increase the carrying value of the Valhalla
Assets to the amount that would have been determined, net of depletion and amortization, had no
impairment charges been recognized in prior periods.
The Valhalla Assets were re-classified as Assets Held for Sale in Paramount’s interim financial statements
as at March 31, 2017, and as a result no depletion and depreciation was recorded in respect of such assets
in the second quarter of 2017. A gain of $82.2 million was recorded for the three months ended June 30,
2017 in respect of the sale of the Valhalla Assets.
In September 2017, Paramount closed the sale of its oil and gas properties in the Saddle Hills/Mirage area
of Alberta within the Principal Properties business segment for cash and other proceeds of $7.8 million and
recorded a gain on sale of $27.0 million.
7. Investments in Securities
As at September 30, 2017 December 31, 2016
Shares (000’s)
Carrying Value
Shares (000’s)
Carrying Value
MEG Energy Corp. 3,700 20,313 3,700 34,151
Other (1) 36,157 30,042
56,470 64,193 (1) Includes investments in Blackbird Energy Inc., Marquee Energy Ltd., RMP Energy Inc., Strategic Oil & Gas Ltd., and other public and private corporations.
Investments in publicly traded securities are carried at their period-end trading prices, which are level one
fair value hierarchy inputs. The estimated fair value of the Company’s investments in the shares of private
oil and gas companies are based on equity issuances and other indications of value from time-to-time (level
three fair value hierarchy inputs).
For the nine months ended September 30, 2017 aggregate unrealized losses of $11.0 million related to the
Company’s investments in MEG Energy Corp., Blackbird Energy Inc., Marquee Energy Ltd., and other
securities previously recorded in other comprehensive income (loss) were charged to net income as a result
of significant decreases in the market prices of the securities. For the nine months ended September 30,
2016 aggregate unrealized losses of $11.1 million related to the Company’s investments in MEG Energy
Corp., Marquee Energy Ltd., and other securities previously recorded in other comprehensive income (loss)
were charged to net earnings.
Paramount Resources Ltd. Third Quarter 2017
50
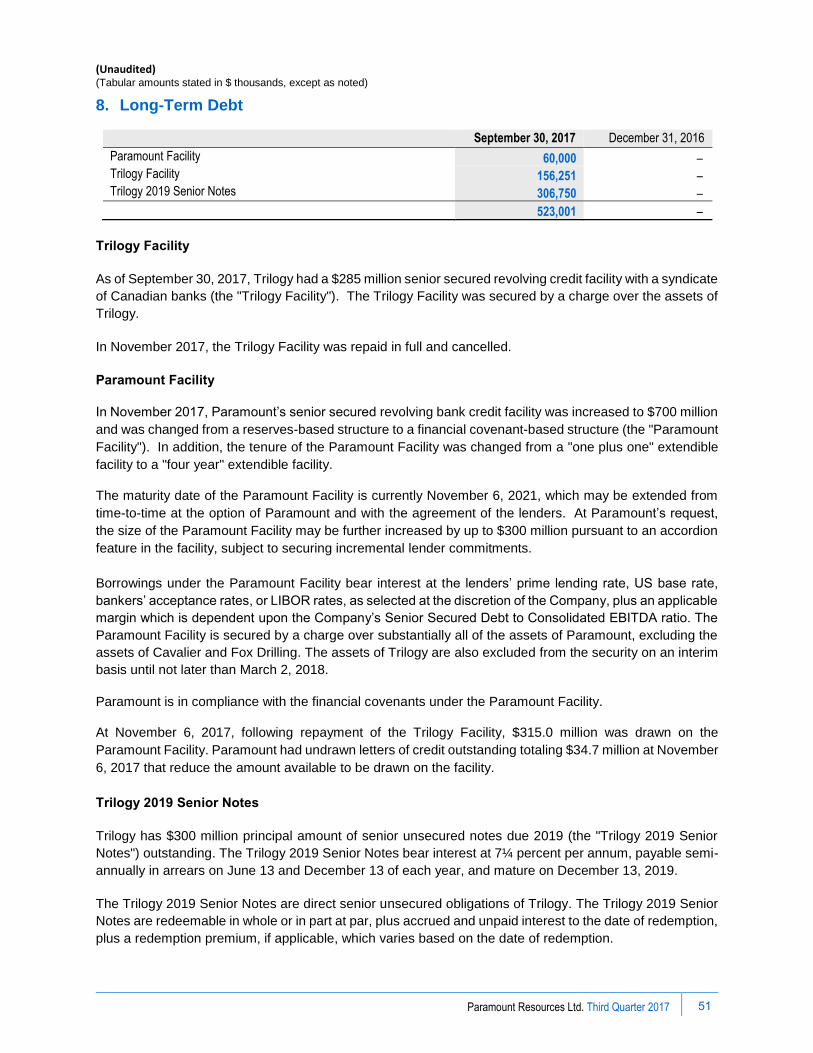
(Unaudited) (Tabular amounts stated in $ thousands, except as noted)
8. Long-Term Debt
September 30, 2017 December 31, 2016
Paramount Facility 60,000 – Trilogy Facility 156,251 – Trilogy 2019 Senior Notes 306,750 –
523,001 –
Trilogy Facility
As of September 30, 2017, Trilogy had a $285 million senior secured revolving credit facility with a syndicate
of Canadian banks (the "Trilogy Facility"). The Trilogy Facility was secured by a charge over the assets of
Trilogy.
In November 2017, the Trilogy Facility was repaid in full and cancelled.
Paramount Facility
In November 2017, Paramount’s senior secured revolving bank credit facility was increased to $700 million
and was changed from a reserves-based structure to a financial covenant-based structure (the "Paramount
Facility"). In addition, the tenure of the Paramount Facility was changed from a "one plus one" extendible
facility to a "four year" extendible facility.
The maturity date of the Paramount Facility is currently November 6, 2021, which may be extended from
time-to-time at the option of Paramount and with the agreement of the lenders. At Paramount’s request,
the size of the Paramount Facility may be further increased by up to $300 million pursuant to an accordion
feature in the facility, subject to securing incremental lender commitments.
Borrowings under the Paramount Facility bear interest at the lenders’ prime lending rate, US base rate,
bankers’ acceptance rates, or LIBOR rates, as selected at the discretion of the Company, plus an applicable
margin which is dependent upon the Company’s Senior Secured Debt to Consolidated EBITDA ratio. The
Paramount Facility is secured by a charge over substantially all of the assets of Paramount, excluding the
assets of Cavalier and Fox Drilling. The assets of Trilogy are also excluded from the security on an interim
basis until not later than March 2, 2018.
Paramount is in compliance with the financial covenants under the Paramount Facility.
At November 6, 2017, following repayment of the Trilogy Facility, $315.0 million was drawn on the
Paramount Facility. Paramount had undrawn letters of credit outstanding totaling $34.7 million at November
6, 2017 that reduce the amount available to be drawn on the facility.
Trilogy 2019 Senior Notes
Trilogy has $300 million principal amount of senior unsecured notes due 2019 (the "Trilogy 2019 Senior
Notes") outstanding. The Trilogy 2019 Senior Notes bear interest at 7¼ percent per annum, payable semi-
annually in arrears on June 13 and December 13 of each year, and mature on December 13, 2019.
The Trilogy 2019 Senior Notes are direct senior unsecured obligations of Trilogy. The Trilogy 2019 Senior
Notes are redeemable in whole or in part at par, plus accrued and unpaid interest to the date of redemption,
plus a redemption premium, if applicable, which varies based on the date of redemption.
Paramount Resources Ltd. Third Quarter 2017
51
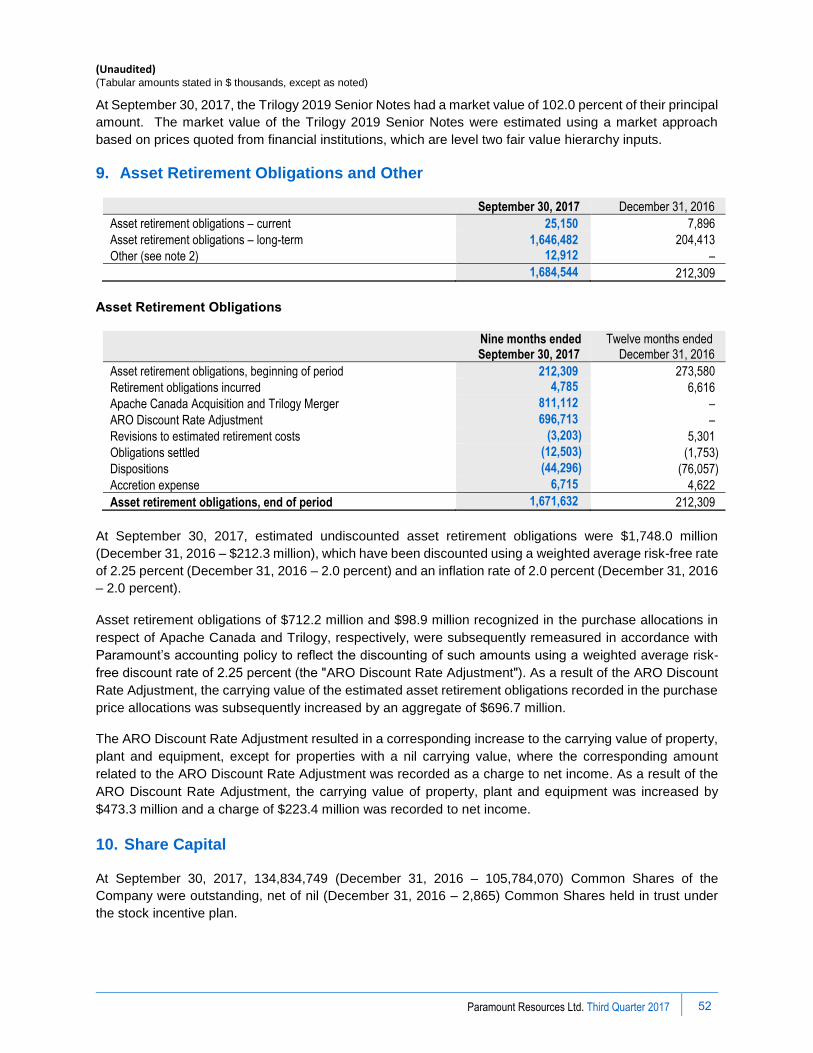
(Unaudited) (Tabular amounts stated in $ thousands, except as noted)
At September 30, 2017, the Trilogy 2019 Senior Notes had a market value of 102.0 percent of their principal
amount. The market value of the Trilogy 2019 Senior Notes were estimated using a market approach
based on prices quoted from financial institutions, which are level two fair value hierarchy inputs.
9. Asset Retirement Obligations and Other
September 30, 2017 December 31, 2016
Asset retirement obligations – current 25,150 7,896
Asset retirement obligations – long-term 1,646,482 204,413
Other (see note 2) 12,912 –
1,684,544 212,309
Asset Retirement Obligations
Nine months ended September 30, 2017
Twelve months ended December 31, 2016
Asset retirement obligations, beginning of period 212,309 273,580
Retirement obligations incurred 4,785 6,616
Apache Canada Acquisition and Trilogy Merger 811,112 –
ARO Discount Rate Adjustment 696,713 –
Revisions to estimated retirement costs (3,203) 5,301
Obligations settled (12,503) (1,753)
Dispositions (44,296) (76,057)
Accretion expense 6,715 4,622
Asset retirement obligations, end of period 1,671,632 212,309
At September 30, 2017, estimated undiscounted asset retirement obligations were $1,748.0 million
(December 31, 2016 – $212.3 million), which have been discounted using a weighted average risk-free rate
of 2.25 percent (December 31, 2016 – 2.0 percent) and an inflation rate of 2.0 percent (December 31, 2016
– 2.0 percent).
Asset retirement obligations of $712.2 million and $98.9 million recognized in the purchase allocations in
respect of Apache Canada and Trilogy, respectively, were subsequently remeasured in accordance with
Paramount’s accounting policy to reflect the discounting of such amounts using a weighted average risk-
free discount rate of 2.25 percent (the ʺARO Discount Rate Adjustmentʺ). As a result of the ARO Discount
Rate Adjustment, the carrying value of the estimated asset retirement obligations recorded in the purchase
price allocations was subsequently increased by an aggregate of $696.7 million.
The ARO Discount Rate Adjustment resulted in a corresponding increase to the carrying value of property,
plant and equipment, except for properties with a nil carrying value, where the corresponding amount
related to the ARO Discount Rate Adjustment was recorded as a charge to net income. As a result of the
ARO Discount Rate Adjustment, the carrying value of property, plant and equipment was increased by
$473.3 million and a charge of $223.4 million was recorded to net income.
10. Share Capital
At September 30, 2017, 134,834,749 (December 31, 2016 – 105,784,070) Common Shares of the
Company were outstanding, net of nil (December 31, 2016 – 2,865) Common Shares held in trust under
the stock incentive plan.
Paramount Resources Ltd. Third Quarter 2017
52

(Unaudited) (Tabular amounts stated in $ thousands, except as noted)
In September 2017, Paramount issued 28,537,134 Common Shares pursuant to the Trilogy Merger (see note 3).
In December 2016, the Company’s Board of Directors declared a dividend of 3.8 million 7Gen Shares to
holders of record of Paramount’s Common Shares on January 9, 2017, resulting in an entitlement of
approximately 0.036 of a 7Gen Share for each Common Share, subject to rounding for fractions. The
dividend was paid on January 16, 2017.
On October 13, 2016, Paramount implemented a normal course issuer bid (“NCIB”) under which the
Company could purchase up to 5,441,602 Common Shares for cancellation. In 2016, the Company
purchased and cancelled 622,900 Common Shares at a total cost of $9.7 million under the NCIB. The
NCIB expired on October 12, 2017.
Weighted Average Common Shares
Three months ended September 30 2017 2016
Wtd. Avg Shares (000’s) Net income
Wtd. Avg Shares (000’s) Net income
Net income – basic 112,135 223,455 106,254 1,029,404
Dilutive effect of Paramount Options 1,053 – 546 –
Net income – diluted 113,188 223,455 106,800 1,029,404
Nine months ended September 30 2017 2016
Wtd. Avg Shares (000’s) Net income
Wtd. Avg Shares (000’s) Net income
Net income – basic 108,163 289,523 106,233 952,876
Dilutive effect of Paramount Options 1,016 – – –
Net income – diluted 109,179 289,523 106,233 952,876
Outstanding stock options that can be exchanged for the Company’s Common Shares are potentially
dilutive and are included in Paramount’s diluted per share calculations when they are dilutive to net income
per share. There were 5.1 million stock options outstanding to acquire Paramount Common Shares at
September 30, 2017 (September 30, 2016 – 2.4 million), of which 2.9 million (September 30, 2016 – 1.9
million) were anti-dilutive for the three months ended September 30, 2017 and 2.9 million (September 30,
2016 – 2.4 million) were anti-dilutive for the nine months ended September 30, 2017.
11. Reserves
Unrealized gains
on securities Contributed
surplus Total
reserves
Balance, December 31, 2016 31,724 115,775 147,499 Other comprehensive loss (14,309) – (14,309)
Share-based compensation – 7,087 7,087
Share-based compensation assumed on Trilogy Merger (see Note 3) – 3,196 3,196
Options exercised – (1,828) (1,828)
Balance, September 30, 2017 17,415 124,230 141,645
Paramount Resources Ltd. Third Quarter 2017
53
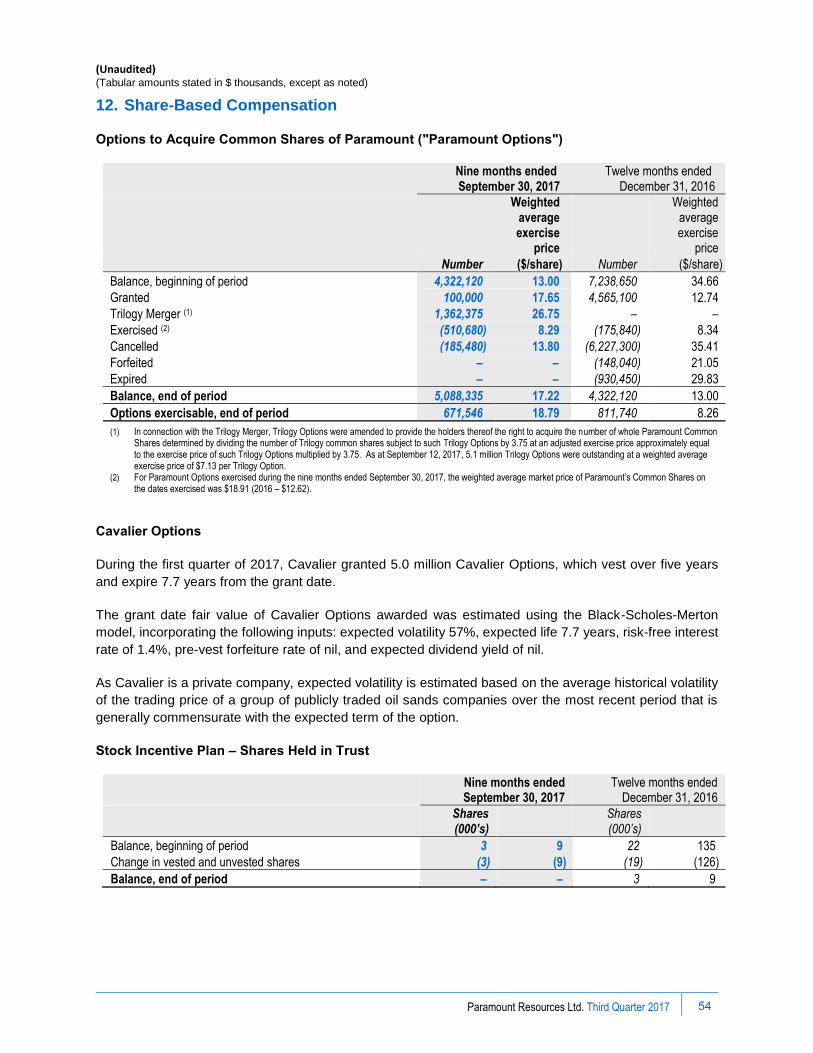
(Unaudited) (Tabular amounts stated in $ thousands, except as noted)
12. Share-Based Compensation
Options to Acquire Common Shares of Paramount (ʺParamount Optionsʺ)
Nine months ended September 30, 2017
Twelve months ended December 31, 2016
Weighted average exercise
price
Weighted average exercise
price
Number ($/share) Number ($/share)
Balance, beginning of period 4,322,120 13.00 7,238,650 34.66
Granted 100,000 17.65 4,565,100 12.74
Trilogy Merger (1) 1,362,375 26.75 – –
Exercised (2) (510,680) 8.29 (175,840) 8.34
Cancelled (185,480) 13.80 (6,227,300) 35.41
Forfeited – – (148,040) 21.05
Expired – – (930,450) 29.83
Balance, end of period 5,088,335 17.22 4,322,120 13.00
Options exercisable, end of period 671,546 18.79 811,740 8.26
(1) In connection with the Trilogy Merger, Trilogy Options were amended to provide the holders thereof the right to acquire the number of whole Paramount Common Shares determined by dividing the number of Trilogy common shares subject to such Trilogy Options by 3.75 at an adjusted exercise price approximately equal to the exercise price of such Trilogy Options multiplied by 3.75. As at September 12, 2017, 5.1 million Trilogy Options were outstanding at a weighted average exercise price of $7.13 per Trilogy Option.
(2) For Paramount Options exercised during the nine months ended September 30, 2017, the weighted average market price of Paramount’s Common Shares on the dates exercised was $18.91 (2016 – $12.62).
Cavalier Options
During the first quarter of 2017, Cavalier granted 5.0 million Cavalier Options, which vest over five years
and expire 7.7 years from the grant date.
The grant date fair value of Cavalier Options awarded was estimated using the Black-Scholes-Merton
model, incorporating the following inputs: expected volatility 57%, expected life 7.7 years, risk-free interest
rate of 1.4%, pre-vest forfeiture rate of nil, and expected dividend yield of nil.
As Cavalier is a private company, expected volatility is estimated based on the average historical volatility
of the trading price of a group of publicly traded oil sands companies over the most recent period that is
generally commensurate with the expected term of the option.
Stock Incentive Plan – Shares Held in Trust
Nine months ended September 30, 2017
Twelve months ended December 31, 2016
Shares (000’s)
Shares (000’s)
Balance, beginning of period 3 9 22 135
Change in vested and unvested shares (3) (9) (19) (126)
Balance, end of period – – 3 9
Paramount Resources Ltd. Third Quarter 2017
54
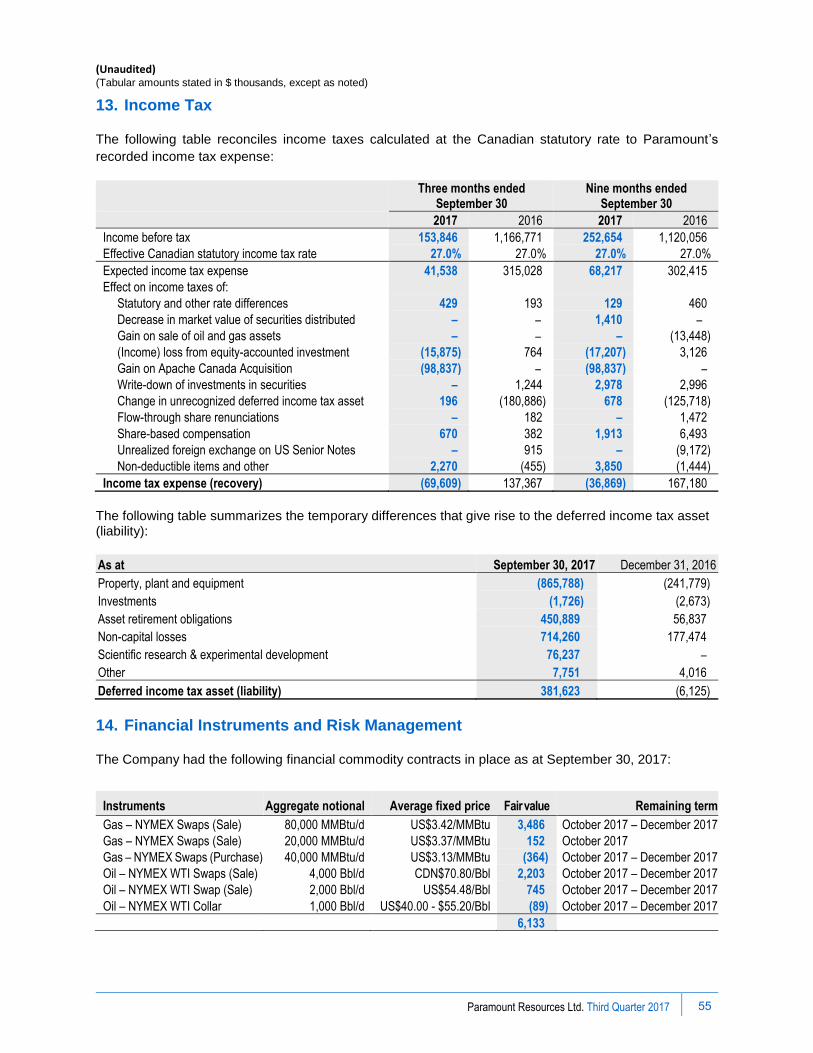
(Unaudited) (Tabular amounts stated in $ thousands, except as noted)
13. Income Tax
The following table reconciles income taxes calculated at the Canadian statutory rate to Paramount’s
recorded income tax expense:
Three months ended
September 30 Nine months ended
September 30
2017 2016 2017 2016
Income before tax 153,846 1,166,771 252,654 1,120,056
Effective Canadian statutory income tax rate 27.0% 27.0% 27.0% 27.0%
Expected income tax expense 41,538 315,028 68,217 302,415
Effect on income taxes of:
Statutory and other rate differences 429 193 129 460
Decrease in market value of securities distributed – – 1,410 –
Gain on sale of oil and gas assets – – – (13,448)
(Income) loss from equity-accounted investment (15,875) 764 (17,207) 3,126
Gain on Apache Canada Acquisition (98,837) – (98,837) –
Write-down of investments in securities – 1,244 2,978 2,996
Change in unrecognized deferred income tax asset 196 (180,886) 678 (125,718)
Flow-through share renunciations – 182 – 1,472
Share-based compensation 670 382 1,913 6,493
Unrealized foreign exchange on US Senior Notes – 915 – (9,172)
Non-deductible items and other 2,270 (455) 3,850 (1,444)
Income tax expense (recovery) (69,609) 137,367 (36,869) 167,180
The following table summarizes the temporary differences that give rise to the deferred income tax asset (liability):
As at September 30, 2017 December 31, 2016
Property, plant and equipment (865,788) (241,779)
Investments (1,726) (2,673)
Asset retirement obligations 450,889 56,837
Non-capital losses 714,260 177,474
Scientific research & experimental development 76,237 –
Other 7,751 4,016
Deferred income tax asset (liability) 381,623 (6,125)
14. Financial Instruments and Risk Management
The Company had the following financial commodity contracts in place as at September 30, 2017:
Instruments Aggregate notional Average fixed price Fair value Remaining term
Gas – NYMEX Swaps (Sale) 80,000 MMBtu/d US$3.42/MMBtu 3,486 October 2017 – December 2017
Gas – NYMEX Swaps (Sale) 20,000 MMBtu/d US$3.37/MMBtu 152 October 2017
Gas – NYMEX Swaps (Purchase) 40,000 MMBtu/d US$3.13/MMBtu (364) October 2017 – December 2017
Oil – NYMEX WTI Swaps (Sale) 4,000 Bbl/d CDN$70.80/Bbl 2,203 October 2017 – December 2017
Oil – NYMEX WTI Swap (Sale) 2,000 Bbl/d US$54.48/Bbl 745 October 2017 – December 2017
Oil – NYMEX WTI Collar 1,000 Bbl/d US$40.00 - $55.20/Bbl (89) October 2017 – December 2017
6,133
Paramount Resources Ltd. Third Quarter 2017
55
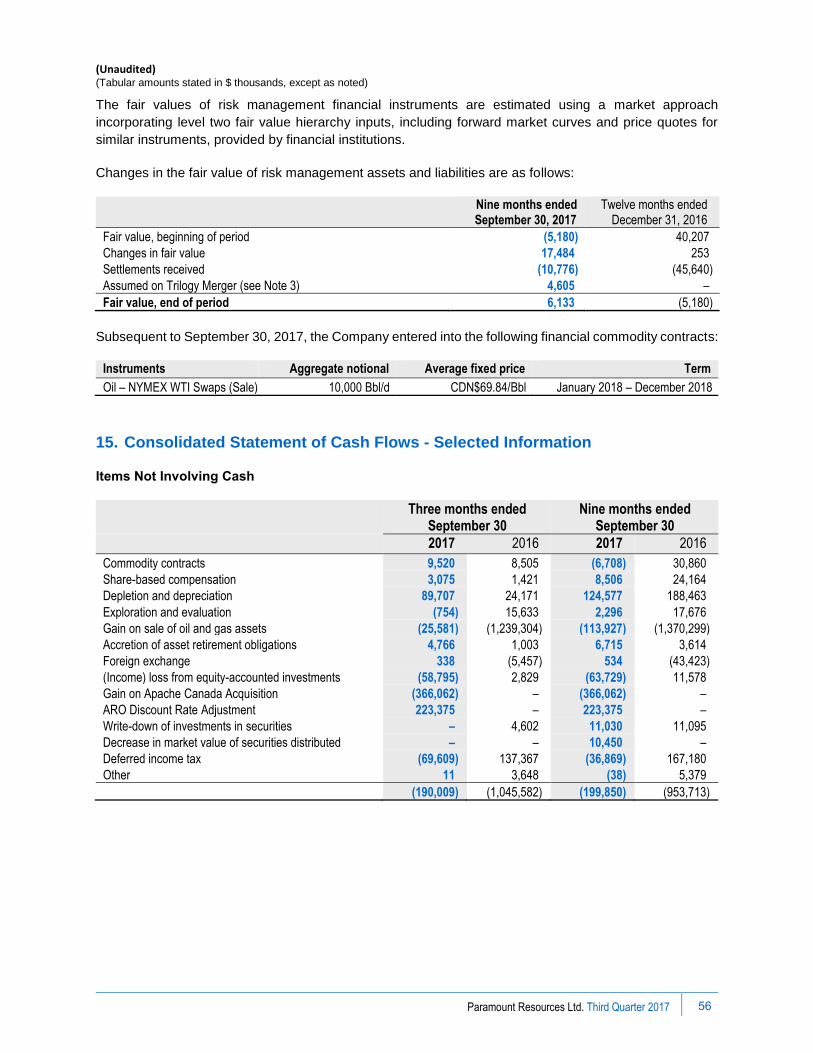
(Unaudited) (Tabular amounts stated in $ thousands, except as noted)
The fair values of risk management financial instruments are estimated using a market approach
incorporating level two fair value hierarchy inputs, including forward market curves and price quotes for
similar instruments, provided by financial institutions.
Changes in the fair value of risk management assets and liabilities are as follows:
Nine months ended September 30, 2017
Twelve months ended December 31, 2016
Fair value, beginning of period (5,180) 40,207
Changes in fair value 17,484 253
Settlements received (10,776) (45,640)
Assumed on Trilogy Merger (see Note 3) 4,605 –
Fair value, end of period 6,133 (5,180)
Subsequent to September 30, 2017, the Company entered into the following financial commodity contracts:
Instruments Aggregate notional Average fixed price Term
Oil – NYMEX WTI Swaps (Sale) 10,000 Bbl/d CDN$69.84/Bbl January 2018 – December 2018
15. Consolidated Statement of Cash Flows - Selected Information
Items Not Involving Cash
Three months ended
September 30 Nine months ended
September 30
2017 2016 2017 2016
Commodity contracts 9,520 8,505 (6,708) 30,860
Share-based compensation 3,075 1,421 8,506 24,164
Depletion and depreciation 89,707 24,171 124,577 188,463
Exploration and evaluation (754) 15,633 2,296 17,676
Gain on sale of oil and gas assets (25,581) (1,239,304) (113,927) (1,370,299)
Accretion of asset retirement obligations 4,766 1,003 6,715 3,614
Foreign exchange 338 (5,457) 534 (43,423)
(Income) loss from equity-accounted investments (58,795) 2,829 (63,729) 11,578
Gain on Apache Canada Acquisition (366,062) – (366,062) –
ARO Discount Rate Adjustment 223,375 – 223,375 –
Write-down of investments in securities – 4,602 11,030 11,095
Decrease in market value of securities distributed – – 10,450 –
Deferred income tax (69,609) 137,367 (36,869) 167,180
Other 11 3,648 (38) 5,379
(190,009) (1,045,582) (199,850) (953,713)
Paramount Resources Ltd. Third Quarter 2017
56

(Unaudited) (Tabular amounts stated in $ thousands, except as noted)
Supplemental Cash Flow Information
Three months ended
September 30 Nine months ended
September 30
2017 2016 2017 2016
Interest paid 502 4,367 504 54,672
Components of cash and cash equivalents
As at September 30, 2017 December 31, 2016
Cash 82,729 76,575
Cash equivalents 8,392 545,297
91,121 621,872
16. Commitments and Contingencies
Paramount had the following commitments as at September 30, 2017:
Within one
year
After one
year but not
more than
five years
More than
five years
Petroleum and natural gas transportation and processing commitments (1) 127,607 596,005 615,503
Operating leases 5,672 21,771 191
Capital spending commitments and other 11,566 9,716 380
144,845 627,492 616,074
(1) Certain of the transportation and processing commitments are secured by outstanding letters of credit totaling $22.0 million at September 30, 2017 (December 31, 2016 – $5.1 million).
In the normal course of Paramount’s operations, the Company may become involved in, named as a party
to, or be the subject of, various legal proceedings, including regulatory proceedings, tax proceedings and
legal actions. The outcome of outstanding, pending or future proceedings cannot be predicted with
certainty. Paramount does not anticipate that these claims will have a material impact on its financial
position.
In 2016, a release occurred from a non-operated pipeline in which the Company owns a 50 percent
interest. The operator, and owner of the remaining 50 percent, has initiated response, containment and
remediation activities ("Response Activities"). Total costs to complete the Response Activities are estimated
at approximately $60 million. It is Paramount’s assessment that it is not responsible for the costs of the
Response Activities and as a result, no provision has been recorded in the Company’s financial statements.
Tax and royalty legislation and regulations, and government interpretation and administration thereof,
continually changes. As a result, there are often tax and royalty matters under review by relevant
government authorities. All tax and royalty filings are subject to subsequent government audit and potential
reassessments. Accordingly, the final amounts may differ materially from amounts estimated and recorded.
Paramount Resources Ltd. Third Quarter 2017
57