
Parametric Modeling of Time-to-Event Data With Possibly Non-Proportional Hazards (Abridged version...
40
Parametric Modeling of Time-to- Event Data With Possibly Non-Proportional Hazards (Abridged version for distribution) Keaven Anderson, Ph.D. Merck Research Laboratories For presentation at 28 th Spring Symposium New Jersey Chapter of the American Statistical Association May 31, 2007
-
Upload
andrea-miller -
Category
Documents
-
view
214 -
download
0
Transcript of Parametric Modeling of Time-to-Event Data With Possibly Non-Proportional Hazards (Abridged version...

Parametric Modeling of Time-to-Event Data
With Possibly Non-Proportional Hazards
(Abridged version for distribution)
Keaven Anderson, Ph.D.
Merck Research LaboratoriesFor presentation at
28th Spring Symposium
New Jersey Chapter of the
American Statistical Association
May 31, 2007

2
Alternate title
An Alternative to the Cox Model for Clinical Trials with Preventive
Interventions

3
Acknowledgements
Shingles Prevention Study William Wang Ivan Chan
Human Papillomavirus Studies Lisa Lupinacci Eliav Barr
AFCAPS/TEXCAPS Robert Tipping

4
Objectives/Overview
Introduce parametric time-to-event model incorporating non-proportional hazards
Examples where model may be useful Disease prevention drugs and vaccines
Examples of models fit Published examples from the Framingham Heart
Study and uses applied New example: Shingles Prevention Study
Discuss software and next steps

5
Model Advantages/Target Audience
Advantages of parametric model Simple prediction of event rates by covariate
values Ability to model multi-state failure models
adjusting for covariates in a parsimonious fashion– QTWIST methods: see Cole et al (1994)
Incorporates proportional- and non-proportional-hazards models
– In simplest model, the scale parameter is a function of location
– This yields a powerful, 1 df likelihood ratio test for non-proportional hazards
Target audience Statisticians Health Economists: modeling of risk/benefit Epidemiologists: modeling of disease process

What (is it?)

7
Time-to-Event Data Time to event denoted by random variable T
Distribution of T governed for 0 < t < by Cumulative distribution function F(t) Cumulative hazard function (t) = -ln(1-F(t)) Hazard rate (t)= d/dt (t)
Proportional hazards (Cox) model Unknown underlying hazard rate (t) unrestricted Covariate vector X Unknown parameter vector Model: (t;X)=exp(’X) (t)
8
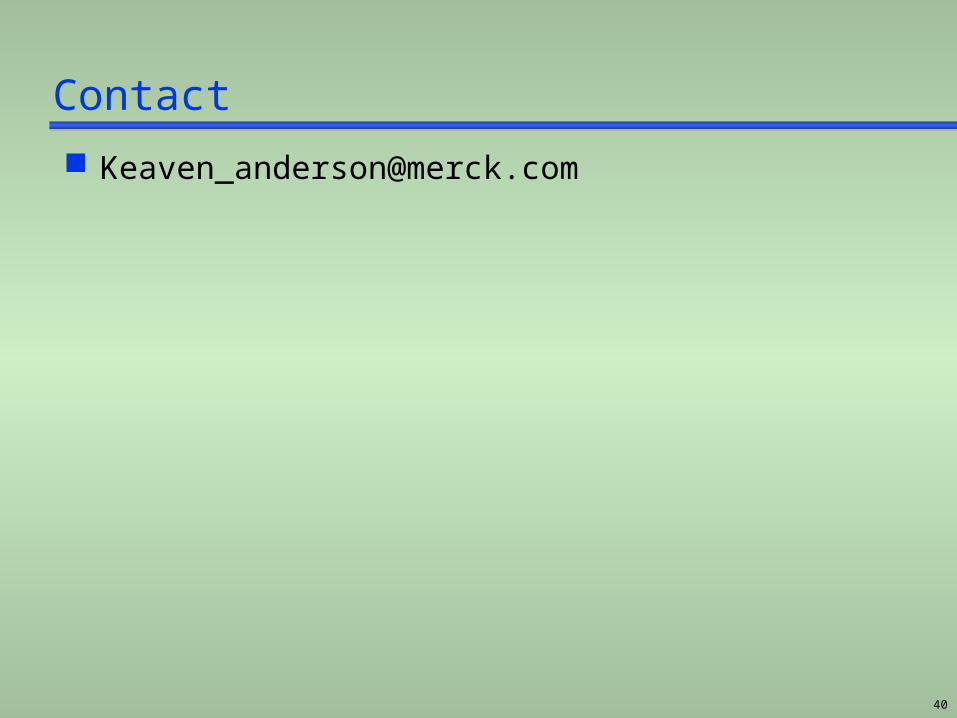
Accelerated Failure Time (AFT) Model
Covariate vector X Unknown parameter vector Location parameter = X’ Unknown, fixed dispersion parameter
Model (cdf for ln(T)): Underlying parametric cumulative distribution G(t)
is specified (e.g., double exponential, normal) G(t;X)=G((t-)/), -<t<
G=Double exponential F=parametric proportional hazards model for T with Weibull distribution
9
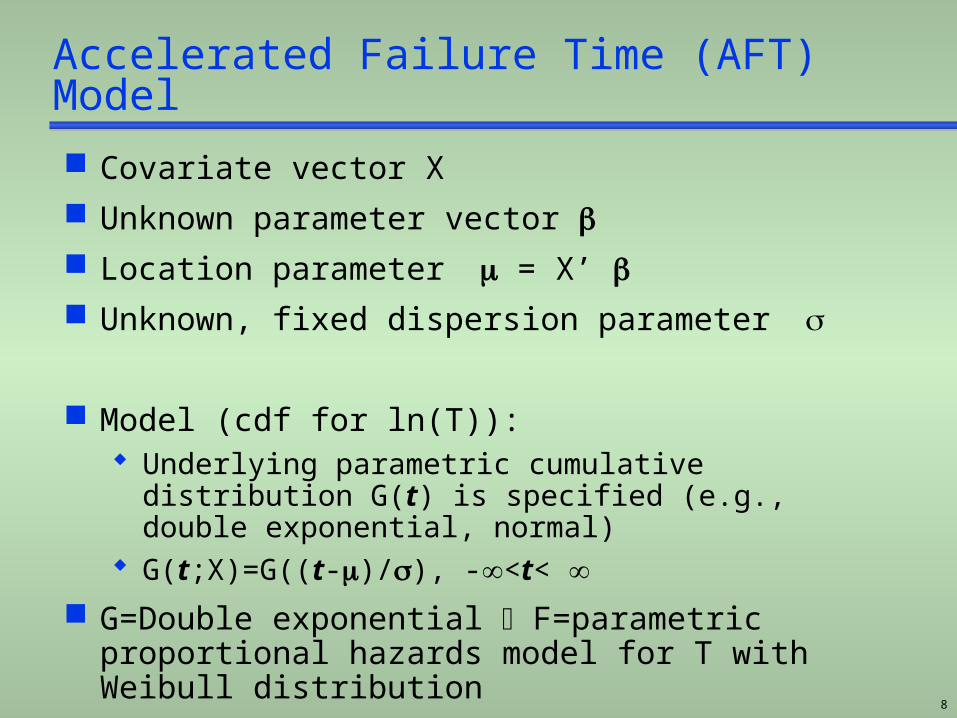
Varying Location and DispersionAccelerated Failure Time (VLDAFT) Model
Same setup as standard AFT, except that now dispersion is modeled by:
a linear function of location: ln() = 0+ 1 ,
or
a linear function of covariates: ln() = ’Y – for some covariate vector Y (may be same as X)– and parameter vector
References Nelson (1984) J of Testing and Evaluation Anderson (1991) Biometrics

10
Graph of log cumulative hazard function versus log time
0
0.05
0.1
0.15
0.2
0.25
0.3
0.35
1 2
0
0.05
0.1
0.1 5
0.2
0.2 5
0.3
0.3 5
0.4
0.4 5
1 2
Standard AFT VLDAFT
Proportional hazards Converging or diverging hazards
When/Why: Examples
Examples:Clinical Trial Data from
Vaccine and Drug Studies

Example: Lipid Lowering with
Simvastatin and Lovastatin

14
0.00
1.00
Scandinavian Simvastatin Survival Study (4S)
Secondary prevention 4444 patients Cholesterol: 272 ± 23 mg/dL Simvastatin 20 mg/d
40 mg/d in 37% LDL-C reduced 38% Survival and events
30% decreased death rate 34% decreased CHD events
Subsequent secondary prevention trials
Reprinted from The Lancet, Vol. 344, Scandinavian Simvastatin Survival Study Group, 1383-1389, copyright 1994, with permission from Elsevier.
Proportion Alive
Years Since Randomization
0 1 2 3 4 5 6
0.95
0.90
0.85
0.80
Simvastatin
Placebo
Log rank: p=0.0003
Slide source: lipidsonline.org

15
No. at risk:
Lovastatin N = 3,304 N = 3,270 N = 3,228 N = 3,184 N = 3,134 N = 1,688
Placebo N = 3,301 N = 3,251 N = 3,211 N = 3,159 N = 3,092 N = 1,644
Air Force/Texas Coronary Atherosclerosis Prevention Study (AFCAPS/TexCAPS)Primary End Point: First Acute Major Coronary Event
0.07
0.06
0.05
0.04
0.03
0.02
0.01
0.00
0 1 2 3 4 5 5+
Cum
ula
tive inci
dence
Placebo
Lovastatin
37% risk reduction(P < 0.001)
Years of follow-up
Downs JR et al. JAMA 1998;279:1615–1622Copyright ©1998, American Medical Association. Slide source: lipidsonline.org

16
Air Force/Texas Coronary Atherosclerosis Prevention Study (AFCAPS/TexCAPS)Event Rates by Baseline HDL-C Tertile
0
2
4
6
8
10
12
14
16
34 35–39 40
Lovastatin
Placebo
Even
t ra
te p
er
1,0
00
pati
ent-
years
at
risk
HDL-C (mg/dL)
Downs JR et al. JAMA 1998;279:1615–1622
-44%risk reduction
-45%risk reduction
-15%risk reduction
Slide source: lipidsonline.org

Example: Prevention of Fractures
18
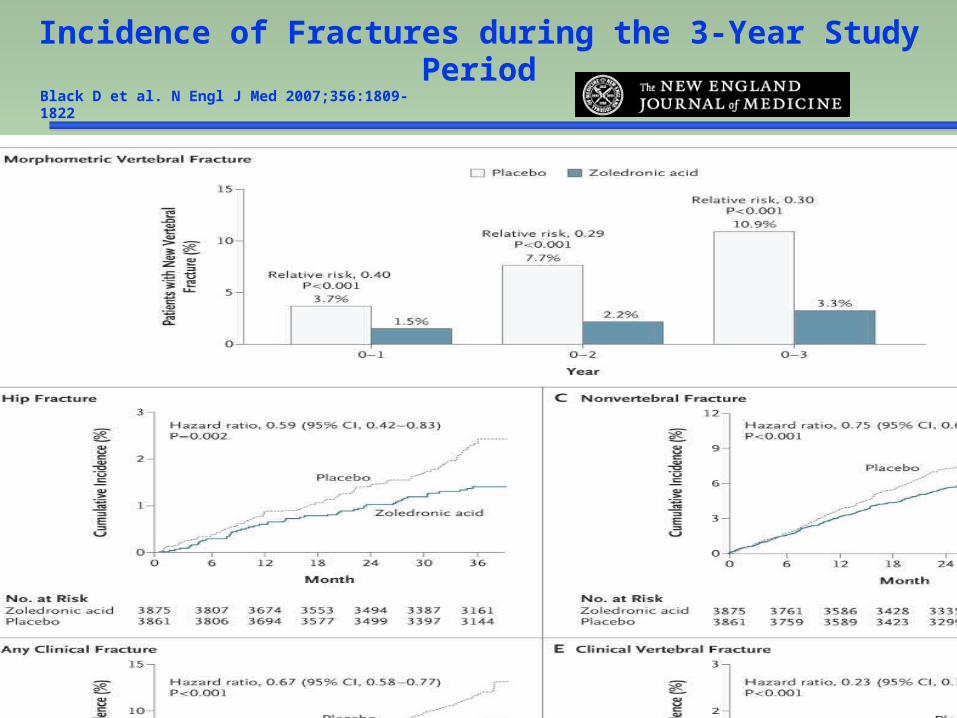
Black D et al. N Engl J Med 2007;356:1809-1822
Incidence of Fractures during the 3-Year Study Period
Example: Prevention of Pre-cancerous Cervical
Lesions with GARDASIL®
Thanks to Lisa Lupinacci, Eliav Barr
for February, 2007 ACIP Slides

20
Modeling questions for GARDASIL®
Population Impact
Events detected by semi-annual examinations Should events be modeled as occurring in the
interval between exams?
Possible improving effectiveness over time? Vaccine only prevents infection; it does not cure
infection Early events may be largely associated with HPV
infections prevalent at baseline Later events may be more likely to be associated
with new infections
Can modeling with differing dispersion by treatment adequately fit apparent non-proportional hazards?

Example: EpidemiologyFramingham Heart Study

22
Framingham Equation for CHD
Anderson et al, Circulation, 1991 12 years of follow-up for coronary heart disease
incidence in a population free of disease at baseline
Risk factors in covariate vector X: age, gender, SBP (systolic pressure), total
cholesterol, HDL cholesterol, cigarette smoking, diabetes, ECG LVH
Location model: = X’
Scale model: ln() = 0+ 1 1 = 0 implies proportional hazards 1 > 0 implies diverging hazards 1 < 0 implies converging hazards

23

24

Example: Prevention of Herpes Zoster (HZ)
with ZOSTAVAX ®
Thanks to Bill Wang, Ivan Chan
for access to MRL’s
FDA Advisory Committee slides
26
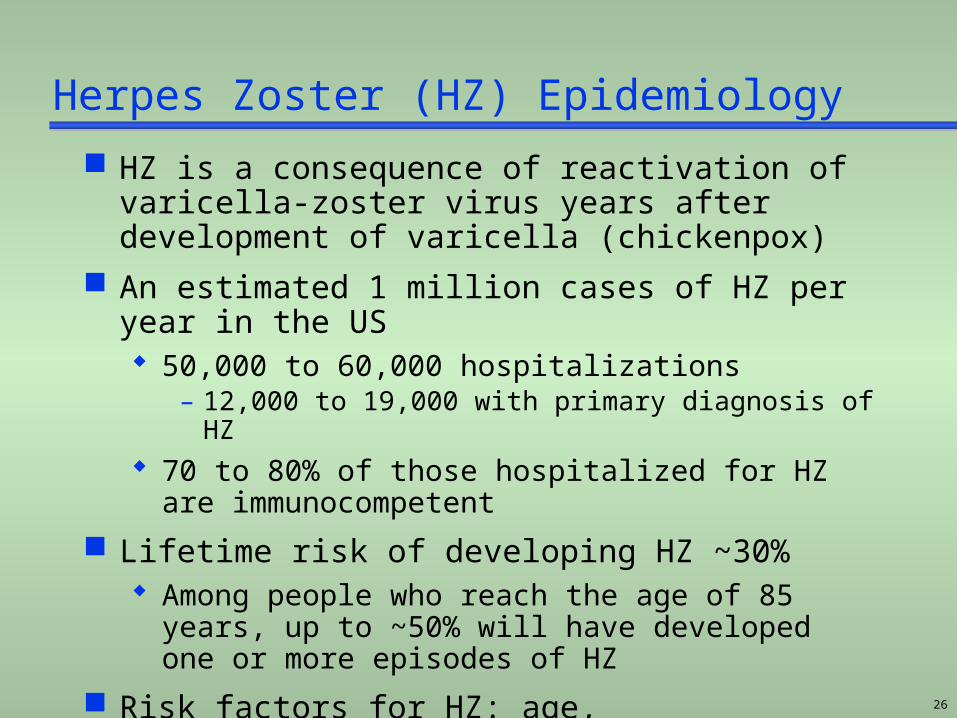
Herpes Zoster (HZ) Epidemiology
HZ is a consequence of reactivation of varicella-zoster virus years after development of varicella (chickenpox)
An estimated 1 million cases of HZ per year in the US 50,000 to 60,000 hospitalizations
– 12,000 to 19,000 with primary diagnosis of HZ 70 to 80% of those hospitalized for HZ are
immunocompetent
Lifetime risk of developing HZ ~30% Among people who reach the age of 85 years,
up to ~50% will have developed one or more episodes of HZ
Risk factors for HZ: age, immunosuppression

27
Typical HZ Eruption
Courtesy of Dr. Kenneth Schmader, Duke University and Durham VA Medical Centers.

28
Epidemiology of HZ/PHNOccurrence by Age
Ra
te p
er
10
00 p
er a
nnu
m.
0 10 20 30 40 50 60 70 80+
11
10
9
8
7
6
5
4
3
2
1
0
HZ per1000 per annum.
PHN per1000 per annum.
Age (years)
Hope-Simpson, J. Royal College Pract. (1975).
29
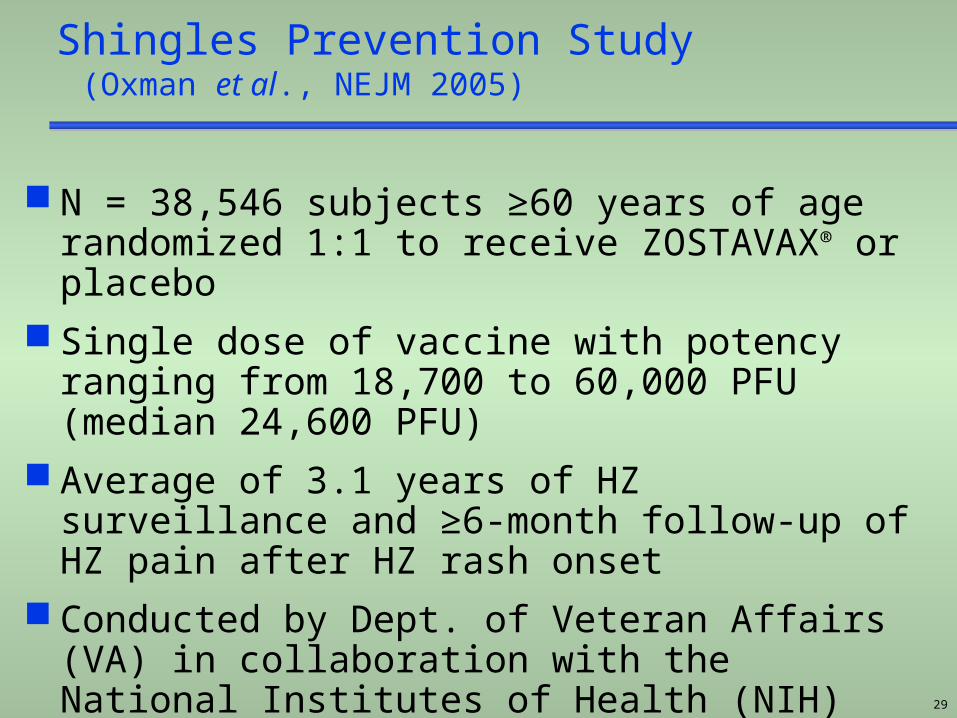
Shingles Prevention Study (Oxman et al., NEJM 2005)
N = 38,546 subjects ≥60 years of age randomized 1:1 to receive ZOSTAVAX® or placebo
Single dose of vaccine with potency ranging from 18,700 to 60,000 PFU (median 24,600 PFU)
Average of 3.1 years of HZ surveillance and ≥6-month follow-up of HZ pain after HZ rash onset
Conducted by Dept. of Veteran Affairs (VA) in collaboration with the National Institutes of Health (NIH) and Merck & Co., Inc.

30
Subjects Enrolled38,546
Placebo19,276
ZOSTAVAX™19,270
Completed Study18,357 (95.2%)
Completed Study18,359 (95.3%)
Censored Before End of Study793 (4.1%) Died 57 (0.3%) Withdrew 61 (0.3%) Lost to follow-up
Censored Before End of Study792 (4.1%) Died 75 (0.4%) Withdrew 52 (0.2%) Lost to follow-up
Average duration of HZ surveillance, 3.1 years (range, up to 4.9 years)
Shingles Prevention Study
31
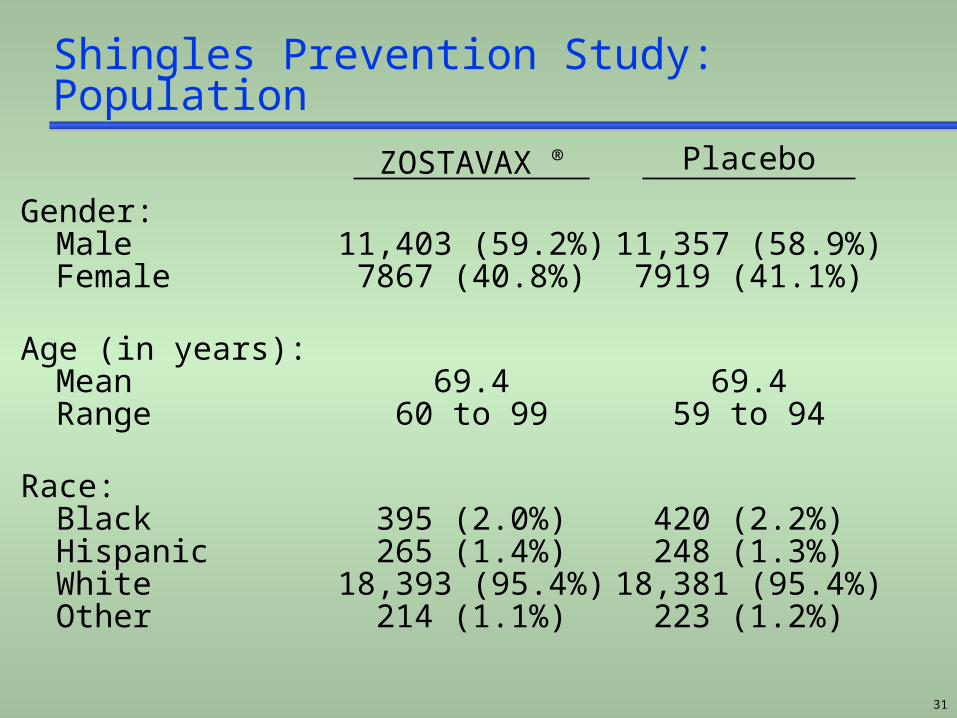
Shingles Prevention Study: Population
Gender:MaleFemale
Age (in years):MeanRange
Race:BlackHispanicWhiteOther
Placebo
11,357 (58.9%)7919 (41.1%)
69.459 to 94
420 (2.2%)248 (1.3%)
18,381 (95.4%)223 (1.2%)
ZOSTAVAX ®
11,403 (59.2%)7867 (40.8%)
69.460 to 99
395 (2.0%)265 (1.4%)
18,393 (95.4%)214 (1.1%)
32
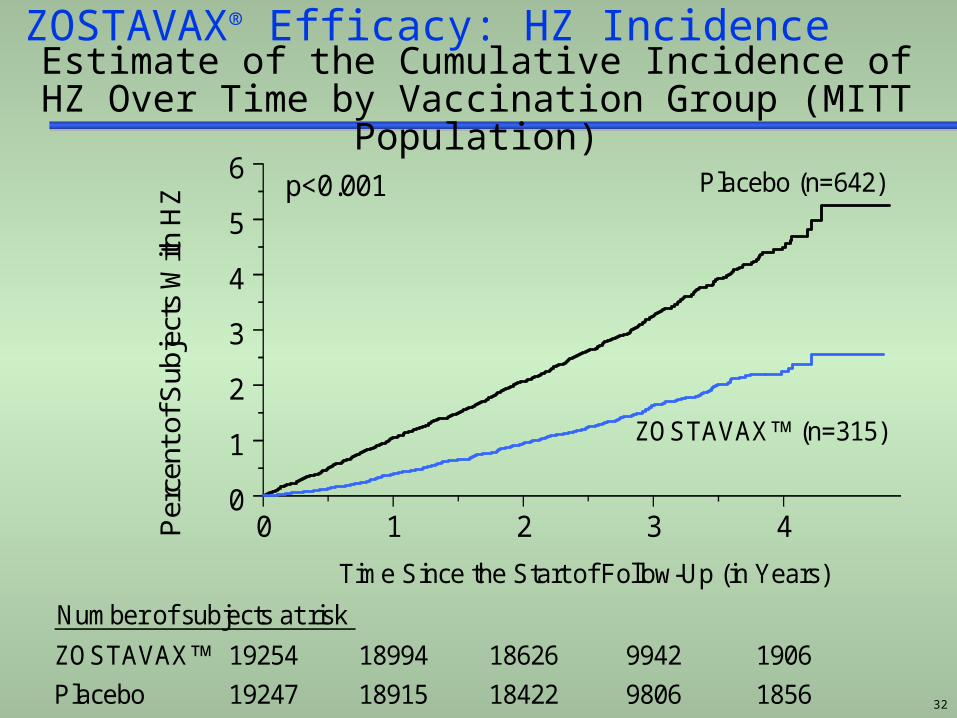
0 1 2 3 4
Time Since the Start of Follow-Up (in Years)
0
1
2
3
4
5
6P
erce
nt o
f Sub
ject
s W
ith H
Z
ZOSTAVAX (n=315)
Placebo (n=642)p<0.001
ZOSTAVAX 19254 18994 18626 9942 1906
Placebo 19247 18915 18422 9806 1856v211p4ACMkm_t2hz_mittv4 Oct. 1, 2005
Number of subjects at risk
ZOSTAVAX® Efficacy: HZ IncidenceEstimate of the Cumulative Incidence of HZ Over Time
by Vaccination Group (MITT Population)
33
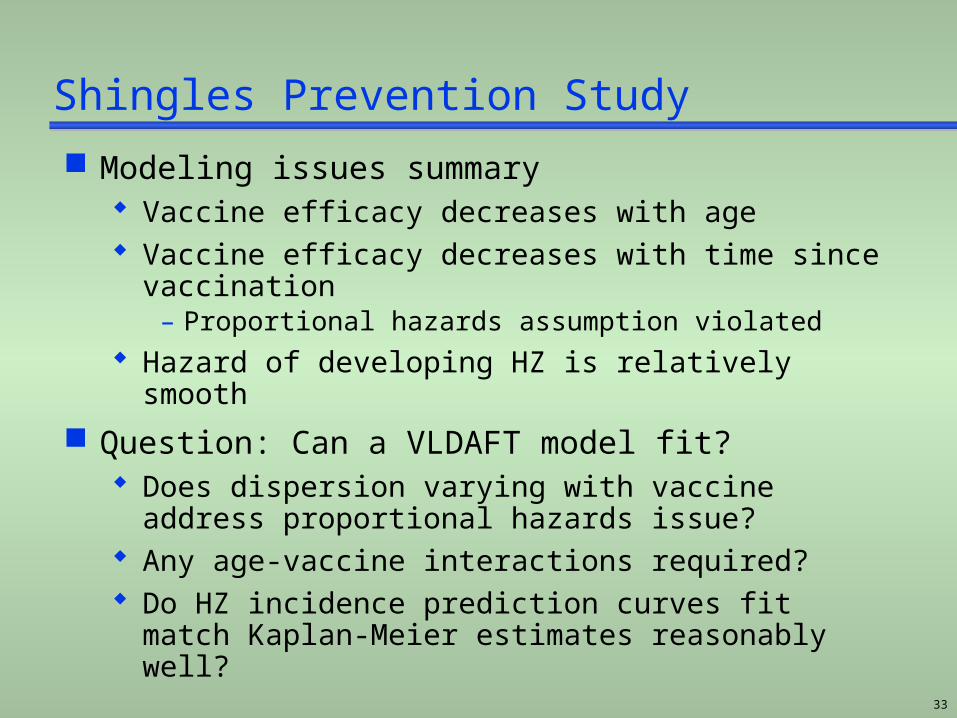
Shingles Prevention Study
Modeling issues summary Vaccine efficacy decreases with age Vaccine efficacy decreases with time since
vaccination– Proportional hazards assumption violated
Hazard of developing HZ is relatively smooth
Question: Can a VLDAFT model fit? Does dispersion varying with vaccine address
proportional hazards issue? Any age-vaccine interactions required? Do HZ incidence prediction curves fit match
Kaplan-Meier estimates reasonably well?
34
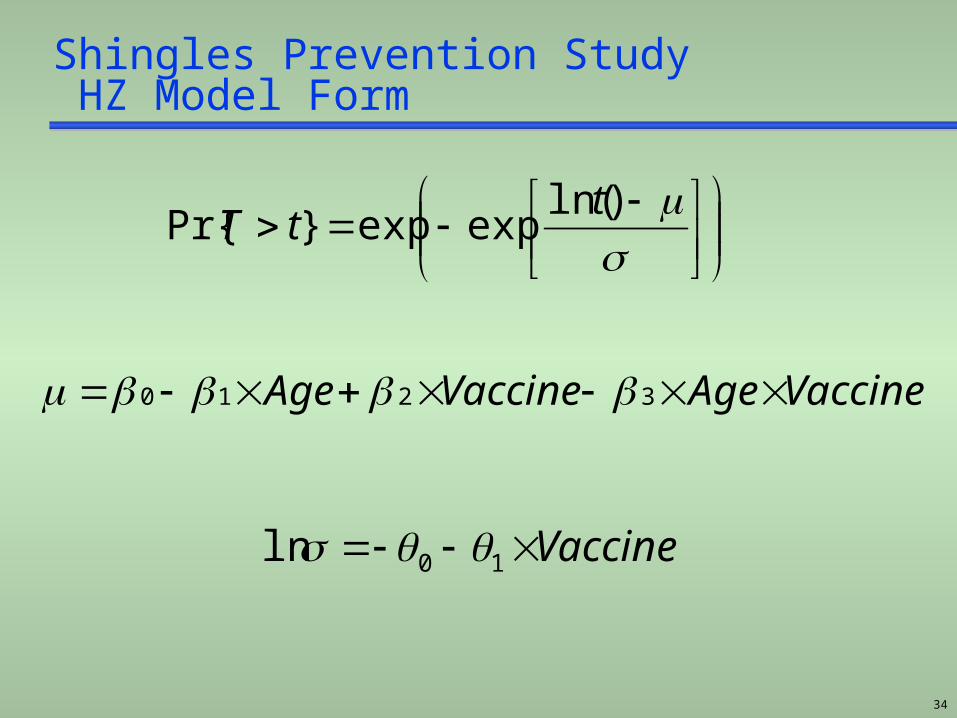
Shingles Prevention Study HZ Model Form
VaccineAgeVaccineAge 3210
)ln(expexp}Pr{
ttT
Vaccine 10ln

How?Existing Software
36
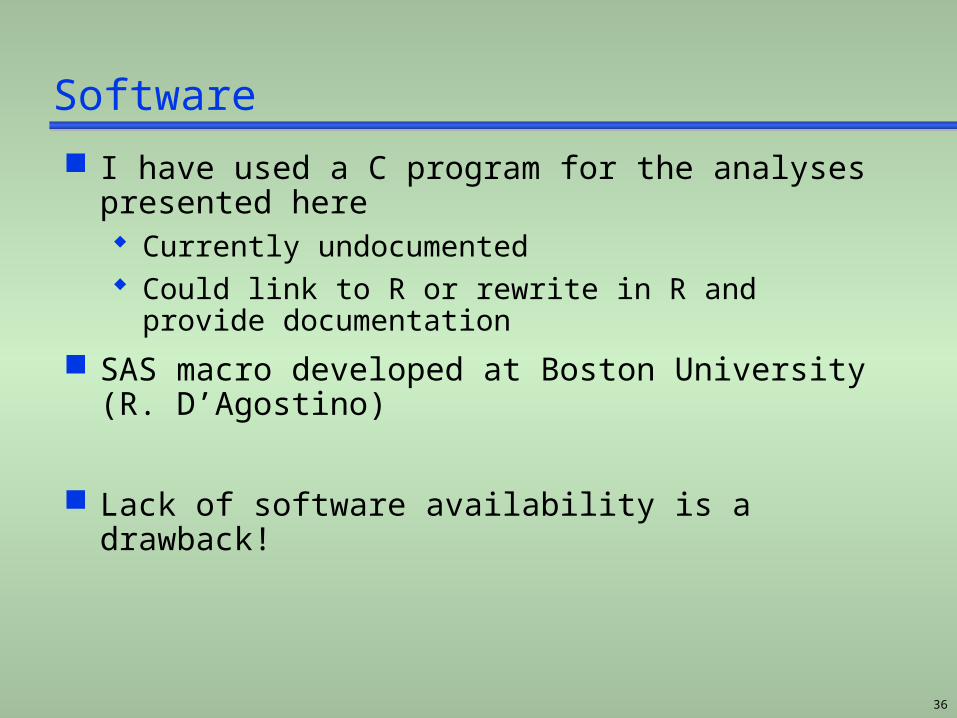
Software
I have used a C program for the analyses presented here Currently undocumented Could link to R or rewrite in R and provide
documentation
SAS macro developed at Boston University (R. D’Agostino)
Lack of software availability is a drawback!

Conclusions/Recommendations

38
Conclusions/Recommendations Proportional hazards may not be suitable for many
situations where there may be a delayed or waning effect Non-proportional parametric models appear suitable for
many preventive treatments; examples here were Lipid lowering Vaccines Prevention of fractures
Parametric survival models can provide simple equations to: Predict future outcomes for patients Model cost-benefit (especially if Markov modeling
undertaken) Graphically describe benefit over time
Immediate plans: as a summer intern project, analyze Merck datasets to further evaluate value of methods in a pharmaceutical setting

39
References Anderson KM, A nonproportional hazards Weibull accelerated failure time
model. Biometrics, 1991;47:281-288. Anderson KM, Wilson PWF, Odell PM, Kannel WB, An updated coronary risk
profile. A statement for health professionals. Circulation 1991;83:356-362 Anderson KM, Odell PM, Wilson PWF and Kannel WB, Cardiovascular
disease risk profiles. American Heart Journal, 1990;121:293-8 Cole BF, Gelber RD, Anderson KM. Parametric approaches to quality-
adjusted survival analysis. Biometrics 1994;50:621-631 Black D et al. Once-yearly zoledronic acid for treatment of
postmenopausal osteoporosis. N Engl J Med 2007;356:1809-1822 Downs JR et al. Primary prevention of acute coronary events with
lovastatin in men and women with average cholesterol levels. Result of AFCAPS/TEXCAPS. JAMA 1998;279:1615–1622
The FUTURE II Study Group. Quadrivalent vaccine against human papillomavirus to prevent high-grade cervical lesions. N Engl J Med 2007;356:1915-27
Odell PM, Anderson KM, Kannel WB. New models for predicting cardiovascular events. J Clin Epidemiol 1994;47:582-592
Oxman, MN et al A vaccine to prevent herpes zoster and postherpetic neuralgia in older adults N Engl J Med 2005;352:2271-2284
Scandinavian Simvastatin Survival Study Group. Randomised trial of cholesterol lowering in 4444 patients with coronary heart disease: the Scandinavian Simvastatin Survival Study (4S). The Lancet 1994;344:1383-1389