Parallelograms revisited Exploring the limitations of ...
15
Contents lists available at ScienceDirect Cognition journal homepage: www.elsevier.com/locate/cognit Parallelograms revisited: Exploring the limitations of vector space models for simple analogies ☆ Joshua C. Peterson a, ⁎ ,1 , Dawn Chen b,1 , Thomas L. Griffiths a,c a Department of Computer Science, Princeton University, United States of America b Department of Psychology, University of California, Berkeley, United States of America c Department of Psychology, Princeton University, United States of America ARTICLE INFO Keywords: Analogy Relational similarity Vector space models ABSTRACT Classic psychological theories have demonstrated the power and limitations of spatial representations, providing geometric tools for reasoning about the similarity of objects and showing that human intuitions sometimes violate the constraints of geometric spaces. Recent machine learning methods for deriving vector-space em- beddings of words have begun to garner attention for their surprising capacity to capture simple analogies consistently across large corpora, giving new life to a classic model of analogies as parallelograms that was first proposed and briefly explored by psychologists. We evaluate the parallelogram model of analogy as applied to modern data-driven word embeddings, providing a detailed analysis of the extent to which this approach cap- tures human behavior in the domain of word pairs. Using a large novel benchmark dataset of human analogy completions, we show that word similarity alone surprisingly captures some aspects of human responses better than the parallelogram model. To gain a fine-grained picture of how well these models predict relational si- milarity, we also collect a large dataset of human relational similarity judgments and find that the parallelogram model captures some semantic relationships better than others. Finally, we provide evidence for deeper lim- itations of the parallelogram model of analogy based on the intrinsic geometric constraints of vector spaces, paralleling classic results for item similarity. Taken together, these results show that while modern word em- beddings do an impressive job of capturing semantic similarity at scale, the parallelogram model alone is in- sufficient to account for how people form even the simplest analogies. Recognizing that two situations have similar patterns of relation- ships, even though they may be superficially dissimilar, is essential for intelligence. This ability allows a reasoner to transfer knowledge from familiar situations to unfamiliar but analogous situations, and analogy has thus become a powerful teaching tool in math, science, and other fields (Richland & Simms, 2015). Computational modeling of analogy has primarily focused on comparing structured representations that contain labeled relationships between entities (Gentner & Forbus, 2011). However, the question of where these relations come from and how to determine that the relationship between one set of entities matches that of another set is still an active area of research. The parallelogram model of analogy (see Fig. 1), first proposed by Rumelhart and Abrahamson (1973), provides one solution to this pro- blem for simple analogies based on relational similarity. In this model, entities are represented as points in a Euclidean space and relations between entities are represented as their difference vectors. Even though two pairs of points (A, B) and (D, C) may be far apart in the space (i.e., they are featurally dissimilar), they are considered re- lationally similar as long as their difference vectors (B − A) and (D − C) are similar. Rumelhart and Abrahamson found that this simple model worked well for a small domain of animal words, which are represented by vectors obtained using low-dimensional multi- dimensional scaling solutions. Little attention has been given to the parallelogram model after the initial proposal, with the exception of a handful of applications (see Ehresman & Wessel, 1978). Subsequent work found that a “nearest neighbor” rule could capture people's choices on a four-term analogy completion task using a domain of occupational terms (e.g., librarian) better than the parallelogram model (Sadler & Shoben, 1993). Given an analogy completion question, represented as A : B :: C : ? (in words, A is https://doi.org/10.1016/j.cognition.2020.104440 Received 19 April 2019; Received in revised form 11 August 2020; Accepted 12 August 2020 ☆ This work was supported by grant number FA9550-13-1-0170 from the Air Force Office of Scientific Research and grant number 1718550 from the National Science Foundation. Preliminary results for Experiments 2-4 were presented at the Annual Conference of the Cognitive Science Society (Chen et al., 2017). ⁎ Corresponding author. E-mail address: [email protected] (J.C. Peterson). 1 These authors contributed equally to the work. Cognition 205 (2020) 104440 0010-0277/ © 2020 Elsevier B.V. All rights reserved. T
Transcript of Parallelograms revisited Exploring the limitations of ...

Contents lists available at ScienceDirect
Cognition
journal homepage: www.elsevier.com/locate/cognit
Parallelograms revisited: Exploring the limitations of vector space models for simple analogies☆
Joshua C. Petersona,⁎,1, Dawn Chenb,1, Thomas L. Griffithsa,c
a Department of Computer Science, Princeton University, United States of America b Department of Psychology, University of California, Berkeley, United States of America c Department of Psychology, Princeton University, United States of America
A R T I C L E I N F O
Keywords: Analogy Relational similarity Vector space models
A B S T R A C T
Classic psychological theories have demonstrated the power and limitations of spatial representations, providing geometric tools for reasoning about the similarity of objects and showing that human intuitions sometimes violate the constraints of geometric spaces. Recent machine learning methods for deriving vector-space em-beddings of words have begun to garner attention for their surprising capacity to capture simple analogies consistently across large corpora, giving new life to a classic model of analogies as parallelograms that was first proposed and briefly explored by psychologists. We evaluate the parallelogram model of analogy as applied to modern data-driven word embeddings, providing a detailed analysis of the extent to which this approach cap-tures human behavior in the domain of word pairs. Using a large novel benchmark dataset of human analogy completions, we show that word similarity alone surprisingly captures some aspects of human responses better than the parallelogram model. To gain a fine-grained picture of how well these models predict relational si-milarity, we also collect a large dataset of human relational similarity judgments and find that the parallelogram model captures some semantic relationships better than others. Finally, we provide evidence for deeper lim-itations of the parallelogram model of analogy based on the intrinsic geometric constraints of vector spaces, paralleling classic results for item similarity. Taken together, these results show that while modern word em-beddings do an impressive job of capturing semantic similarity at scale, the parallelogram model alone is in-sufficient to account for how people form even the simplest analogies.
Recognizing that two situations have similar patterns of relation-ships, even though they may be superficially dissimilar, is essential for intelligence. This ability allows a reasoner to transfer knowledge from familiar situations to unfamiliar but analogous situations, and analogy has thus become a powerful teaching tool in math, science, and other fields (Richland & Simms, 2015). Computational modeling of analogy has primarily focused on comparing structured representations that contain labeled relationships between entities (Gentner & Forbus, 2011). However, the question of where these relations come from and how to determine that the relationship between one set of entities matches that of another set is still an active area of research.
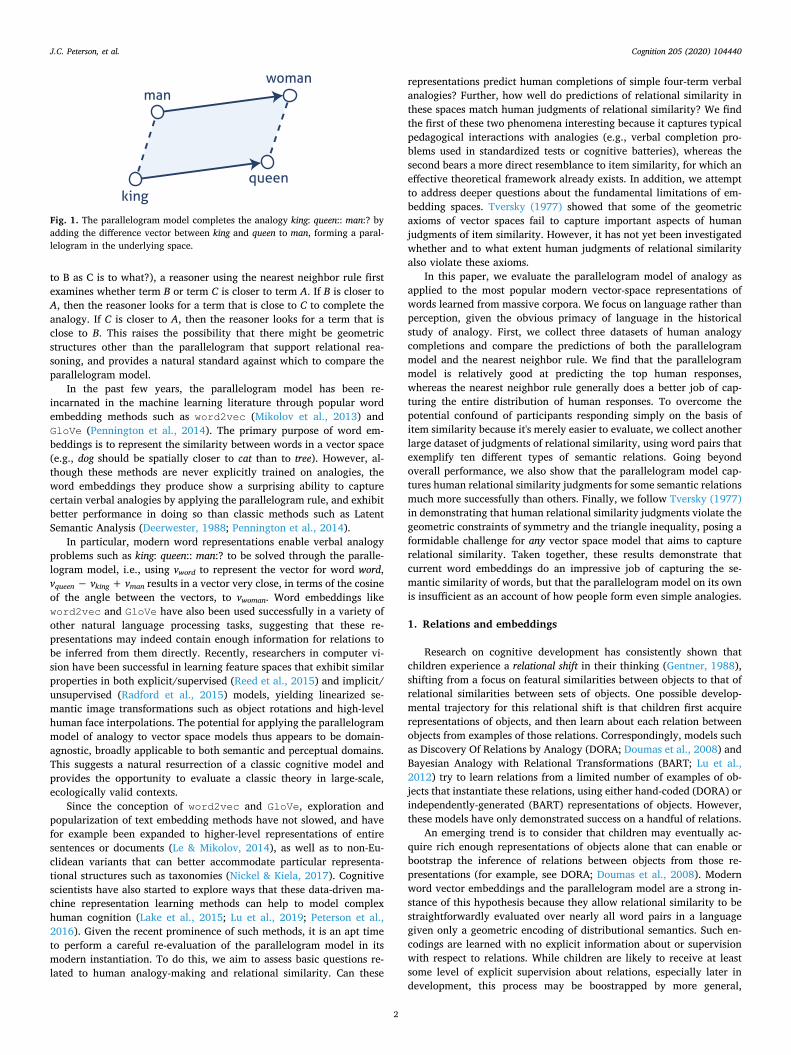
The parallelogram model of analogy (see Fig. 1), first proposed by Rumelhart and Abrahamson (1973), provides one solution to this pro-blem for simple analogies based on relational similarity. In this model, entities are represented as points in a Euclidean space and relations
between entities are represented as their difference vectors. Even though two pairs of points (A, B) and (D, C) may be far apart in the space (i.e., they are featurally dissimilar), they are considered re-lationally similar as long as their difference vectors (B − A) and (D − C) are similar. Rumelhart and Abrahamson found that this simple model worked well for a small domain of animal words, which are represented by vectors obtained using low-dimensional multi-dimensional scaling solutions.
Little attention has been given to the parallelogram model after the initial proposal, with the exception of a handful of applications (see Ehresman & Wessel, 1978). Subsequent work found that a “nearest neighbor” rule could capture people's choices on a four-term analogy completion task using a domain of occupational terms (e.g., librarian) better than the parallelogram model (Sadler & Shoben, 1993). Given an analogy completion question, represented as A : B :: C : ? (in words, A is
https://doi.org/10.1016/j.cognition.2020.104440 Received 19 April 2019; Received in revised form 11 August 2020; Accepted 12 August 2020
☆ This work was supported by grant number FA9550-13-1-0170 from the Air Force Office of Scientific Research and grant number 1718550 from the National Science Foundation. Preliminary results for Experiments 2-4 were presented at the Annual Conference of the Cognitive Science Society (Chen et al., 2017).
⁎ Corresponding author. E-mail address: [email protected] (J.C. Peterson).
1 These authors contributed equally to the work.
Cognition 205 (2020) 104440
0010-0277/ © 2020 Elsevier B.V. All rights reserved.
T
to B as C is to what?), a reasoner using the nearest neighbor rule first examines whether term B or term C is closer to term A. If B is closer to A, then the reasoner looks for a term that is close to C to complete the analogy. If C is closer to A, then the reasoner looks for a term that is close to B. This raises the possibility that there might be geometric structures other than the parallelogram that support relational rea-soning, and provides a natural standard against which to compare the parallelogram model.
In the past few years, the parallelogram model has been re-incarnated in the machine learning literature through popular word embedding methods such as word2vec (Mikolov et al., 2013) and GloVe (Pennington et al., 2014). The primary purpose of word em-beddings is to represent the similarity between words in a vector space (e.g., dog should be spatially closer to cat than to tree). However, al-though these methods are never explicitly trained on analogies, the word embeddings they produce show a surprising ability to capture certain verbal analogies by applying the parallelogram rule, and exhibit better performance in doing so than classic methods such as Latent Semantic Analysis (Deerwester, 1988; Pennington et al., 2014).
In particular, modern word representations enable verbal analogy problems such as king: queen:: man:? to be solved through the paralle-logram model, i.e., using vword to represent the vector for word word, vqueen − vking + vman results in a vector very close, in terms of the cosine of the angle between the vectors, to vwoman. Word embeddings like word2vec and GloVe have also been used successfully in a variety of other natural language processing tasks, suggesting that these re-presentations may indeed contain enough information for relations to be inferred from them directly. Recently, researchers in computer vi-sion have been successful in learning feature spaces that exhibit similar properties in both explicit/supervised (Reed et al., 2015) and implicit/ unsupervised (Radford et al., 2015) models, yielding linearized se-mantic image transformations such as object rotations and high-level human face interpolations. The potential for applying the parallelogram model of analogy to vector space models thus appears to be domain- agnostic, broadly applicable to both semantic and perceptual domains. This suggests a natural resurrection of a classic cognitive model and provides the opportunity to evaluate a classic theory in large-scale, ecologically valid contexts.
Since the conception of word2vec and GloVe, exploration and popularization of text embedding methods have not slowed, and have for example been expanded to higher-level representations of entire sentences or documents (Le & Mikolov, 2014), as well as to non-Eu-clidean variants that can better accommodate particular representa-tional structures such as taxonomies (Nickel & Kiela, 2017). Cognitive scientists have also started to explore ways that these data-driven ma-chine representation learning methods can help to model complex human cognition (Lake et al., 2015; Lu et al., 2019; Peterson et al., 2016). Given the recent prominence of such methods, it is an apt time to perform a careful re-evaluation of the parallelogram model in its modern instantiation. To do this, we aim to assess basic questions re-lated to human analogy-making and relational similarity. Can these
representations predict human completions of simple four-term verbal analogies? Further, how well do predictions of relational similarity in these spaces match human judgments of relational similarity? We find the first of these two phenomena interesting because it captures typical pedagogical interactions with analogies (e.g., verbal completion pro-blems used in standardized tests or cognitive batteries), whereas the second bears a more direct resemblance to item similarity, for which an effective theoretical framework already exists. In addition, we attempt to address deeper questions about the fundamental limitations of em-bedding spaces. Tversky (1977) showed that some of the geometric axioms of vector spaces fail to capture important aspects of human judgments of item similarity. However, it has not yet been investigated whether and to what extent human judgments of relational similarity also violate these axioms.
In this paper, we evaluate the parallelogram model of analogy as applied to the most popular modern vector-space representations of words learned from massive corpora. We focus on language rather than perception, given the obvious primacy of language in the historical study of analogy. First, we collect three datasets of human analogy completions and compare the predictions of both the parallelogram model and the nearest neighbor rule. We find that the parallelogram model is relatively good at predicting the top human responses, whereas the nearest neighbor rule generally does a better job of cap-turing the entire distribution of human responses. To overcome the potential confound of participants responding simply on the basis of item similarity because it's merely easier to evaluate, we collect another large dataset of judgments of relational similarity, using word pairs that exemplify ten different types of semantic relations. Going beyond overall performance, we also show that the parallelogram model cap-tures human relational similarity judgments for some semantic relations much more successfully than others. Finally, we follow Tversky (1977) in demonstrating that human relational similarity judgments violate the geometric constraints of symmetry and the triangle inequality, posing a formidable challenge for any vector space model that aims to capture relational similarity. Taken together, these results demonstrate that current word embeddings do an impressive job of capturing the se-mantic similarity of words, but that the parallelogram model on its own is insufficient as an account of how people form even simple analogies.
1. Relations and embeddings
Research on cognitive development has consistently shown that children experience a relational shift in their thinking (Gentner, 1988), shifting from a focus on featural similarities between objects to that of relational similarities between sets of objects. One possible develop-mental trajectory for this relational shift is that children first acquire representations of objects, and then learn about each relation between objects from examples of those relations. Correspondingly, models such as Discovery Of Relations by Analogy (DORA; Doumas et al., 2008) and Bayesian Analogy with Relational Transformations (BART; Lu et al., 2012) try to learn relations from a limited number of examples of ob-jects that instantiate these relations, using either hand-coded (DORA) or independently-generated (BART) representations of objects. However, these models have only demonstrated success on a handful of relations.
An emerging trend is to consider that children may eventually ac-quire rich enough representations of objects alone that can enable or bootstrap the inference of relations between objects from those re-presentations (for example, see DORA; Doumas et al., 2008). Modern word vector embeddings and the parallelogram model are a strong in-stance of this hypothesis because they allow relational similarity to be straightforwardly evaluated over nearly all word pairs in a language given only a geometric encoding of distributional semantics. Such en-codings are learned with no explicit information about or supervision with respect to relations. While children are likely to receive at least some level of explicit supervision about relations, especially later in development, this process may be boostrapped by more general,
Fig. 1. The parallelogram model completes the analogy king: queen:: man:? by adding the difference vector between king and queen to man, forming a paral-lelogram in the underlying space.
J.C. Peterson, et al. Cognition 205 (2020) 104440
2

unsupervised information as well. Indeed, recent work modeling human relation learning has found success in incorporating supervision over off-the-shelf word embedding models (Lu et al., 2019). We turn now to these embedding models and the manner in which the implicitly re-present relations in more detail.
Word embeddings are traditionally used to efficiently represent word similarity via distributional semantics (Harris, 1954), or seman-tics inferred as a function of the distributional properties of word oc-currences. In particular, we expect to some extent that words that have similar meanings will appear in similar contexts (Firth, 1968). Without committing to this phenomenon as a complete theory of semantics, we can nevertheless appreciate that such a highly general and plentiful source of semantic cues may be very useful to a learner, and may compliment more structured semantic representations. For example, distributional information can be useful when inferring the meaning or use cases of rare or novel words since they may appear in contexts si-milar to well-known words (Gleitman, 2002; Yarlett & Ramscar, 2008).
A pure but perhaps crude form of distributional representations are simply vectors for each word in a vocabulary where each dimension tallies the frequency that the word co-occurs with each other word. However, such vectors are very large, sparse, and potentially noisy. The most common alternative historically employed in cognitive models of semantics makes use of matrix factorization via singular value decom-position, referred to as Latent Semantic Analysis (LSA; Deerwester, 1988). This procedure results in a low-rank approximation (i.e., a re-latively low-dimensional non-sparse embedding) of the count vectors. The resulting vector space effectively and compactly represents many aspects of word similarity that we would expect from a good semantic representation. In one form or another, this is the goal and result of nearly all classic and modern word embedding methods. For this reason, it is important to understand the advantages of more modern methods. Why would we expect one method to perform better than another? One difference in modern embeddings are the alternative choices of what “context” means. For example, LSA treats a “document” (i.e., a news article) as the context over which word co-occurances are considered. The more recent word2vec method defines a context as a local window of words around the word of interest, while its successor GloVe incorporates both local windows and global counts. Another distinguishing feature of recent methods is scalability. Appropriately optimized word2vec models for example can be trained on (and learn from) over one-hundred billion words in a day using a single computer (Mikolov et al., 2013). Both of these factors appear to effect the quality and applicability of the resulting representation. Since the current work focuses on modern word representation methods as opposed to classic ones (e.g., LSA), we review their formulations below.
One of the most popular modern word embedding methods is the word2vec algorithm, which learns an embedding in service of an ob-jective to either (1) predict the occurrence of a word given surrounding words (called Continuous Bag-of-Words or CBOW), or (2) predict the occurrence of surrounding words given the a target word (called Skip- gram). More formally, CBOW models aim to maximize the average log probability:
… …=
+ +Tp w w w w w1 log ( | , , , , ),
t
T
t t c t t t c1
1 1(1)
where T is the total number of words in our corpus, t indexes the po-sition of the word wt in the sequence, and c is the size of a context window of words (e.g., wt+j where j ≠ 0) around wt. In Skip-gram models, the objective is to maximize the probability of the context words surrounding each word in a sequence:
=+T
p w w1 log ( | ),t
T
c j c jt j t
1 , 0 (2)
In order to achieve this, two-layer neural networks are used to map input words to output words. For CBOW, context words coded as a
sparse vectors (i.e., with only one nonzero entry in each) are input to the network and embedded using a single hidden layer. These context vectors are then averaged into a single context vector and multiplied with a final weight matrix before being passed to the final softmax layer, which in the general inefficient case outputs for each word in the vocabulary an estimated probability of it occurring within that context. The intended output words used for training are also coded as sparse vectors. Since, the final weight matrix computes inner products (i.e., similarities) between each context and a vector of weights for each word in the vocabulary, these weights are taken as the “word embed-dings” (as opposed to context embeddings from the first layer). In Skip- gram networks, as expected, only a single word is given as input and context words are predicted as outputs. Since corpus-scale vocabularies can be very large, a number of training optimizations are often em-ployed, such as hierarchical softmax and negative sampling (Mikolov et al., 2013).
Unlike word2vec, GloVe neither predicts words from context words nor context words from target words directly. Instead, GloVe starts with word co-occurance counts, much like LSA. However, like word2vec, GloVe uses local context windows (to compute counts) instead of documents. This can be thought of as a less noisy measure-ment of local co-occurance information for which word2vec is based. Starting with a count matrix X, where Xij is the number of times word i co-occurs within some window size of word j, the authors derive a least squares objective relating the inner product of word vectors wi and wj to counts Xij:
+ +=
f X w w b b X( )( log ) ,i j
V
ij iT
j i j ij, 1
2
(3)
where V is the vocabulary size, f is a weighting function that dem-phasizes co-occurances of zero, and bi and bj are bias vectors. GloVe is tasked with finding a word vector embedding that minimizes this (error) objective. While the derivation of this objective (see Pennington et al., 2014) is not as straightforward as word2vec, it can be illumi-nating to compare the two instead. First, note that both model word similarity as an inner product between word vectors—in word2vec, this is expressed in the neural network formulation. Next, since word2vec starts from a probabilistic formulation, error is measured using crossentropy, whereas in the GloVe objective, squared error is used. The effect of employing the latter, as the authors explain, is to put less weight on the long tails of the distribution (i.e., where some word pairs may only co-occur within a window just a few times in an entire corpus). Lastly, the probabilities predicted by GloVe are unnormalized (i.e., Xij is a count).
The original parallelogram model of analogy was not proposed and evaluated in the context of embeddings optimized to encode distribu-tional semantics, but instead conceived in the context of inferred mental representations of animal terms (Rumelhart & Abrahamson, 1973). However, these two types of embeddings are similar in an im-portant way: both were optimized to encode only first-order item si-milarity. The fact that the parallelogram model applies in both cases (and in all geometric representations) is a property of the form of the representation as opposed to the content or manner of derivation. That is, the concept of a relation is both simple and well-defined in geometric spaces: the relationship between two points is fully described by the length and direction of the vector that connects them (i.e., we can think of one point as a translation of the first). This is more than a simple artifact of the representation. When we ask if two pairs of points are similar, we are asking if their relation vectors are similar, and conse-quently if points A and B have a similar change in each semantic di-mension as points C and D. Applying this model in the context of em-beddings that encompass an entire language can therefore be thought of as a test of its viability as a highly generalizable cognitive model, even if only sufficient to capture simple semantic relational reasoning.
J.C. Peterson, et al. Cognition 205 (2020) 104440
3

2. Analogy completions
Four-term verbal analogies (e.g., cat: kitten:: dog:?) have long been used in tests of intelligence and vocabulary, such as the GRE and past versions of the SAT, as well as in analogy research (e.g., Sternberg & Nigro, 1980; Turney, 2013). The task of completing these analogies is one straightforward and intuitive way to evaluate models of analogy. However, the scope of this approach has been limited, even in large- scale machine learning assessments. For example, the dataset of ana-logy completion problems that Mikolov et al. (2013) created in order to evaluate word2vec was quite limited, including nine syntactic rela-tions (such as adjective-to-adverb, an example of which is apparent: ap-parently) and only five semantic relations: capital-of-common-country (e.g., Athens: Greece), capital-of-any-country (e.g., Astana: Kazakhstan), currency-of-country (e.g., Angola: Kwanza), city-in-state (e.g., Chicago: Illinois), and man-woman (e.g., brother: sister). We aimed to evaluate the parallelogram model on a richer dataset of participant-generated ana-logy completions that includes a variety of semantic relations. Toward this goal, we conducted a series of experiments that leverage different analogy-completion questions drawn from the psychology and com-puter science literature.
2.1. Experiment 1a: Green et al.'s (2010) stimuli
2.1.1. Participants We recruited 61 participants from Amazon Mechanical Turk, who
gave informed consent and were paid $1.00 for the 10-min study. Participants appeared to understand and pay attention to the task as assessed by the attention check questions and none were excluded from the data analysis. However, misspelled responses were discarded, and sometimes participants skipped a particular question, perhaps because they did not understand either the words or the analogy. This experi-ment and all following experiments were conducted under the IRB protocol number 2015–05-755 entitled “Cognitive Research Using Amazon Mechanical Turk” approved by the institutional review board of the University of California, Berkeley.
2.1.2. Stimuli We created analogy completion questions for this experiment from
stimuli used in a previous experiment (Green et al., 2010). In Green et al., participants indicated whether each four-word analogy was valid. The stimuli included 40 within-domain (i.e., the source and target pairs are from semantically similar domains) and 40 cross-domain (i.e., the source and target pairs are from semantically different domains) ana-logies. Each cross-domain analogy corresponded to one of the within- domain analogies in that both analogies had the same A:B pair. For example, answer: riddle:: solution: problem and answer: riddle:: key: lock were corresponding within-domain and cross-domain analogies. We created analogy-completion problems from these stimuli by simply re-moving the D term.
2.1.3. Procedure Participants were given instructions about four-word analogies and
the analogy completion task. They then completed 45 analogies, 20 of which were a subset of the within-domain analogies from Green et al. (2010), 20 of which were cross-domain analogies with different A:B pairs from those in the within-domain analogies (so that participants saw each A:B pair only once), and 5 of which were very simple ana-logies added as attention checks (East: West:: North:?, hot: cold:: warm:?, king: queen:: prince:?, hand: fingers:: foot:?, and sister: brother:: aunt:?). The analogy problems were presented in a random order across five pages, with the constraint that each page included one attention check.
2.1.4. Results About 30 responses were obtained for each analogy completion
question. Figs. 2 and 3 respectively show the distributions of responses
to a within-domain question and the corresponding cross-domain question. Across all analogy completion questions, 55% of participants provided the most frequent completion on average. Frequency of the modal completion for individual analogies ranged from 13% to 97%.
2.2. Experiment 1b: Kmiecik and Morrison's (2013) stimuli
2.2.1. Participants We recruited 117 participants from Amazon Mechanical Turk, who
gave informed consent and were paid $1.00 for the 10-min study. This group of participants did not overlap with the participants in Experiment 1a.
2.2.2. Stimuli For this study, we adapted stimuli from Kmiecik and Morrison
(2013), which used a paradigm similar to Green et al. (2010). The stimuli included both “near” and “far” analogies and included five different relations: kept in (e.g., animal: zoo), kind of (e.g., aluminum: metal), made of (e.g., candle: wax), used to (e.g., train: travel), and works for (e.g., curator: museum). We chose a subset of 178 analogies that at least 90% of participants indicated as being true analogies and adapted them into analogy completion questions.
2.2.3. Procedure The procedure for this experiment was very similar to the one for
Experiment 1a. Participants completed either 44 or 45 of the 178 analogies, with no constraints on how many and which near and far analogies they completed. When they completed only 44 of the analo-gies from Kmiecik and Morrison (2013)’s stimuli, they also completed one of the simple analogies used as attention checks in Experiment 1a
Fig. 2. Response proportions and frequencies (shown above the bars) for the question answer:riddle::solution:?, a within-domain question from Experiment 1a.
Fig. 3. Response proportions and frequencies (shown above the bars) for the question answer:riddle::key:?, a cross-domain question from Experiment 1a.
J.C. Peterson, et al. Cognition 205 (2020) 104440
4
so that every participant completed a total of 45 analogies. No other attention checks were used.
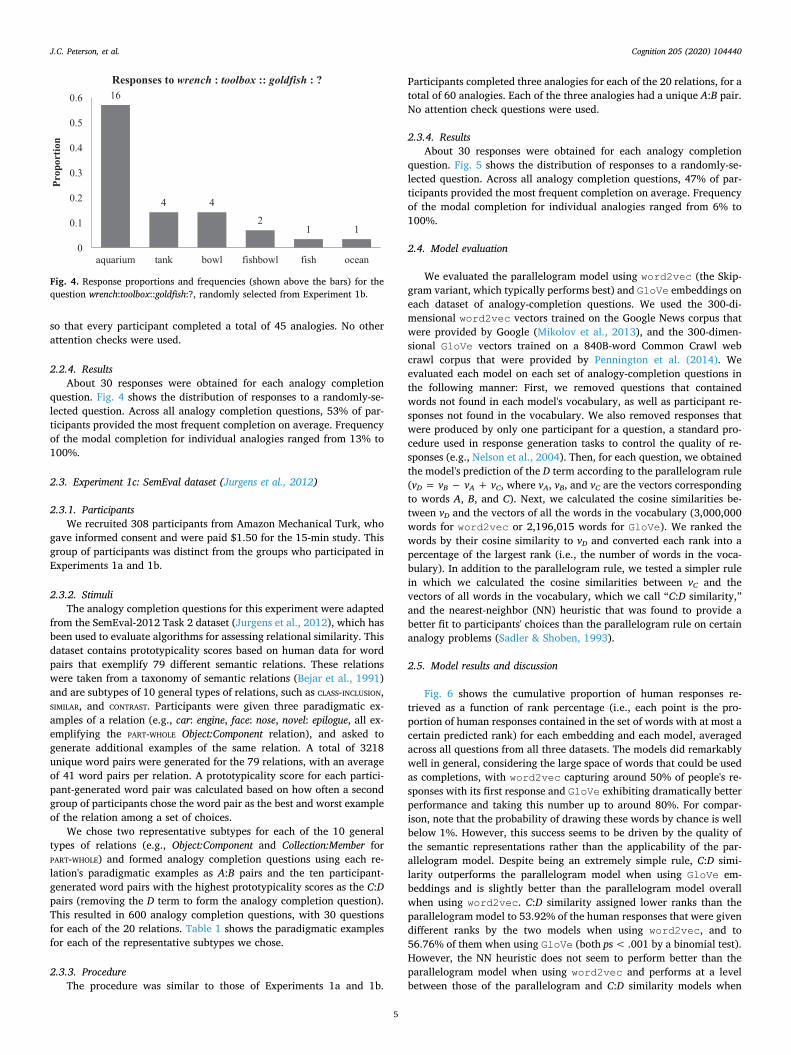
2.2.4. Results About 30 responses were obtained for each analogy completion
question. Fig. 4 shows the distribution of responses to a randomly-se-lected question. Across all analogy completion questions, 53% of par-ticipants provided the most frequent completion on average. Frequency of the modal completion for individual analogies ranged from 13% to 100%.
2.3. Experiment 1c: SemEval dataset (Jurgens et al., 2012)
2.3.1. Participants We recruited 308 participants from Amazon Mechanical Turk, who
gave informed consent and were paid $1.50 for the 15-min study. This group of participants was distinct from the groups who participated in Experiments 1a and 1b.
2.3.2. Stimuli The analogy completion questions for this experiment were adapted
from the SemEval-2012 Task 2 dataset (Jurgens et al., 2012), which has been used to evaluate algorithms for assessing relational similarity. This dataset contains prototypicality scores based on human data for word pairs that exemplify 79 different semantic relations. These relations were taken from a taxonomy of semantic relations (Bejar et al., 1991) and are subtypes of 10 general types of relations, such as CLASS-INCLUSION, SIMILAR, and CONTRAST. Participants were given three paradigmatic ex-amples of a relation (e.g., car: engine, face: nose, novel: epilogue, all ex-emplifying the PART-WHOLE Object:Component relation), and asked to generate additional examples of the same relation. A total of 3218 unique word pairs were generated for the 79 relations, with an average of 41 word pairs per relation. A prototypicality score for each partici-pant-generated word pair was calculated based on how often a second group of participants chose the word pair as the best and worst example of the relation among a set of choices.
We chose two representative subtypes for each of the 10 general types of relations (e.g., Object:Component and Collection:Member for PART-WHOLE) and formed analogy completion questions using each re-lation's paradigmatic examples as A:B pairs and the ten participant- generated word pairs with the highest prototypicality scores as the C:D pairs (removing the D term to form the analogy completion question). This resulted in 600 analogy completion questions, with 30 questions for each of the 20 relations. Table 1 shows the paradigmatic examples for each of the representative subtypes we chose.
2.3.3. Procedure The procedure was similar to those of Experiments 1a and 1b.
Participants completed three analogies for each of the 20 relations, for a total of 60 analogies. Each of the three analogies had a unique A:B pair. No attention check questions were used.
2.3.4. Results About 30 responses were obtained for each analogy completion
question. Fig. 5 shows the distribution of responses to a randomly-se-lected question. Across all analogy completion questions, 47% of par-ticipants provided the most frequent completion on average. Frequency of the modal completion for individual analogies ranged from 6% to 100%.
2.4. Model evaluation
We evaluated the parallelogram model using word2vec (the Skip- gram variant, which typically performs best) and GloVe embeddings on each dataset of analogy-completion questions. We used the 300-di-mensional word2vec vectors trained on the Google News corpus that were provided by Google (Mikolov et al., 2013), and the 300-dimen-sional GloVe vectors trained on a 840B-word Common Crawl web crawl corpus that were provided by Pennington et al. (2014). We evaluated each model on each set of analogy-completion questions in the following manner: First, we removed questions that contained words not found in each model's vocabulary, as well as participant re-sponses not found in the vocabulary. We also removed responses that were produced by only one participant for a question, a standard pro-cedure used in response generation tasks to control the quality of re-sponses (e.g., Nelson et al., 2004). Then, for each question, we obtained the model's prediction of the D term according to the parallelogram rule (vD = vB − vA + vC, where vA, vB, and vC are the vectors corresponding to words A, B, and C). Next, we calculated the cosine similarities be-tween vD and the vectors of all the words in the vocabulary (3,000,000 words for word2vec or 2,196,015 words for GloVe). We ranked the words by their cosine similarity to vD and converted each rank into a percentage of the largest rank (i.e., the number of words in the voca-bulary). In addition to the parallelogram rule, we tested a simpler rule in which we calculated the cosine similarities between vC and the vectors of all words in the vocabulary, which we call “C:D similarity,” and the nearest-neighbor (NN) heuristic that was found to provide a better fit to participants' choices than the parallelogram rule on certain analogy problems (Sadler & Shoben, 1993).
2.5. Model results and discussion
Fig. 6 shows the cumulative proportion of human responses re-trieved as a function of rank percentage (i.e., each point is the pro-portion of human responses contained in the set of words with at most a certain predicted rank) for each embedding and each model, averaged across all questions from all three datasets. The models did remarkably well in general, considering the large space of words that could be used as completions, with word2vec capturing around 50% of people's re-sponses with its first response and GloVe exhibiting dramatically better performance and taking this number up to around 80%. For compar-ison, note that the probability of drawing these words by chance is well below 1%. However, this success seems to be driven by the quality of the semantic representations rather than the applicability of the par-allelogram model. Despite being an extremely simple rule, C:D simi-larity outperforms the parallelogram model when using GloVe em-beddings and is slightly better than the parallelogram model overall when using word2vec. C:D similarity assigned lower ranks than the parallelogram model to 53.92% of the human responses that were given different ranks by the two models when using word2vec, and to 56.76% of them when using GloVe (both ps < .001 by a binomial test). However, the NN heuristic does not seem to perform better than the parallelogram model when using word2vec and performs at a level between those of the parallelogram and C:D similarity models when
Fig. 4. Response proportions and frequencies (shown above the bars) for the question wrench:toolbox::goldfish:?, randomly selected from Experiment 1b.
J.C. Peterson, et al. Cognition 205 (2020) 104440
5

using GloVe. These results indicate that given word embeddings such as
word2vec and GloVe, we may achieve better analogy completion performance using similarity rather than the parallelogram model, echoing Sadler and Shoben's (1993) finding that a more complex par-allelogram rule may not be necessary or even optimal. The parallelo-gram model may be relatively good at capturing the most frequent human analogy completion response (its median rank for the top human response was slightly lower than that of C:D similarity, a dif-ference that was not statistically significant), but it certainly does not capture the entire distribution of human responses, which may be better predicted by item (word) similarity. While these results highlight the limitations of the parallelogram model, they focus on only one way of assessing analogy performance, the task of completing analogies. Furthermore, if participants feel rushed or confused on the task, they may be more influenced by item similarity in their responses, because item similarity is easier to process than higher-order relations. To ad-dress these concerns we evaluated the performance of the parallelo-gram model on another task where relational similarity was assessed directly.
3. Relational similarity
Our results thus far hint at the possibility that the parallelogram model does not provide the best fit to human representations of rela-tional similarity in popular modern word embedding spaces. However, it could be that analogy completions do not depend solely on relational
Table 1 The paradigmatic examples for the representative subtypes we chose from each general relation type in the SemEval-2012 Task 2 dataset.
Relation type Subtype Paradigmatic examples (A:B pairs)
CLASS-INCLUSION Taxonomic flower: tulip, emotion: rage, poem: sonnet Class:Individual queen: Elizabeth, river: Nile, mountain: Everest
PART-WHOLE Object:Component car: engine, face: nose, novel: epilogue Collection:Member forest: tree, anthology: poem, fleet: ship
SIMILAR Synonymy car: auto, buy: purchase, rapid: quick Dimensional Similarity enthusiasm: fervor, simmer: boil, stream: river
CONTRAST Contrary old: young, happy: sad, smooth: rough Reverse attack: defend, buy: sell, love: hate
ATTRIBUTE Item:Attribute beggar: poor, glass: fragile, hero: brave Object:State beggar: poverty, dupe: gullibility, novice: inexperience
NON-ATTRIBUTE Item:Nonattribute harmony: discordant, bulwark: flimsy, sound: inaudible Object:Nonstate laureate: dishonor, famine: plenitude, war: tranquility
CASE RELATIONS Agent:Instrument farmer: tractor, conductor: baton, arsonist: match Action:Object plow: earth, sing: dirge, pardon: sin
CAUSE-PURPOSE Cause:Effect enigma: puzzlement, joke: laughter, practice: improvement Cause:Compensatory Action hunger: eat, fatigue: sleep, lateness: hurry
SPACE-TIME Location:Item arsenal: weapon, seminary: theologian, bookshelf: books Time:Associated Item retirement: pension, infancy: cradle, adolescence: textbooks
REFERENCE Sign:Significant siren: danger, scepter: authority, signature: approval Representation portrait: person, backdrop: vista, diary: person
Fig. 5. Response proportions and frequencies (shown above the bars) for the question lateness:hurry::tiredness:?, randomly selected from Experiment 1c.
Fig. 6. The cumulative proportion of human responses retrieved as a function of rank percentage for each model using (a) word2vec and (b) GloVe em-beddings.
J.C. Peterson, et al. Cognition 205 (2020) 104440
6

similarity, or that the particular task used biases participants toward less effortful judgments. In order to more fully assess how well the parallelogram model captures human representations of relational si-milarity, we turned to an alternative paradigm that better isolates re-lational similarity and imposes greater constraints on the task strategy. According to the parallelogram model, two pairs of words (A: B and C: D) are relationally similar to the extent that their difference vectors (vB − vA and vD − vC) are similar. How appropriate is this geometric relationship for the various semantic relations?
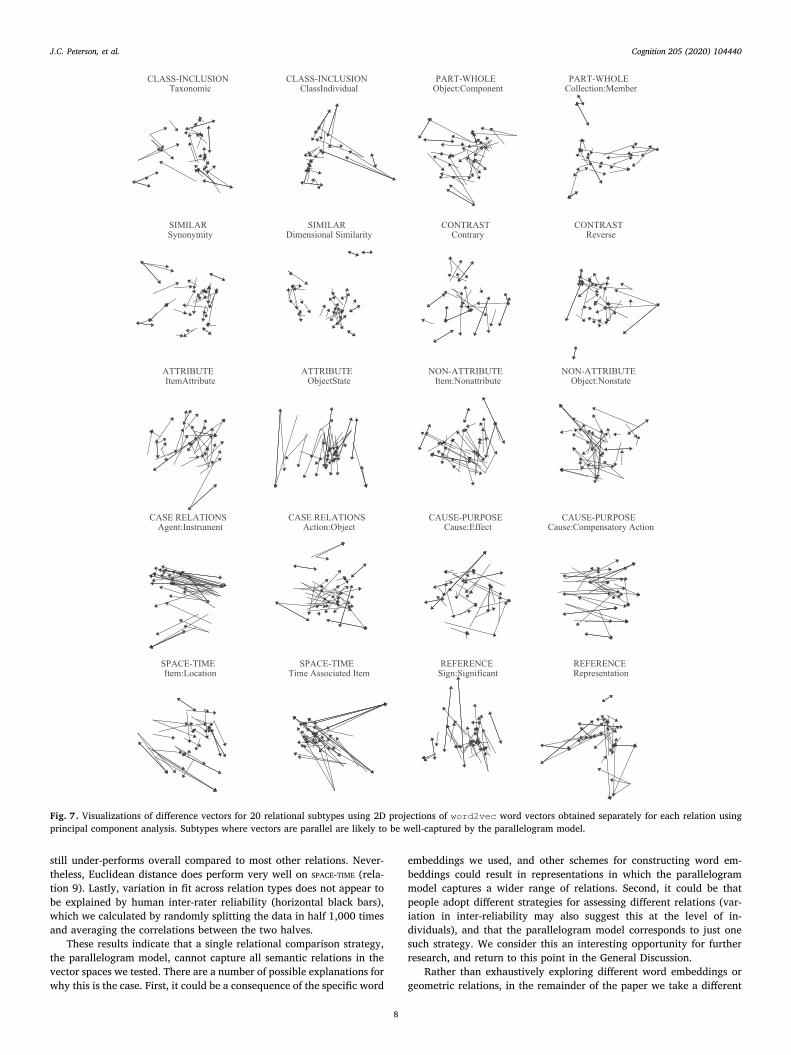
As a preliminary investigation of this question, we projected the 300-dimensional word2vec vectors into a two-dimensional space using principal component analysis separately for each relational subtype in the SemEval-2012 Task 2 dataset, and visualized the difference vectors for the participant-generated word pairs from each relation. A similar method was employed in Mikolov et al. (2013), in which projections of the vectors connecting various cities and the capitals of their countries were visualized. In their work, vectors for different city-capital pairs exhibited highly similar directions (i.e., the lines that connect each word pair are parallel) in the 2D space and provided clear qualitative evidence of implicitly learned relational similarity. Similarly, we vi-sualize the difference vectors for each word pair that exemplifies the 20 relational subtypes (i.e., from Table 1) of the SemEval dataset in Fig. 7.
If word embeddings are able to capture relations in the SemEval dataset using the parallelogram model, we would expect word-pair difference vectors of the same relation type to be similarly co-linear (i.e., mostly parallel). Examining the difference vectors for each rela-tion shows that the parallelogram rule does not appear to capture all relations. CASE RELATIONS Agent:Instrument (e.g., farmer: tractor) shows a nearly perfect correspondence with what we would expect under the parallelogram model, with all difference vectors aligning. However, many of the relations appear to have no clear geometric pattern. Nevertheless, simply looking at projections of the difference vectors is not sufficient to evaluate the power of geometric models of relational similarity to capture various relations, because information is lost in the projections. What is required is a detailed evaluation of the model on human judgments of relational similarity between word pairs within each relation.
Although the SemEval dataset contains prototypicality scores for the participant-generated word pairs within each relation, which have been interpreted as the relational similarities between the participant-gen-erated pairs and the paradigmatic pairs, prototypicality is influenced by other factors such as the production frequencies of words (Uyeda & Mandler, 1980). Moreover, because participants were encouraged to focus on the relation illustrated by the paradigmatic examples, the prototypicality scores may not have much to do with the particular word pairs chosen as paradigmatic examples. Experiment 2 aims to address these problems.
3.1. Experiment 2: relational similarity judgments
3.1.1. Participants We recruited 823 participants from Amazon Mechanical Turk.
Participants were paid $2.00 for the 20-min study. We excluded 158 participants from the data analysis because they failed two or more of the attention checks.
3.1.2. Stimuli The stimuli for this study were taken from the SemEval-2012 Task 2
dataset. We were mainly interested in how people rate relational si-milarities between participant-generated word pairs within each of the 79 relational subtypes. However, because the total number of such “within-subtype” pairwise comparisons is still enormous, we selected the most representative subtype out of the two that we chose for each of the 10 general types for Experiment 1c. The subtype we chose is the first of the pair of examples of each type that appears in Fig. 7. We then randomly chose 30 word pairs out of the entire participant-generated
set for each of the 10 subtypes and formed all possible within-subtype comparisons between these word pairs. This created a set of 4350 within-subtype comparisons. Finally, in order to encourage participants to use the entire rating scale, we added 925 “between-subtype” com-parisons, which are comparisons between word pairs from different subtypes within a type (e.g., Object-Component and Collection-Member, both subtypes of PART-WHOLE), and 925 “between-type” comparisons, which are comparisons between word pairs from the representative subtypes of different relational types (e.g., Object-Component and Taxonomic CLASS-INCLUSION).
3.1.3. Procedure Participants were told that they will see two pairs of words on each
page and asked to rate the similarity of the relationships shown by the two word pairs on a scale from 1 (extremely different) to 7 (extremely similar). The instructions included an example of two word pairs that have similar relationships (kitten: cat and chick: chicken) and an example of word pairs with dissimilar relationships (chick: chicken and hen: rooster). Participants then rated 100 comparisons in a random order, 70 of which were within-subtype, 15 of which were between-subtype, and 15 of which were between-type. The left-right order of the two word pairs on the screen was chosen randomly (but order within pairs was of course maintained). Finally, five attention check trials that asked par-ticipants to indicate whether two words are the same or different ap-peared at intervals of 20 normal trials.
3.1.4. Results & discussion We obtained at least 10 good ratings for each comparison, with an
average of 10.74 ratings per comparison. The mean rating across all comparisons was 4.52 (SD = 2.17). As expected, we obtained the highest relational similarity ratings for within-subtype comparisons (M = 5.01, SD = 1.98), mid-level ratings for between-subtype com-parisons (M = 4.02, SD = 2.14) and the lowest ratings for between- type comparisons (M = 2.70, SD = 1.93).
We calculated relational similarity for each comparison using word2vec and GloVe word representations. We used the 300-dimen-sional word2vec vectors trained on the Google News corpus that were provided by Google (Mikolov et al., 2013), and the 300-dimensional GloVe vectors trained on a Common Crawl web crawl corpus that were provided by Pennington et al. (2014). We tested two measures of si-milarity between difference vectors, cosine similarity and Euclidean distance. Specifically, for a given comparison between two word pairs, A: B and C: D, letting r1 = vB − vA and r2 = vD − vC, we calculated the cosine similarity,
r rr r
,1 2
1 2
as well as a similarity measure based on Euclidean distance,
r r1 .1 2
Cosine similarity is typically used to measure similarity in vector spaces such as word2vec and GloVe. However, using Euclidean dis-tance corresponds more closely to the original parallelogram model, in which not only the directions but also the lengths of the difference vectors needed to be similar for two word pairs to be considered re-lationally similar.
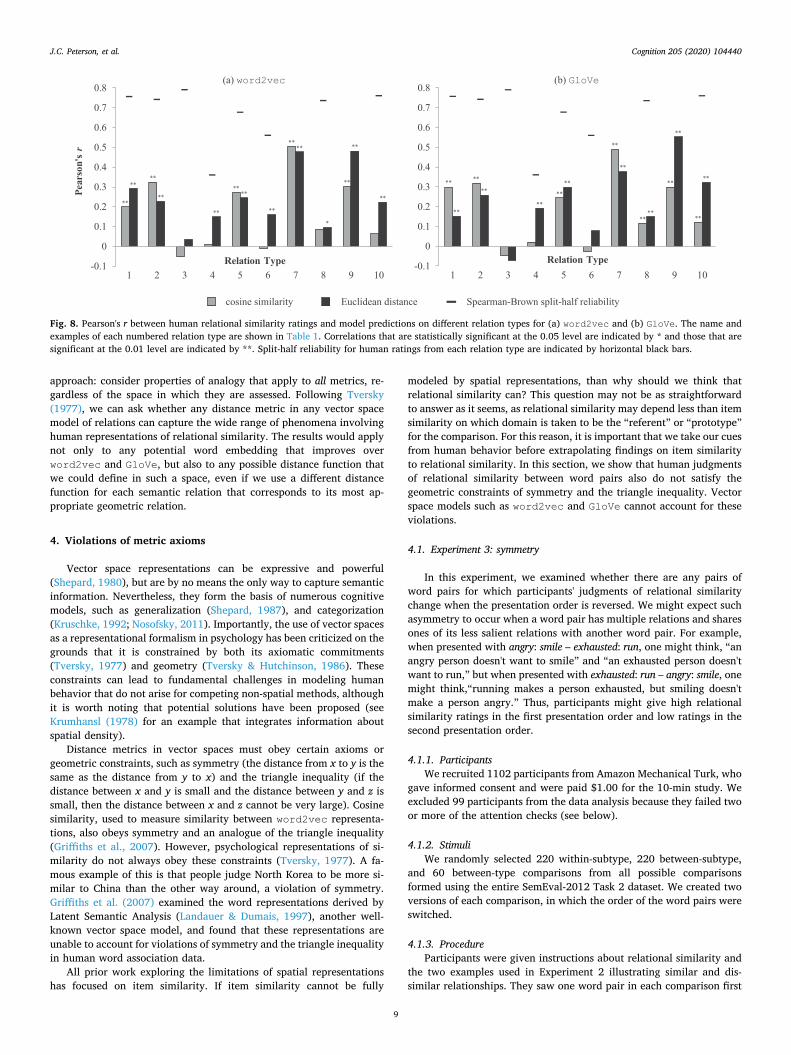
Fig. 8 shows Pearson's correlations between predicted relational similarity scores and average human relational similarity ratings on each relation type (including both within-subtype and between-subtype comparisons) for each vector space and similarity measure. There is considerable variation in the performance of word2vec and GloVe in predicting human relational similarity ratings. As might be expected from examining Fig. 7, cosine similarity performs the best on CASE RE-
LATIONS (relation 7). However, cosine similarity completely fails on SI-
MILAR (relation 3), CONTRAST (relation 4), and NON-ATTRIBUTE (relation 6). Euclidean distance boosts performance on the latter two relations, but
J.C. Peterson, et al. Cognition 205 (2020) 104440
7
still under-performs overall compared to most other relations. Never-theless, Euclidean distance does perform very well on SPACE-TIME (rela-tion 9). Lastly, variation in fit across relation types does not appear to be explained by human inter-rater reliability (horizontal black bars), which we calculated by randomly splitting the data in half 1,000 times and averaging the correlations between the two halves.
These results indicate that a single relational comparison strategy, the parallelogram model, cannot capture all semantic relations in the vector spaces we tested. There are a number of possible explanations for why this is the case. First, it could be a consequence of the specific word
embeddings we used, and other schemes for constructing word em-beddings could result in representations in which the parallelogram model captures a wider range of relations. Second, it could be that people adopt different strategies for assessing different relations (var-iation in inter-reliability may also suggest this at the level of in-dividuals), and that the parallelogram model corresponds to just one such strategy. We consider this an interesting opportunity for further research, and return to this point in the General Discussion.
Rather than exhaustively exploring different word embeddings or geometric relations, in the remainder of the paper we take a different
Fig. 7. Visualizations of difference vectors for 20 relational subtypes using 2D projections of word2vec word vectors obtained separately for each relation using principal component analysis. Subtypes where vectors are parallel are likely to be well-captured by the parallelogram model.
J.C. Peterson, et al. Cognition 205 (2020) 104440
8
approach: consider properties of analogy that apply to all metrics, re-gardless of the space in which they are assessed. Following Tversky (1977), we can ask whether any distance metric in any vector space model of relations can capture the wide range of phenomena involving human representations of relational similarity. The results would apply not only to any potential word embedding that improves over word2vec and GloVe, but also to any possible distance function that we could define in such a space, even if we use a different distance function for each semantic relation that corresponds to its most ap-propriate geometric relation.
4. Violations of metric axioms
Vector space representations can be expressive and powerful (Shepard, 1980), but are by no means the only way to capture semantic information. Nevertheless, they form the basis of numerous cognitive models, such as generalization (Shepard, 1987), and categorization (Kruschke, 1992; Nosofsky, 2011). Importantly, the use of vector spaces as a representational formalism in psychology has been criticized on the grounds that it is constrained by both its axiomatic commitments (Tversky, 1977) and geometry (Tversky & Hutchinson, 1986). These constraints can lead to fundamental challenges in modeling human behavior that do not arise for competing non-spatial methods, although it is worth noting that potential solutions have been proposed (see Krumhansl (1978) for an example that integrates information about spatial density).
Distance metrics in vector spaces must obey certain axioms or geometric constraints, such as symmetry (the distance from x to y is the same as the distance from y to x) and the triangle inequality (if the distance between x and y is small and the distance between y and z is small, then the distance between x and z cannot be very large). Cosine similarity, used to measure similarity between word2vec representa-tions, also obeys symmetry and an analogue of the triangle inequality (Griffiths et al., 2007). However, psychological representations of si-milarity do not always obey these constraints (Tversky, 1977). A fa-mous example of this is that people judge North Korea to be more si-milar to China than the other way around, a violation of symmetry. Griffiths et al. (2007) examined the word representations derived by Latent Semantic Analysis (Landauer & Dumais, 1997), another well- known vector space model, and found that these representations are unable to account for violations of symmetry and the triangle inequality in human word association data.
All prior work exploring the limitations of spatial representations has focused on item similarity. If item similarity cannot be fully
modeled by spatial representations, than why should we think that relational similarity can? This question may not be as straightforward to answer as it seems, as relational similarity may depend less than item similarity on which domain is taken to be the “referent” or “prototype” for the comparison. For this reason, it is important that we take our cues from human behavior before extrapolating findings on item similarity to relational similarity. In this section, we show that human judgments of relational similarity between word pairs also do not satisfy the geometric constraints of symmetry and the triangle inequality. Vector space models such as word2vec and GloVe cannot account for these violations.
4.1. Experiment 3: symmetry
In this experiment, we examined whether there are any pairs of word pairs for which participants' judgments of relational similarity change when the presentation order is reversed. We might expect such asymmetry to occur when a word pair has multiple relations and shares ones of its less salient relations with another word pair. For example, when presented with angry: smile – exhausted: run, one might think, “an angry person doesn't want to smile” and “an exhausted person doesn't want to run,” but when presented with exhausted: run – angry: smile, one might think,“running makes a person exhausted, but smiling doesn't make a person angry.” Thus, participants might give high relational similarity ratings in the first presentation order and low ratings in the second presentation order.
4.1.1. Participants We recruited 1102 participants from Amazon Mechanical Turk, who
gave informed consent and were paid $1.00 for the 10-min study. We excluded 99 participants from the data analysis because they failed two or more of the attention checks (see below).
4.1.2. Stimuli We randomly selected 220 within-subtype, 220 between-subtype,
and 60 between-type comparisons from all possible comparisons formed using the entire SemEval-2012 Task 2 dataset. We created two versions of each comparison, in which the order of the word pairs were switched.
4.1.3. Procedure Participants were given instructions about relational similarity and
the two examples used in Experiment 2 illustrating similar and dis-similar relationships. They saw one word pair in each comparison first
Fig. 8. Pearson's r between human relational similarity ratings and model predictions on different relation types for (a) word2vec and (b) GloVe. The name and examples of each numbered relation type are shown in Table 1. Correlations that are statistically significant at the 0.05 level are indicated by * and those that are significant at the 0.01 level are indicated by **. Split-half reliability for human ratings from each relation type are indicated by horizontal black bars.
J.C. Peterson, et al. Cognition 205 (2020) 104440
9

and were asked to think of the relationship between the words. Then after a 600 ms delay, the other word pair was shown and participants were asked to rate the similarity of the relationships on a 7-point scale. Participants rated 50 comparisons, including 22 within-subtype, 22 between-subtype, and 6 between-type comparisons. Each participant viewed each comparison in only one of its presentation orders. After every 10 trials, there was an attention check question (five in total) that asked participants to indicate whether two words are the same or dif-ferent.
4.1.4. Results and discussion We obtained about 50 ratings for each comparison in each pre-
sentation order. We conducted a t-test for each comparison to see if the two presentation orders resulted in significantly different relational similarity ratings. 75 of these t-tests were statistically significant at the 0.05 level (the corresponding stimuli and results appear in the Table A1). The number of t-tests that we would expect to be significant at the α=0.05 level if presentation order did not matter for any of the com-parisons is 25. Assuming that the t-tests are independent, a binomial test reveals that this deviation is statistically significant, p < .001.
Examining the comparisons for which different presentation orders resulted in significantly different relational similarity ratings confirms our guess as to when people's judgments of relational similarity might not obey symmetry. The previously mentioned example of angry: smile and exhausted: run indeed elicited higher ratings in the direction shown here (4.76 mean rating) than in the opposite direction (2.36 mean rating). As another example, people rated hairdresser: comb – pitcher: baseball as more relationally similar (6.10 mean rating) than pitcher: baseball – hairdresser: comb (4.84 mean rating). In the first presentation order, participants might be thinking that “a hairdresser handles a comb” and “a pitcher handles a baseball,” whereas in the second pre-sentation order, they might be thinking “a pitcher plays a specific role in baseball,” which doesn't fit with hairdresser: comb. Yet another ex-ample is narrative: epilogue – animal: pig (2.80 mean rating) vs. animal: pig – narrative: epilogue (3.84 mean rating). An epilogue follows a nar-rative, but a pig doesn't follow an animal. A pig is a kind of animal, and an epilogue might be a kind of narrative. These results suggest that participants might employ a multi-sense representation of word pairs that transcends the single-point representations in vector space models, which might leave out some of or average over the different relations that a word pair could represent.
4.2. Experiment 4: triangle inequality
For this experiment, we created triads of word pairs for which we expected people's relational similarity judgments to violate the triangle inequality, such as nurse: patient, mother: baby, and frog: tadpole. This triad violates the triangle inequality because nurse: patient:: mother: baby is a good analogy (relationally similar), and so is mother: baby:: frog: tadpole, but nurse: patient:: frog: tadpole is not. In this example, the middle pair has multiple relations and shares one of them with the first pair and a different one with the last pair. We presented the two word pairs in each analogy together and asked participants to rate the quality of the analogy rather than relational similarity, because we wanted to encourage participants to consider the two relations together rather than using one relation as a reference.
4.2.1. Participants We recruited 71 participants from Amazon Mechanical Turk, who
gave informed consent and were paid $0.50 for the 5-min study. This group of participants did not overlap with the participants in Experiment 2. We excluded 11 participants from the data analysis be-cause they failed one of the attention checks (see below).
4.2.2. Stimuli We created twelve triads of word pairs for which analogy quality
judgments are likely to violate the triangle inequality. For every triad, the analogy formed between the first and third word pairs was expected to be rated low and the other two analogies were expected to be rated highly.
4.2.3. Procedure Participants were given instructions about verbal analogies and the
two examples used in Experiments 2 and 3 as examples of good and bad analogies, respectively. They were then asked to rate the quality of each analogy on a scale from 1 (very bad) to 7 (very good). For each of the twelve triads, each participant viewed one of the three analogies. Each participant received four analogies formed between the first and second word pairs of various triads (analogy type 1–2), four formed between the second and third word pairs (type 2–3), and four formed between the first and third word pairs (type 1–3). Because two thirds of these analogies are expected to be rated highly, participants also viewed four “filler” analogies expected to be given low ratings. Finally, there were two attention check questions that asked to participants to simply choose 1 (or 7) for a bad (or good) analogy.
4.2.4. Results and discussion For each triad, we want to test for violations of triangle inequality
using the average similarity ratings (provided in Table B1) for each word pair. To our knowledge, no quantitative method for such a test has been proposed. We can derive such a test, which we call the “product test”, by first considering the triangle inequality, which states that the distance d(x, z) between points (e.g., objects or relations) x and z must be greater than or equal to the sum of the distances between d(x, y) and d(y, z):
+d x z d x y d y z( , ) ( , ) ( , ). (4)
In order to relate this equation to our similarity judgments, we can make use of Shepard's (1987) law that relates distance in psychological space to similarity:
=s e d (5)
where we assume that similarity scores are normalized to be between 0 and 1.2 The triangle inequality can therefore be restated in terms of similarity as opposed to distance as
s x z s x y s y z( , ) ( , ) ( , ). (6)
Because this must hold for all “sides” of the triangle, a violation of the triangle inequality occurs whenever the lowest similarity is less than the product of the two higher ones, or when the following state-ment is true:
>s x z s x y s y zmin s x z s x y s y z
min s x z s x y s y z( , ) ( , ) ( , ){ ( , ), ( , ), ( , )}
{ ( , ), ( , ), ( , )}.(7)
We can rearrange this inequality into a form that allows us to compare a single statistic against a constant:
>s x z s x y s y zmin s x z s x y s y z
( , ) ( , ) ( , ){ ( , ), ( , ), ( , )}
1.2 (8)
How much the test statistic on the left hand side is greater than 1 indicates the relative strength of the violation.3
The product test provides only a point estimate to indicate violation of the triangle inequality. In order to perform statistical inference, we computed the product test for 10,000 bootstrap samples of the data (i.e., sampling participants with replacement) for each of the twelve
2 Since our similarity scores were on a scale from 1 to 7, we performed this normalization by subtracting 1 from each score and then dividing by 6. Simply dividing the scores by 7 produced an equivalent pattern of results.
3 We note that this criterion is invariant to scaling constants μ such that s = e−d/μ. Such constants have the effect of raising the test statistic to the power of 1/μ, which does not change whether it is greater than or less than 1.
J.C. Peterson, et al. Cognition 205 (2020) 104440
10

triads. The results are shown in Fig. 9. The mean score for eleven out of twelve triads was positive, indicating potential violations in almost all cases. To determine statistical significance, we computed an empirical one-tailed 95% confidence interval (open in the direction of larger values) for each mean and examined whether the threshold of 1 fell outside this interval. This was the case in 9 out of 12 cases, with the
exceptions being veil:face, password:access, key:safe, and pride:lion, brain:neuron, computer:chip, with the weakest results for wedding:bride, aquarium:fish, carton:milk.
In both Experiments 3 and 4, the order of the word pairs or structure of the triad of pairs induced a contextual effect wherein the “relational sense” that a word pair represented was altered. The parallelogram
Fig. 9. Distributions of product test outcomes for 10,000 bootstrap samples. Vertical black lines indicate the point beyond which tests indicate violation of the triangle inequality. Means are given in the top right corner of each plot. For 9 of the 12 word-pair triads the threshold of 1 fell outside an empirical one-tailed 95% confidence interval.
J.C. Peterson, et al. Cognition 205 (2020) 104440
11
model represents the relation between a pair of words by the difference vector between the single-point representations of the individual words in the underlying vector space. The relation that a word pair represents is thus a single, fixed point, which cannot account prima facie for the multiple relational senses that a word pair might take on, as in Experiments 3 and 4. However, these results do not rule out an alter-native model that computes the relation a word pair represents by taking context into account but that still uses single-point representa-tions of words, or perhaps even a parallelogram model that operates on context-specific word representations. We discuss some of these possi-bilities in more detail below. Nevertheless, these results do point out one of the principal disadvantages of current models that use single- point, context-independent representations of words and word pairs.
5. General discussion
Our results provide a clearer picture of the utility of vector-space models of analogy: capturing human relational similarity poses some significant challenges for these models. Experiment 1 showed that the parallelogram model can predict analogy completions, but is out-performed by a much simpler rule based on item similarity. This po-tentially challenges the parallelogram model, but also highlights the difficulty in designing experiments that don't bias participants toward one strategy over the other, since the simple rule we used corresponds to an easier judgments that bears less resemblance to analogy as we commonly think of it. Experiment 2 was meant to overcome this pro-blem to some extent by using a direct measure of human relational similarity. With this constraint in place, we find that the parallelogram model indeed makes very good predictions for some semantic relations, although it performs poorly for others. Experiments 3 and 4 showed that the relation inferred between a pair of words by participants is context-sensitive and multi-sense, posing an insurmountable modeling limitation for context-invariant, non-adaptive word representations. In the remainder of this paper we discuss the implications of these results – the need to consider metric learning in addition to representation learning, possible extensions to larger relational systems, and avenues for exploring non-spatial alternatives.
5.1. Considering a broader set of geometric relations
In Experiment 2, we found that no single metric (i.e., relation comparison strategy) could capture all semantic relations in our da-taset. This raises the possibility that, rather than the parallelogram model being the monolothic solution to the problem of analogy, there are a number of different geometric relations that can be used to cap-ture different semantic relations.
We tested only a small set of geometric relations here, but myriad more are possible, even when restricting to very simple types. The search space is potentially very large, although some may seem gen-erally more sensible starting points than others. For example, consider the word pairs represented as vectors in Fig. 7. As one would expect, the relation SIMILAR seems to be best represented by the vectors for words having a short difference vector (still a relational feature) rather than the direction of the difference vector, and it would be hard to imagine an alternative. However, not all metrics will necessarily be easy to in-tuit. One relatively easy family of metrics to search are the Minkowski distance metrics, some of which have been shown to correspond to important basic kinds of spatial psychological representations (Nosofsky, 1987; Shepard, 1987). It may also be fruitful, and potentially more efficient, to learn a metric directly from the data, for which an interpretation can be proposed post-hoc.
Vector space models of analogy embody a hope that it is possible to define a scheme for learning a representation such that semantic rela-tions can be read off from the space using a single, standardized geo-metric relation. Our results suggest that instead, to at least some extent, each geometric relation must also be learned along with the
representation. When we encounter a new semantic relation, we need to consider which of a set of hypothetical geometric relations best captures that semantic relation. This departs to some degree with the original appeal of the approach, but not from its competitive perfor-mance. Future work exploring this idea could investigate the results of some form of categorical search among common metrics, simple transformations such as an attentional scaling of the features, or even more complex functions provided we have enough data for such a task. The search over geometric relations can also be thought of as additional representation learning on top of the original feature representation, which leaves open the question of whether item and relational simi-larity should be learned jointly or separately, and to what degree.
5.2. Extending to more complex analogies
The seminal Structure-Mapping theory of analogy poses the pro-blem as one of mapping a set of relations from one arbitrary (base) set of objects to another (target) set of objects (Gentner, 1983). The par-ticular set of relations to be mapped are those with the highest “sys-tematicity”, or higher-order relations. As a high-level theory, this fra-mework is general enough to encompass the full scope of human analogy-making, however, in representing relations as syntactic rules, the optimal mapping solutions are are hard to compute for large sys-tems of objects and relations. Further, this framework decouples the problem of representing relations from the problem of matching them, which requires another intractable search problem to fully implement and test in externally valid contexts.
The simple model applied here allows us to provide a practical so-lution to a historically very hard problem, deriving relations from the feature space itself and coupling this process to the matching problem. However, despite this apparent ease, our results are still limited to two- object systems commonly used in pedagogical settings, whereas hu-mans can make much more complex analogies (e.g., comparing the solar system to an atom). However, extensions are possible for mapping arbitrary structure if we allow systems of relations between objects to be represented as arbitrary geometric forms in the embedding space. This is one reason why having an effective and efficient model of re-lational similarity is so crucial, as multi-item analogies are usually drastically harder to handle computationally. For example, multi-point statistics are second order descriptions, like distance metrics, that are very easy to compute in geometric spaces, which may make for a fast initial search for candidate systems of objects to perform a mapping.
Ultimately, understanding human analogy is likely to require cap-turing efficient algorithms for aligning complex, abstract systems of concepts, a task that may be inherently easier with spatial representa-tions that can be learned from large sources of data.
5.3. Beyond spatial relations
Potentially the greatest challenges for vector space models of ana-logy are the constraints posed by the geometric axioms. In our experi-ments, we found that human behavior gives rise to considerable vio-lations of two of these axioms. In Experiment 3, we showed that relational similarity can be asymmetric, and in Experiment 4, we found substantial violations of the triangle inequality. These discrepancies may be difficult to overcome through alternative word embedding methods alone.
In light of this, it would be interesting to follow the history of models of item similarity in considering the use of featural re-presentations (Tversky, 1977), an alternative that is known handle asymmetries well. However, it is notable that these feature-based models make use of the similarity calculation to handle asymmetries as opposed to the structure of the feature representations alone, which echoes our suggestion above that spatial representations could be combined with non-metric similarity measures. In fact, at least one method has already been proposed for measuring cognitive similarity in
J.C. Peterson, et al. Cognition 205 (2020) 104440
12

vector spaces that are no longer subject to the constraints imposed by the metric axioms (Krumhansl, 1978). More recent work has also pro-posed reformulating the problem as probabilistic inference (Griffiths et al., 2007).
In considering these alternatives, it may be beneficial to anticipate ways to better handle different word “senses”, rather than word tokens, as well as varying senses or salient aspects of word-pair relations. Methods for automatically identifying senses in vector space embed-dings are currently a topic of research in machine learning (Arora et al., 2016). Feature-based methods draw some of their success from mod-eling feature salience directly, often as a set of free parameters. How-ever, in the spirit of the current work, it would be interesting to explore this approach using data-driven methods that model salience as a product of context.
6. Conclusion
Current word embedding methods might seem limited a priori in their capacity to model cognition, since they capture distributional semantics, a mere correlate of actual semantic structure, yet they make good predictions on account of being able to tractably leverage massive language corpora. While past work had already established that these spaces can be applied to more complex and interesting language tasks than word similarity (e.g., analogy completions), our work explores a broader space of semantically rich analogies and their psychological characterization beyond completion and prototypicality. We find that these simple representations are rich enough to generate good predic-tions of human analogy completion and relational similarity judgments,
but that they still have systematic limitations as an account of how people form analogies. Specifically, the parallelogram model does not perform as well as simple similarity in predicting analogy completions, is limited in the range of semantic relations that it can capture, and faces fundamental limits in reproducing phenomena of human analogy judgments such as asymmetry and the triangle inequality.
We view these results not as an argument against exploring vector- space representations and geometric approaches to analogy, but as a crucial source of empirical and theoretical constraints that can guide this endeavor. By generating substantial datasets against which models can be evaluated and highlighting phenomena that pose challenges to these models, we hope to spur on further research that explores more sophisticated strategies for solving these problems. For example, Nematzadeh et al. (2017) offer one potential method for producing human-like asymmetries from vector-space models. Other methods that compare vector aggregates (e.g., Kintsch, 2000; Kintsch & Bowles, 2002) may also have potential, but are yet to be evaluated. We hope that this work will inspire further cross-talk between classic cognitive theories and tractable, data-driven solutions from machine learning.
CRediT authorship contribution statement
Joshua C. Peterson: Conceptualization, Methodology, Formal analysis, Software, Writing - original draft. Dawn Chen: Conceptualization, Methodology, Formal analysis, Software, Writing - original draft. Thomas L. Griffiths: Supervision, Conceptualization, Methodology, Writing - review & editing.
Appendix A. Violations of symmetry from Experiment 3
Table A1 Comparisons with significantly different forward and backward relational similarity ratings from Experiment 3.
Comparison Mean Rating
Forward Backward t statistic p-value
angry: smile – exhausted: run 4.76 2.36 5.76 9.49e-8 sew: needle – store: products 4.00 2.30 4.95 3.04e-6 password: access – burka: body 2.00 3.34 −4.07 9.43e-5 wrinkle: age – cross: faith 4.16 5.60 −3.86 2.02e-4 hairdresser: comb – pitcher: baseball 6.10 4.84 3.67 3.99e-4 mother: children – words: letters 5.25 3.82 3.53 6.33e-4 dim: light – darken: color 4.10 5.38 −3.48 7.61e-4 store: shopping – bedtime: sleeping 4.36 5.68 −3.47 7.74e-4 rise: tide – flood: water 4.86 3.65 3.34 1.18e-3 sun: shine – shovel: dig 5.54 4.34 3.29 1.39e-3 punch: pain – food: nourishment 5.82 4.82 3.26 1.54e-3 cooking: peeling – knitting: purling 5.29 4.24 3.16 2.08e-3 water: wet – dusty: dusted 2.57 3.88 −3.11 2.43e-3 fish: fin – album: songs 5.82 4.84 3.08 2.64e-3 punch: pain – ice: cold 5.88 4.90 3.07 2.77e-3 emotional: turmoil – psychotic: insanity 5.14 4.10 2.99 3.53e-3 shooter: gun – step: journey 3.16 2.14 2.98 3.62e-3 stare: intermittently – full: empty 2.92 2.02 2.95 4.02e-3 garment: skirt – artwork: sculpture 6.54 6.00 2.94 4.04e-3 tree: branch – house: roof 5.94 5.08 2.90 4.61e-3 crossbones: poison – outline: paper 3.10 2.14 2.88 4.91e-3 knowledge: ignorance – money: poverty 5.76 6.47 −2.83 5.67e-3 deafness: hearing – gap: teeth 2.54 3.62 −2.82 5.74e-3 winter: sledding – refinery: oil 3.36 2.42 2.79 6.30e-3 ladder: stairs – goal: score 4.48 3.40 2.76 6.85e-3 husband: bachelorhood – cooking: chopping 2.61 1.73 2.75 7.05e-3 quarter: pennies – poem: verses 4.80 3.88 2.72 7.62e-3 coldness: shiver – battery: flashlight 2.00 2.88 −2.71 8.05e-3 wine: alcohol – atmosphere: gas 4.46 5.42 −2.70 8.26e-3 shirt: button – garage: wrench 3.75 4.76 −2.69 8.30e-3 stab: wound – pacifist: peace 4.18 3.18 2.68 8.60e-3 happy: contentment – angry: belligerence 5.31 6.10 −2.68 8.67e-3 repair: broken – divide: parts 3.20 2.32 2.67 8.97e-3 sunscreen: burns – water: thirst 5.66 4.71 2.61 1.04e-2
(continued on next page)
J.C. Peterson, et al. Cognition 205 (2020) 104440
13

Table A1 (continued)
Comparison Mean Rating
Forward Backward t statistic p-value
withdrawal: timid – eat: satisfaction 3.36 2.42 2.61 1.05e-2 narrative: epilogue – animal: pig 2.80 3.84 −2.57 1.18e-2 pay: debtor – preach: disciple 4.92 3.92 2.55 1.24e-2 quarter: pennies – words: letters 5.50 4.64 2.54 1.25e-2 automobile: transportation – church: worship 5.54 4.56 2.53 1.29e-2 bird: lips – wall: bricks 2.18 1.44 2.52 1.34e-2 house: room – restaurant: chef 4.72 3.70 2.52 1.35e-2 bird: wings – pack: wolf 2.94 2.08 2.48 1.48e-2 abandon: embrace – attract: repel 6.31 5.54 2.48 1.48e-2 award: winner – pay: debtor 3.88 4.90 −2.48 1.50e-2 house: home – hunger: starvation 4.92 3.86 2.47 1.51e-2 kitchen: oven – laboratory: reagents 5.14 4.29 2.46 1.55e-2 cold: warm – infertility: reproduction 5.76 4.80 2.45 1.61e-2 angry: enraged – hot: burning 6.12 5.44 2.44 1.63e-2 tip: waiter – inexorable: halted 1.84 2.54 −2.44 1.64e-2 sadness: cry – food: nourishment 4.52 3.62 2.43 1.69e-2 glue: adhesion – shoot: kill 4.60 5.40 −2.41 1.78e-2 workout: sweat – showering: soaping 4.52 5.35 −2.36 2.00e-2 clothing: shirt – sun: shine 2.14 3.06 −2.36 2.00e-2 diamond: shiny – mogul: wealth 4.74 3.84 2.34 2.13e-2 winter: snow – winter: cold 5.42 4.65 2.31 2.30e-2 explosion: damage – drink: hydrate 5.42 4.68 2.27 2.56e-2 curtain: window – anthropology: people 3.16 2.38 2.24 2.72e-2 check: employee – lecture: child 3.86 3.02 2.22 2.88e-2 instruct: subordinate – inspire: follower 5.96 5.24 2.21 2.91e-2 bigot: hateful – pillow: soft 5.08 5.84 −2.21 2.96e-2 furniture: chair – seat: chair 4.88 4.08 2.20 2.99e-2 hug: comfort – medicine: recovery 6.04 5.54 2.18 3.13e-2 donation: charity – certificate: teacher 4.18 3.29 2.16 3.31e-2 book: chapters – advertise: promote 2.84 2.08 2.16 3.35e-2 hands: gloves – war: weapon 3.26 4.08 −2.15 3.38e-2 therapy: talking – spring: breeze 3.38 4.22 −2.15 3.42e-2 circus: clown – house: roof 4.82 3.98 2.13 3.55e-2 teach: ignorant – groom: unkempt 5.82 5.08 2.12 3.63e-2 pimple: skin – leukemia: blood 5.06 5.72 −2.11 3.71e-2 church: pew – edge: cliff 3.59 2.82 2.09 3.87e-2 fire: burn – baby: cry 5.18 5.86 −2.05 4.28e-2 ear: earplug – shirt: button 4.50 3.74 2.05 4.28e-2 adult: childhood – miscarriage: fetus 2.63 1.94 2.04 4.43e-2 introduction: speech – step: journey 5.84 5.24 2.03 4.50e-2 mathematics: numbers – anatomy: body 6.30 5.84 1.99 4.96e-2
Appendix B. Stimuli and results for Experiment 4
Table B1 Average similarity ratings for each word pair in each triad from Experiment 4 (violations of the triangle inequality in judgments of analogy quality).
Triad (1,2,3) Mean Rating for Each Analogy Type
1–2 2–3 1–3
hat: head, mask: face, disguise: identity 6.65 (.17) 5.65 (.29) 3.20 (.37) foot: shoe, wrist: bracelet, wall: painting 6.20 (.23) 5.75 (.20) 3.55 (.42) dog: mailman, cat: mouse, horse: hay 5.50 (.47) 3.95 (.39) 2.30 (.36) nurse: patient, mother: baby, frog: tadpole 5.55 (.34) 6.35 (.21) 2.45 (.39) cocoon: butterfly, egg: chicken, wine: vineyard 5.95 (.30) 4.90 (.52) 3.05 (.41) person: clothes, bird: feathers, cat: whiskers 6.30 (.22) 5.35 (.31) 3.35 (.41) student: backpack, snail: shell, rabbit: burrow 5.15 (.36) 4.95 (.41) 2.75 (.40) wedding: bride, aquarium: fish, carton: milk 3.75 (.38) 5.40 (.36) 3.70 (.38) flock: bird, hive: bee, hangar: airplane 6.35 (.18) 5.75 (.38) 3.35 (.38) lawyer: books, chemist: beakers, librarian: books 5.80 (.31) 5.80 (.34) 2.65 (.39) veil: face, password: access, key: safe 3.90 (.41) 5.40 (.41) 2.50 (.39) pride: lion, brain: neuron, computer: chip 4.20 (.41) 5.95 (.28) 3.00 (.45)
Note: Standard error of the mean is reported in parentheses.
References
Arora, S., Li, Y., Liang, Y., Ma, T., & Risteski, A. (2016). Linear algebraic structure of word senses, with applications to polysemy. arXiv preprint arXiv:1601.03764.
Bejar, I. I., Chaffin, R., & Embretson, S. (1991). A taxonomy of semantic relations. Cognitive and psychometric analysis of analogical problem solving (pp. 55–91). New York, NY: Springer US.
Chen, D., Peterson, J. C., & Griffiths, T. L. (2017). Evaluating vector-space models of analogy. arXiv preprint arXiv:1705.04416.
J.C. Peterson, et al. Cognition 205 (2020) 104440
14

Deerwester, S. (1988). Improving information retrieval with latent semantic indexing. Proceedings of the 51st annual meeting of the american society for information science (pp. 36–40). .
Doumas, L. A., Hummel, J. E., & Sandhofer, C. M. (2008). A theory of the discovery and predication of relational concepts. Psychological Review, 115(1), 1–43.
Ehresman, D., & Wessel, D. L. (1978). Perception of timbral analogies. Paris: Centre Georges Pompidou.
Firth, J. R. (1968). Selected papers of jr firth, 1952–59. Indiana University Press. Gentner, D. (1983). Structure-mapping: A theoretical framework for analogy. Cognitive
Science, 7(2), 155–170. Gentner, D. (1988). Metaphor as structure mapping: The relational shift. Child
Development, 59(1), 47–59. Gentner, D., & Forbus, K. D. (2011). Computational models of analogy. Wiley
Interdisciplinary Reviews: Cognitive Science, 2(3), 266–276. Gleitman, L. R. (2002). Verbs of a feather flock together ii. Amsterdam Studies in the Theory
and History of Linguistic Science Series, 4, 209–232. Green, A. E., Kraemer, D. J., Fugelsang, J. A., Gray, J. R., & Dunbar, K. N. (2010).
Connecting long distance: Semantic distance in analogical reasoning modulates frontopolar cortex activity. Cerebral Cortex, 20(1), 70–76.
Griffiths, T. L., Steyvers, M., & Tenenbaum, J. B. (2007). Topics in semantic representa-tion. Psychological Review, 114(2), 211–244.
Harris, Z. S. (1954). Distributional structure. Word, 10(2–3), 146–162. Jurgens, D. A., Turney, P. D., Mohammad, S. M., & Holyoak, K. J. (2012). Semeval-2012
task 2: Measuring degrees of relational similarity. In Proceedings of the First Joint Conference on Lexical and Computational Semantics-Volume 1: Proceedings of the Main Conference and the Shared Task, and Volume 2: Proceedings of the Sixth International Workshop on Semantic Evaluation (pp. 356–364).
Kintsch, W. (2000). Metaphor comprehension: A computational theory. Psychonomic Bulletin & Review, 7(2), 257–266.
Kintsch, W., & Bowles, A. R. (2002). Metaphor comprehension: What makes a metaphor difficult to understand? Metaphor and Symbol, 17(4), 249–262.
Kmiecik, M. J., & Morrison, R. G. (2013). Semantic distance modulates the n400 event- related potential in verbal analogical reasoning. In M. Knauff, M. Pauen, N. Sebanz, & I. Wachsmut (Eds.). Proceedings of the 35th annual conference of the cognitive science society (pp. 799–804). Austin, TX: Cognitive Science Society.
Krumhansl, C. (1978). Concerning the applicability of geometric models to similarity data: The interrelationship between similarity and spatial density. Psychological Review, 85, 450–463.
Kruschke, J. K. (1992). ALCOVE: An exemplar-based connectionist model of category learning. Psychological Review, 99(1), 22–44.
Lake, B. M., Zaremba, W., Fergus, R., & Gureckis, T. M. (2015). Deep neural networks predict category typicality ratings for images. (In Proceedings of the 37th Annual Cognitive Science Society).
Landauer, T. K., & Dumais, S. T. (1997). A solution to Plato’s problem: The latent se-mantic analysis theory of acquisition, induction, and representation of knowledge. Psychological Review, 104(2), 211–240.
Le, Q., & Mikolov, T. (2014). Distributed representations of sentences and documents. Proceedings of the 31st international conference on machine learning (ICML-14) (pp. 1188–1196). .
Lu, H., Chen, D., & Holyoak, K. J. (2012). Bayesian analogy with relational transforma-tions. Psychological Review, 119(3), 617–648.
Lu, H., Wu, Y. N., & Holyoak, K. J. (2019). Emergence of analogy from relation learning.
Proceedings of the National Academy of Sciences, 116(10), 4176–4181. Mikolov, T., Sutskever, I., Chen, K., Corrado, G. S., & Dean, J. (2013). Distributed re-
presentations of words and phrases and their compositionality. Advances in neural information processing systems 26 (pp. 3111–3119). .
Nelson, D. L., McEvoy, C. L., & Schreiber, T. A. (2004). The university of south Florida free association, rhyme, and word fragment norms. Behavior Research Methods, Instruments, & Computers, 36(3), 402–407.
Nematzadeh, A., Meylan, S. C., & Griffiths, T. L. (2017). Evaluating vector-space models of word representation, or, the unreasonable effectiveness of counting words near other words. Proceedings of the 39th annual meeting of the cognitive science society (pp. 859–864). .
Nickel, M., & Kiela, D. (2017). Poincaré embeddings for learning hierarchical re-presentations. arXiv preprint arXiv:1705.08039.
Nosofsky, R. M. (1987). Attention and learning processes in the identification and cate-gorization of integral stimuli. Journal of Experimental Psychology: Learning, Memory, and Cognition, 13, 87–108.
Nosofsky, R. M. (2011). The generalized context model: An exemplar model of classifi-cation. In E. M. Pothos, & A. J. Wills (Eds.). Formal approaches in categorization (p. 18–39). Cambridge University Press.
Pennington, J., Socher, R., & Manning, C. D. (2014). GloVe: Global vectors for word representation. Empirical methods on natural language processing. vol. 14. Empirical methods on natural language processing (pp. 1532–1543).
Peterson, J., Abbott, J., & Griffiths, T. (2016). Adapting deep network features to capture psychological representations. In D. Grodner, D. Mirman, A. Papafragou, & J. Trueswell (Eds.). Proceedings of the 38th annual conference of the cognitive science so-ciety (pp. 2363–2368). Austin, TX: Cognitive Science Society.
Radford, A., Metz, L., & Chintala, S. (2015). Unsupervised representation learning with deep convolutional generative adversarial networks. arXiv preprint arXiv:1511.06434.
Reed, S. E., Zhang, Y., Zhang, Y., & Lee, H. (2015). Deep visual analogy-making. In Advances in neural information processing systems (pp. 1252–1260).
Richland, L. E., & Simms, N. (2015). Analogy, higher order thinking, and education. Wiley Interdisciplinary Reviews: Cognitive Science, 6(2), 177–192.
Rumelhart, D. E., & Abrahamson, A. A. (1973). A model for analogical reasoning. Cognitive Psychology, 5(1), 1–28.
Sadler, D. D., & Shoben, E. J. (1993). Context effects on semantic domains as seen in analogy solution. Journal of Experimental Psychology: Learning, Memory, and Cognition, 19(1), 128–147.
Shepard, R. N. (1980). Multidimensional scaling, tree-fitting, and clustering. Science, 210(4468), 390–398.
Shepard, R. N. (1987). Toward a universal law of generalization for psychological science. Science, 237(4820), 1317–1323.
Sternberg, R. J., & Nigro, G. (1980). Developmental patterns in the solution of verbal analogies. Child Development, 51(1), 27–38.
Turney, P. D. (2013). Distributional semantics beyond words: Supervised learning of analogy and paraphrase. arXiv preprint arXiv:1310.5042.
Tversky, A. (1977). Features of similarity. Psychological Review, 84(4), 327–352. Tversky, A., & Hutchinson, J. (1986). Nearest neighbor analysis of psychological spaces.
Psychological Review, 93(1), 3–22. Uyeda, K. M., & Mandler, G. (1980). Prototypicality norms for 28 semantic categories.
Behavior Research Methods & Instrumentation, 12(6), 587–595. Yarlett, D., & Ramscar, M. (2008). Language learning through similarity-based general-
ization. Unpublished PhD Thesis, Stanford University.
J.C. Peterson, et al. Cognition 205 (2020) 104440
15