APPLICATION OF SOLID PHASE MICROEXTRACTION IN GAHARU ESSENTIAL

PARALLEL POLYMER-BASED MICROEXTRACTION METHODS TO STUDY
INTERMOLECULAR ASSOCIATION AND PHYSICOCHEMICAL PROPERTIES
by
Dujuan Lu
Bachelor of Science, Nanjing University, 2006
Submitted to the Graduate Faculty of the
Kenneth P. Dietrich School of Arts and Sciences in partial fulfillment
of the requirements for the degree of
Doctor of Philosophy
University of Pittsburgh
2014

ii
UNIVERSITY OF PITTSBURGH
THE KENNETH P. DIETRICH SCHOOL OF ARTS AND SCIENCES
This dissertation was presented
by
Dujuan Lu
It was defended on
July 8th
, 2014
and approved by
Alexander Star, Professor, Department of Chemistry
Adrian C. Michael, Professor, Department of Chemistry
Xiang-Qun Xie, Professor, Department of Pharmaceutical Sciences
Dissertation Advisor: Stephen G. Weber, Professor, Department of Chemistry

iii
Copyright © by Dujuan Lu
2014

iv
Lipophilicity and acid dissociation constants are important physicochemical properties
that in part determine the suitability of an organic molecule as a pharmacological agent.
Intermolecular associations are omnipresent in chemical and biochemical systems and
particularly important in the efficacy of an excipient for a poorly soluble drug. Current standard
methods to determine lipophilicity require large amounts of pure sample and have problems due
to emulsion formation. This dissertation describes a method based on distribution of the solutes
between a polymer phase and an aqueous phase in a 96-well format, in the presence and absence
of a receptor (e.g., candidate excipient) in one of the two phases. This parallel approach uses
minimal amounts of organic solvent and only requires small amounts of sample. This approach
has been used to determine polymer-water distribution coefficients of solutes. In addition, by
measuring polymer-water distribution coefficients at a variety of experimental conditions, such
as pH and receptor concentration, acid dissociation constants and solute-receptor binding
constants have been successfully determined for several chemical systems.
This method has been applied to measure binding constants of econazole with six
cyclodextrins in aqueous solutions. The acid dissociation constant of econazole was determined
by measuring econazole-cyclodextrin binding constants at various pH values. Distribution
coefficients and acid dissociation constants of twenty-four novel drug-like compounds have also
been determined by this parallel approach and compared to the values calculated by
PARALLEL POLYMER-BASED MICROEXTRACTION METHODS TO STUDY
INTERMOLECULAR ASSOCIATION AND PHYSICOCHEMICAL PROPERTIES
Dujuan Lu, PhD
University of Pittsburgh, 2014
v
commercially available software. The software packages did not adequately predict experimental
results, especially for ionizable compounds. This emphasizes the need for laboratory separations-
based measurements of distribution coefficients. The polymeric phase was poly(vinyl chloride)
(PVC) plasticized by 67% (w/w) dioctyl sebacate (DOS). Intermolecular association has also
been studied in Teflon AF 2400, a fluorous polymer phase, with and without fluorous hydrogen
bond donor Krytox 157 FSH in the 96-well approach. In addition, a novel fluorous receptor-
doped fiber solid phase microextraction (SPME) was developed to selectively detect quinoline in
aqueous solutions.
vi
TABLE OF CONTENTS
PREFACE ................................................................................................................................. XIII
1.0 INTRODUCTION ........................................................................................................ 1
1.1 SOLID PHASE MICROEXTRACTION .......................................................... 1
1.1.1 Introduction ..................................................................................................... 1
1.1.2 SPME theories: from distribution to kinetics ............................................... 3
1.1.3 Receptor-doped polymer coating materials as SPME sorbents .................. 9
1.1.4 Parallel design and automation of SPME.................................................... 11
1.2 METHODS FOR MEASUREMENT OF ACID DISSOCIATION
CONSTANT ........................................................................................................................ 13
1.3 METHODS FOR LIPOPHILICITY MEASUREMENT .............................. 15
1.4 OUTLINE ........................................................................................................... 16
2.0 DETERMINATION OF DRUG-CYCLODEXTRIN BINDING CONSTANTS
BY A HIGH-THROUGHPUT PHASE-DISTRIBUTION METHOD................................... 20
2.1 INTRODUCTION ............................................................................................. 20
2.2 EXPERIMENTAL ............................................................................................. 23
2.2.1 Materials ......................................................................................................... 23
2.2.2 Equipment ...................................................................................................... 23
2.2.3 Buffer Preparation ........................................................................................ 24

vii
2.2.4 Preparation of Plasticized PVC Films ......................................................... 24
2.2.5 High-Throughput Phase-Distribution Studies ............................................ 24
2.2.6 HPLC Method to Determine Econazole Concentration ............................ 26
2.2.7 DOS binding to CDs. ..................................................................................... 26
2.3 RESULTS AND DISCUSSION ........................................................................ 26
2.3.1 Theories to Determine the Stoichiometry n and Binding Constants K1:i (i
= 1 to n) ........................................................................................................................ 26
2.3.2 Experimental Results and Discussion .......................................................... 30
2.4 CONCLUSIONS ................................................................................................ 40
3.0 LIPOPHILICITY SCREENING OF NOVEL DRUG-LIKE COMPOUNDS AND
COMPARISION TO CLOGP ................................................................................................... 42
3.1 INTRODUCTION ............................................................................................. 42
3.2 EXPERIMENTAL ............................................................................................. 45
3.2.1 Materials ......................................................................................................... 45
3.2.2 Equipment ...................................................................................................... 49
3.2.3 Buffer Preparation ........................................................................................ 49
3.2.4 Determination of log Ppw and pKa of a Solute .............................................. 50
3.2.5 UHPLC Method to Determine Concentrations of the Thiadiazine .......... 52
3.2.6 UV Plate Reader Method to Determine Concentrations of the Thiadiazine
......................................................................................................................... 52
3.2.7 Lipophilicity Screening of the Library ........................................................ 52
3.3 RESULTS AND DISCUSSION ........................................................................ 53

viii
3.3.1 Theories to Determine Partition Coefficient and pKa of a Solute
simultaneously ............................................................................................................ 53
3.3.2 Determination of log Ppw and pKa of a solute in a 96-well format ............. 54
3.3.3 Optical Absorbance-based Lipophilicity Screening of a Library of Drug-
like Compounds .......................................................................................................... 58
3.4 CONCLUSIONS ................................................................................................ 63
4.0 FLUOROUS RECEPTOR-FACILITATED SOLID PHASE
MICROEXTRACTION ............................................................................................................. 65
4.1 INTRODUCTION ............................................................................................. 65
4.2 EXPERIMENTAL ............................................................................................. 69
4.2.1 Chemicals and Solutions ............................................................................... 69
4.2.2 96-well Vessel SPME: Preparation and Extraction.................................... 70
4.2.3 Coated Fiber SPME-GC: Fiber Preparation, Extractions, and Desorption
on GC ......................................................................................................................... 72
4.3 RESULTS AND DISCUSSION ........................................................................ 74
4.3.1 96-well Vessel SPME ..................................................................................... 74
4.3.2 Coated Fiber SPME....................................................................................... 81
4.4 CONCLUSIONS ................................................................................................ 85
BIBLIOGRAPHY ....................................................................................................................... 86

ix
LIST OF TABLES
Table 2.1 Binding constants of econazole with six CDs .............................................................. 33
Table 2.2 Binding constants of econazole with HP-β-CD at various temperatures ...................... 34
Table 3.1 Experimental Design of 24 compounds in a 96-well microplate .................................. 47
Table 3.2 PubChem SID of 24 compounds in a 96-well microplate ............................................ 48
Table 3.3 Experimental and calculated log D results for 24 compounds at pH 4.0, 7.0, 10.0...... 60
Table 3.4 Experimental and calculated log P results for 10 neutral compounds in the library. ... 62
Table 4.1 Distribution coefficients and selectivity for quinoline and phenol in pure Teflon AF
and Teflon AF with 50% Krytox .................................................................................................. 80
x
LIST OF FIGURES
Figure 1.1 Various configurations of SPME. The red color describes the extraction phase, which
can be coated on a fiber, or inside the wall and bottom of a vessel, depending on the
configuration. Reproduced with permission from reference[3]. Copyright (2011) American
Chemical Society. ........................................................................................................................... 3
Figure 1.2 Typical extraction time profile of SPME. Reprinted with permission from
reference[5]. Copyright (2007) Elsevier. ........................................................................................ 8
Figure 1.3 SPME device and operation. (1) Place rod in sample solution for a designated time.
(2) Injection 5 µL of back extraction solution into the Teflon tube. (3) Remove rod, wipe clean,
place in Teflon tube. (4) Remove after a set time (5) Collect the solution by moving the droplet
spanning the diameter as a piston and transfer the drop to an injection vial. Reprinted with
permission from reference[29]. Copyright (1997) American Chemical Society. ......................... 11
Figure 1.4 (a) 96-well multi-fiber SPME device (stainless steel fibers coated with carbon tape).
(b) robot arm inserting the multi-fiber SPME device in the 96-well plate. Reprinted with
permission from reference[32]. Copyright (2008) Elsevier. ......................................................... 13
Figure 1.5 General procedure of the parallel experimental design to study intermolecular
association and physicochemical properties ................................................................................. 19
Figure 2.1 Structure of econazole ................................................................................................. 22

xi
Figure 2.2 Schematic illustration of the preparation and use of polymer films in 96-well plates 25
Figure 2.3 Percentage of econazole extracted as a function of time in the presence of six CDs and
without CD .................................................................................................................................... 30
Figure 2.4 Effect of CD concentrations on econazole equilibrium concentration in the aqueous
phase ............................................................................................................................................. 32
Figure 2.5 Multivariate linear regression results for fitting D/D0 versus CD concentration. ....... 33
Figure 2.6 van’t Hoff plot for econazole - HP-β-CD complex ..................................................... 35
Figure 2.7 Effect of pH on the apparent binding constant of the econazole-HP-β-CD complex . 38
Figure 3.1 Chemical structure of 2H-1, 2, 6-thiadiazine, 3-methyl-5-phenyl-, 1, 1-dioxide. ....... 45
Figure 3.2 Schematic of the preparation and use of polymer films in 96-well plates for Log Dpw
determination. ............................................................................................................................... 51
Figure 3.3 Distribution coefficients of 2H-1, 2, 6-thiadiazine, 3-methyl-5-phenyl-, 1, 1-dioxide at
various pH values analyzed by UHPLC. ...................................................................................... 55
Figure 3.4 Distribution coefficients of 2H-1, 2, 6-thiadiazine, 3-methyl-5-phenyl-, 1, 1-dioxide at
various pH values determined by plate reader. ............................................................................. 56
Figure 3.5 Correlation of distribution coefficients between different runs. ................................. 58
Figure 3.6 Correlation of distribution coefficients between our experimental values and
calculated values. .......................................................................................................................... 61
Figure 4.1 Structure of Ktytox 157 FSH (1), Teflon AF 2400 (2), quinoline (3) ......................... 68
Figure 4.2 General procedure for 96-well vessel SPME. ............................................................. 70
Figure 4.3 Percentage of quinoline extracted as a function of time for Teflon AF films with
different percentages of receptor doped. ....................................................................................... 74
xii
Figure 4.4 Log Dpw of quinoline as a function of Krytox concentration in Teflon AF films for
quinoline with an initial aqueous concentration of 50 μM. .......................................................... 75
Figure 4.5 Polymer-water distribution coefficient of quinoline as a function of the initial
quinoline aqueous concentration................................................................................................... 79
Figure 4.6 Quinoline amount extracted in both liquid phase and headspace as a function of
quinoline initial concentration. ..................................................................................................... 82
Figure 4.7 Kinetic profile of extracted quinoline amount by the coated fiber (50% Krytox in
Teflon AF) SPME-GC at different headspace exposure times. .................................................... 84

xiii
PREFACE
I would like to take this opportunity to thank people who have contributed to my success
in completing this dissertation.
First and foremost, I would like to thank my research advisor, Prof. Stephen G. Weber.
He is an excellent scientist and a wonderful teacher. He taught me how to be an independent
researcher. With his solid knowledge of science, he has always provided me with useful
guidance and valuable advice.
I am also thankful to my committee members, who have also guided me over the years.
Prof. Alex Star is also the committee member of my comprehensive exam and the mentor of my
research proposal. I have learnt a lot from him through our discussions. Prof. Adrian Michael,
who is also the committee member of my comprehensive exam and research proposal, has given
me a lot of great advice especially in the analytical field. I also thank them and Prof. Xiang-Qun
Xie for giving their valuable time to serve as my dissertation committee members.
I was lucky to work with a number of excellent collaborators. I would like to thank Prof.
Peter Wipf, Pete Chambers, Prof. Xiang-Qun Xie, and other members within the University of
Pittsburgh Center for Chemical Methodologies and Library Development (UPCMLD).
UPCMLD weekly meetings have given me valuable opportunities for public presentations,
discussion and collaboration with scientists from various fields.

xiv
I am also thankful to members of my research group for their helpful discussions and
kind spirits, especially Dr. Zhi Chen, Dr. Hui Fang, Dr. Kristi Kauffman, Dr. Hong Zhang, Dr.
Yanhong Yang, Candace McGowan, Sijia Wang and Yangguang Ou.
Last but not the least; I am eternally indebted to my family. Although my parents cannot
understand my dissertation, they always support me to pursue my PhD dream and encourage me
when I feel frustrated. I am also especially grateful to my beloved husband, Xing Yin, who has
been together with me since college. He has played many roles in my life, as my lover, as my
best friend, and as a fellow chemist I can discuss science with. I cannot thank him enough for his
love and support through all these years.

1
1.0 INTRODUCTION
1.1 SOLID PHASE MICROEXTRACTION
1.1.1 Introduction
Sample preparation methods have been developed to clean up the sample matrix and
preconcentrate target analytes to enhance the measurement signal. Sample preparation is an
essential step in the analysis process. Over 60% of the total analysis time is spent on preparing
samples before introducing them into analytical instruments[1]. The success of an analysis of
samples with a complex matrix also depends on those sample preparation steps. It is necessary to
develop fast, efficient, and environmentally friendly procedures.
Extractions are the most commonly used sample preparation techniques. Extraction is a
separation process to remove target analytes from a sample matrix. According to the nature of
the extraction phase, extraction methods can be classified into liquid phase extraction (LPE) and
solid phase extraction (SPE). Liquid-liquid extraction (LLE) is a widely used method to separate
compounds based on their distribution between two immiscible liquid phases. This method is
time consuming and labor intensive, has problems of emulsion formation, and consumes large
amounts of volatile organic solvents.

2
A growing concern for protecting the environment has led to an increased emphasis on
green analytical methods. Solvent-free systems are ideal for preventing hazards to the
environment and human health. SPE was originally developed as a solvent-free alternative to
LLE. In SPE, analytes are removed from a flowing sample matrix through sorption to a solid
phase, which is usually a polymer. A wash solution is chosen to desorb analytes of interest.
Compared to LLE, SPE has several advantages: high recovery and reproducibility, high
efficiency with regard to economy of time and labor, and reduction in the amount of organic
solvents used.
Solid phase microextraction (SPME) is a solvent-free extraction technique in which the
extraction medium is small, usually on a coated fiber or thin film. The process of SPME involves
two main steps: (1) extraction of the target analyte from the sample matrix to the polymer
sorbent and (2) desorption of the concentrated analytes from the sorbent to an instrument for
analysis[2]. Various configurations of SPME have been considered to date, including coated
fibers, vessels, stirrers, and membranes as illustrated in Figure 1.1[3].

3
Figure 1.1 Various configurations of SPME. The red color describes the extraction phase, which can
be coated on a fiber, or inside the wall and bottom of a vessel, depending on the configuration. Reproduced
with permission from reference[3]. Copyright (2011) American Chemical Society.
1.1.2 SPME theories: from distribution to kinetics
Both distribution coefficient (D) and partition coefficient (P) between the polymer phase
and the aqueous phase can be used to describe extraction efficiency of SPME. They are defined
as the ratio of equilibrium concentrations (C) of an analyte in two immiscible phases. However,

4
there is a clear distinction between those two concepts. Partition coefficient (P) reflects the
concentration ratio of the neutral species only, while the distribution coefficient (D) counts for
both neutral and ionized species.
For ionizable compounds, D should be used instead of P in the pH range where ionic
species exist. In practice not only neutral molecules but also ion pairs may partition. The
distribution of the neutral and ionized forms of the solute between the polymer film phase and
the aqueous phase is determined by the distribution coefficient Dpw:
AqAq
ff
pwSS
SSD
][][
][][
Equation 1.1
where [S]Aq and [S]f are the concentrations of the neutral solute in the aqueous phase and film
phase, respectively; [S-]Aq and [S
-]f are the concentrations of the ionized solute and its ion pair in
the aqueous phase and film phase, respectively.
The partition coefficient (P) for the neutral form of the solute is defined as:
Aq
f
pwS
SP
][
][ Equation 1.2
The conditional partition coefficient for the anionic solute in the presence of a particular set of
counterions at certain concentrations is defined as:
Aq
f
pwS
SP
][
][
Equation 1.3
It is known that the equilibrium equation for acid dissociation constant Ka is
Aq
Aq
aS
HSK
][
][][
Equation 1.4
Inserting Equation (1.2), (1.3), and (1.4) into Equation (1.1), yields:
5
pKapH
pwpw
pwa
apwpw
Aq
Aq
Aq
Aq
pwpw
pw
PPP
H
K
H
KPP
S
S
S
SPP
D
101
][1
][
][
][1
][
][
Equation 1.5
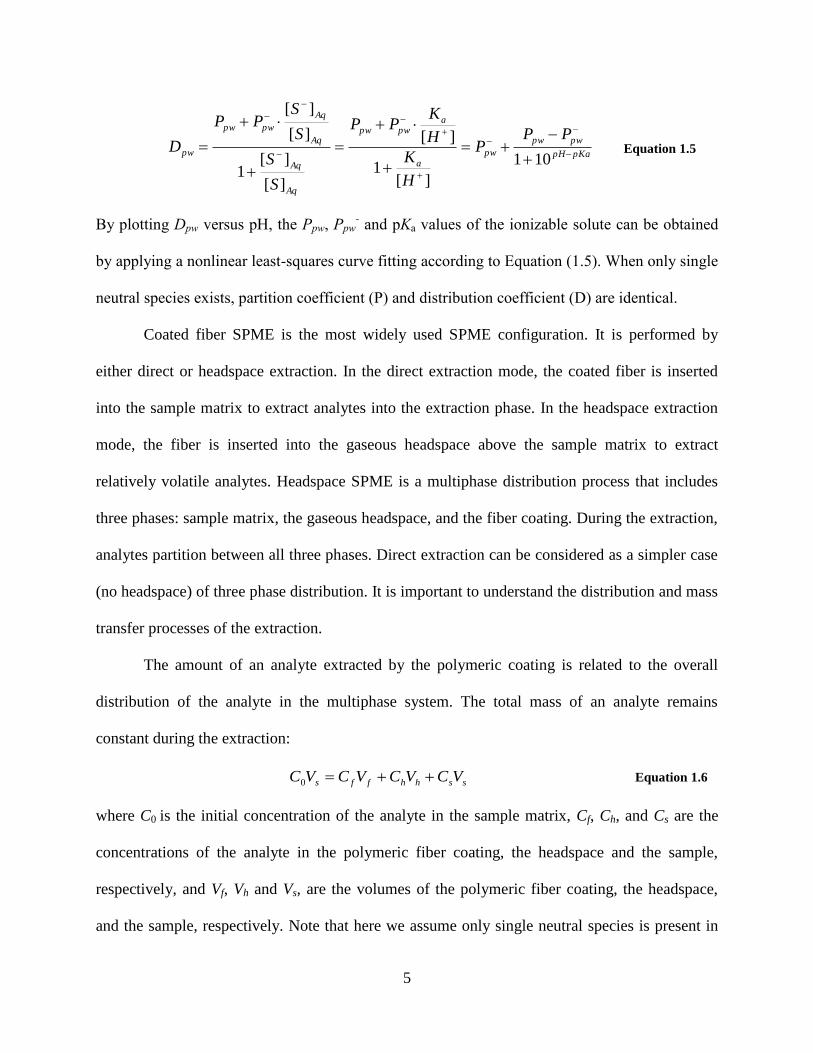
By plotting Dpw versus pH, the Ppw, Ppw- and pKa values of the ionizable solute can be obtained
by applying a nonlinear least-squares curve fitting according to Equation (1.5). When only single
neutral species exists, partition coefficient (P) and distribution coefficient (D) are identical.
Coated fiber SPME is the most widely used SPME configuration. It is performed by
either direct or headspace extraction. In the direct extraction mode, the coated fiber is inserted
into the sample matrix to extract analytes into the extraction phase. In the headspace extraction
mode, the fiber is inserted into the gaseous headspace above the sample matrix to extract
relatively volatile analytes. Headspace SPME is a multiphase distribution process that includes
three phases: sample matrix, the gaseous headspace, and the fiber coating. During the extraction,
analytes partition between all three phases. Direct extraction can be considered as a simpler case
(no headspace) of three phase distribution. It is important to understand the distribution and mass
transfer processes of the extraction.
The amount of an analyte extracted by the polymeric coating is related to the overall
distribution of the analyte in the multiphase system. The total mass of an analyte remains
constant during the extraction:
sshhffs VCVCVCVC 0 Equation 1.6
where C0 is the initial concentration of the analyte in the sample matrix, Cf, Ch, and Cs are the
concentrations of the analyte in the polymeric fiber coating, the headspace and the sample,
respectively, and Vf, Vh and Vs, are the volumes of the polymeric fiber coating, the headspace,
and the sample, respectively. Note that here we assume only single neutral species is present in

6
each phase to simplify the discussion. In most applications, the experimental conditions can be
tuned so that the neutral species dominates.
The film-headspace partition coefficient Pfh is then defined as:
h
f
fhC
CP Equation 1.7
The headspace-solution partition coefficient Phs is defined as:
s
hhs
C
CP Equation 1.8
Thus, the film-solution partition coefficient Pfs is described as:
hsfhfs PPP Equation 1.9
The amount of analyte extracted n is defined as:
ff VCn Equation 1.10
Combing Equation (1.7), (1.8), (1.9), and (1.10), yields:
shhsffs
sffs
VVPVP
CVVPn
0 Equation 1.11
where Pfs is the partition coefficient of the analyte between the fiber coating and the sample
matrix. If there is no headspace in the sample vial (direct liquid extraction), the term PhsVh in the
denominator can be eliminated, resulting in:
sffs
sffs
VVP
CVVPn
0 Equation 1.12
For large sample volumes, when PfsVf << Vs, Equation (1.12) can be simplified to
0CVPn ffs Equation 1.13
7
The above equations show that the amount of the analyte extracted depends on its partition
coefficient between the sample matrix and the sorbent phase, the volumes of the extraction phase
and sample matrix, and the initial concentration.
The partition coefficients between the extraction phase and the sample matrix depend on
a variety of conditions, including temperature, pressure, and exact matrix composition.
Temperature effects need to be considered when temperature changes during the extraction
procedure. When the temperatures of both the fiber and sample matrix change from T0 to T, the
partition coefficient changes according to the following equation (assuming the changes in
entropy and enthalpy are independent of temperature)[4]:
0
0
11exp
TTR
HPP
o
fs Equation 1.14
where P0 is the partition coefficient at temperature T0, ∆Ho is the molar enthalpy change of the
analyte from the sample matrix to fiber coating, and R is the gas constant.
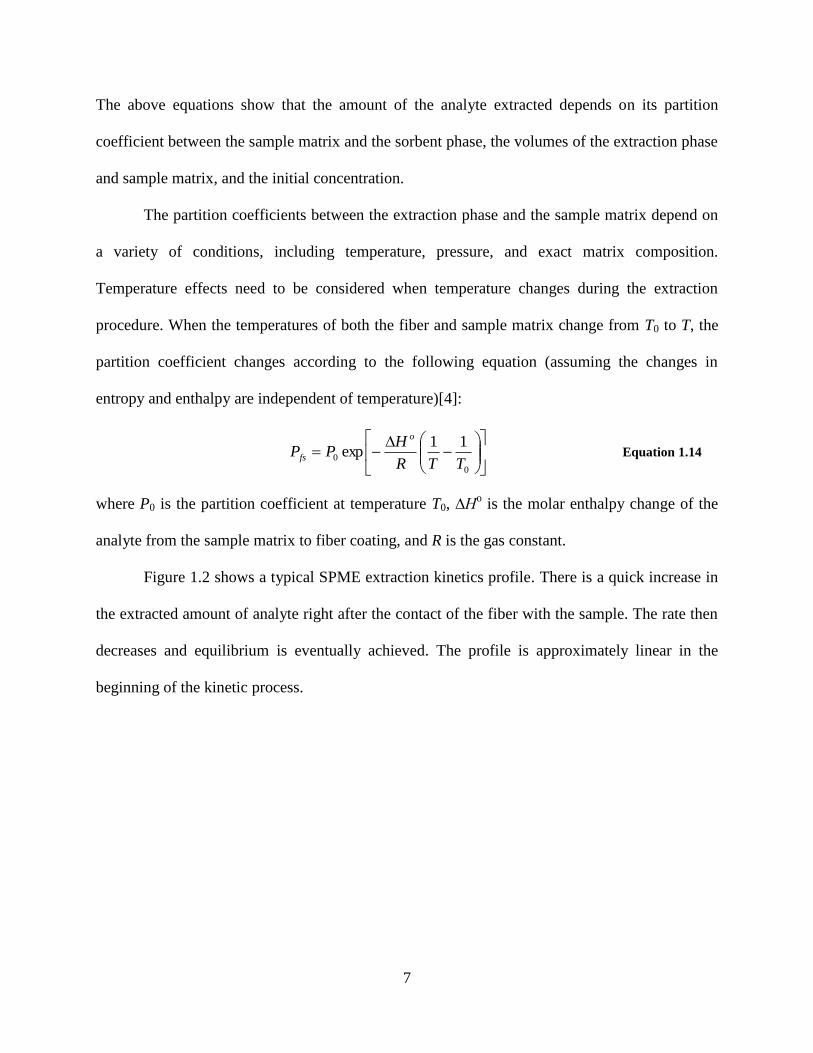
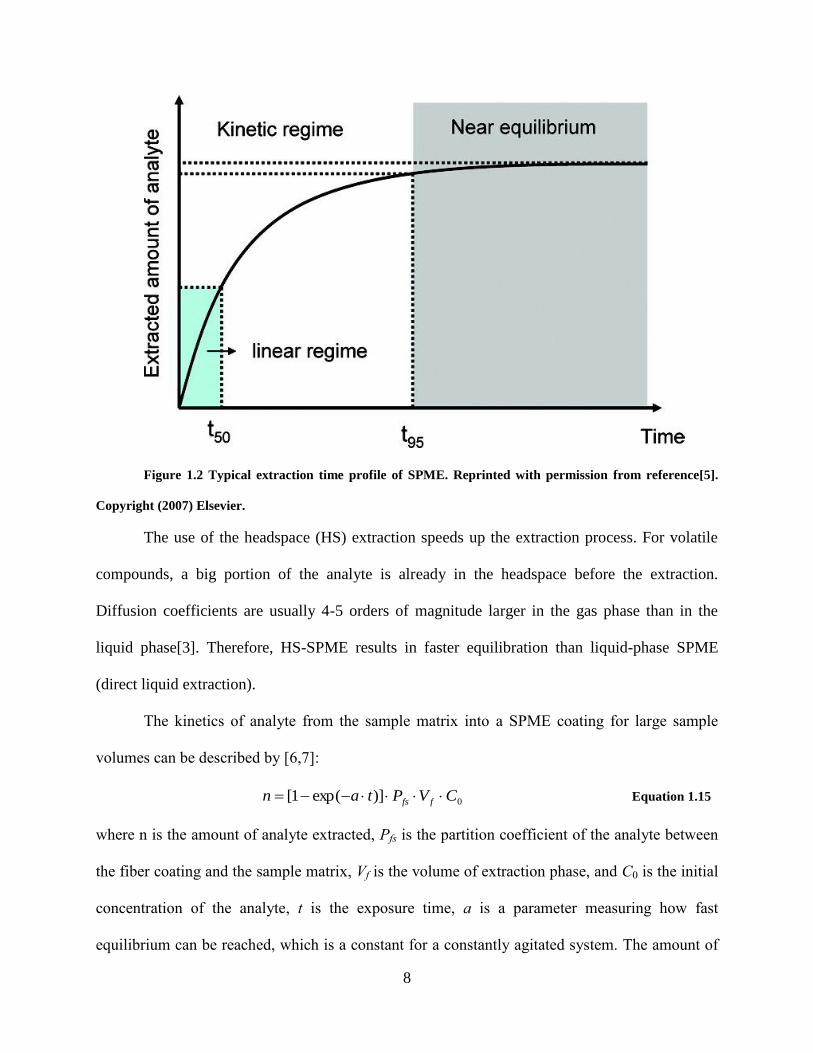
Figure 1.2 shows a typical SPME extraction kinetics profile. There is a quick increase in
the extracted amount of analyte right after the contact of the fiber with the sample. The rate then
decreases and equilibrium is eventually achieved. The profile is approximately linear in the
beginning of the kinetic process.
8
Figure 1.2 Typical extraction time profile of SPME. Reprinted with permission from reference[5].
Copyright (2007) Elsevier.
The use of the headspace (HS) extraction speeds up the extraction process. For volatile
compounds, a big portion of the analyte is already in the headspace before the extraction.
Diffusion coefficients are usually 4-5 orders of magnitude larger in the gas phase than in the
liquid phase[3]. Therefore, HS-SPME results in faster equilibration than liquid-phase SPME
(direct liquid extraction).
The kinetics of analyte from the sample matrix into a SPME coating for large sample
volumes can be described by [6,7]:
0)]exp(1[ CVPtan ffs Equation 1.15
where n is the amount of analyte extracted, Pfs is the partition coefficient of the analyte between
the fiber coating and the sample matrix, Vf is the volume of extraction phase, and C0 is the initial
concentration of the analyte, t is the exposure time, a is a parameter measuring how fast
equilibrium can be reached, which is a constant for a constantly agitated system. The amount of

9
analyte extracted is proportional to the initial analyte concentration once the sampling time and
agitation conditions are held constant. Therefore, the quantitative analysis of SPME is feasible
before partition equilibrium is reached.
1.1.3 Receptor-doped polymer coating materials as SPME sorbents
The selection of polymer coating material is the most important step in controlling the
selectivity of the extraction[8]. The most common fiber materials are polydimethylsiloxane
(PDMS), divinylbenzene (DVB), polyacrylate (PA), Carboxen (CAR; a carbon molecular sieve)
and Carbowax (CW; polyethylene glycol). Coatings of blended materials are also available, such
as PDMS-DVB, PDMS-CAR, CW-DVB[9]. However, there is no universal sorbent for all
applications.
One of the recent trends in SPME is to study new coatings with higher extraction
efficiency and selectivity[9]. The recently developed coatings for selective extraction include
molecularly imprinted polymer[10-18], ionic liquid[19-23], metal complex[24], and carbon
nanotubes[25,26].
Receptors are potentially very powerful tools for selective extractions by taking
advantage of a specific interaction between a receptor and a substrate through noncovalent
bonding, such as hydrogen bonding, metal coordination, π-π interactions, hydrophobic forces,
van der Waals, electrostatic effects, and steric effects[27].
When a receptor is present either in the polymer phase or in the aqueous phase, the
stoichiometry and binding constant of solute-receptor complexation can be determined by
measuring distribution coefficient of the solute at various receptor concentrations. If a receptor is
10
added into the polymer film phase, solute and receptor forms a complex and the binding constant
is defined as:
n
ff
fn
nLS
LSK
][][
][:1
Equation 1.16
where n is the stoichiometry, [L]f is the free receptor concentration and fnLS ][ is the solute-
receptor complex concentration in the polymer phase. The apparent solute distribution
coefficient Dapp with the presence of a receptor in the polymer phase is:
aq
fnf
appS
LSSD
][
][][ Equation 1.17
Dividing Equation (1.17) by Equation (1.2):
f
fn
pw
app
S
LS
P
D
][
][1
Equation 1.18
After rearranging Equation (1.18) and inserting it into Equation (1.16), we obtain:
n
fpw
app
n
ff
fn
nLP
D
LS
LSK
][
11
][][
][:1
Equation 1.19
After converting Equation (1.19) into the logarithmic form and rearranging it, we get
fn
pw
appLnK
P
D]log[log1log :1
Equation 1.20
The stoichiometry n and binding constant K1:n can be determined by measuring distribution
coefficient as a function of receptor concentration.
Our group has done a great deal of work combining molecular recognition processes with
separation and sample preparation methods. Li and coworkers[28] have reported an SPME
device based on plasticized-poly (vinyl chloride) (PVC) extraction medium coupled with
molecular recognition. They incorporated a phenobarbital receptor into a plasticized PVC film
11
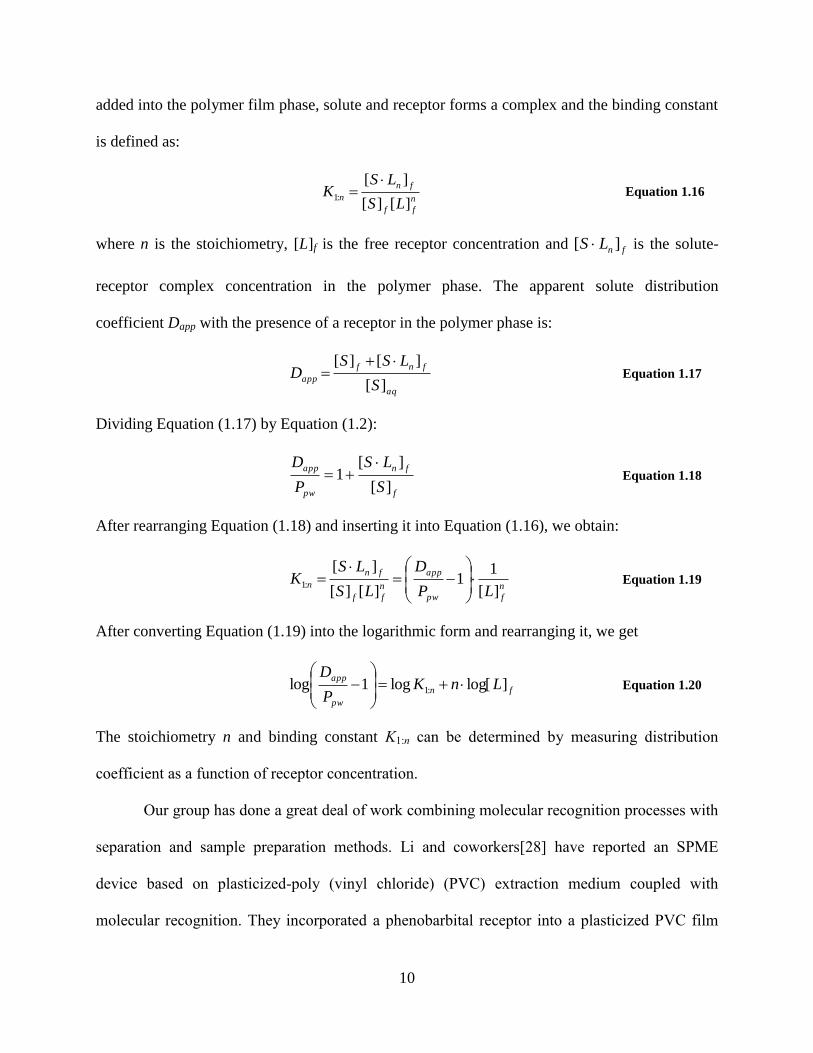
coated on a primed steel rod and followed the sampling with micro back-extraction for capillary
electrophoresis-based determination as shown in Figure 1.3. Such receptors are potentially very
powerful tools for selective extractions by taking advantage of noncovalent bonding between a
receptor and an analyte.
Figure 1.3 SPME device and operation. (1) Place rod in sample solution for a designated time. (2)
Injection 5 µL of back extraction solution into the Teflon tube. (3) Remove rod, wipe clean, place in Teflon
tube. (4) Remove after a set time (5) Collect the solution by moving the droplet spanning the diameter as a
piston and transfer the drop to an injection vial. Reprinted with permission from reference[29]. Copyright
(1997) American Chemical Society.
1.1.4 Parallel design and automation of SPME
High-throughput screening (HTS) has recently become a hot method for scientific
experimentation. The key testing vessel of HTS is the microplate: a small, usually disposable,
plastic container that features a grid of small wells. Modern microplates for HTS generally have
96, 384, or other multiples of 96 wells. Automation is another important characteristic. HTS is a
relatively recent innovation, made available through modern advances in robotics and high-speed

12
instruments. Since 1990, pharmaceutical and biotechnology companies have gradually moved
toward HTS of small-molecule compounds for their discovery programs[30].
The automation of SPME in parallel format allows significant reduction in analysis time
and increase in sample throughput. The automation of SPME for the analysis of volatiles and
semi-volatiles started in 1992 when a Varian Model 8100 autosampler was adapted for the
analysis of benzene, toluene, ethyl benzene, and xylene[4]. The idea of using multi-fiber SPME
and desorption on a 96-well microplate format was initially introduced in 2005[31]. This idea
was appealing for SPME-LC applications, as extraction and desorption are the most time-
consuming steps due to slow mass transfer in the liquid phase. In SPME-LC, after extraction of
analytes from the sample onto the fibers, the analytes can be desorbed from the fibers using
liquid desorption, and then injected into a High-Performance Liquid Chromatography (HPLC)
system. Each fiber is aligned to the corresponding well of a 96-well microplate. Agitation
method including magnetic stirring, mechanical shaking, and sonication can be used to speed up
the equilibrium between the SPME fibers and well contents in the microplate.
The design of parallel format and automation was achieved by introducing a
commercially available automated sample preparation station called Concept 96 robotic system,
made by PAS Technology (Magdala, Germany)[32,33]. The automated system consisted of a
three-arm robotic autosampler that was fully controlled with software and two orbital agitators,
as shown in Figure 1.4. This design has been applied to analyze drug compounds[33,34],
polycyclic aromatic hydrocarbons (PAHs)[35], as well as fungal toxins[32] in biological fluids
and other media [36].

13
Figure 1.4 (a) 96-well multi-fiber SPME device (stainless steel fibers coated with carbon tape). (b)
robot arm inserting the multi-fiber SPME device in the 96-well plate. Reprinted with permission from
reference[32]. Copyright (2008) Elsevier.
1.2 METHODS FOR MEASUREMENT OF ACID DISSOCIATION CONSTANT
The acid dissociation constant, expressed as the pKa value, is a fundamental property of
weak acids and bases. For compounds with a single ionized group, it is defined as the pH at
which a compound is 50% ionized. Once the pKa value is established, the extent of ionization at
any pH for that compound is easily calculated. This is an important property for
pharmaceutically active molecules since the physical, chemical, and biological properties of the
neutral and ionized drugs are generally different. To measure pKa values, it is necessary to put
the sample in environments of various pH values and monitor a particular property that changes

14
as a function of the ionization state of the molecule. Traditional methods used to determine pKa
values usually rely on potentiometry or spectroscopy.
Historically, potentiometric titration is the standard method for the determination of pKa
values. In this method, the sample is titrated with an acid or base using a pH electrode to monitor
the course of the titration. Spectrophotometric titrations are generally considered the main
alternative to potentiometric titrations for pKa measurements. The spectroscopic approach to pKa
measurement is commonly performed by NMR spectroscopy[37] or UV absorption[38]. The
former technique analyzes chemical shift values as a function of pH in terms of a single titration
curve to determine pKa. The NMR method is relatively accurate and reliable but requires
expensive and sophisticated instrumentation. The latter technique has high sensitivity for
compounds with favorable molar absorptivity[39]. In this case, however, a chromophoric center
must exist in the sample close to the ionizable groups so that the neutral and ionized forms show
sufficiently different UV absorbances. Capillary electrophoresis (CE) has also been proposed as
a technique for convenient and precise determination of aqueous pKa[40,41]. This method relies
on the principle that the solute shows an electrophoretic mobility relationship with pH values. In
its uncharged state, the solute has no mobility, while in its completely ionized state, it has a
maximum mobility. Acid dissociation constants can be determined by regression analysis of plot
of mobility with pH values. This method offers several attractive features: it only requires small
amounts of sample, is highly automated, and does not require precise information of sample
concentration but only migration times.
In this dissertation, acid dissociation constant of ionizable compounds has been
determined by a parallel polymer-based microextraction method. It measures acid dissociation
constant while measuring intermolecular binding constants or other physicochemical properties

15
including lipophilicity as a function of pH. This parallel approach uses small amounts of sample
and minimal amounts of organic solvent.
1.3 METHODS FOR LIPOPHILICITY MEASUREMENT
Lipophilicity is described by either partition coefficient (P) or distribution coefficient (D),
which is a measure of how well a molecule partitions between a lipid and water. As discussed in
Session 1.1.2, P and D are identical if only neutral species are considered. As suggested by
Collander[42] and Leo[43], log Pow, the logarithmic value of the 1-octanol/water partition
coefficient, has been widely recognized in the pharmaceutical, biomedical, and environmental
fields to describe lipophilicity of various compounds. Many experimental methods exist to
measure log Pow values.
Traditionally, the shake-flask procedure is a standard method to determine log Pow in the
range of -2 to 4 [44]. In this method, the substance of interest is introduced into a separatory
funnel with the two phases (1-octanol and water). The funnel is then shaken for a period long
enough to reach equilibrium. The concentration of the test substance in each phase is determined
after phase separation and log Pow is calculated. This method is time consuming, labor intensive,
and requires relatively large amounts of pure compounds[45,46]. In addition, the octanol/water
emulsions can be severe problems for compounds having a log Pow value larger than 4 [40,45].
The HPLC method is an indirect way to estimate log Pow values in the range of 0-6 and
has also become a standard method[47]. A series of reference compounds are injected into a C18
column. The retention factors of those compounds are used to create a calibration curve with
their known log Pow values. Compounds with unknown Log Pow values are then injected, and

16
their log Pow can be predicted by their retention time from the calibration curve[48]. This
technique is rapid, precise and reproducible for sets of similar compounds, although impurities
may make interpretation of the results difficult due to uncertainty in peak assignments. The
reference compounds should be preferably similar to those being studied and difficulties arise if
suitable standards are unavailable. One further disadvantage with this method is that HPLC is
less suitable for molecules in ionic form since charged molecules have a far more complex
retention behavior[45].
Recent advances in combinatorial technology have encouraged the development of
lipophilicity measurement methods to be rapid, high throughput, and operational on the micro-
scale. To increase the throughput of log Pow measurement, an attempt has been made to transfer
the traditional shake-flask method to a 96-well format.[49] However, restrictions of the shake-
flask method still remained due to octanol/water emulsions. Most of the current experimental
methods only measure partition coefficients of the neutral species. Novel methods are needed
with capability of measuring distribution coefficients and extension of applicable log Pow range.
1.4 OUTLINE
Lipophilicity and acid dissociation constants are important physicochemical properties
that in part determine the suitability of an organic molecule as a pharmacological agent.
Intermolecular associations are omnipresent in chemical and biochemical systems and
particularly important in the efficacy of an excipient for a poorly soluble drug. Current standard
methods to determine lipophilicity require large amounts of pure sample and have problems due
to emulsion formation. This dissertation describes a method based on distribution of the solutes

17
between a polymer phase and an aqueous phase in a 96-well format, in the presence and absence
of a receptor (e.g., candidate excipient) in one of the two phases. Figure 1.5 illustrates the
general experimental design of this parallel approach. Briefly, polymer films are first prepared in
96-well microplates. Aqueous buffered solutions are then dispensed into the microplates. A
solute or receptor can be embedded in either the polymer phase or the aqueous phase.
This parallel approach uses minimal amounts of organic solvent and only requires small
amounts of sample. This approach has been used to determine polymer-water distribution
coefficients of solutes. In addition, by measuring polymer-water distribution coefficients under a
variety of experimental conditions, such as pH and receptor concentration, acid dissociation
constants and solute-receptor binding constants have been successfully determined for several
chemical systems.
Chapter 2 of this dissertation focuses on using this parallel approach to determine drug-
cyclodextrin binding constants. Drug and Cyclodextrin form inclusion complex in the aqueous
solutions. Distribution coefficients of drugs between the polymer phase and the aqueous phase
have been used to measure binding constants of drug-cyclodextrin inclusion complex. The
polymeric phase was poly(vinyl chloride) (PVC) plasticized by 67% (w/w) dioctyl sebacate
(DOS). Binding constants of a poorly water-soluble drug, econazole, with six cyclodextrins in
aqueous solutions have been measured. The acid dissociation constant of econazole was also
determined by measuring econazole-cyclodextrin binding constants at various pH values.
Chapter 3 describes the application of this parallel design to screen distribution
coefficients of novel drug-like compounds. Distribution coefficients and acid dissociation
constants of twenty-four novel drug-like compounds have been determined by this parallel
approach and compared to the values calculated by commercially available software. The

18
software packages did not adequately predict experimental results, especially for ionizable
compounds. This emphasizes the need for laboratory separations-based measurements of
distribution coefficients. The polymeric phase was also PVC plasticized by 67% (w/w) DOS.
Finally, in chapter 4, intermolecular association has been studied in Teflon AF 2400, a
fluorous polymer phase, with and without fluorous hydrogen bond donor Krytox 157 FSH in the
96-well approach. We found that the addition of a fluorous carboxylic acid (Krytox 157 FSH) to
a fluorous film (Teflon AF 2400) increased the polymer-water distribution coefficients of
quinoline, a nitrogen heterocycle. In addition, a novel fluorous receptor-doped fiber solid phase
microextraction (SPME) was developed to selectively detect quinoline in aqueous solutions.
Compared to a commonly used SPME fiber made of polydimethylsiloxane (PDMS), it showed a
preference for the nitrogen heterocyclic compound over a non-heterocyclic control, phenol. To
our knowledge, this is the first reported receptor-doped fluorous SPME.

19
Figure 1.5 General procedure of the parallel experimental design to study intermolecular association
and physicochemical properties

20
2.0 DETERMINATION OF DRUG-CYCLODEXTRIN BINDING CONSTANTS BY A
HIGH-THROUGHPUT PHASE-DISTRIBUTION METHOD
Part of this chapter has been published in J. Pharm. Sci., 2009, 98, 229. Reproduced with
permission from J. Pharm. Sci.. Copyright (2009) John Wiley & Sons.
2.1 INTRODUCTION
Aqueous solubility is one of the fundamental determinants in developing new chemical
entities as successful drugs.[50] According to recent estimates[51,52], nearly 40 % of new drugs
are rejected because of poor biopharmaceutical properties. The main biopharmaceutical
properties include solubility, stability, pKa, bioavailability, brain penetration, and hepatotoxicity.
Solubility, especially aqueous solubility is the most important one. Low aqueous solubility can
limit drugs’ function on human bodies. Compounds with an aqueous solubility of less than 100
µg/mL may require development of a special formulation to overcome poor absorption
properties.[53]
To solve this problem, pharmaceutical companies are giving strategies to measure,
predict and improve solubility of promising new drug candidates during the preclinical phases of
drug development. Multiple formulation techniques exist to increase the apparent solubility of
lipophilic compounds without decreasing their optimized potency. These techniques include
21
particle size reduction, pH adjustment, addition of solubilizing excipients, solid dispersion,
microemulsification, nanocrystallization, inclusion complex formation, etc[54].
Cyclodextrins (CDs) are bucket-shaped oligosaccharides produced from starch, with a
hydrophilic outer surface and a lipophilic inner cavity. They can form water-soluble inclusion
complexes with many lipophilic compounds. They are commonly used in pharmaceutical
formulations to enhance drug solubility, stability and bioavailability.[55,56] To date, there are
more than 20 marketed drugs that contain CDs,[57] and numerous publications are emerging
every year studying the use of CDs for drug formulation and delivery. Although higher order
complexes are not uncommon, the simplest and most frequent stoichiometry of drug-
cyclodextrin (S-CD) complexes is 1:1
S + CD
K1:1
S-CD
The binding constant (K1:1) is defined as
]][[
]-[1:1
CDS
CDSK Equation 2.1
where [S], [CD], [S-CD] are the concentrations of the free drug, free CD, and drug-CD complex,
respectively. For consecutive complexation
S-CDi-1 + CD
K1:i
S-CDi
The binding constant (K1:i) is defined as
]][-[
]-[
1
:1CDCDS
CDSK
i
i
i
Equation 2.2
The binding forces within the drug-CD complexes may involve hydrophobic, van der
Waals, hydrogen bonding, or dipole interactions.[58] Depending on the cavity size and
functional groups, CDs vary in their ability to form inclusion complexes with specific guest
22
compounds.[59] The stoichiometry and binding constant are important in any investigation to
assess the value of a CD for the formulation of a specific drug.[60]
Various techniques exist to measure drug-CD binding constants. The most common
method to determine K1:1 for drug-CD binding is the Higuchi-Connors phase-solubility
method.[61] This method measures the effect of CD concentration on the apparent solubility of
the drug. The intrinsic solubility (S0) and the slope of the solubility versus CD-content diagram
are then used to calculate K1:1. There are also a few reports using phase-distribution methods to
determine binding constants for CD complexes.[62,63]
Recently, we have developed a high-throughput method that can determine the
distribution behavior of drug candidates between a polymer phase and an aqueous phase.[27]
This method has also been applied to measure intermolecular associations in the polymer phase
to screen chiral selectors.[64] In this chapter of work, we report the application of this high-
throughput method for the determination of drug-CD binding constants in the aqueous phase.
The polymer phase is composed of poly (vinyl chloride) (PVC) and dioctyl sebacate (DOS) at
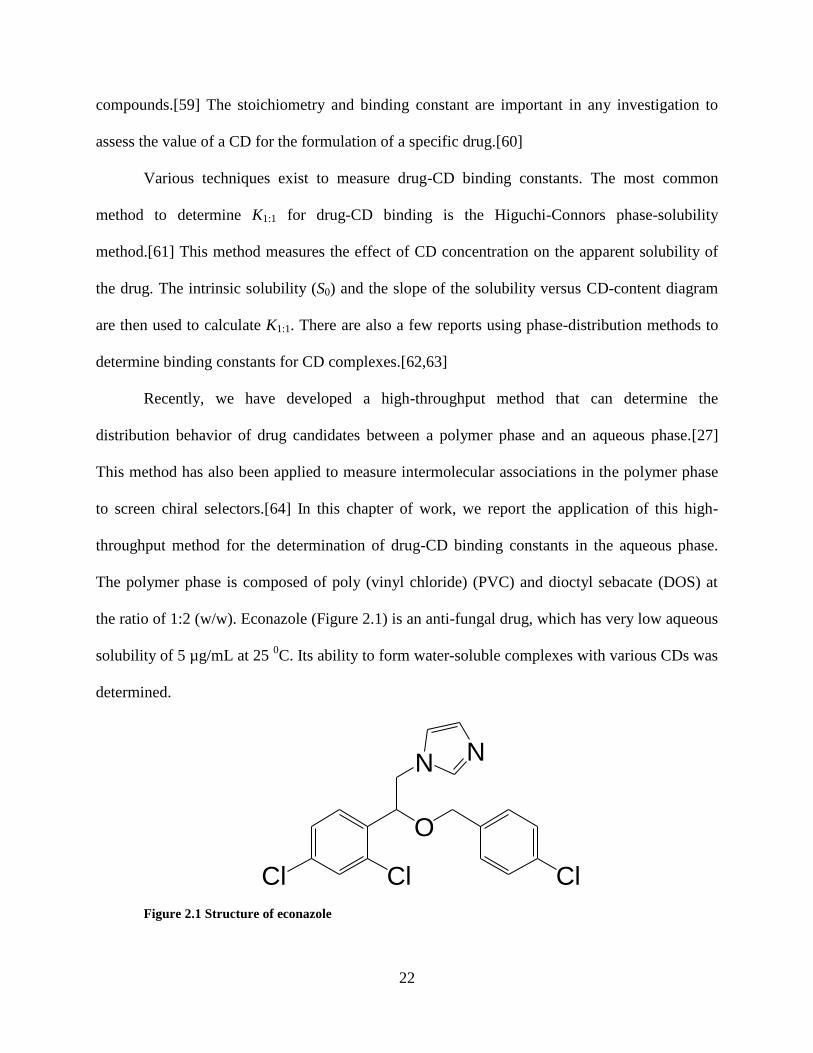
the ratio of 1:2 (w/w). Econazole (Figure 2.1) is an anti-fungal drug, which has very low aqueous
solubility of 5 µg/mL at 25 0C. Its ability to form water-soluble complexes with various CDs was
determined.
O
ClCl
N N
Cl
Figure 2.1 Structure of econazole

23
2.2 EXPERIMENTAL
2.2.1 Materials
(2-hydroxyethyl)-β-cyclodextrin (HE-β-CD), (2-hydroxypropyl)-β-cyclodextrin(HP-β-
CD), 2,6-di-O-methyl-β-cyclodextrin(DM-β-CD), heptakis (2,3,6-tri-O-methyl)-β-cyclodextrin
(TM-β-CD), α-cyclodextrin(α-CD), β-cyclodextrin(β-CD) were purchased from Sigma-Aldrich-
Fluka with the highest available purities. Econazole free base was purchased from Molecula Ltd.
(Dorset, UK). HPLC grade tetrahydrofuran (THF) and acetonitrile (ACN) were purchased from
Aldrich (Milwaukee, WI). PVC (high molecular weight) and dioctyl sebacate (DOS) were
purchased from Fluka (Ronkonkoma, NY). Water used in all the experiments was purified with a
Milli-Q Synthesis A10 system (Millipore, Bedford, MA). Costar polypropylene 96-well
microplates (flat-bottom, 330-µL well volume) and thermal adhesive sealing films were
purchased from Fisher Scientific Co. (Pittsburgh, PA).
2.2.2 Equipment
An UltraSpense 2000 microplate dispenser (KD Scientific, Holliston, MA) was used to
prepare polymer films in 96-well plates. A Zipvap-96 well evaporator (Chrom Tech, Apple
Valley, MN) was used to evaporate THF. A Deep Well Maximizer (or BioShaker) (Model
M·BR-022 UP, made by Taitec and distributed by Bionexus, Inc., Oakland, CA) was used to
speed up the drug distribution kinetics and control the temperature for better reproducibility. An
X-LC (Jasco, Inc.) UHPLC system was used to determine the econazole concentration with a
UHPLC C18 column (1.0 × 50 mm, particle size: 1.7 µM, Waters, Milford, MA).

24
2.2.3 Buffer Preparation
The phosphate buffer solutions (20 mM, pH 5.80, 6.62, 6.83, 7.12, 7.43, 8.46) were
made by mixing appropriate amounts of 20 mM sodium phosphate dibasic solution and 20 mM
sodium phosphate monobasic solution.
2.2.4 Preparation of Plasticized PVC Films
PVC (4.17 g) and DOS (8.33 g) were dissolved in 500 mL of THF in a volumetric flask.
The microplate dispenser was used to dispense the solution to the wells of a polypropylene 96-
well microplate. The plate was placed in an evaporator for 15 min for evaporation of the THF,
and the films were formed at the bottom of each well. The volume of each film was estimated as
LL
V
d
VmLgV solution
film
solutionfilm
5.2
100
500/5.12
Equation 2.3
Here Vsolution is the volume of the THF solution used in each well, and dfilm is the density of the
film which is estimated as 1 g/mL. In our experiments in this part of work, 100 µL of the THF
solution was dispensed in each well, so the volume of each film was ~2.5 µL.
2.2.5 High-Throughput Phase-Distribution Studies
Figure 2.2 gives the sequence of operations for the phase-distribution method that
measures the binding constants of drug-CD complexes. The plasticized PVC films were prepared
in polypropylene 96-well microplates. Briefly, an appropriate amount of the DOS-plasticized
PVC THF solution and the drug THF solution are mixed at a ratio of 1:1. Aliquots of 200 µL of

25
this solution were dispensed by the microplate dispenser to microplates. Evaporation of solvent
allowed the formation of polymer films at the bottom of each well. The volume of each film has
been calculated to be ~2.5 µL according to Equation 2.3. CD-containing aqueous buffers (200
L) were then manually dispensed over the films. The plates were covered by adhesive sealing
films and incubated in a shaker (500 rpm, 25 ºC). In order to determine the equilibration time,
the concentration of drug extracted into the aqueous phase was measured as a function of time at
pH 7.4. Other than for this experiment, all data generated were at equilibrium. To determine the
drug concentration, the supernatant from each well was transferred to another plate and injected
to the HPLC system by an autosampler. The distribution ratio of concentrations in the aqueous
phase over the polymer phase, was then calculated as
ES
Ewp
CC
CD Equation 2.4
Here CS is the drug aqueous concentration if all the target has been extracted to the aqueous
phase, CE is the drug aqueous concentration at equilibrium, and Φ is the phase ratio (aqueous
over polymer).
Figure 2.2 Schematic illustration of the preparation and use of polymer films in 96-well plates

26
2.2.6 HPLC Method to Determine Econazole Concentration
The column used was the Waters UPLC C18 column. The mobile phase was
acetonitrile/H2O (65/35, v/v), with a flow rate of 0.2 mL/min. The back-pressure was ~7000 psi.
To ensure reproducibility, the full-load injection mode was used (injection volume 10 µL; loop
volume 5 µL). Detection was by UV absorbance at 210 nm. The peak area was used for the
calibration and determination of sample concentration. The time per analysis is ~60 s.
2.2.7 DOS binding to CDs.
A 2.5 mL solution of 10 %( w/v) HP--CD was equilibrated with pure DOS for one day
at 25 oC. HPLC of the aqueous phase (UPLC C18 column, mobile phase 90% acetonitrile, 10%
water, flowing at 0.13 mL/min) showed no obvious DOS peaks. A standard of DOS had a
retention time of 1.7 minutes. Detection was at 210 nm (absorbance).
2.3 RESULTS AND DISCUSSION
2.3.1 Theories to Determine the Stoichiometry n and Binding Constants K1:i (i = 1 to n)
The distribution of the free drug between the aqueous phase and the film phase is determined by
the distribution coefficient D0:
filmS
SD
][
][0 Equation 2.5

27
where [S] and [S]film are the free drug concentration in the aqueous phase and film phase,
respectively. When the CD is added to the aqueous phase, the drug distribution coefficient is:
film
n
i
i
S
CDSS
D][
][][1
Equation 2.6
where n is the stoichiometry, [S-CDi] (i = 1 to n) is the drug-CD complex concentration in the
aqueous phase in various forms. Dividing Equation (2.6) by Equation (2.5):
n
i
i
S
CDS
D
D
10 ][
][1 Equation 2.7
From Equation (2.2), one obtains:
i
j
j
i
i KCDSCDS1
:1]][[][ Equation 2.8
Inserting Equation (2.8) to Equation (2.7):
n
i
i
j
j
i KCDD
D
1 1
:1
0
][1 Equation 2.9
It is known that pKa of econazole is 6.69.[48] If system is acidic, the cationic form of econazole
should also be considered in the equation as follows. The distribution of the free neutral and
cationic drug between the aqueous phase and the film phase is determined by the distribution
coefficient D0,
filmfilm HSS
HSSD
][][
][][0
Equation 2.10
where [HS+] and [HS
+]film are the free neutral and cationic drug concentration in the aqueous
phase and film phase, respectively. When the CD is added to the aqueous phase, the drug
distribution coefficient is:

28
filmfilm
n
i
i
n
i
i
HSS
CDHSHSCDSS
D][][
][][][][11
Equation 2.11
Dividing Equation (2.11) by Equation (2.10):
n
i
ii
HSS
CDHSCDS
D
D
10 ][][
][][1 Equation 2.12
It is known that the equation for the acid dissociation constant Ka is
][
]][[
HS
HSK a Equation 2.13
Inserting Equation (2.8) and Equation (2.13) into Equation (2.12):
n
i
a
i
j
j
a
i
j
j
i
K
H
KK
HKCD
D
D
1
1
:1
1
:1
0 ][1
][][
1 Equation 2.14
where K+
1: j is the binding constant of cationic drug and cyclodextrin.
If the system is very acidic,
jKKa
H:1
][
>1
Equation (2.14) will become
n
i
i
j
ji KCD
D
D
1 1
:1
0
][1 Equation 2.15
If the cationic form of the drug is ignored, Equation (2.14) will become Equation (2.9) again.
Plotting D/D0 versus [CD], the stoichiometry and the binding constants can be obtained
from polynomial fitting analyses. In practice, a degree one (linear) fitting should first be
performed, assuming that only 1:1 complex forms

29
][1 1:1
0
CDKD
D Equation 2.16
A proper fitting should give a straight line with a y-intercept of unity, and the slope can report
the value of K1:1. Otherwise linear regression on a quadratic equation should be carried out,
assuming that both 1:1 and 1:2 complexes form:
2
2:11:11:1
0
][][1 CDKKCDKD
D Equation 2.17
Again, a correct fitting should give a y-intercept of unity, and the K1:1 and K1:2 values can be
obtained from the corresponding coefficients of the polynomial. If the fit is still not satisfactory,
fitting analyses with higher degrees should be continued. Note that all the coefficients of the
polynomial should have positive values. In this study, the concentration of CD prepared in the
aqueous buffer (CCD) is much higher than the drug concentration (CS), hence the drug-CD
complexation does not significantly change the free CD concentration, and [CD] in those
equations can be reasonably replaced by CCD.

30
2.3.2 Experimental Results and Discussion
Figure 2.3 Percentage of econazole extracted as a function of time in the presence of six CDs and
without CD
A kinetic study was first performed to determine the time needed for the phase
distribution of econazole to reach equilibrium. The results are shown in Figure 2.3. Clearly, 8-9.5
h is enough for all the distribution experiments to be equilibrated. Careful inspection of the
curves shows that the equilibration time is shorter when the aqueous phase contains less CD or
the specific CD has a weaker ability to extract econazole. It also shows that the equilibration
time for econazole in the absence of CD in the aqueous phase is about 4 h. Also, very low
percentage of econazole has been extracted into the aqueous phase without CD, which is

31
consistent with the fact econazole has very low aqueous solubility (5 µg/mL at 25 0C). Based on
the kinetic data, all other distribution experiments were allowed to equilibrate for 10 h.
Instructed by Equation (2.9), the effect of CD concentration on the distribution of
econazole was then studied. Figure 2.4 gives the profile of econazole equilibrium concentration
versus CD-content in the aqueous phase for six CDs. Each measurement was repeated for four
times and the corresponding error bar indicates the standard error of the mean (SEM). The SEM
values were then used in error propagations to determine the errors of the calculated distribution
ratios and D/D0 values. Apparently, at higher CD concentration, more econazole is extracted to
the aqueous phase. For these six CDs, the ability to extract econazole is in the order of DM-β-
CD > α-CD > β-CD > HE-β-CD ≈ HP-β-CD > TM-β-CD, which is in good agreement with the
previous kinetic study (Figure 2.3) and reported phase-solubility data of several CDs (α-CD > β-
CD > HP-β-CD).[65] Various structures of CDs explain their different binding abilities with
econazole. Linear regression on Equation (2.17) gives the K1:1 and K1:2 values, as shown in Table
2.1. The errors are their standard deviations. Some of the fitted curves are shown in Figure 2.5
and all the coefficients of determination (COD) are listed in Table 2.1. The econazole-CD
binding constants (K1:1/103 M
-1) discovered by phase-solubility studies have been reported for α-
CD, HP-β-CD, and β-CD, which are 2.63 ± 0.26, 1.54 ± 0.15, and 1.42 ± 0.13, respectively.[65]
These values are in the same order of magnitude as the data in Table 2.1, however, because the
conditions of the experiments differ, the results do not agree quantitatively. Since the pH and
choice of buffer species have a great effect on the determination of binding constant,[65] the
literature values measured in pure water should only be used for qualitative purposes. The K1:2
values are larger than zero, indicating the formation of 1:2 complexes. All K1:2 values are highly
significant as judged by p values. Probabilities that the values of K1:2 are different from zero

32
based only on chance all < 0.0001 except for the final entry in Table 2.1 (-CD) in which case it
is < 0.001. Most studies on imidazole-CD complexation have assumed a 1:1 ratio,[50,66] but
higher order complexes have also been reported.[67-71] For instance, the stoichiometry of
econazole/β-CD has been published by several groups to be 1:1,[65,72] while a study has
discovered the formation of 2:3 complex.[67]
Figure 2.4 Effect of CD concentrations on econazole equilibrium concentration in the aqueous phase

33
Table 2.1 Binding constants of econazole with six CDs
D0 Cyclodextrin M.W. (g/mol) K1:1 (103 M
-1) K1:2 (M
-1) COD
(1.20±0.09)10-5
HE-β-CD ~1480a 3.98 ± 0.13 4.9±0.5 0.9989
HP-β-CD ~1580a 3.90 ± 0.22 10.0±1.9 0.9976
DM-β-CD ~1330a 29.3 ± 2.2 57.7±8.7 0.9982
TM-β-CD 1429.54 0.66 ± 0.04 53.9±3.7 0.9994
α-CD 972.84 1.78 ± 0.30 256±44 0.9997
β-CD 1134.98 4.08 ± 0.50 47.6±12.1 0.9956
a Randomly substituted. Their average molecular weights are determined by ESI-MS.
Figure 2.5 Multivariate linear regression results for fitting D/D0 versus CD concentration.

34
Table 2.2 Binding constants of econazole with HP-β-CD at various temperatures
Temperature (K) K1:1 (103 M
-1) COD
293.15 2.06 0.009 0.9999
298.15 1.81 0.005 0.9999
303.15 1.50 0.016 0.9992
308.15 1.34 0.008 0.9999
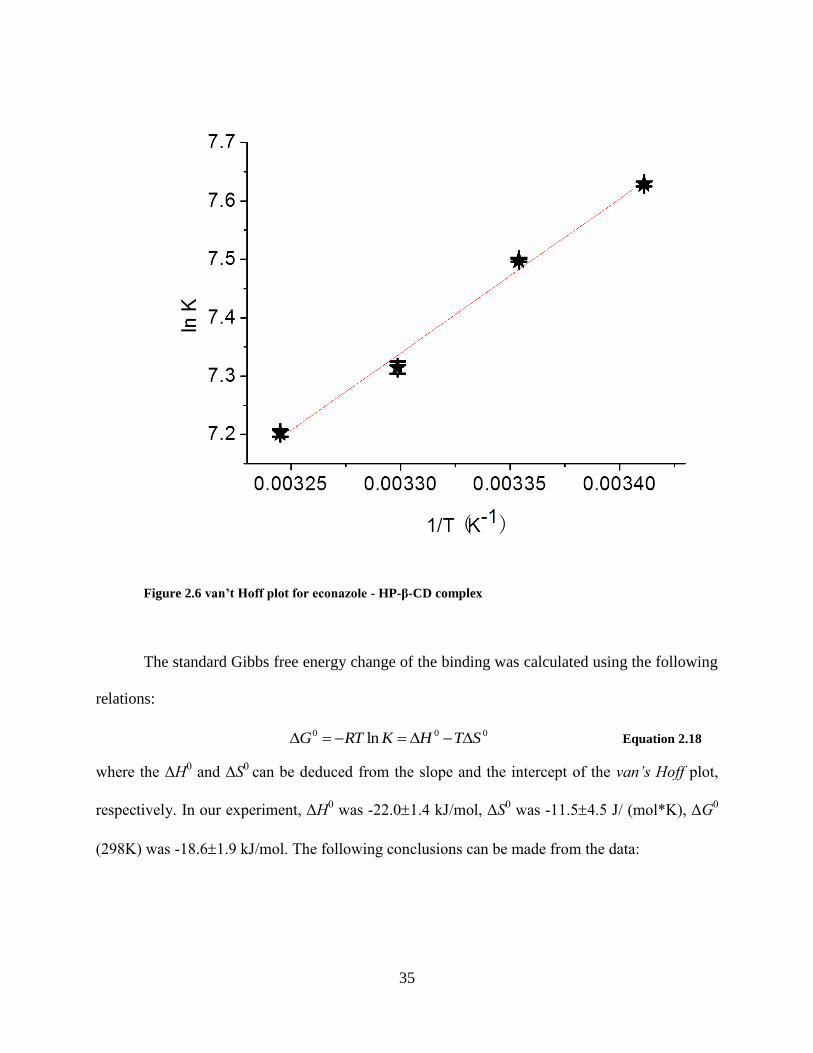
The binding behavior of econazole to HP-β-CD has been studied at various temperatures.
The K values were measured at 293, 298, 303, and 308 K, respectively, which are shown in
Table 2.2. Since the binding constant is related to the Gibbs free energy (ΔG0) of complexation,
which comes from enthalpic (ΔH0) and entropic (ΔS
0) terms, these thermodynamic terms can
provide insight into the driving forces for complexation. The thermodynamic parameters for
inclusion processes were determined from the temperature dependence of the binding constants
using a van’s Hoff plot (lnK versus 1/T), as seen in Figure 2.6. The plot was linear with a
correlation coefficient close to unity (R2 0.99) within the temperature range considered in the
present study, indicating that the changes in the heat capacity could be neglected.
35
Figure 2.6 van’t Hoff plot for econazole - HP-β-CD complex
The standard Gibbs free energy change of the binding was calculated using the following
relations:
000 ln STHKRTG Equation 2.18
where the ΔH0 and ΔS
0 can be deduced from the slope and the intercept of the van’s Hoff plot,
respectively. In our experiment, ΔH0 was -22.01.4 kJ/mol, ΔS
0 was -11.54.5 J/ (mol*K), ΔG
0
(298K) was -18.61.9 kJ/mol. The following conclusions can be made from the data:
36
(1) The K values decrease with rising in temperature, i.e., as the temperature increases, the
affinity of the cyclodextrin for the drug decreases. This phenomenon is because the formation of
the complex is exothermic (ΔH0 < 0).
(2) The negative value of ΔG0 suggests that the complexation is thermodynamically favored. The
drug binds to CD with a favorable enthalpic term (ΔH0 is less than zero) and an unfavorable
entropic term (ΔS0 is less than zero). Also, the complex formation is enthalpy driven
(ΔH0>TΔS
0).
(3) The effect of temperature on drug-CD binding has also been studied by Shehatta etc.[73]
Their obtained the binding constant of itraconazole with HP-β-CD was (1.17 0.101) 103
M-1
in 298 K, which was lower than our measurement for econazole- HP-β-CD complex ((1.81
0.005) 103
M-1
), also led to higher standard Gibbs free energy ΔG0 (298K) value (-17.5 0.2
KJ/mol) than ours (-22.0 1.4 KJ/mol). Itraconazole has a larger size than econazole, which
contributes to a less favorable affinity of the drug for CD, although their structures are similar.
Different shapes and sizes results in the difference in the entropic term ΔS0 (- 40.0 4.7 versus -
11.5 4.5 J/ (mol*K)).
The influence of pH on the apparent binding constant of the econazole-HP-β-CD
inclusion complex has been studied. As shown in Figure 2.7, a decrease in pH results in a drop in
the apparent binding constant (K = 2.15103
M-1
at pH 8.5; whereas K = 0.654103
M-1
at pH 5.8)
indicating that binding constant is larger in the less protonated form for the econazole-HP-β-CD
complex. Thus, the inclusion process with neutral econazole is more favorable than with
protonated econazole, which is consistent with literature observations[72]. More quantitatively
and specifically, we have found that Equation (2.14) can be transformed to

37
][*1][*
][1
][*
1 1:1
1:11:1
0
CDKCD
K
H
K
HKK
D
D App
a
a
Equation 2.19
Thus,
pHpKa
a
aApp KKK
K
H
K
HKK
K
101][
1
][*
1:11:11:1
1:11:1
1:1 Equation 2.20
where K1:1 is the binding constant of CD with neutral econazole, K+
1:1 is that with protonated
econazole, KApp
1:1 is the apparent binding constant of the complex, including CD with both
neutral and protonated form. After applying nonlinear least-squares curve fitting, as shown in
Figure 2.7, the K1:1, K+
1:1, and pKa values of econazole can all be obtained, which are (2.21
0.06) 103
M-1
, (0.47 0.09) 103
M-1
, and 6.75 0.08, respectively. The binding constant of
CD with protonated econazole is smaller than that with neutral form, which confirms our
previous qualitative conclusion that the inclusion complex between econazole and CD is
hydrophobically driven. The measured pKa (6.750.08) is statistically indistinguishable from
the literature value (6.69).

38
Figure 2.7 Effect of pH on the apparent binding constant of the econazole-HP-β-CD complex
Compared to the phase-solubility method, which can require days for the dissolving of
the drug to be saturated, this new technique is faster. Moreover, the drug amounts used in
solubility experiments are much greater than in this method. For instance, the highest econazole
concentration in a phase-solubility study is ~30 mM,[65] but in the phase-distribution
experiment, CS is less than 0.1 mM. In addition, the volume of the CD solution used in a
solubility study is typically 10 mL, which is 40 times more than in this distribution experiment.
These two factors have led to a 12000 fold decrease in material requirements. The equilibration
time is shorter in these phase-distribution studies probably because it does not involve the

39
equilibrium between solid and dissolved drug. For other phase-distribution methods, which study
the drug distribution between an organic solvent and an aqueous phase, the solvent-CD
complexation may lead to misinterpretation. In addition, entrainment and emulsion can be severe
problems for very hydrophobic compounds,[40] and the handling of small volumes of organic
solvent may be difficult.[27]
In phase-solubility studies, several factors influence the accuracy of the final result. One
such factor is the accurate and precise determination of the intrinsic solubility (S0). Similarly for
this approach, the variance of D0 may lead to misinterpretation of n and K1:i as well. Since the
drug concentration is usually low (~0.01-0.1 µM) when determining D0, some error is inevitable.
Ways to decrease the measurement error of D0 have been discussed elsewhere.[27] The most
important aspect in getting an accurate value for D0 is the sensitivity and selectivity of the
analytical method used to measure the concentrations of the solute. As far as precision is
concerned, the 96-well plate approach is beneficial, as it is easy to do repeat measurements.
Other potential errors may arise from the distribution process itself. The drug may adsorb to the
plate surface. We have determined that this does not occur for a series of compounds ranging in
their octanol-water partition coefficients over a logarithmic range of 0.5 to 3.2[48]. Another
potential source of error is that DOS may associate with CDs, and thus compete with the drug
and lead to inaccurate binding constants. In the experiments described herein, the CDs are in
great excess over the drug, so competition is minimized. Nonetheless, we have determined that
there is no detectable DOS extracted into aqueous solution containing 10 % (w/v) HP- -CD.
All of the experiments except the kinetic study were carried out at equilibrium. It is worth
noting that, in our experience, solute drug distribution at early times before equilibrium is
correlated with the equilibrium concentration. As Figure 2.3 shows, after only one hour of

40
equilibration it is already obvious that 10% DM--CD is best solubilizing agent for econazole.
Although we have not investigated this thoroughly, it seems clear that screening to determine the
rank order of the effectiveness of a series of potential solubilizers could be carried out much
more rapidly than the equilibrium studies that we have discussed herein.
2.4 CONCLUSIONS
We have successfully developed a new method to measure the binding constants of drug-
CD complexes in the aqueous phase using high-throughput technologies. This method measures
the distribution behavior of a drug between a polymer phase and an aqueous phase in 96-well
microplates. With four repeats, distribution ratios of econazole with respect to six CD-containing
buffers at four different concentrations can be determined simultaneously. Multivariate linear
regression has been established to give the binding constants of econazole to the six CDs
respectively. Both 1:1 and 1:2 complexes are found and the calculated K1:1 can be correlated to
some literature data from phase-solubility studies. The thermodynamic parameters of the
complexation process have been calculated, indicating that the complex formation is exothermic
and enthalpy driven (ΔH0>TΔS
0). The binding constants of econazole to HP-β-CD have
been also studied at various pH conditions. An acidic environment weakens the binding between
econazole with HP-β-CD due to more favorable inclusion process with neutral econazole than
with protonated form. Nonlinear fitting of the apparent binding constants with pH leads to
binding constants of both the neutral and protonated form and pKa of econazole. Compared to the
phase-solubility method, our protocol is much faster. Moreover, the material requirement
decreases four orders of magnitude. This method has great flexibility as well, for instance,

41
‘multiplex’ approaches are possible due to the much lower concentration of the drug relevant to
the CD concentration. In addition, this method is possible to be fully automated.

42
3.0 LIPOPHILICITY SCREENING OF NOVEL DRUG-LIKE COMPOUNDS AND
COMPARISION TO CLOGP
This chapter has been published in J. Chromatogr. A, 2012, 1258, 161. Reproduced with
permission from J. Chromatogr. A. Copyright (2012) Elsevier.
3.1 INTRODUCTION
Acid dissociation constants (pKas) and the logarithmic value of the 1-octanol/water
partition coefficient (log Pow) are important parameters in environmental, medical, toxicological
and pharmaceutical studies of novel organic molecules. Sixty-three percent of the molecules
listed in the 1999 World Drug Index are ionizable between pH 2 and pH 12[38]. Various ionized
forms of a compound may differ in physical, chemical, and biological properties, so it is
important to predict which ionic form of the molecule is present at the site of action. The
partition coefficient is often used in combination with the pKa value to predict the distribution of
a compound in a biological or ecological system. This knowledge can be valuable in the
estimation of drug absorption, distribution, metabolism, and excretion (ADME), or for the
estimation of the distribution of a solute in an ecological system.
Numerous methods exist to measure or estimate the pKa and log Pow values. The shake-
flask method and RP-HPLC method are the main experimental methods to determine partition
43
coefficients. The shake-flask procedure is a standard method to determine octanol/water partition
coefficients in the range of -2 to 4[46,74]. This method is the most reliable and accurate one,
however, it is tedious, time consuming, and requires large amounts of pure material. In addition,
octanol/water emulsions can be severe problems, especially for hydrophobic compounds,
limiting the upper measurable log Pow value to 4[40]. Recently, a micro-volume flow extraction
system consuming less than 1 mL of octanol and aqueous sample has been developed[75]. To
increase sample throughput, the traditional shake-flask method has been automated and scaled
down using 96-well plate technology and a robotic liquid handler[76]. However, the emulsion
problem still exists for scaled down shake flask method, especially for hydrophobic compounds.
The RPLC method is an indirect but popular way to measure log Pow values in the range
of 0-6[77]. This method is rapid and reproducible for sets of similar compounds, although
impurities may make the interpretation of the results difficult due to uncertainty in peak
assignments. However, it is not applicable to strong acids and bases, metal complexes,
substances that react with the eluent, or surface-active agents[40]. One further disadvantage with
this method is that the reference compounds should be preferably similar to those being studied
and difficulties arise if suitable standards are unavailable.
There are some theoretical approaches to predict lipophilicity. Most of them add up the
log Pow contribution from each fragment and then apply structure-based correction factors[46].
There are at least 20 software packages available at present, which provide convenient and fast
prediction of lipophilicity for novel compounds. However, studies show calculations are not
reliable for log Pow and pKa of zwitterionic, tautomeric and charged compounds as well as for
strong hydrogen-bonding compounds[78]. It was reported by investigators at Wyeth

44
Research[79] that the average difference between the calculated and measured log Pow values for
70 commercial drugs is about 1.05 log units.
Recently, our group has developed a high-throughput phase-distribution method based on
partition of the analyte between a polymer phase and an aqueous phase in a 96-well format. The
polymer phase is composed of poly (vinyl chloride) (PVC) and dioctyl sebacate (DOS) at the
ratio of 1:2 (w/w). Studies in our group[48] on the correlation of polymer/water partition
coefficient log Ppw and standard 1-octanol/water partition coefficient (log Pow) have shown a
good linear relationship with the slope of 0.933 and the intercept close to zero, indicating that
DOS plasticized PVC had lipophilicity similar to octanol. Therefore, our polymer/water partition
coefficient can be used to predict lipophilicity. This method has been applied to screen chiral
selectors[64] and to measure binding constants of drug-cyclodextrins inclusion complexes[80].
In this paper, we have first applied our method to determine pKa and lipophilicity of a
drug-like compound 2H-1, 2, 6-thiadiazine, 3-methyl-5-phenyl-, 1, 1-dioxide (Figure 3.1).
Compounds with the 2H-1, 2, 6-thiadiazine-1, 1-dioxide substructure are prominently featured in
patent and medicinal chemistry as hepatitis C virus (HCV) polymerase inhibitors[81], non-
nucleoside HIV-1 reverse transcriptase inhibitors[82], analgesics[83], and smooth muscle
relaxants[84]. We have further used this high-throughput method to screen lipophilicity of a
library of twenty-four novel drug-like compounds. Their Log Dpw values (at pH 4.0, 7.0, 10.0)
can be measured with good reproducibility in a high-throughput and automated format. We have
found that there is a relatively poor correlation between those experimental values and calculated
values with various methods.

45
Figure 3.1 Chemical structure of 2H-1, 2, 6-thiadiazine, 3-methyl-5-phenyl-, 1, 1-dioxide.
3.2 EXPERIMENTAL
3.2.1 Materials
Acetonitrile (HPLC grade), tetrahydrofuran (THF) (HPLC grade) and dimethyl sulfoxide
(DMSO) (anhydrous, 99.9%) were purchased from Aldrich (Milwaukee, WI). PVC (high
molecular weight) and dioctyl sebacate (DOS) were purchased from Fluka (Ronkonkoma, NY).
HPLC grade trisodium phosphate, phosphoric acid, trifluoroacetic acid (TFA) were also
purchased from Fluka (Ronkonkoma, NY). Water used in all the experiments was purified with a
Milli-Q Synthesis A10 system (Millipore, Bedford, MA). Costar polypropylene 96-well
microplates (flat bottom, 330-µL well volume) were purchased form Fisher Scientific Co.
(Pittsburgh, PA). Storage plate cap strips were purchased from Thermo Scientific Co. (Waltham,
MA). 2H-1, 2, 6-thiadiazine, 3-methyl-5-phenyl-, 1, 1-dioxide and a library of twenty-four drug-
like compounds were synthesized in the University of Pittsburgh Center for Chemical

46
Methodologies and library Development (UPCMLD) (Pittsburgh, PA). See Table 3.1 and 3.2 for
structures and PubChem SID numbers.

47
Table 3.1 Experimental Design of 24 compounds in a 96-well microplate
Wells 1-4 Wells 5-8 Wells 9-12
A
B
C
D
E
F
G

48
H
Table 3.2 PubChem SID of 24 compounds in a 96-well microplate
Wells 1-4 Wells 5-8 Wells 9-12
A
A 26696971 26681202 17390303
B
B 26696976 26683722 26696997
C
C 26696951 26683740 26681305
D
D 26696995 8142836 26681407
E
E 26696950 8142904 26681268
F
F 87341695 26696959 26681269
G
G 26696948 8143072 26681280
H
H 26697001 8143105 8143071

49
3.2.2 Equipment
An UltraSpense 2000 microplate dispenser (KD Scientific, Holliston, MA) was used to
prepare polymer films in 96-well plates. A Deep Well Maximizer (or BioShaker) (Model:
M·BR-022 UP, made by Taitec, Japan, and distributed by Bionexus, Inc., Oakland, CA) was
used to speed up the solute distribution kinetics and control temperature. An HT-4X evaporator
(Genevac inc., Gardiner, NY) was used to evaporate organic solvents. An X-LC (Jasco, Inc.)
UHPLC system was used to determine the solute concentration with a UHPLC C18 column (1.0
× 50 mm, particle size: 1.7 µm, Waters, Milford, MA). UV absorbances of solutes were acquired
with a SpectraMax M2 microplate reader (Molecular Devices, Sunnyvale, CA) in UV-
transparent microplates.
3.2.3 Buffer Preparation
The phosphate-citrate buffer solutions (20 mM, pH 2.7, 2.8, 3.2, 3.9, 4.0, 5.1, 6.1, 7.0, 7.2)
were made by mixing appropriate amounts of 20 mM sodium phosphate dibasic solution and 10
mM citric acid solution. The phosphate buffer solutions (20 mM, pH 1.9, 2.5, 9.2, 10.0) were
made by mixing appropriate amounts of 20 mM trisodium phosphate solution and 20 mM
phosphoric acid solutions. The trifluoroacetic acid (TFA) buffer solutions (pH 0.9, 1.1) were
made by preparing 0.2%, 0.1% TFA in water (v/v) respectively.
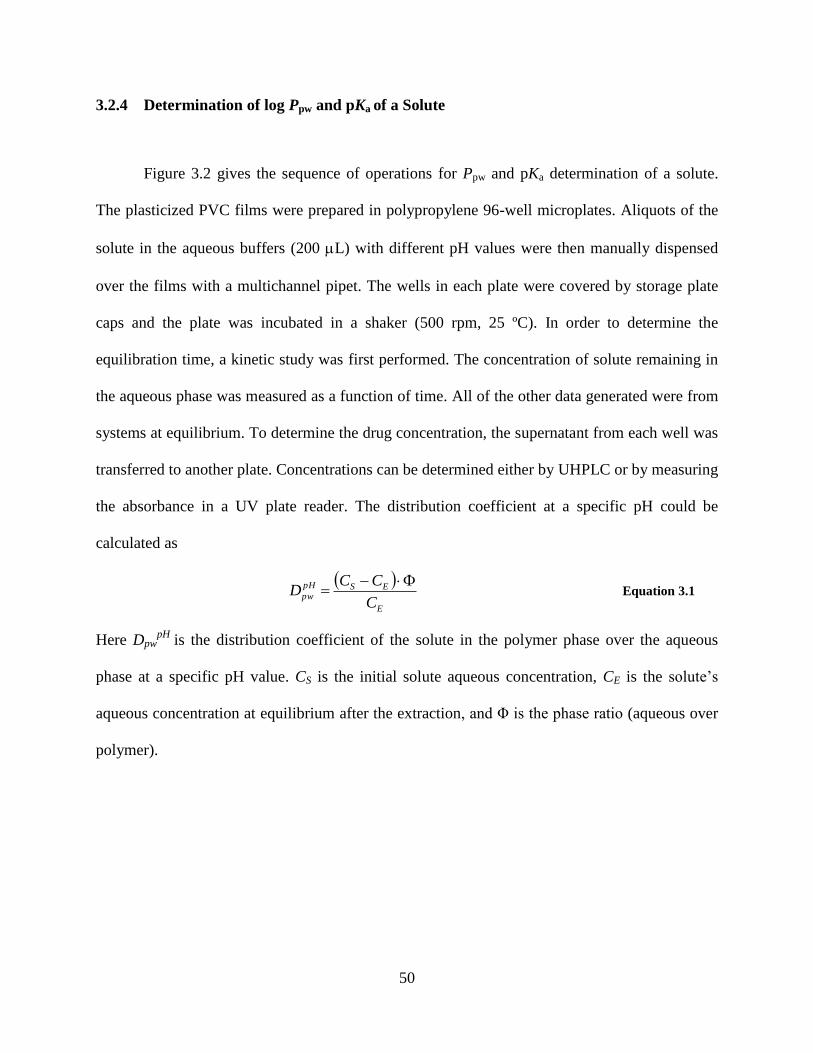
50
3.2.4 Determination of log Ppw and pKa of a Solute
Figure 3.2 gives the sequence of operations for Ppw and pKa determination of a solute.
The plasticized PVC films were prepared in polypropylene 96-well microplates. Aliquots of the
solute in the aqueous buffers (200 L) with different pH values were then manually dispensed
over the films with a multichannel pipet. The wells in each plate were covered by storage plate
caps and the plate was incubated in a shaker (500 rpm, 25 ºC). In order to determine the
equilibration time, a kinetic study was first performed. The concentration of solute remaining in
the aqueous phase was measured as a function of time. All of the other data generated were from
systems at equilibrium. To determine the drug concentration, the supernatant from each well was
transferred to another plate. Concentrations can be determined either by UHPLC or by measuring
the absorbance in a UV plate reader. The distribution coefficient at a specific pH could be
calculated as
E
ESpH
pwC
CCD
Equation 3.1
Here DpwpH
is the distribution coefficient of the solute in the polymer phase over the aqueous
phase at a specific pH value. CS is the initial solute aqueous concentration, CE is the solute’s
aqueous concentration at equilibrium after the extraction, and Φ is the phase ratio (aqueous over
polymer).

51
Figure 3.2 Schematic of the preparation and use of polymer films in 96-well plates for Log Dpw
determination.

52
3.2.5 UHPLC Method to Determine Concentrations of the Thiadiazine
A Waters UHPLC C18 column was used for this method. The mobile phase was
acetonitrile-ammonium acetate buffer (pH 4.92; 10 mM) (20:80, v/v), with a flow rate of 0.1
mL/min. The back-pressure was approximately 4300 psi. The injection volume was 2 µL.
Detection was by UV absorbance at 343 nm, at which the solute peak had best signal-to-noise
ratio. Peak area was used for the calibration and determination of sample concentration. The time
per analysis was ~1.3 min.
3.2.6 UV Plate Reader Method to Determine Concentrations of the Thiadiazine
UV absorbances of the solute at 343 nm were used for calibration and determination of
solute concentrations. They were acquired with a microplate reader in UV-transparent 96-well
plates. Absorbances of the buffers were measured as the background and subtracted to get the
absorbances of the solute.
3.2.7 Lipophilicity Screening of the Library
Ten nmol of 24 compounds in 20 µL DMSO were placed in a 96-well microplate
according to the experimental design shown in Table 3.1. The PubChem SID numbers of those
compounds are shown in Table 3.2. According to the experimental design shown in Figure 3.2, a
THF solution of plasticizer and PVC was then dispensed into the plate, which was gently shaken
for a few minutes to let the compound and the polymer dissolve in THF/DMSO mixed solvent.
An evaporator was then used to evaporate THF and DMSO, leaving homogeneous polymer films
53
with dissolved solutes formed at the bottom of the wells. Aliquots of the aqueous buffer solutions
(pH 4.0, 7.0, 10.0) were then dispensed on top of the polymer films in the plate. The plate was
covered and incubated in a shaker (500 rpm, 25 ºC) for 4 hours. To determine the solute
concentration, the supernatant from each well was transferred to another UV-transparent plate by
a multichannel pipet and put in the plate reader for UV determination at 250 nm, at which sample
peaks showed the best signal-to-noise ratios. If all of the solute was extracted into the 100 µL of
aqueous phase, the solute concentration in the aqueous buffer would be 100 µM.
3.3 RESULTS AND DISCUSSION
3.3.1 Theories to Determine Partition Coefficient and pKa of a Solute simultaneously
2H-1, 2, 6-thiadiazine, 3-methyl-5-phenyl-, 1, 1-dioxide is a weakly acidic amide due to
its sulfonamide group. It will be largely ionized in an environment having pH larger than its pKa.
In practice not only neutral molecules but also ion pairs may partition. The distribution of the
neutral and the ionized form between the polymer film phase and the aqueous phase is
determined by the distribution coefficient Dpw:
][][
][][
HSS
HSSD
filmfilm
pw
Equation 3.2
Where [HS] and [HS] film are the drug concentrations in the aqueous phase and film phase,
respectively; [S-] and [S
-] film are the concentrations of the ionized drug and its ion pair in the
aqueous phase and film phase. The partition coefficient for the neutral drug is defined as:
][
][
HS
HSP
film
pw Equation 3.3

54
The partition coefficient for the anionic drug and its ion pair is defined as:
][
][
S
SP
film
pw Equation 3.4
It is known that the equilibrium equation for acid dissociation constant Ka is
Aq
Aq
aS
HSK
][
][][
Equation 3.5
Inserting Equation (3.3), (3.4), and (3.5) into Equation (3.2):
pKapH
pwpw
pwa
apwpwpwpw
pw
PPP
H
K
H
KPP
HS
S
HS
SPP
D
101
][1
][
][
][1
][
][
Equation 3.6
By plotting Dpw versus pH, the Ppw, Ppw- and pKa values of the solute can be obtained by
applying a nonlinear least-squares curve fitting according to Equation (3.6).
3.3.2 Determination of log Ppw and pKa of a solute in a 96-well format
A kinetic study was first performed to determine the time needed for the phase
distribution of the solute to reach equilibrium. The results show that 2 h were enough for the
distribution experiments to reach equilibrium. Based on the kinetic data, all other distribution
experiments were performed for 4 h.

55
Figure 3.3 Distribution coefficients of 2H-1, 2, 6-thiadiazine, 3-methyl-5-phenyl-, 1, 1-dioxide at
various pH values analyzed by UHPLC.

56
Figure 3.4 Distribution coefficients of 2H-1, 2, 6-thiadiazine, 3-methyl-5-phenyl-, 1, 1-dioxide at
various pH values determined by plate reader.
Distribution coefficients of the compound, 2H-1, 2, 6-thiadiazine, 3-methyl-5-phenyl-, 1,
1-dioxide were determined at various pH values, analyzed by both UHPLC and UV plate reader.
The results obtained by UHPLC and plate reader are shown in Figure 3.3 and 3.4 respectively.
Each measurement was repeated twice and the corresponding error bars indicate the standard
error of the mean (SEM). The SEM values were then used in error propagations to determine the
errors of the calculated distribution coefficients. It is shown that distribution coefficient of the
compound decreases with increasing pH of the buffer, indicating more ionic form existing in the

57
higher pH range, which is consistent with the fact 2H-1, 2, 6-thiadiazine, 3-methyl-5-phenyl-, 1,
1-dioxide is an acidic amide. Applying nonlinear least-squares curve fitting based on Equation
(3.6), the Ppw, Ppw- and pKa values of the solute were obtained. The pKa values of the solute are
2.94 0.10 and 2.52 0.17, determined by HPLC and plate reader measurements of the
equilibrium concentration of the solute in the aqueous phase respectively. The log Ppw values are
1.04 0.02 and 1.10 0.03 respectively. Both of the Ppw- values are statistically zero (p > 0.05),
indicating most of the ionized solute stays in the aqueous phase rather than the polymer film
phase.
To our knowledge, there have been no reported experimental log P and pKa values for
2H-1, 2, 6-thiadiazine, 3-methyl-5-phenyl-, 1, 1-dioxide. Compared to the calculated log Pow
(1.10 0.75) using ACD software (Advanced Chemistry Development inc., Toronto, Canada),
our results are consistent and showed better precision. The calculated pKa value from ACD
software and ADMET PredictorTM
software (Simulations Plus inc., Lancaster, CA) are 5.13 and
0.25 respectively, which are quite different from each other, while our results are in the middle.
2H-1, 2, 6-thiadiazine, 3-methyl-5-phenyl-, 1, 1-dioxide is a tautomeric and ionizable compound
with both acidic and basic centers. It is known that predictions are not particularly good for
partition coefficients and pKa values of zwitterionic, tautomeric and charged compounds[78].
The UHPLC method gives better sensitivity than the optical absorbance measurements[48].
Unlike the plate reader method, it does not suffer from the potential for interfering compounds
biasing the result. The higher sensitivity translates into the method’s capability to measure a
wider dynamic range of log Ppw values in comparison to the optical absorbance approach [10].
On the other hand, compared to the plate reader, the UHPLC measurement generates lower
throughput due to method development time. Thus both approaches have strengths. For detailed

58
analysis of a single compound, the UHPLC method may be better, but for screening large
numbers of dissimilar compounds, the optical absorbance method is preferred unless the molar
absorptivities of the solutes are too low.
3.3.3 Optical Absorbance-based Lipophilicity Screening of a Library of Drug-like
Compounds
Figure 3.5 Correlation of distribution coefficients between different runs.
The experimental log D results (pH 4.0, pH 7.0, and pH 10.0) of all of these compounds
have been successfully obtained. As shown in Figure 3.5, good linearity was found for a plot of
log D for each compound in separate runs with a correlation coefficient of 0.97. A slope of 1.00

59
± 0.05 and an intercept of -0.04 ± 0.10 (p>0.05, statistically zero) was found, showing good
reproducibility of our method. The experimental log DpH7.0 results are located in the range of 0.68
to 3.12. According to Lipinski’s rule of five[85,86], drug-like molecules should have log D
values less than five for reasonable absorption and permeation. These compounds have
appropriate log D values to be considered as drug-like compounds. Errors in the quantitative
determination of solute concentrations contributed to the limits for the applicable log D range of
our method. For example, if the log D value is equal to -1 at the phase ratio equal to 16, the final
concentration after the extraction would be 99.4% of the initial concentration calculated from
Equation (3.1), meaning the error could not be higher than 0.3%, which is not easy to achieve
with optical absorbance. Therefore, the measurable log D range of our method is three units at
one fixed phase ratio. Of course, it is easy to alter the phase ratio by changing the volume of the
aqueous phase and the polymer phase. For example, this method successfully measured the
lipophilicity of the hydrophobic drug econazole (log P = 4.83)[48]. This is a challenge for the
shake-flask method.
Compared to other experimental methods, this method shows several advantages. The
technique is faster, more automated, and compatible with microplates unlike the standard shake-
flask method. This method also demonstrates capability of determining log D for charged
compounds which is a challenge for the RPLC method.
Our experimental results and calculated log D values by MarvinView software
(ChemAxon Ltd., Budapest, Hungary) and the correlation are represented in Table 3.3 and
Figure 3.6 respectively. There were rather poor correlations between measured (y) and calculated
(x) log D values with y=1.86 +0.08*x (r=0.16), y=1.64+0.19*x (r=0.50), y=1.79+0.11*x
(r=0.37), for pH 4.0, 7.0, and 10.0 respectively. The average difference between the calculated

60
and measured values is 1.04 log units, which is similar to the reported difference (1.05 log units)
for 70 commercial drugs[79]. Computational approaches will always be approximate because
new compounds may contain substructures that are not covered by the software. Therefore, an
accurate contribution of each substructure of the new compounds may not exist. Moreover, it is
known that theoretical predictions are not reliable for distribution coefficients and pKa values of
zwitterionic, tautomeric and charged compounds[78], like most of the compounds in this library.
Table 3.3 Experimental and calculated log D results for 24 compounds at pH 4.0, 7.0, 10.0
pH 4.0 pH 7.0 pH 10.0
Wells Measured Calculated Measured Calculated Measured Calculated
A 1-4 1.87 1.82 1.62 0.28 1.80 -0.55
B 1-4 3.04 3.34 2.79 3.34 2.75 1.10
C 1-4 2.47 3.38 0.93 0.87 0.99 -0.21
D 1-4 2.21 2.39 2.22 2.39 2.21 2.39
E 1-4 1.40 1.55 1.78 -0.16 1.88 -1.47
F 1-4 2.00 2.56 2.01 2.72 1.96 2.72
G 1-4 2.54 2.91 2.57 2.91 2.58 2.91
H 1-4 2.40 2.55 2.12 2.55 2.26 2.55
A 5-8 2.22 3.00 2.16 3.00 1.90 3.00
B 5-8 1.60 2.89 1.94 2.89 1.75 2.89
C 5-8 2.45 2.78 2.22 2.80 2.08 2.80
D 5-8 1.38 1.78 1.37 1.83 1.40 1.83
E 5-8 2.18 -0.84 2.14 1.82 2.20 2.09
F 5-8 1.75 2.03 1.94 2.41 1.89 2.41
G 5-8 1.69 2.72 1.19 0.01 1.16 -0.41
H 5-8 1.94 1.33 1.92 -1.40 1.76 -1.91

61
A 9-12 3.18 2.41 3.12 2.41 3.02 2.41
B 9-12 1.76 1.29 2.01 0.75 2.01 -1.98
C 9-12 1.99 1.16 2.02 1.22 1.89 1.22
D 9-12 2.06 2.97 2.10 2.97 2.01 2.97
E 9-12 2.00 -1.15 2.05 -1.15 2.09 -1.15
F 9-12 2.14 0.62 2.09 0.62 2.08 0.62
G 9-12 1.59 1.59 1.45 1.59 1.49 1.59
H 9-12 0.56 2.72 0.68 0.01 0.77 -0.41
Figure 3.6 Correlation of distribution coefficients between our experimental values and calculated
values.
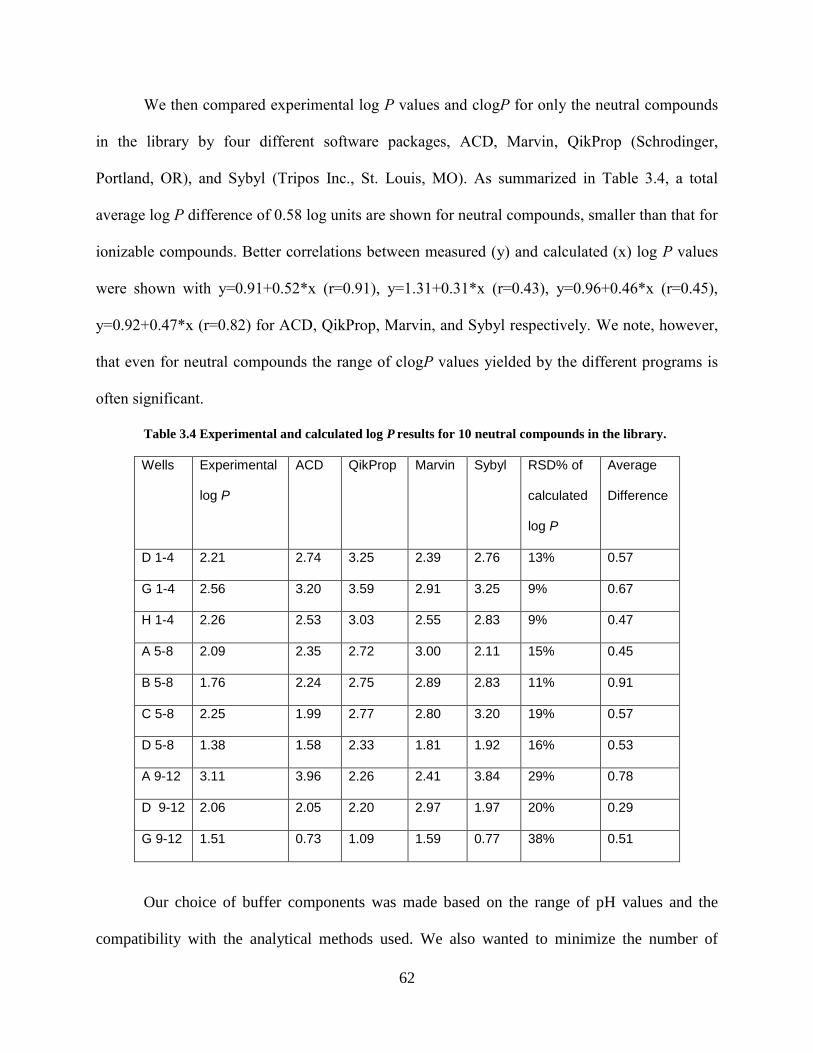
62
We then compared experimental log P values and clogP for only the neutral compounds
in the library by four different software packages, ACD, Marvin, QikProp (Schrodinger,
Portland, OR), and Sybyl (Tripos Inc., St. Louis, MO). As summarized in Table 3.4, a total
average log P difference of 0.58 log units are shown for neutral compounds, smaller than that for
ionizable compounds. Better correlations between measured (y) and calculated (x) log P values
were shown with y=0.91+0.52*x (r=0.91), y=1.31+0.31*x (r=0.43), y=0.96+0.46*x (r=0.45),
y=0.92+0.47*x (r=0.82) for ACD, QikProp, Marvin, and Sybyl respectively. We note, however,
that even for neutral compounds the range of clogP values yielded by the different programs is
often significant.
Table 3.4 Experimental and calculated log P results for 10 neutral compounds in the library.
Wells Experimental
log P
ACD QikProp Marvin Sybyl RSD% of
calculated
log P
Average
Difference
D 1-4 2.21 2.74 3.25 2.39 2.76 13% 0.57
G 1-4 2.56 3.20 3.59 2.91 3.25 9% 0.67
H 1-4 2.26 2.53 3.03 2.55 2.83 9% 0.47
A 5-8 2.09 2.35 2.72 3.00 2.11 15% 0.45
B 5-8 1.76 2.24 2.75 2.89 2.83 11% 0.91
C 5-8 2.25 1.99 2.77 2.80 3.20 19% 0.57
D 5-8 1.38 1.58 2.33 1.81 1.92 16% 0.53
A 9-12 3.11 3.96 2.26 2.41 3.84 29% 0.78
D 9-12 2.06 2.05 2.20 2.97 1.97 20% 0.29
G 9-12 1.51 0.73 1.09 1.59 0.77 38% 0.51
Our choice of buffer components was made based on the range of pH values and the
compatibility with the analytical methods used. We also wanted to minimize the number of

63
buffer components use across the total range of pH values. Ultimately, we chose phosphate and
phosphate/citrate which are adequate for the entire pH range investigated except near pH 10. We
determined that the poor buffer capacity of phosphate at pH 10 was not a limitation. From Table
3.3, the lowest clog DpH10 is about -2. Using Eqn.1, the aqueous concentration for this solute
would be 100 µM at equilibrium (phase ratio = 20). The phosphate buffer concentration is 20
mM. So the solute concentration is at most 0.5% of the buffer concentration. The pKa values of
phosphoric acid are 2.1, 7.2, and 12.2. At pH 10, [HPO42-
]/ [PO43-
] =158. From the structures
shown in Table 3.1, most of our solutes in the library are amines. If the solute has the same basic
strength as NaOH, which is the worst case, 0.5% of the acidic ion will be neutralized, pH=12.2-
log (157.2/1.8)=10.26. The small change of pH will not influence the measured distribution
coefficient unless the pKa of the solute is around 10. In that case, only about half of the solute
can neutralize the acidic ion in the buffer (0.25%), pH=12.2-log (157.6/1.4)=10.15. In
conclusion, despite the phosphate buffer’s low strength at pH 10.0 distribution coefficients will
be measured accurately in our experiment because of the solute and buffer concentrations used.
3.4 CONCLUSIONS
We have successfully developed a phase-distribution method to measure simultaneously
pKa and lipophilicity of drug-like compounds using well-plate technologies. This method has
been applied successfully to measure pKa and log Ppw values of a drug-like compound, 2H-1, 2,
6-thiadiazine, 3-methyl-5-phenyl-, 1, 1-dioxide. Moreover, the distribution coefficients of a
library of novel drug-like compounds were determined by this approach. This method is fast,
64
requires only a small amount of material, has great flexibility, and has the potential to be fully
automated; thus showing great potential in the pharmaceutical and environmental fields.
65
4.0 FLUOROUS RECEPTOR-FACILITATED SOLID PHASE MICROEXTRACTION
This chapter has been published in J. Chromatogr. A (DOI:10.1016/j.chroma.2014.07.060).
Reproduced with permission from J. Chromatogr. A. Copyright (2014) Elsevier.
4.1 INTRODUCTION
Sample preparation is an essential step in the analysis process. Solvent-free extraction is
considered to be a green analytical method as it prevents hazards to the environment and human
health. Solid phase microextraction (SPME) is a widely accepted solvent-free extraction
technique that usually uses a polymer sorbent as the extraction phase. Various configurations of
SPME have been considered to date, including coated fibers and vessels[3].
The selection of sorbent polymer material is the most important step controlling the
selectivity of the extraction[8]. One of the recent trends in SPME is to study new coatings with
higher extraction efficiency and selectivity[9]. Recently developed coatings for selective
extraction include molecularly imprinted polymers (MIP)[10-17], ionic liquids[19-23], metal
complexes[24], and carbon nanotubes[25,26]. We showed some time ago that a molecular
receptor for barbiturates embedded in the extraction phase enhances the selectivity of SPME for
barbiturates that bind well to the receptor[87]. Such receptors are potentially very powerful tools
for selective extractions by taking advantage of noncovalent bonding between a receptor and an

66
analyte. However, while receptors can improve selectivity by augmenting the distribution
coefficient of the selected analytes, the matrix in which the receptor resides plays a role as well.
Ideally, the matrix would decrease the distribution coefficient for uninteresting analytes while
the receptor increases the distribution coefficient of interesting analytes. This notion guided us to
fluorous solvents and materials as potential matrices for SPME.
Fluorous solvents are the least polar practical solvents known[88]. Fluorous liquids are
virtually immiscible with both aqueous and most organic phases. Due to their extreme nonpolar
character, noncovalent associations including hydrogen bonding tend to be enhanced in fluorous
media[89]. Molecular recognition has been combined with fluorous matrices to improve
extraction selectivity by reducing the interfering species extracted. Palomo et al. reported that the
fluorous solubility of fluorinated N, N’-dialkylureas could be enhanced by embedding
perfluoroalkanoic acids in perfluorohexanes (FC-72) due to formation of hydrogen bonded
complexes[90]. O’Neal and coworkers also reported that a carboxylic acid terminated poly-
hexafluoropropylene oxide, Krytox 157 FSH (1), significantly enhances the extraction of
pyridines from chloroform into FC-72 by forming a hydrogen bond between the pyridine ring
and the carboxylic acid group[91].
Teflon AF 2400 (2) is a chemically inert and thermally stable amorphous fluorinated
polymer. It is a copolymer of tetrafluoroethylene (13%) and 2, 2-bistrifluoromethyl-4, 5-
difluoro-1, 3-dioxole (87%)[92]. Homogeneous thin films of Teflon AF 2400 are easily prepared
through solvent casting[93]. They are transparent through a wide UV-Vis and IR range[94],
making them ideal to study noncovalent associations. Teflon AF 2400 has a high fractional free
volume (FFV) probably due to its rigid structure of the dioxolane ring and the weak van der
Waals interactions between fluorous polymeric chains[18]. Krytox 157 FSH is thermally stable

67
and can be easily incorporated into Teflon AF 2400 films. Krytox 157 FSH and Teflon AF 2400
were found to be miscible in any proportion[95].
We are interested in developing receptor-doped fluorous films for solid phase
microextraction. The hydrophobic and lipophobic properties of the fluorous films will reduce the
polymer-water distribution coefficient of all solutes except the ones that can form noncovalent
interaction with the fluorous receptor, making extractions selective.
We recently reported a 96-well parallel design to measure distribution coefficients of
novel drug-like compounds between a plasticized polyvinyl chloride (PVC) film and an aqueous
phase[96]. This parallel design is fast and only requires small amounts of sample. In this work,
we have applied this parallel approach to create a 96-well vessel SPME to study distribution
between receptor-doped fluorous polymer phase and an aqueous phase. Based on previous
results on hydrogen bonding of pyridine and pyridine derivatives with carboxylic acids in the
fluorous liquids[91], we chose to study the distribution behavior of quinoline (3), an
environmental contaminant and a probable human carcinogen[97], between a fluorous polymer
phase composed of Krytox 157FSH doped Teflon AF 2400 and an aqueous phase.
We found that the addition of a fluorous carboxylic acid to the film increased the
polymer-water distribution coefficients of the nitrogen heterocycle. We studied the effects of
receptor concentration and solute concentration on the distribution coefficients based 96-well
vessel SPME. We then coated this receptor doped fluorous polymer on a stainless steel fiber for
SPME. Compared to a commonly used SPME fiber made of polydimethylsiloxane (PDMS),
Krytox 157-FSH doped Teflon AF 2400 showed a preference for the nitrogen heterocyclic
compound over a non-heterocyclic control, phenol. To our knowledge, this is the first reported
receptor-doped fluorous SPME.
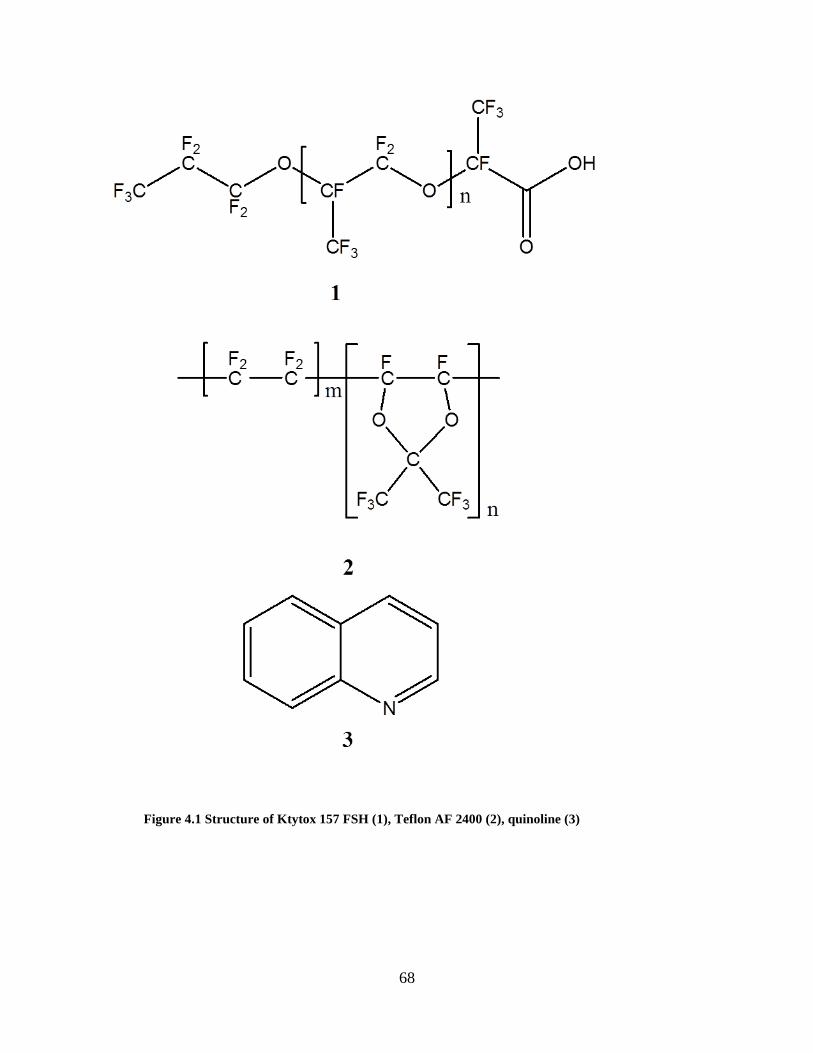
68
Figure 4.1 Structure of Ktytox 157 FSH (1), Teflon AF 2400 (2), quinoline (3)

69
4.2 EXPERIMENTAL
4.2.1 Chemicals and Solutions
Quinoline and tris (hydroxymethyl) aminomethane hydrochloride buffer substance (Tris
buffer) were obtained from Aldrich (Milwaukee, WI). Phenol and nitric acid were bought from
EM Science (Cherry Hill, NJ). Krytox 157FSH was purchased from Miller-Stephenson Chemical
Co., Inc. (Danbury, CT) with a number averaged molecular weight of 5150 g/mol based on an
average of 29 polymer repeat units determined by 19
F-NMR[98]. Teflon® AF 2400 was
purchased from DuPont (Wilmington, DE). Fluorinert FC-72 (a mixture of perfluorohexanes)
was purchased from 3M (St. Paul, MN). Aqueous tris(hydroxymethyl)aminomethane buffer (tris
buffer hereafter) solutions (50.0 mM, pH = 8.0) were prepared by dissolving tris buffer pH 8.0
substance (Sigma Aldrich, Milwaukee, WI) in purified water (Milli-Q water) from a Millipore
Synthesis A10 system (Millipore, Billerica, MA). Quinoline and phenol solutions with a variety
of concentrations were prepared in this tris buffer.

70
4.2.2 96-well Vessel SPME: Preparation and Extraction
Figure 4.2 General procedure for 96-well vessel SPME.

71
As outlined in Figure 4.2, receptor-doped fluorous polymer films were prepared in Costar
polypropylene 96-well microplates (flat-bottom, 330 µL well volume). Both Teflon AF 2400 and
Krytox 157FSH were initially prepared in FC-72 at a concentration of 10 mg/mL. These
solutions were combined to give 200 L of a solution that would yield films with ratios of 0.0%.
12.5%, 25%, 37.5%, 50%, 75%, 100% (w/w) Krytox. Final film weights are therefore 2.0 mg.
After the polymer films were formed, 200 μL aliquots of the aqueous solute-containing films
solutions were added to undivided wells. Plates were sealed by a cover and equilibrated in a
shaker (BioShaker MBR-022U, made by Taitec and distributed by Bionexux Inc., Oakland, CA)
at 500 r/min at 25.0 °C. In order to determine the necessary equilibration time, the percentage of
quinoline extracted into the polymer phase was measured as a function of time. Other than in this
experiment, all data were generated at equilibrium. After equilibrium was achieved, 100 μL
aliquots from each well were transferred into a UV-transparent microplate by a multichannel
pipette. To determine the solute concentrations, UV absorbance was measured by a SpectraMax
M2 microplate reader (Molecular Devices, Sunnyvale, CA). The distribution coefficient could be
calculated as
E
ESpw
C
CCD
Equation 4.1
Here Dpw is the distribution coefficient of the solute in the polymer phase over the aqueous phase.
CS is the initial solute aqueous concentration, CE is solute aqueous concentration at equilibrium
after the extraction, and Φ is the volume phase ratio (aqueous over polymer).
The volume of each film was estimated as
Ld
VmLmgV
film
solutionfilm 1
/10
Equation 4.2
72
Here Vsolution is the volume of the FC-72 solution used in each well and dfilm is the density of the
film, which is estimated to be 2 g/mL. In this work, 200 μL of the FC-72 solution was dispensed
in each well, so the volume of each film was about 1 μL. The phase ratio was 200 as 200 μL of
the aqueous solution was used.
4.2.3 Coated Fiber SPME-GC: Fiber Preparation, Extractions, and Desorption on GC
The stainless steel wires were first soaked in 4 M HNO3 to clean and passivate the steel.
They were then rinsed with Milli-Q water and dried in the air. The exposed stainless steel fibers
were then dip-coated 15 times with a Krytox 157FSH-doped Teflon AF 2400 solution (10
mg/mL) in FC-72 (0 and 50% (w/w) Krytox in Teflon AF). For each of the 15 “dips”, the fibers
were immersed into the solution, then quickly removed after 2 seconds and dried in the air for 1
minute to evaporate the FC-72. Before use, each F-SPME fiber was exposed in a Thermo Focus
GC inlet for conditioning at 250 °C for 30 min with a constant split flow of 60 mL/min and a
split ratio of 20. Krytox 157FSH is thermally stable and does not desorb in the inlet of the gas
chromatograph. The GC injection splitter was opened during the conditioning step to reduce the
amount of impurities getting to the column. A commercially available SPME fiber with a
polydimethylsiloxane (PDMS) coating (Sigma Aldrich, Bellefonte, PA) was used as a control to
compare with those fibers with fluorous coatings. It was used at the same conditioning and GC
conditions as the Krytox doped Teflon films.
For the F-SPME extraction, the fibers were exposed to either the headspace or the liquid
phase of a tris buffer solution (pH = 8.0) containing 100 μM quinoline and 100 μM phenol. GC
conditions: were 250 °C inlet temperature, 100 °C initial oven temperature, hold 0.5 min, ramp

73
120 °C/min to 250 °C, hold 0.1 min, 60 mL/min split flow, split ratio = 20, in a 30 m long, 0.32
mm ID Rxi-5ms column (df = 0.25 μm) (Restek, Bellefonte, PA).
Peak areas obtained from the integrated chromatograms were used for quantitation. The
calibration curves were first carried out for both quinoline and phenol standard solutions,
respectively. The amount of the compound was correlated to the corresponding peak area.
Standard solutions were first prepared and injected to determine the linearity and limit of
quantitation (LOQ) for quinoline and phenol. Good linearity has been observed for quinoline in
the weight range of 0.33 ng (LOQ) to 25 ng, with a correlation coefficient close to unity
(R2>0.9999). Good linearity has also been found for phenol in the weight range of 0.22 ng (LOQ)
to 20 ng, with a correlation coefficient close to unity (R2>0.9999). Selectivity of quinoline over
phenol was described as the ratio of the extracted amounts.

74
4.3 RESULTS AND DISCUSSION
4.3.1 96-well Vessel SPME
Figure 4.3 Percentage of quinoline extracted as a function of time for Teflon AF films with different
percentages of receptor doped.
A kinetic study was first carried out to determine the time needed to reach equilibrium for
the extraction of quinoline from the aqueous solution to Teflon AF films with different
percentage of receptor doped. As shown in Figure 4.3, ten hours were sufficient. There was
almost no extraction of quinoline into a Teflon AF film without the receptor. The equilibrium
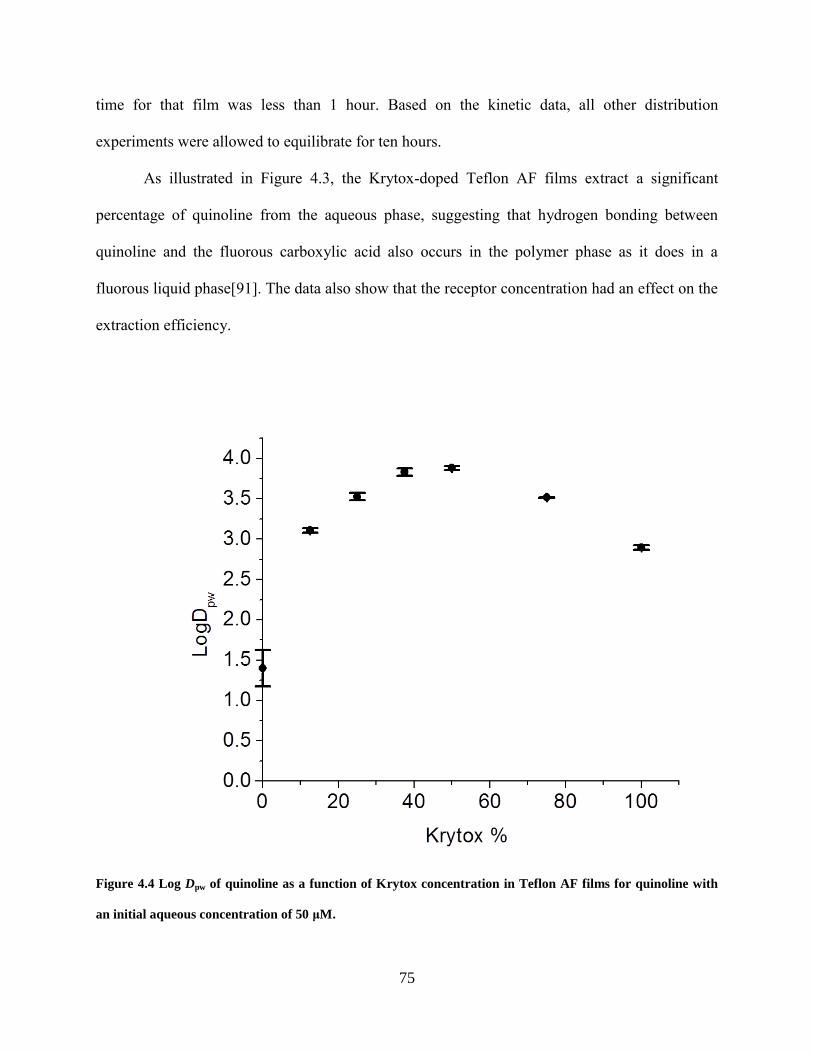
75
time for that film was less than 1 hour. Based on the kinetic data, all other distribution
experiments were allowed to equilibrate for ten hours.
As illustrated in Figure 4.3, the Krytox-doped Teflon AF films extract a significant
percentage of quinoline from the aqueous phase, suggesting that hydrogen bonding between
quinoline and the fluorous carboxylic acid also occurs in the polymer phase as it does in a
fluorous liquid phase[91]. The data also show that the receptor concentration had an effect on the
extraction efficiency.
Figure 4.4 Log Dpw of quinoline as a function of Krytox concentration in Teflon AF films for quinoline with
an initial aqueous concentration of 50 μM.

76
We then carried out a more detailed study about the influence of the receptor
concentration on the distribution coefficient. As shown in Figure 4.4, log D of quinoline
partitioning into the pure Teflon AF film is small. The polymer-water distribution coefficient of
quinoline increases with higher receptor concentration in the film, but the trend is reversed when
there is more than 50% (w/w) receptor in the film. Therefore, the highest polymer-water
distribution coefficient appears at Teflon AF film with 50% Krytox (w/w), which corresponds to
a receptor concentration of 194 mM. At this optimal concentration and at equilibrium, 97.4% of
the quinoline initially in the aqueous phase was extracted into the receptor doped fluorous film
from the aqueous phase. In fact, as we describe later, the extraction is so effective that the
distribution coefficient becomes dependent on the concentration of the analyte. In order to
further elaborate the data, we have derived a theoretical model as below.
The distribution of the free solute between the fluorous polymer film phase and the
aqueous phase is determined by the distribution coefficient D0:
aq
f
S
SD
][
][0 Equation 4.3
where [S]aq and [S]f are the free solute concentration in the aqueous phase and film phase,
respectively. When the receptor is added to the polymer film phase, solute and receptor forms a
complex and the binding constant is defined as:
n
ff
fn
nLS
LSK
][][
][:1
Equation 4.4
where n is the stoichiometry, [L]f is the free receptor concentration and fnLS ][ is the solute-
receptor complex concentration in the polymer phase. When the receptor is present in the
polymer phase, the apparent solute distribution coefficient Dapp is:
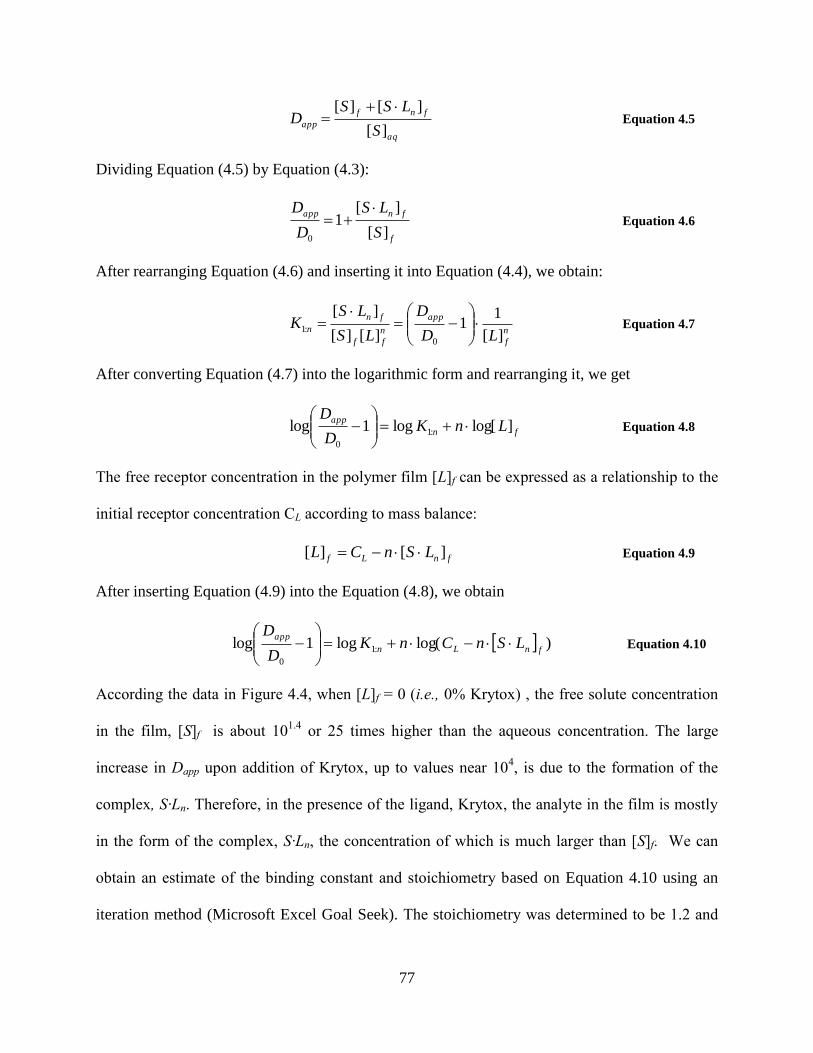
77
aq
fnf
appS
LSSD
][
][][ Equation 4.5
Dividing Equation (4.5) by Equation (4.3):
f
fnapp
S
LS
D
D
][
][1
0
Equation 4.6
After rearranging Equation (4.6) and inserting it into Equation (4.4), we obtain:
n
f
app
n
ff
fn
nLD
D
LS
LSK
][
11
][][
][
0
:1
Equation 4.7
After converting Equation (4.7) into the logarithmic form and rearranging it, we get
fn
appLnK
D
D]log[log1log :1
0
Equation 4.8
The free receptor concentration in the polymer film [L]f can be expressed as a relationship to the
initial receptor concentration CL according to mass balance:
fnLf LSnCL ][][ Equation 4.9
After inserting Equation (4.9) into the Equation (4.8), we obtain
)log(log1log :1
0
fnLn
appLSnCnK
D
D
Equation 4.10
According the data in Figure 4.4, when [L]f = 0 (i.e., 0% Krytox) , the free solute concentration
in the film, [S]f is about 101.4
or 25 times higher than the aqueous concentration. The large
increase in Dapp upon addition of Krytox, up to values near 104, is due to the formation of the
complex, S·Ln. Therefore, in the presence of the ligand, Krytox, the analyte in the film is mostly
in the form of the complex, S·Ln, the concentration of which is much larger than [S]f. We can
obtain an estimate of the binding constant and stoichiometry based on Equation 4.10 using an
iteration method (Microsoft Excel Goal Seek). The stoichiometry was determined to be 1.2 and

78
binding constant is 2.7 x10³ M
-1, suggesting that 1:1 complexation dominates in the polymer
phase.
Quinoline and Krytox 157FSH have been reported to form 1:1, 1:2, and 1:3 complexes
(base : acid) in a fluorous liquid, FC-72[98]. The formation constant of quinoline-Krytox
complex in the fluorous polymer phase is much smaller than the reported binding constant in a
fluorous liquid, FC-72 (1.8 x 10⁸ M
-1)[98]. This observation is consistent with the reported
results that binding constant of Krytox and 3-hydroxypyridine complex (840 M-1
) in Teflon AF
was significantly smaller than that (3 x 10⁶ M
-1) in FC-72 [27]. Although the number of data is
limited, it appears that the fluorous polymer phase and the fluorous liquid phase are considerably
different.
A pair of carboxylic acids, such as Krytox can form a cyclic dimer at high
concentrations[91]. Self-association is more prevalent at high concentrations than low
concentration[87]. Previous study[87] shows the similar trend as ours that self-association of a
molecular receptor in poor solvent decreases its binding efficacy[87]. In our study, quinoline-
receptor formation competes with the self-association of the receptor. This may explain the
decreased distribution coefficient when high concentration of the receptor existed.

79
Figure 4.5 Polymer-water distribution coefficient of quinoline as a function of the initial quinoline
aqueous concentration.
The distribution coefficient is quite large, nearly 104, with 50% Krytox. With such a
large distribution coefficient based on a specific molecular interaction, it is quite possible that the
distribution coefficient depends on the initial solute concentration behavior. Thus, we determined
quinoline distribution behavior over a wide range of initial quinoline concentrations to determine
the concentration dependence. As shown in Figure 4.5, distribution coefficient decreases as the
initial quinoline concentration increases. The trend can be explained by Equation (4.10), where
D0, K, n, and CL are constants in this study. The increase of quinoline initial concentration leads
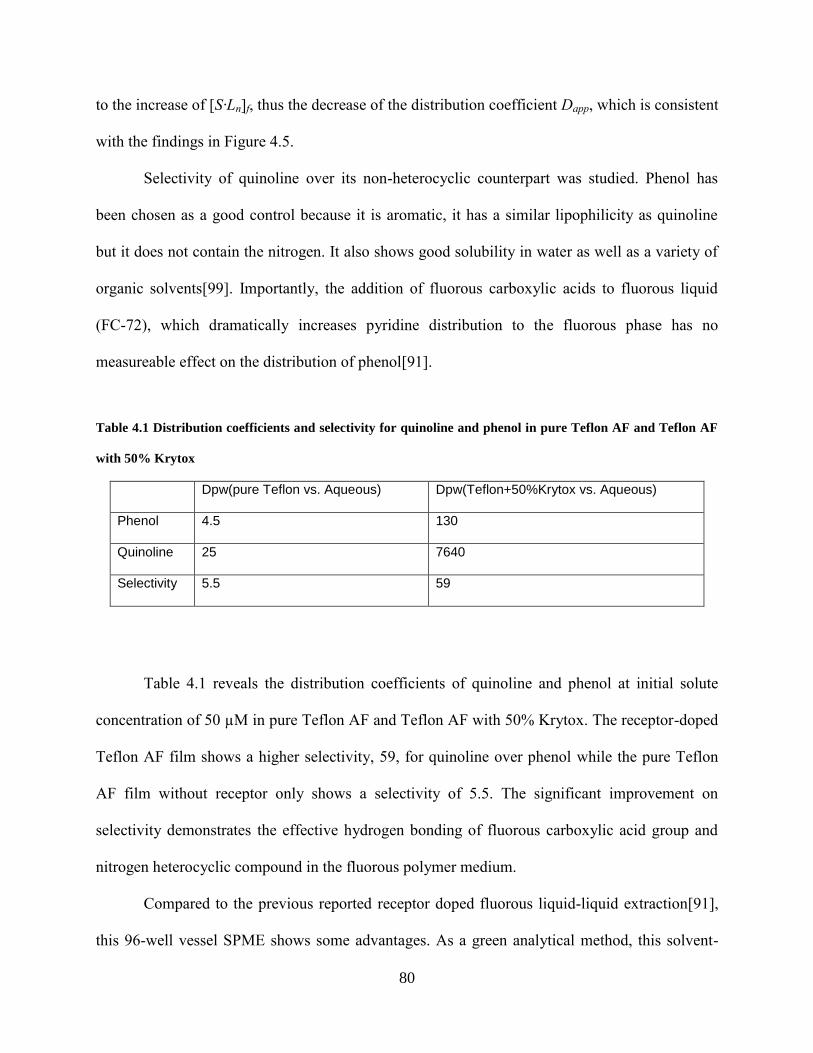
80
to the increase of [S·Ln]f, thus the decrease of the distribution coefficient Dapp, which is consistent
with the findings in Figure 4.5.
Selectivity of quinoline over its non-heterocyclic counterpart was studied. Phenol has
been chosen as a good control because it is aromatic, it has a similar lipophilicity as quinoline
but it does not contain the nitrogen. It also shows good solubility in water as well as a variety of
organic solvents[99]. Importantly, the addition of fluorous carboxylic acids to fluorous liquid
(FC-72), which dramatically increases pyridine distribution to the fluorous phase has no
measureable effect on the distribution of phenol[91].
Table 4.1 Distribution coefficients and selectivity for quinoline and phenol in pure Teflon AF and Teflon AF
with 50% Krytox
Dpw(pure Teflon vs. Aqueous) Dpw(Teflon+50%Krytox vs. Aqueous)
Phenol 4.5 130
Quinoline 25 7640
Selectivity 5.5 59
Table 4.1 reveals the distribution coefficients of quinoline and phenol at initial solute
concentration of 50 µM in pure Teflon AF and Teflon AF with 50% Krytox. The receptor-doped
Teflon AF film shows a higher selectivity, 59, for quinoline over phenol while the pure Teflon
AF film without receptor only shows a selectivity of 5.5. The significant improvement on
selectivity demonstrates the effective hydrogen bonding of fluorous carboxylic acid group and
nitrogen heterocyclic compound in the fluorous polymer medium.
Compared to the previous reported receptor doped fluorous liquid-liquid extraction[91],
this 96-well vessel SPME shows some advantages. As a green analytical method, this solvent-
81
free extraction technique minimizes waste and human exposure to hazardous solvents. This
SPME method requires small amount of sample, and it operates in parallel.
The effects of receptor and solute concentration on the distribution coefficient and
selectivity based on 96-well vessel SPME have been discussed as above. We then coated this
receptor doped fluorous polymer on a stainless steel fiber as the coated fiber SPME.
4.3.2 Coated Fiber SPME
Coated fiber SPME is the most widely used SPME configuration. SPME is usually
performed by either direct extraction in the liquid phase or headspace extraction. In the direct
extraction mode, the coated fiber is inserted into the sample matrix to extract analytes into the
extraction phase. In the headspace extraction mode, the fiber is inserted into the gaseous
headspace above the sample matrix to extract those relatively volatile analytes. In order to
compare feasibility of those modes, we first exposed the SPME fiber made from 50%
Krytox/Teflon AF to both the liquid phase and the headspace of aqueous quinoline solutions.
The fibers were then exposed at the GC inlet where the quinoline was desorbed. The peak areas
were used for quantitation. Figure 4.6 shows the effect of quinoline initial concentration on
SPME extraction based on both liquid phase and headspace exposure. For liquid phase
extraction, it shows a linear relationship with a correlation coefficient close to unity (R2 = 0.999)
and a slope of 0.0259 ng/M. The detection limit was calculated to be 34.9 µM based on the
standard deviation and the slope of the regression line.
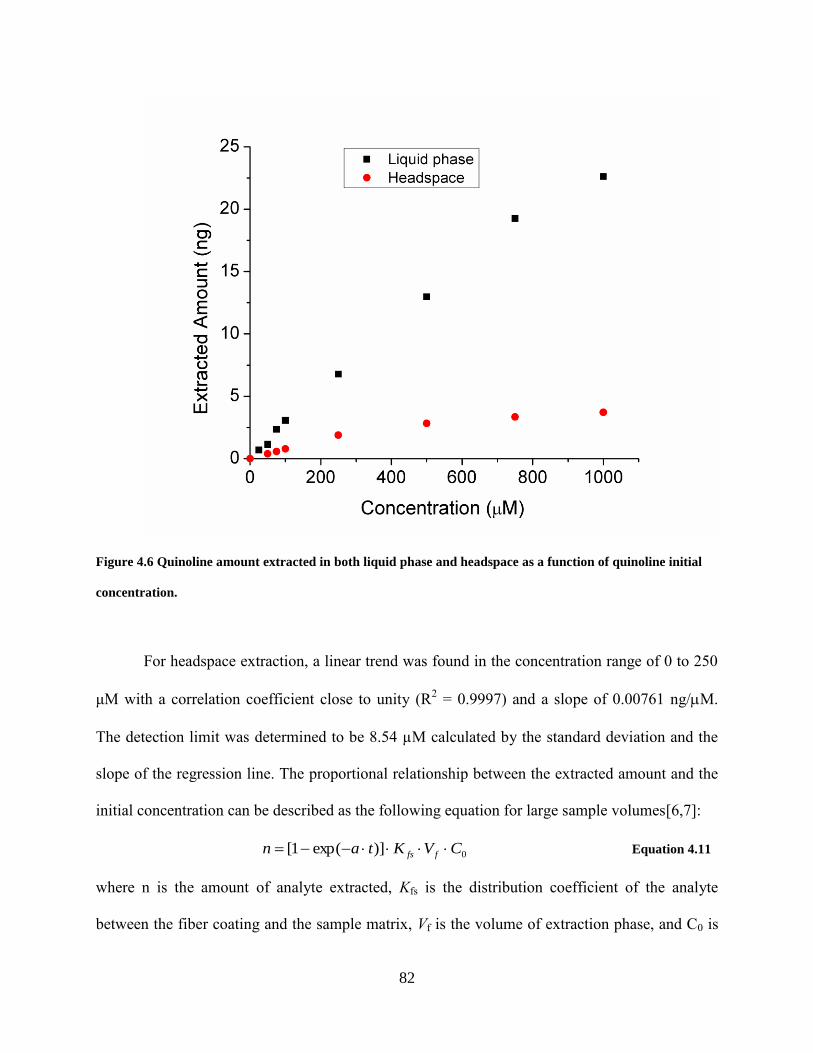
82
Figure 4.6 Quinoline amount extracted in both liquid phase and headspace as a function of quinoline initial
concentration.
For headspace extraction, a linear trend was found in the concentration range of 0 to 250
μM with a correlation coefficient close to unity (R2 = 0.9997) and a slope of 0.00761 ng/M.
The detection limit was determined to be 8.54 µM calculated by the standard deviation and the
slope of the regression line. The proportional relationship between the extracted amount and the
initial concentration can be described as the following equation for large sample volumes[6,7]:
0)]exp(1[ CVKtan ffs Equation 4.11
where n is the amount of analyte extracted, Kfs is the distribution coefficient of the analyte
between the fiber coating and the sample matrix, Vf is the volume of extraction phase, and C0 is
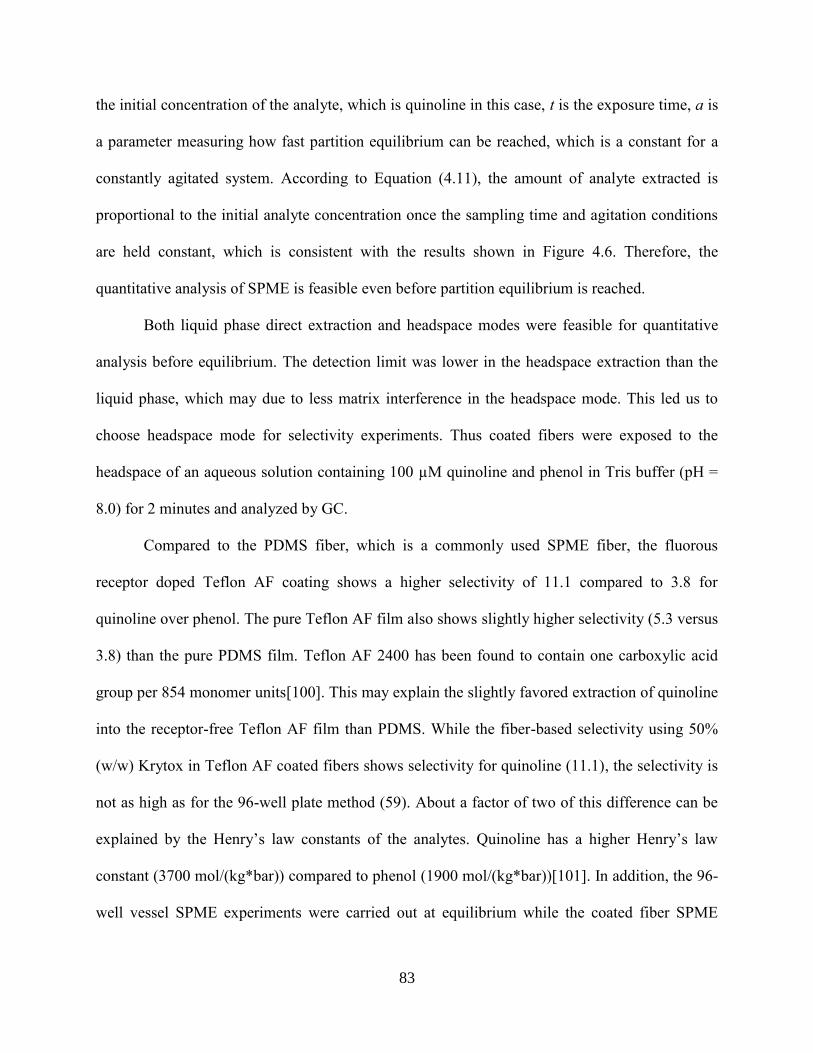
83
the initial concentration of the analyte, which is quinoline in this case, t is the exposure time, a is
a parameter measuring how fast partition equilibrium can be reached, which is a constant for a
constantly agitated system. According to Equation (4.11), the amount of analyte extracted is
proportional to the initial analyte concentration once the sampling time and agitation conditions
are held constant, which is consistent with the results shown in Figure 4.6. Therefore, the
quantitative analysis of SPME is feasible even before partition equilibrium is reached.
Both liquid phase direct extraction and headspace modes were feasible for quantitative
analysis before equilibrium. The detection limit was lower in the headspace extraction than the
liquid phase, which may due to less matrix interference in the headspace mode. This led us to
choose headspace mode for selectivity experiments. Thus coated fibers were exposed to the
headspace of an aqueous solution containing 100 µM quinoline and phenol in Tris buffer (pH =
8.0) for 2 minutes and analyzed by GC.
Compared to the PDMS fiber, which is a commonly used SPME fiber, the fluorous
receptor doped Teflon AF coating shows a higher selectivity of 11.1 compared to 3.8 for
quinoline over phenol. The pure Teflon AF film also shows slightly higher selectivity (5.3 versus
3.8) than the pure PDMS film. Teflon AF 2400 has been found to contain one carboxylic acid
group per 854 monomer units[100]. This may explain the slightly favored extraction of quinoline
into the receptor-free Teflon AF film than PDMS. While the fiber-based selectivity using 50%
(w/w) Krytox in Teflon AF coated fibers shows selectivity for quinoline (11.1), the selectivity is
not as high as for the 96-well plate method (59). About a factor of two of this difference can be
explained by the Henry’s law constants of the analytes. Quinoline has a higher Henry’s law
constant (3700 mol/(kg*bar)) compared to phenol (1900 mol/(kg*bar))[101]. In addition, the 96-
well vessel SPME experiments were carried out at equilibrium while the coated fiber SPME
84
experiments were performed before equilibrium to simplify and speed up the extraction process.
Thus, we did a kinetic study for quinoline and phenol by a SPME fiber coated by Teflon AF with
50% Krytox as illustrated in Figure 4.7. The extracted amount of quinoline linearly increases
with the exposure time while the extracted amount of phenol was almost zero due to no binding
with the receptor. Further, the phenol amount extracted is at a plateau while the quinoline
amount extracted is not. Thus, the selectivity actually increases when extraction time increases.
This leads to a practical tradeoff – one can achieve high selectivity but at the cost of time.
Figure 4.7 Kinetic profile of extracted quinoline amount by the coated fiber (50% Krytox in Teflon
AF) SPME-GC at different headspace exposure times.

85
4.4 CONCLUSIONS
We have demonstrated the distribution of a heterocyclic nitrogen-containing compound
between Krytox 157 FSH doped Teflon AF 2400 films and buffered aqueous solution based on
hydrogen bonding of the heterocyclic nitrogen group with the carboxylic acid group. We studied
in both 96-well vessel SPME and the coated fiber SPME formats. The effects of receptor
concentration and solute concentration on the extraction were studied. Those novel fluorous
SPME devices in both 96-well vessel format and the coated fiber design show selectivity for a
heterocyclic nitrogen-containing compound compared to its non-heterocyclic counterpart. Those
novel receptor-doped fluorous SPME devices show great potential to detect quinoline-like
potential environment pollutants in river water or other aqueous media.

86
BIBLIOGRAPHY
[1] T. Hyotylainen, M.-L. Riekkola,Sorbent- and liquid-phase microextraction techniques
and membrane-assisted extraction in combination with gas chromatographic analysis: A
review Analytica Chimica Acta 614 (2008) 27-37.
[2] J. Pawliszyn, Solid Phase Microextraction, Theory and Practice, Wiley-VCH, New York,
NY, 1997.
[3] G. Ouyang, D. Vuckovic, J. Pawliszyn,Nondestructive Sampling of Living Systems
Using in Vivo Solid-Phase Microextraction Chemical Reviews 111 (2011) 2784-2814.
[4] C.L. Arthur, L.M. Killam, K.D. Buchholz, J. Pawliszyn, J.R. Berg,Automation and
optimization of solid-phase microextraction Analytical Chemistry 64 (1992) 1960-1966.
[5] G. Ouyang, J. Pawliszyn,Configurations and calibration methods for passive sampling
techniques Journal of Chromatography A 1168 (2007) 226-235.
[6] J. Ai,Headspace Solid Phase Microextraction. Dynamics and Quantitative Analysis
before Reaching a Partition Equilibrium Analytical Chemistry 69 (1997) 3260-3266.
[7] J. Ai,Solid Phase Microextraction for Quantitative Analysis in Nonequilibrium Situations
Analytical Chemistry 69 (1997) 1230-1236.
[8] J. Pawliszyn, RSC Chromatography Monographs, Royal Society of Chemistry,
Letchworth, Hertfordshire, UK, 1999.
[9] C. Dietz, J. Sanz, C. Camara,Recent developments in solid-phase microextraction
coatings and related techniques Journal of Chromatography A 1103 (2006) 183-192.
[10] J. Li, H. Chen, H. Chen, Y. Ye,Selective determination of trace thiamphenicol in milk
and honey by molecularly imprinted polymer monolith microextraction and high-
performance liquid chromatography J. Sep. Sci. 35 (2012) 137-144.
[11] X. Hu, Q. Cai, Y. Fan, T. Ye, Y. Cao, C. Guo,Molecularly imprinted polymer coated
solid-phase microextraction fibers for determination of Sudan I-IV dyes in hot chili
powder and poultry feed samples J. Chromatogr., A 1219 (2012) 39-46.
[12] M.A. Golsefidi, Z. Es'haghi, A. Sarafraz-Yazdi,Design, synthesis and evaluation of a
molecularly imprinted polymer for hollow fiber-solid phase microextraction of
chlorogenic acid in medicinal plants J. Chromatogr., A 1229 (2012) 24-29.
[13] D.-L. Deng, J.-Y. Zhang, C. Chen, X.-L. Hou, Y.-Y. Su, L. Wu,Monolithic molecular
imprinted polymer fiber for recognition and solid phase microextraction of ephedrine and
pseudoephedrine in biological samples prior to capillary electrophoresis analysis J.
Chromatogr., A 1219 (2012) 195-200.
[14] X. Hu, G. Dai, J. Huang, H. Jin, Y. Yu, Y. Liang,Preparation and Characterization of
Metolachlor Molecularly Imprinted Polymer Coating on Stainless Steel Fibers for Solid-
Phase Microextraction Anal. Lett. 44 (2011) 1358-1370.

87
[15] F. Barahona, E. Turiel, A. Martin-Esteban,Supported liquid membrane-protected
molecularly imprinted fibre for solid-phase microextraction of thiabendazole Anal. Chim.
Acta 694 (2011) 83-89.
[16] J. Zhou, C. Ma, S. Zhou, P. Ma, F. Chen, Y. Qi, H. Chen,Preparation, evaluation and
application of molecularly imprinted solid-phase microextraction monolith for selective
extraction of pirimicarb in tomato and pear J. Chromatogr., A 1217 (2010) 7478-7483.
[17] L. Qiu, W. Liu, M. Huang, L. Zhang,Preparation and application of solid-phase
microextraction fiber based on molecularly imprinted polymer for determination of
anabolic steroids in complicated samples J. Chromatogr., A 1217 (2010) 7461-7470.
[18] H. Zhang, A. Hussam, S.G. Weber,Properties and Transport Behavior of
Perfluorotripentylamine (FC-70)-Doped Amorphous Teflon AF 2400 Films Journal of
the American Chemical Society 132 (2010) 17867-17879.
[19] X. Zhou, X. Shao, J.-j. Shu, M.-m. Liu, H.-l. Liu, X.-h. Feng, F. Liu,Thermally stable
ionic liquid-based sol-gel coating for ultrasonic extraction-solid-phase microextraction-
gas chromatography determination of phthalate esters in agricultural plastic films Talanta
89 (2012) 129-135.
[20] C.M. Graham, Y.-J. Meng, T. Ho, J.L. Anderson,Sorbent coatings for solid-phase
microextraction based on mixtures of polymeric ionic liquids J. Sep. Sci. 34 (2011) 340-
346.
[21] X. Zhou, P.-F. Xie, J. Wang, B.-B. Zhang, M.-M. Liu, H.-L. Liu, X.-H. Feng,Preparation
and characterization of novel crown ether functionalized ionic liquid-based solid-phase
microextraction coatings by sol-gel technology J. Chromatogr., A 1218 (2011) 3571-
3580.
[22] Y. Meng, V. Pino, J.L. Anderson,Role of counteranions in polymeric ionic liquid-based
solid-phase microextraction coatings for the selective extraction of polar compounds
Anal. Chim. Acta 687 (2011) 141-149.
[23] Y. Meng, J.L. Anderson,Tuning the selectivity of polymeric ionic liquid sorbent coatings
for the extraction of polycyclic aromatic hydrocarbons using solid-phase microextraction
J. Chromatogr., A 1217 (2010) 6143-6152.
[24] J. Huang, Y. Hu, Y. Hu, G. Li,Development of metal complex imprinted solid-phase
microextraction fiber for 2,2'-dipyridine recognition in aqueous medium Talanta 83
(2011) 1721-1729.
[25] Y. Sun, W.-Y. Zhang, J. Xing, C.-M. Wang,Solid-phase microfibers based on modified
single-walled carbon nanotubes for extraction of chlorophenols and organochlorine
pesticides Microchim. Acta 173 (2011) 223-229.
[26] A. Sarafraz-Yazdi, A. Amiri, G. Rounaghi, H.E. Hosseini,A novel solid-phase
microextraction using coated fiber based sol-gel technique using poly(ethylene glycol)
grafted multi-walled carbon nanotubes for determination of benzene, toluene,
ethylbenzene and o-xylene in water samples with gas chromatography-flame ionization
detector J. Chromatogr., A 1218 (2011) 5757-5764.
[27] C. Beining, S. Piletsky, A.P.F. Turner,Molecular Recognition: Design of "Keys"
Combinatorial Chemistry & High Throughput Screening 5 (2002) 409.
[28] S. Li, L. Sun, Y. Chung, S.G. Weber,Artificial Receptor-Facilitated Solid-Phase
Microextraction of Barbiturates Anal. Chem. 71 (1999) 2146-2151.
[29] S. Li, S.G. Weber,Determination of Barbiturates by Solid-Phase Microextraction and
Capillary Electrophoresis Analytical Chemistry 69 (1997) 1217-1222.
88
[30] G.R. Eldridge, H.C. Vervoort, C.M. Lee, P.A. Cremin, C.T. Williams, S.M. Hart, M.G.
Goering, M. O'Neil-Johnson, L. Zeng,High-Throughput Method for the Production and
Analysis of Large Natural Product Libraries for Drug Discovery Analytical Chemistry 74
(2002) 3963-3971.
[31] J. O'Reilly, Q. Wang, L. Setkova, J.P. Hutchinson, Y. Chen, H.L. Lord, C.M. Linton, J.
Pawliszyn,Automation of solid-phase microextraction Journal of Separation Science 28
(2005) 2010-2022.
[32] R. Vatinno, D. Vuckovic, C.G. Zambonin, J. Pawliszyn,Automated high-throughput
method using solid-phase microextraction-liquid chromatography-tandem mass
spectrometry for the determination of ochratoxin A in human urine Journal of
Chromatography A 1201 (2008) 215-221.
[33] D. Vuckovic, E. Cudjoe, D. Hein, J. Pawliszyn,Automation of Solid-Phase
Microextraction in High-Throughput Format and Applications to Drug Analysis
Analytical Chemistry 80 (2008) 6870-6880.
[34] E. Cudjoe, D. Vuckovic, D. Hein, J. Pawliszyn,Investigation of the Effect of the
Extraction Phase Geometry on the Performance of Automated Solid-Phase
Microextraction Analytical Chemistry 81 (2009) 4226-4232.
[35] J.P. Hutchinson, L. Setkova, J. Pawliszyn,Automation of solid-phase microextraction on
a 96-well plate format Journal of Chromatography A 1149 (2007) 127-137.
[36] D. Vuckovic, E. Cudjoe, F.M. Musteata, J. Pawliszyn,Automated solid-phase
microextraction and thin-film microextraction for high-throughput analysis of biological
fluids and ligand-receptor binding studies Nat. Protocols 5 (2010) 140-161.
[37] Mei-Fen Jeng, H.H. Dyson,Direct Measurement of the Aspartic Acid 26 pKa for Reduced
Escherichia coli Thioredoxin by 13
C NMR Biochemistry 35 (1996) 1-6.
[38] K. Box, C. Bevan, J. Comer, A. Hill, R. Allen, D. Reynolds,High-Throughput
Measurement of pKa Values in a Mixed-Buffer Linear pH Gradient System Analytical
Chemistry 75 (2003) 883-892.
[39] R.I. Allen, K.J. Box, J.E.A. Comer, C. Peake, K.Y. Tam,Multiwavelength
spectrophotometric determination of acid dissociation constants of ionizable drugs
Journal of Pharmaceutical and Biomedical Analysis 17 (1998) 699-712.
[40] S.K. Poole, C.F. Poole,Separation methods for estimating octanol-water partition
coefficients Journal of Chromatography, B: Analytical Technologies in the Biomedical
and Life Sciences 797 (2003) 3-19.
[41] C. Foulon, N. Duhal, B. Lacroix-Callens, C. Vaccher, J.P. Bonte, J.F.
Goossens,Determination of pKa values of benzoxa-, benzothia- and benzoselena-zolinone
derivatives by capillary electrophoresis: Comparison with potentiometric titration and
spectrometric data European Journal of Pharmaceutical Sciences 31 (2007) 165-171.
[42] R. Collander,Partition of organic compounds between higher alcohols and water Acta
Chemica Scandinavica 5 (1951) 774-780.
[43] A. Leo, C. Hansch, D. Elkins,Partition coefficients and their uses Chemical Reviews
(Washington, DC, United States) 71 (1971) 525-616.
[44] M. Tachibana, M. Furusawa, N. Kiba,Application of solvent extraction and synchronous
spectrofluorimetry to the determination of the formation constant for a 1:1 complex of
carbazole with β-cyclodextrin in water-dimethyl sulfoxide medium Journal of Inclusion
Phenomena and Molecular Recognition in Chemistry 22 (1995) 313-329.

89
[45] L.-G.a. Danielsson, Y.-H. Zhang,Methods for determiningn-octanol-water partition
constants TrAC Trends in Analytical Chemistry 15 (1996) 188-196.
[46] J. Sangster, Octanol-water Partition Coefficients: Fundamentals and Physical Chemistry,
Wiley, New York, 1997.
[47] OECD Guidelines for the Testing of Chemicals, Test No.117, OECD - Organisation for
Economic Co-operation and Development, Paris, 2004.
[48] Z. Chen, S.G. Weber,High-Throughput Method for Lipophilicity Measurement
Analytical Chemistry 79 (2007) 1043-1049.
[49] L. Hitzel, A.P. Watt, K.L. Locker,An Increased Throughput Method for the
Determination of Partition Coefficients Pharmaceutical Research 17 (2000) 1389-1395.
[50] T. Loftsson, D. Hreinsdottir, M. Masson,Evaluation of cyclodextrin solubilization of
drugs International journal of pharmaceutics 302 (2005) 18-28.
[51] T. Kennedy,Managing the drug discovery/development interface Drug Discovery Today
2 (1997) 436-444.
[52] E. Ratti, & Trist, D.,Continuing evolution of the drug discovery process in the
pharmaceutical industry Pure and Applied Chemistry 73 (2001) 67-75.
[53] A. Glomme, J. Marz, J.B. Dressman,comparison of a minaturized shake-flask solubility
method with automated potentiometic acid/base titration and calculated solubilities
Journal of Pharmaceutical Sciences 94 (2005) 1-16.
[54] N.G. Das, S.K. Das,Formulation of poorly soluble drugs Drug Delivery Report
Spring/Summer (2006) 52-55.
[55] A.R. Hedges,Industrial applications of cyclodextrins Chemical Reviews (Washington, D.
C.) 98 (1998) 2035-2044.
[56] K. Uekama, F. Hirayama, T. Irie,Cyclodextrin Drug Carrier Systems Chemical Reviews
(Washington, D. C.) 98 (1998) 2045-2076.
[57] T. Loftsson, M.E. Brewster, M. Masson,Role of cyclodextrins in improving oral drug
delivery American Journal of Drug Delivery 2 (2004) 261-275.
[58] W. Hirsch, V. Fried, L. Altman,Effect of cyclodextrins on sparingly soluble salts Journal
of Pharmaceutical Sciences 74 (1985) 1123-1125.
[59] N. Bodor, P. Buchwald,Theoretical insights into the formation, structure, and energetics
of some cyclodextrin complexes Journal of Inclusion Phenomena and Macrocyclic
Chemistry 44 (2003) 9-14.
[60] V.M. Rao, V.J. Stella,When can cyclodextrins be considered for solubilization purposes?
Journal of Pharmaceutical Sciences 92 (2003) 927-932.
[61] T. Higuchi, K.A. Connors,Phase-solubility techniques Advan. Anal. Chem. Instr. 4
(1965) 117-212.
[62] M. Masson, B.V. Sigurdardottir, K. Matthiasson, T. Loftsson,Investigation of drug-
cyclodextrin complexes by a phase-distribution method: Some theoretical and practical
considerations Chemical & Pharmaceutical Bulletin 53 (2005) 958-964.
[63] W. Eli, W. Chen, Q. Xue,Determination of association constants of cyclodextrin-nonionic
surfactant inclusion complexes by a partition coefficient method Journal of Inclusion
Phenomena and Macrocyclic Chemistry 38 (2000) 37-43.
[64] Z. Chen, Y. Yang, S. Werner, P. Wipf, S.G. Weber,A screening method for chiral
selectors that does not require covalent attachment Journal of the American Chemical
Society 128 (2006) 2208-2209.

90
[65] P. Mura, M.T. Faucci, A. Manderioli, G. Bramanti,Multicomponent systems of econazole
with hydroxyacids and cyclodextrins Journal of Inclusion Phenomena and Macrocyclic
Chemistry 39 (2001) 131-138.
[66] Y.C. Guillaume, E. Peyrin,Symmetry Breaking during the Formation of β-Cyclodextrin-
Imidazole Inclusion Compounds: Capillary Electrophoresis Study Analytical Chemistry
71 (1999) 2046-2052.
[67] M. Pedersen, S. Bjerregaard, J. Jacobsen, A. Rommelmayer Larsen, A. Mehlsen
Sorensen,An econazole β-cyclodextrin inclusion complex: an unusual dissolution rate,
supersaturation, and biological efficacy example International journal of pharmaceutics
165 (1998) 57-68.
[68] M. Pedersen,Isolation and antimycotic effect of a genuine miconazole-β-cyclodextrin
complex European Journal of Pharmaceutics and Biopharmaceutics 40 (1994) 19-23.
[69] M.I. El-Barghouthi, N.A. Masoud, J.K. Al-Kafawein, A.A. Abdoh,Inclusion
complexation of itraconazole with β- and 2-hydroxypropyl-β-cyclodextrins in aqueous
solutions Russian Journal of Physical Chemistry 80 (2006) 1050-1055.
[70] J. Peeters, P. Neeskens, J.P. Tollenaere, P. Van Remoortere, M.E.
Brewster,Characterization of the interaction of 2-hydroxypropyl-β-cyclodextrin with
itraconazole at pH 2, 4, and 7 Journal of Pharmaceutical Sciences 91 (2002) 1414-1422.
[71] K. Miyake, T. Irie, H. Arima, F. Hirayama, K. Uekama, M. Hirano, Y.
Okamaoto,Characterization of itraconazole/2-hydroxypropyl-β-cyclodextrin inclusion
complex in aqueous propylene glycol solution International journal of pharmaceutics 179
(1999) 237-245.
[72] M. Pedersen, M. Edelsten, V.F. Nielsen, A. Scarpellini, S. Skytte, C. Slot,Formation and
antimycotic effect of cyclodextrin inclusion complexes of econazole and miconazole
International journal of pharmaceutics 90 (1993) 247-254.
[73] I. Shehatta, A.H. Al-Marzouqi, B. Jobe, A. Dowaidar,Enhancement of aqueous solubility
of itraconazole by complexation with cyclodextrins using supercritical carbon dioxide
Canadian Journal of Chemistry 83 (2005) 1833-1838.
[74] OECD guidelines for the testing of chemicals, No.107, Partition coefficient (n-
octanol/water): Shake Flask Method, Organization for Economic Co-operation and
Development (OECD), Paris, 1995.
[75] K. Carlsson, B. Karlberg,Determination of octanol-water partition coefficients using a
micro-volume liquid-liquid flow extraction system Anal. Chim. Acta 423 (2000) 137-
144.
[76] L. Hitzel, A.P. Watt, K.L. Locker,An increased throughput method for the determination
of partition coefficients Pharm. Res. 17 (2000) 1389-1395.
[77] OECD guidelines for the testing of chemicals No.117: Partition coefficient (n-
octanol/water), High Performance Liquid Chromatography (HPLC) Method,
Organization for Economic Co-operation and Development (OECD), Paris, 2004.
[78] M. Kah, C. Brown,LogD: liphilicity for ionisable compounds Chemosphere 72 (2008)
1401-1408.
[79] E.H. Kerns, L. Di, Drug-like properties : concepts, structure design and methods : from
ADME to toxicity optimization, Academic Press, Amsterdam ; Boston, 2008.
[80] Z. Chen, D. Lu, S.G. Weber,High-throughput phase-distribution method to determine
drug-cyclodextrin binding constants Journal of Pharmaceutical Sciences 98 (2009) 229-
238.

91
[81] H. Abe, M. Tanaka, K. Sugimoto, A. Suma, M. Yokota, S. M, K. Lio, K. Ueyama, D.
Motoda, T. Noguchi, T. Adachi, J. Tsuruha, S. Doi, Preparation of piperazine derivatives
as hepatitis C virus (HCV) polymerase inhibitors, Japan Tobacco Inc., Japan, 2007.
[82] Anna Maria Almerico, Antonino Lauria, Marco Tutone, Patrizia Diana, Paola Barraja ,
Alessandra Montalbano , Girolamo Cirrincione , G. Dattolo,A Multivariate Analysis on
Non-nucleoside HIV-1 Reverse Transcriptase Inhibitors and Resistance Induced by
Mutation QSAR & Combinatorial Science 22 (2003) 984-996.
[83] A. Giraldez, R. Nieves, C. Ochoa, C. Vara de Rey, E. Cenarruzabeitia, B.
Lasheras,Analgesic and antipyretic activities of 1,2,6-thiadiazin-3-one 1,1-dioxides. SAR
design of a new analgesic agent European Journal of Medicinal Chemistry 24 (1989)
497-502.
[84] A. Castro, A. Martinez, I. Cardelus, J. Llenas,Dioxides of bicyclic thiadiazines: a new
family of smooth muscle relaxants Bioorganic & Medicinal Chemistry 3 (1995) 179-185.
[85] C.A.L. Linpinski, F.; Dominy, B. W.; Feeney, P. J.,Advanced Drug Delivery Reviews 23
(1997) 3-25.
[86] C.A. Lipinski,Drug-like properties and the causes of poor solubility and poor
permeability Journal of Pharmacological and Toxicological Methods 44 (2001) 235-249.
[87] S. Li, L. Sun, Y. Chung, S.G. Weber,Artificial Receptor-Facilitated Solid-Phase
Microextraction of Barbiturates Analytical Chemistry 71 (1999) 2146-2151.
[88] J.A. Gladysz, D.P. Curran, I.T. Horvath, Handbook of Fluorous Chemistry, Wiley-VCH,
Weinheim, Germany, 2004.
[89] J.-M. Vincent,Noncovalent associations in fluorous fluids Journal of Fluorine Chemistry
129 (2008) 903-909.
[90] C. Palomo, J.M. Aizpurua, I. Loinaz, M.J. Fernandez-Berridi, L. Irusta,Scavenging of
Fluorinated N,N'-Dialkylureas by Hydrogen Binding: A Novel Separation Method for
Fluorous Synthesis Org. Lett. 3 (2001) 2361-2364.
[91] K.L. O'Neal, S. Geib, S.G. Weber,Extraction of Pyridines into Fluorous Solvents Based
on Hydrogen Bond Complex Formation with Carboxylic Acid Receptors Analytical
Chemistry 79 (2007) 3117-3125.
[92] A.Y. Alentiev, V.P. Shantarovich, T.C. Merkel, V.I. Bondar, B.D. Freeman, Y.P.
Yampolskii,Gas and Vapor Sorption, Permeation, and Diffusion in Glassy Amorphous
Teflon AF1600 Macromolecules 35 (2002) 9513-9522.
[93] H. Zhang, S. Wang, S.G. Weber,Nanocomposite Teflon AF 2400 Films as Tunable
Platforms for Selective Transport Analytical Chemistry 84 (2012) 9920-9927.
[94] H. Zhao, K. Ismail, S.G. Weber,How Fluorous Is Poly(2,2-bis(trifluoromethyl)-4,5-
difluoro-1,3-dioxide-co-tetrafluoroethylene) (Teflon AF)? Journal of the American
Chemical Society 126 (2004) 13184-13185.
[95] H. Zhao, J. Zhang, N. Wu, X. Zhang, K. Crowley, S.G. Weber,Transport of Organic
Solutes through Amorphous Teflon AF Films Journal of the American Chemical Society
127 (2005) 15112-15119.
[96] D. Lu, P. Chambers, P. Wipf, X.-Q. Xie, D. Englert, S. Weber,Lipophilicity screening of
novel drug-like compounds and comparison to clog P Journal of Chromatography A 1258
(2012) 161-167.
[97] Toxicological Review of Quinoline, USEPA, Washington, DC, 2001.
[98] K.L. O'Neal, S.G. Weber,Molecular and ionic hydrogen bond formation in fluorous
solvents J Phys Chem B 113 (2009) 149-158.

92
[99] OSHA, Occupational Safety and Health Guideline for Phenol, Occupational Safety and
Health Administration, Washington DC, 1996.
[100] C.-Z. Lai, S.S. Koseoglu, E.C. Lugert, P.G. Boswell, J. Rábai, T.P. Lodge, P.
Bühlmann,Fluorous Polymeric Membranes for Ionophore-Based Ion-Selective
Potentiometry: How Inert Is Teflon AF? Journal of the American Chemical Society 131
(2009) 1598-1606.
[101] Air and steam stripping of toxic pollutants, USEPA, Cincinnati, OH, USA, 1982.