Parallel Nsight for Accelerated DirectX 11 · PDF fileTarget: Vista / Windows 7, HUD overlay...
16
Room B | Tuesday, September, 21st, 17:00 -17:50 | Simon Barrett Parallel Nsight for Accelerated DirectX 11 Development
Transcript of Parallel Nsight for Accelerated DirectX 11 · PDF fileTarget: Vista / Windows 7, HUD overlay...

Room B | Tuesday, September, 21st, 17:00 - 17:50 | Simon Barrett
Parallel Nsight for Accelerated DirectX 11 Development

Ask Yourself…
Where is your application bottlenecked?
— Is your CPU profiler really telling you where your app. is
bottlenecked? What if your app is bottlenecked on the GPU?
How are you rendering the frame?
— Are you executing redundant API calls for state set up?
— Are you rendering excessive / broken geometry?
— Are your shaders executing correctly, and efficiently?
Are you utilizing the CPU and GPU cores effectively?
Parallel Nsight
GPU computing solution in Visual Studio
Debug, profile and analyze graphics and GPGPU applications
Direct3D, DirectCompute, CUDA, OpenGL, OpenCL
Host: Vista / Windows 7, Visual Studio 2008 / 2010
Target: Vista / Windows 7, HUD overlay
GPU: DirectX 10 / 11, OpenGL 3.2 / 4.0

Parallel Nsight
Analyzer Graphics Inspector
Frame Profiler Graphics Debugger HUD

Demo
Gamebryo MangledMetal DirectX11 game demo
Thank you Emergent Game Technologies!

Parallel Nsight
Analyzer Graphics Inspector
Frame Profiler Graphics Debugger HUD
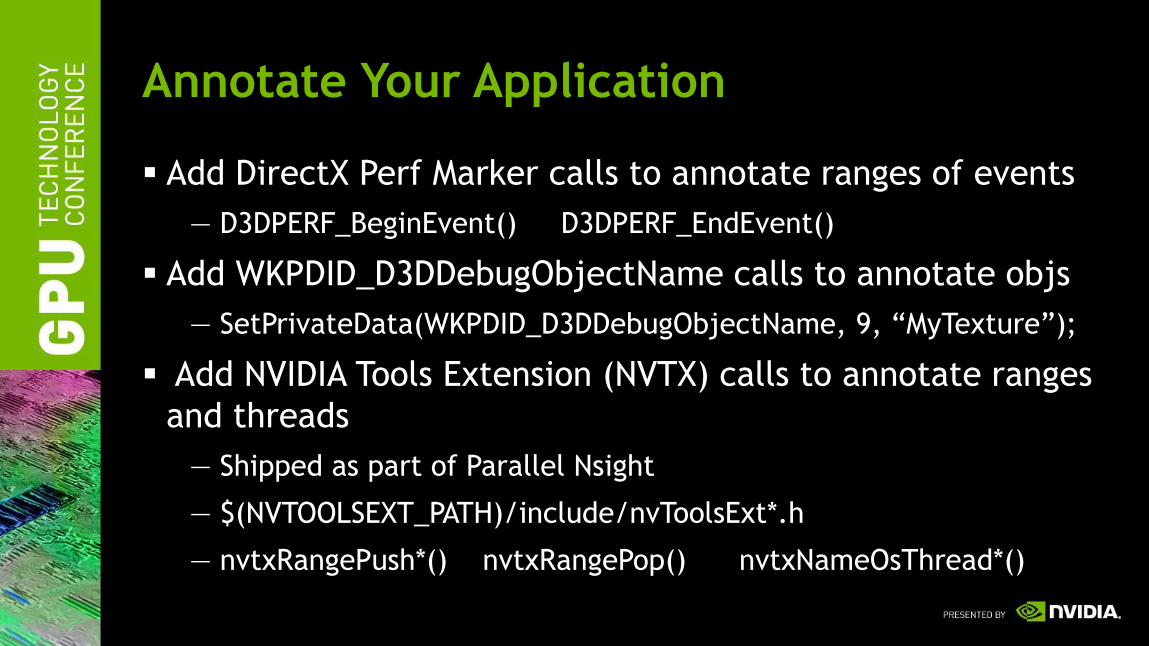
Annotate Your Application
Add DirectX Perf Marker calls to annotate ranges of events
— D3DPERF_BeginEvent() D3DPERF_EndEvent()
Add WKPDID_D3DDebugObjectName calls to annotate objs
— SetPrivateData(WKPDID_D3DDebugObjectName, 9, “MyTexture”);
Add NVIDIA Tools Extension (NVTX) calls to annotate ranges
and threads
— Shipped as part of Parallel Nsight
— $(NVTOOLSEXT_PATH)/include/nvToolsExt*.h
— nvtxRangePush*() nvtxRangePop() nvtxNameOsThread*()

Parallel Nsight
Analyzer Graphics Inspector
Frame Profiler Graphics Debugger HUD

Parallel Nsight
Analyzer Graphics Inspector
Frame Profiler Graphics Debugger HUD

Parallel Nsight
Analyzer Graphics Inspector
Frame Profiler Graphics Debugger HUD

Ambient Occlusion
Increases the realism of shadows
Objects that block ambient light are accounted for
Subtle shadows in depth valleys
Implemented via a Compute Shader for this demo

Graphics Debugger: AO Example

Parallel Nsight
Analyzer Graphics Inspector
Frame Profiler Graphics Debugger HUD

Parallel Nsight HUD
Scrubber
— Hierarchical display of command lists
Texture overrides
Depth Complexity
Save frame capture: My Documents\Parallel Nsight\Captures
Replay capture: Nvda.Replayer.100.exe
Summary
Annotate your application’s ranges and D3D objects
Use the Analyzer to find parallelism / blocking issues
Use the Graphics Inspector to understand frame rendering
Use the Frame Profiler to pinpoint GPU bottlenecks
Use the Graphics Debugger to inspect / debug your shaders
Use the HUD to test texture overrides and serialize frames
Download Parallel Nsight today!
— http://www.nvidia.com/ParallelNsight

Questions?