Parallel 3D Simulation of a Fault Gouge Using The Lattice ...
17
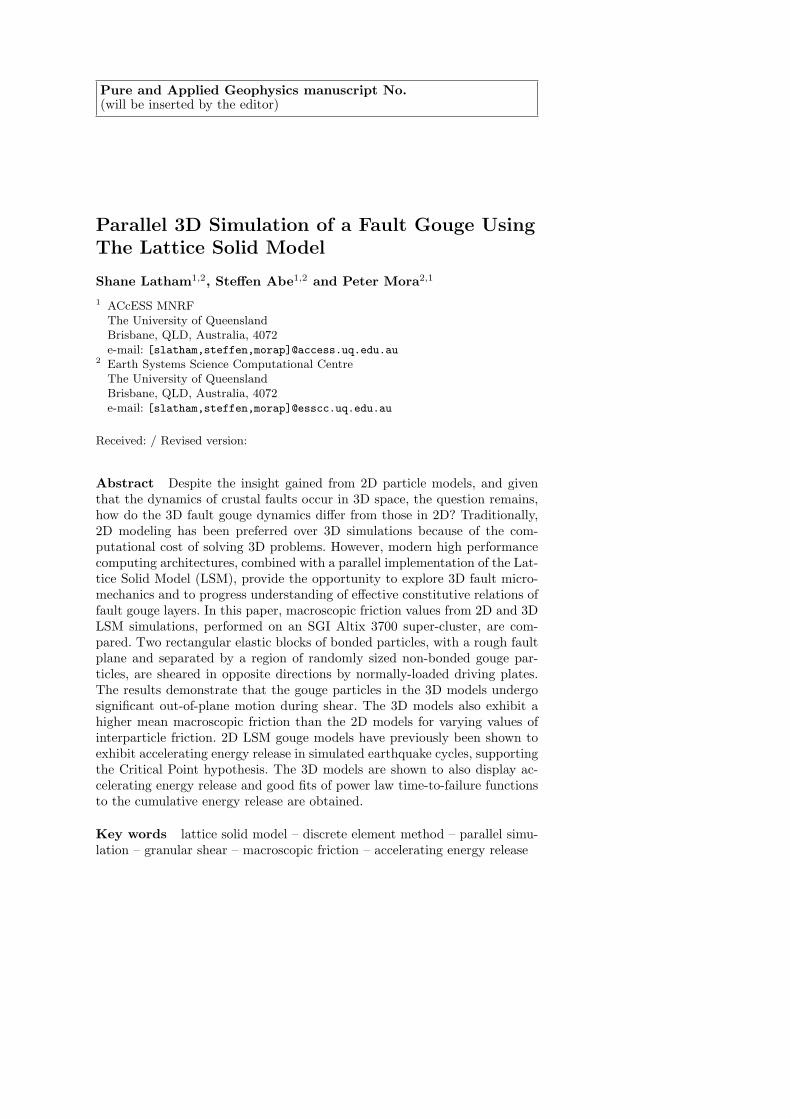
Pure and Applied Geophysics manuscript No. (will be inserted by the editor) Parallel 3D Simulation of a Fault Gouge Using The Lattice Solid Model Shane Latham 1,2 , Steffen Abe 1,2 and Peter Mora 2,1 1 ACcESS MNRF The University of Queensland Brisbane, QLD, Australia, 4072 e-mail: [slatham,steffen,morap]@access.uq.edu.au 2 Earth Systems Science Computational Centre The University of Queensland Brisbane, QLD, Australia, 4072 e-mail: [slatham,steffen,morap]@esscc.uq.edu.au Received: / Revised version: Abstract Despite the insight gained from 2D particle models, and given that the dynamics of crustal faults occur in 3D space, the question remains, how do the 3D fault gouge dynamics differ from those in 2D? Traditionally, 2D modeling has been preferred over 3D simulations because of the com- putational cost of solving 3D problems. However, modern high performance computing architectures, combined with a parallel implementation of the Lat- tice Solid Model (LSM), provide the opportunity to explore 3D fault micro- mechanics and to progress understanding of effective constitutive relations of fault gouge layers. In this paper, macroscopic friction values from 2D and 3D LSM simulations, performed on an SGI Altix 3700 super-cluster, are com- pared. Two rectangular elastic blocks of bonded particles, with a rough fault plane and separated by a region of randomly sized non-bonded gouge par- ticles, are sheared in opposite directions by normally-loaded driving plates. The results demonstrate that the gouge particles in the 3D models undergo significant out-of-plane motion during shear. The 3D models also exhibit a higher mean macroscopic friction than the 2D models for varying values of interparticle friction. 2D LSM gouge models have previously been shown to exhibit accelerating energy release in simulated earthquake cycles, supporting the Critical Point hypothesis. The 3D models are shown to also display ac- celerating energy release and good fits of power law time-to-failure functions to the cumulative energy release are obtained. Key words lattice solid model – discrete element method – parallel simu- lation – granular shear – macroscopic friction – accelerating energy release
Transcript of Parallel 3D Simulation of a Fault Gouge Using The Lattice ...
Pure and Applied Geophysics manuscript No.(will be inserted by the editor)
Parallel 3D Simulation of a Fault Gouge UsingThe Lattice Solid Model
Shane Latham1,2, Steffen Abe1,2 and Peter Mora2,1
1 ACcESS MNRFThe University of QueenslandBrisbane, QLD, Australia, 4072e-mail: [slatham,steffen,morap]@access.uq.edu.au
2 Earth Systems Science Computational CentreThe University of QueenslandBrisbane, QLD, Australia, 4072e-mail: [slatham,steffen,morap]@esscc.uq.edu.au
Received: / Revised version:
Abstract Despite the insight gained from 2D particle models, and giventhat the dynamics of crustal faults occur in 3D space, the question remains,how do the 3D fault gouge dynamics differ from those in 2D? Traditionally,2D modeling has been preferred over 3D simulations because of the com-putational cost of solving 3D problems. However, modern high performancecomputing architectures, combined with a parallel implementation of the Lat-tice Solid Model (LSM), provide the opportunity to explore 3D fault micro-mechanics and to progress understanding of effective constitutive relations offault gouge layers. In this paper, macroscopic friction values from 2D and 3DLSM simulations, performed on an SGI Altix 3700 super-cluster, are com-pared. Two rectangular elastic blocks of bonded particles, with a rough faultplane and separated by a region of randomly sized non-bonded gouge par-ticles, are sheared in opposite directions by normally-loaded driving plates.The results demonstrate that the gouge particles in the 3D models undergosignificant out-of-plane motion during shear. The 3D models also exhibit ahigher mean macroscopic friction than the 2D models for varying values ofinterparticle friction. 2D LSM gouge models have previously been shown toexhibit accelerating energy release in simulated earthquake cycles, supportingthe Critical Point hypothesis. The 3D models are shown to also display ac-celerating energy release and good fits of power law time-to-failure functionsto the cumulative energy release are obtained.
Key words lattice solid model – discrete element method – parallel simu-lation – granular shear – macroscopic friction – accelerating energy release
2 Shane Latham, Steffen Abe and Peter Mora
1 Introduction
Many naturally occurring faults and shear zones contain regions of granularmaterial. The presence of gouge particles plays a fundamental role in influ-encing the macroscopic behavior of these systems. In order to gain a greaterunderstanding of earthquake nucleation processes in fault gouge zones, itis important to characterize the relationships between the microscopic andmacroscopic mechanics. Computational simulation has played an importantrole in the analysis of complex granular materials, allowing researchers tovary micro-mechanical parameters and observe the resulting influence on themacro-mechanics of the computational model.
In particular, Distinct Element Methods (DEMs) [5,13,15] have success-fully been employed to simulate the dynamics of fault shear regions [7,14–20,22]. To date, the majority of results have been produced from 2D simulations,despite the fact that real fault zones are 3D entities. With the continual per-formance improvement of computing hardware, comes the opportunity tostudy computationally demanding 3D models of complex granular systems.Of specific interest is the influence of the out-of-plane particle dynamics onthe macroscopic behavior of 3D systems.
The Lattice Solid Model (LSM) [13,21] is a variant of the DEM whichhas been used to model the dynamics of fault gouge processes. LSM simula-tions of 2D faults have yielded results which provide an explanation of gougeweakness and the heat flow paradox [14,15] (HFP). Simulations with other2D DEMs, using round particles, also demonstrate low coefficients of frictiondue to rolling [18,20]. Typical 2D fault gouge models, using the LSM, haveinvolved tens of thousands of particles. For comparable 3D problems, particlenumbers can readily increase into the millions. These large 3D problems haveremained intractable for serial implementations of the LSM. Parallel com-puting architectures, such as the SGI Altix 3700 super-cluster, provide theopportunity to solve much larger computational problems than traditionalsingle processor systems. In order to take advantage of high performance sys-tems, a Message Passing Interface version of the LSM has been implemented[1]. Recent benchmarks demonstrated an 80% parallel efficiency for the par-allel LSM on 128 processors of the SGI Altix 3700 [10]. These results, forlarge 2D wave propagation problems, indicate the potential for the LSM tosimulate more computationally challenging 3D fault gouge dynamics.
This paper describes results from simulations of 2D and 3D gouge regionsusing the parallel implementation of the LSM. Section 2 gives an overviewof the LSM and the contact laws imposed on interacting particles, which isfollowed by a description of the fault gouge models in Section 3. A comparisonof the macroscopic friction (also termed the effective or fault friction) for a2D model and varying thicknesses of 3D model are presented in Section 4.
Power-law time-to-failure fits for the cumulative energy release and anevolution in size–frequency statistics in the lead up to large earthquake eventsare evidence that the crust behaves as a Critical Point (CP) system [4,9,23]. If this is the case, then intermediate earthquake prediction is possible.
Parallel 3D Lattice Solid Fault Gouge Simulation 3
However, the circumstances under which fault systems behave as CP systemsis still an open question. 2D LSM fault gouge simulations have previously beenshown to exhibit accelerating energy release and stress correlation functionevolution in simulated earthquake cycles [16,17]. In Section 5 it is shown that3D models also exhibit accelerating energy release and good fits of the powerlaw time-to-failure functions are obtained.
2 Lattice Solid Model
The LSM [13,21] is a particle based model similar to the DEM [5]. The modelconsists of spherical particles which are characterized by their radius, mass,position and velocity. The particles interact with their nearest neighboursby imparting elastic and frictional forces. Section 2.1 describes the particleinteractions employed in the 2D and 3D models introduced in Section 3.Section 2.2 briefly describes the parallel design of the LSM implementation.
2.1 Interactions
In the gouge simulations, particles were restricted to interact in one of twoways. A pair of particles could be involved in either a bonded interactionor in a frictional interaction with one another. A volume of bonded particlessimulates a linear elastic solid within the model. The force Fb
i,j which particlei exerts on a bonded neighbouring particle j is given by
Fbi,j = kb (|di,j | − (Ri + Rj))
(di,j
|di,j |
), (1)
where kb is the spring constant, Ri is the radius of particle i and di,j = ri−rj
with ri being the centre position of the particle i. From this equation, it canbe seen that the bonded force is repulsive if |di,j | < (Ri + Rj) and attractiveif |di,j | > (Ri + Rj).
A pair of particles i and j which are not bonded and which come intocontact (di,j < Ri + Rj) undergo a frictional interaction. In this case, theforce Ff
i,j which particle i exerts on particle j can be expressed in the form
Ffi,j = Ffr
i,j +
{Ffs
i,j , i and j in static friction contact,Ffd
i,j , i and j in dynamic friction contact(2a)
where Ffr
i,j is the elastic repulsive force i exerts on j, Ffs
i,j is the static frictionalforce which i imparts on j and Ffd
i,j is the dynamic or slipping frictional forcewhich i imparts on j. The expression for repulsive elastic force is identical inform to (1):
Ffr
i,j = kr (|di,j | − (Ri + Rj))(
di,j
|di,j |
), (2b)
4 Shane Latham, Steffen Abe and Peter Mora
with kr being the spring constant. When particles i and j are in static contactthe shear force is given by
Ffs
i,j = −ksdsi,je
Ti,j , (2c)
where ks is the shear spring constant, dsi,j is a circumferal shear displacement
and eTi,j a unit vector formed by projecting the the relative particle velocity
onto a plane with normal di,j . This tangent unit vector can be expressed as
eTi,j =
ti,j
|ti,j |,
whereti,j = ui,j −
ui,j · di,j
|di,j |2di,j ,
and ui,j = vi − vj is the velocity of particle j relative to particle i, with vi
the velocity of particle i. The dynamic friction force has the simple Coulombform
Ffd
i,j = −µP
∣∣∣Ffr
i,j
∣∣∣ eTi,j , (2d)
where µP is the intrinsic or inter–particle friction coefficient.The transition from static friction to dynamic friction occurs if∣∣∣Ffs
i,j + ksti,j∆t∣∣∣ > µP
∣∣∣Ffr
i,j
∣∣∣ .
where ∆t is a timestep size. The transition from dynamic to static frictionoccurs if ∣∣∣Ffd
i,j + ksti,j∆t∣∣∣ ≤ µP
∣∣∣Ffr
i,j
∣∣∣ .
All forces are applied at the particle centre, consequently, per–particlerotational dynamics are not modeled. With this constraint, particles slide pastone another, as opposed to rolling over one another. An artificial viscosity isalso present in the model to prevent the buildup of kinetic energy in theclosed system. The amount of viscous damping has been chosen such thatthe rupture dynamics are not significantly influenced [13].
2.2 Parallel Implementation
The parallel implementation of the LSM follows a modified master-workerprocess model with MPI (Message Passing Interface [12]) used as the inter-process communication layer. A master process provides a high level of controland external communication I/O facilities. The worker or slave processes per-form the particle interaction computations. In contrast to a pure master-slaveapproach, direct communication between worker processes is used instead ofcommunication involving the master process whenever possible. This designminimizes the computation performed by the master process and also greatlyreduces the amount of communication between master and worker processes.
Parallel 3D Lattice Solid Fault Gouge Simulation 5
Computation is shared among processes by assigning a subset of particlesto each worker. This distribution of particles is based on a regular-grid par-titioning of the geometrical domain. In addition to the particles located ina particular subregion, the data set assigned to each worker–processor alsocontains all particles interacting with any particle in the subregion. Due tothe short spatial range of the interactions, the number of duplicated bound-ary particles is small in comparison to the total number of particles. Theduplication of particles creates a small computational overhead, as the forcescomputed for an interaction involving a duplicated particle are computedin each relavent worker process. This small amount of duplicated computa-tion is justified because it reduces the cost of communication. More detaileddescriptions of the parallel implementation can be found in [1,10].
This parallelisation strategy has proven effective for a range of problems.In particular, benchmark 2D wave propagation models involving millions ofparticles [1,10] have been used to show good scaling behaviour on SMP ma-chines such as the SGI Origin3800, Compaq Alphaserver SC40 and the SGIAltix3700. Large 3D fault gouge models, similar to the models described inSection 3, involving hundreds of thousands of particles have also demonstratedgood scaling on the SGI Altix3700.
3 Fault Gouge Model
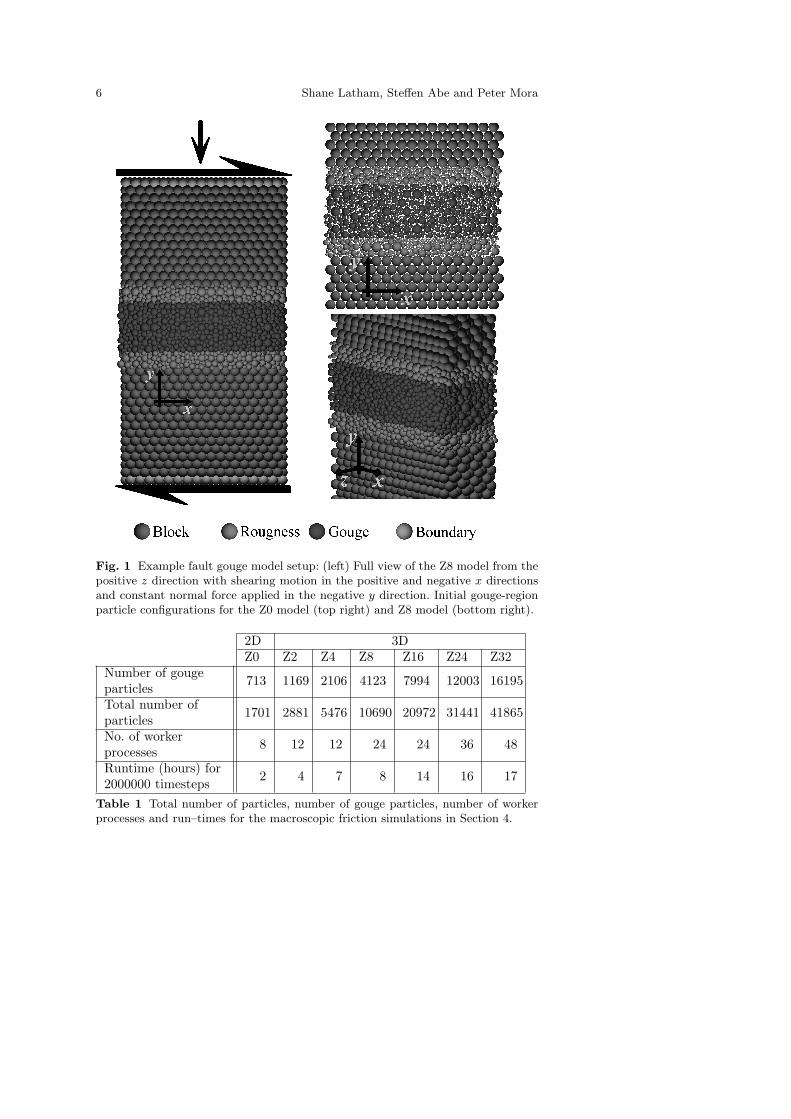
In the simulations, a fault gouge is represented as two rectangular elasticblocks of bonded particles, with a rough fault zone separated by a region ofrandomly sized non-bonded gouge particles. The elastic blocks are shearedin opposite directions by normally-loaded driving plates. Figure 1 illustratesthe particle model setup. The block particles are uniformly sized with radiusR0 = 500µm and bonded in a regular 3D lattice. The roughness particlesprovide surface-roughness and range in radial size from 0.4R0 to R0 in the 3Dmodels and from 0.165R0 to R0 in the 2D models. Each roughness particle isbonded to neighbouring block and roughness particles. The interaction forceson bonded particles are computed using equation (1).
The gouge particles are non-bonded, and impart forces on neighbouringgouge and roughness particles via the friction interaction described in equa-tions (2). The gouge particles have the same radial size range as the roughnessparticles. The boundary particles at the top and bottom of the elastic blocks,are elastically bonded to walls (not shown in Figure 1) which are parallel tothe x-z plane and apply compressive forces in the y direction. These walls arealso sheared in opposite x directions at constant velocity, as indicated by thearrows in the leftmost illustration of Figure 1. A circular boundary conditionoccurs on y-z planes at the left (x=0) and right (x = 34R0) extents of theparticle domain (a particle exiting the right hand side of the model reappearsat the left side and vice–versa). In the 3D models, fixed frictionless elasticconfining walls in the x-y planes prevent particles from being “squeezed” inthe z direction out of the gouge region. Simulation results from a single
6 Shane Latham, Steffen Abe and Peter Mora
Fig. 1 Example fault gouge model setup: (left) Full view of the Z8 model from thepositive z direction with shearing motion in the positive and negative x directionsand constant normal force applied in the negative y direction. Initial gouge-regionparticle configurations for the Z0 model (top right) and Z8 model (bottom right).
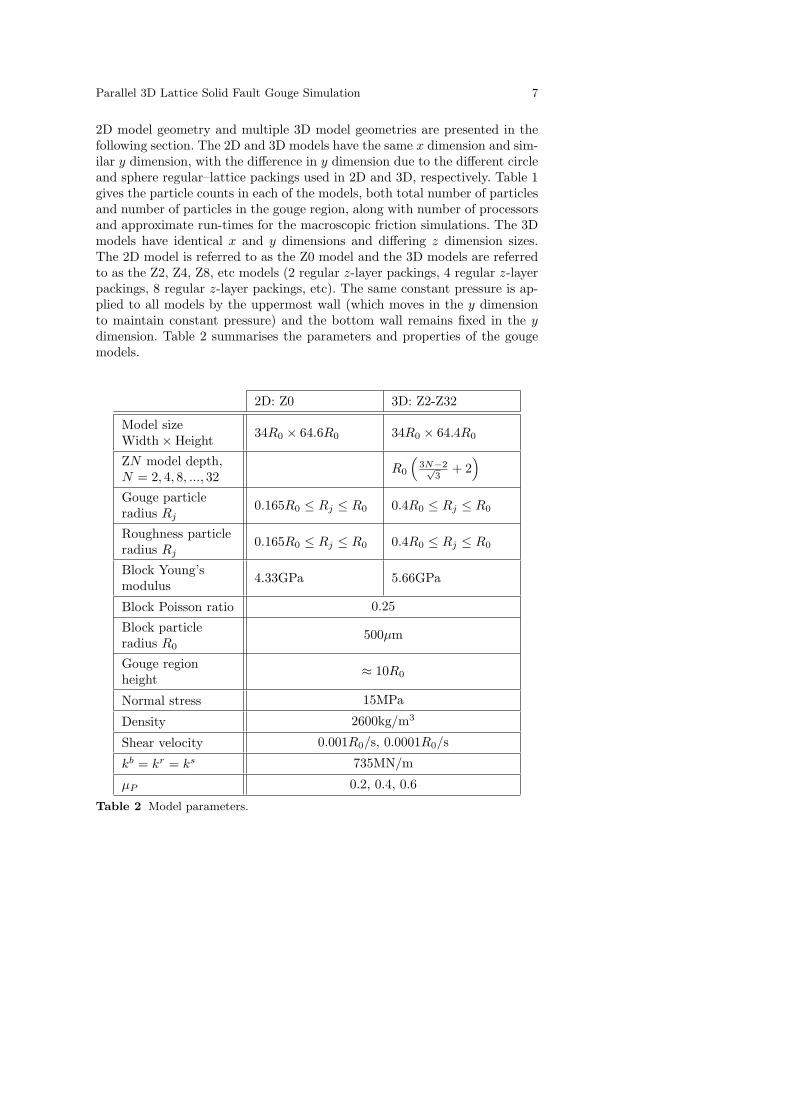
2D 3DZ0 Z2 Z4 Z8 Z16 Z24 Z32
Number of gougeparticles 713 1169 2106 4123 7994 12003 16195
Total number ofparticles 1701 2881 5476 10690 20972 31441 41865
No. of workerprocesses 8 12 12 24 24 36 48
Runtime (hours) for2000000 timesteps 2 4 7 8 14 16 17
Table 1 Total number of particles, number of gouge particles, number of workerprocesses and run–times for the macroscopic friction simulations in Section 4.
Parallel 3D Lattice Solid Fault Gouge Simulation 7
2D model geometry and multiple 3D model geometries are presented in thefollowing section. The 2D and 3D models have the same x dimension and sim-ilar y dimension, with the difference in y dimension due to the different circleand sphere regular–lattice packings used in 2D and 3D, respectively. Table 1gives the particle counts in each of the models, both total number of particlesand number of particles in the gouge region, along with number of processorsand approximate run-times for the macroscopic friction simulations. The 3Dmodels have identical x and y dimensions and differing z dimension sizes.The 2D model is referred to as the Z0 model and the 3D models are referredto as the Z2, Z4, Z8, etc models (2 regular z-layer packings, 4 regular z-layerpackings, 8 regular z-layer packings, etc). The same constant pressure is ap-plied to all models by the uppermost wall (which moves in the y dimensionto maintain constant pressure) and the bottom wall remains fixed in the ydimension. Table 2 summarises the parameters and properties of the gougemodels.
2D: Z0 3D: Z2-Z32
Model sizeWidth×Height 34R0 × 64.6R0 34R0 × 64.4R0
ZN model depth,N = 2, 4, 8, ..., 32
R0
(3N−2√
3+ 2
)Gouge particleradius Rj
0.165R0 ≤ Rj ≤ R0 0.4R0 ≤ Rj ≤ R0
Roughness particleradius Rj
0.165R0 ≤ Rj ≤ R0 0.4R0 ≤ Rj ≤ R0
Block Young’smodulus 4.33GPa 5.66GPa
Block Poisson ratio 0.25
Block particleradius R0
500µm
Gouge regionheight
≈ 10R0
Normal stress 15MPa
Density 2600kg/m3
Shear velocity 0.001R0/s, 0.0001R0/s
kb = kr = ks 735MN/m
µP 0.2, 0.4, 0.6
Table 2 Model parameters.
8 Shane Latham, Steffen Abe and Peter Mora
4 Macroscopic Friction
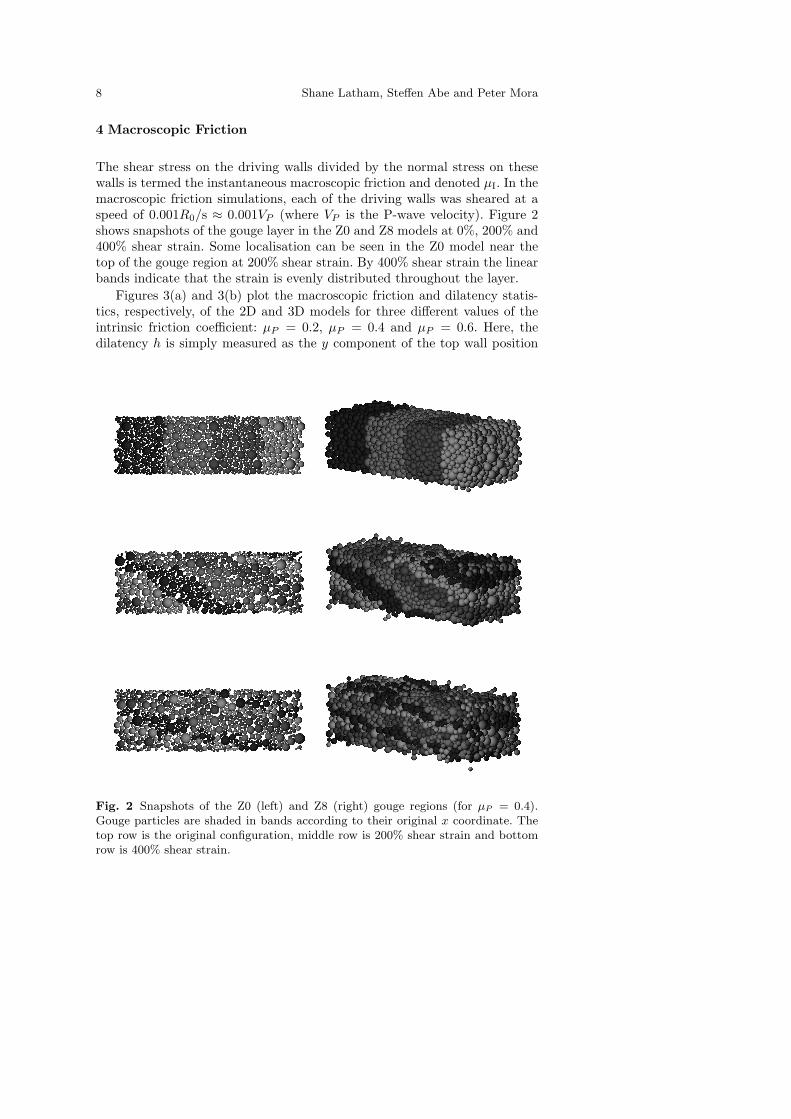
The shear stress on the driving walls divided by the normal stress on thesewalls is termed the instantaneous macroscopic friction and denoted µI. In themacroscopic friction simulations, each of the driving walls was sheared at aspeed of 0.001R0/s ≈ 0.001VP (where VP is the P-wave velocity). Figure 2shows snapshots of the gouge layer in the Z0 and Z8 models at 0%, 200% and400% shear strain. Some localisation can be seen in the Z0 model near thetop of the gouge region at 200% shear strain. By 400% shear strain the linearbands indicate that the strain is evenly distributed throughout the layer.
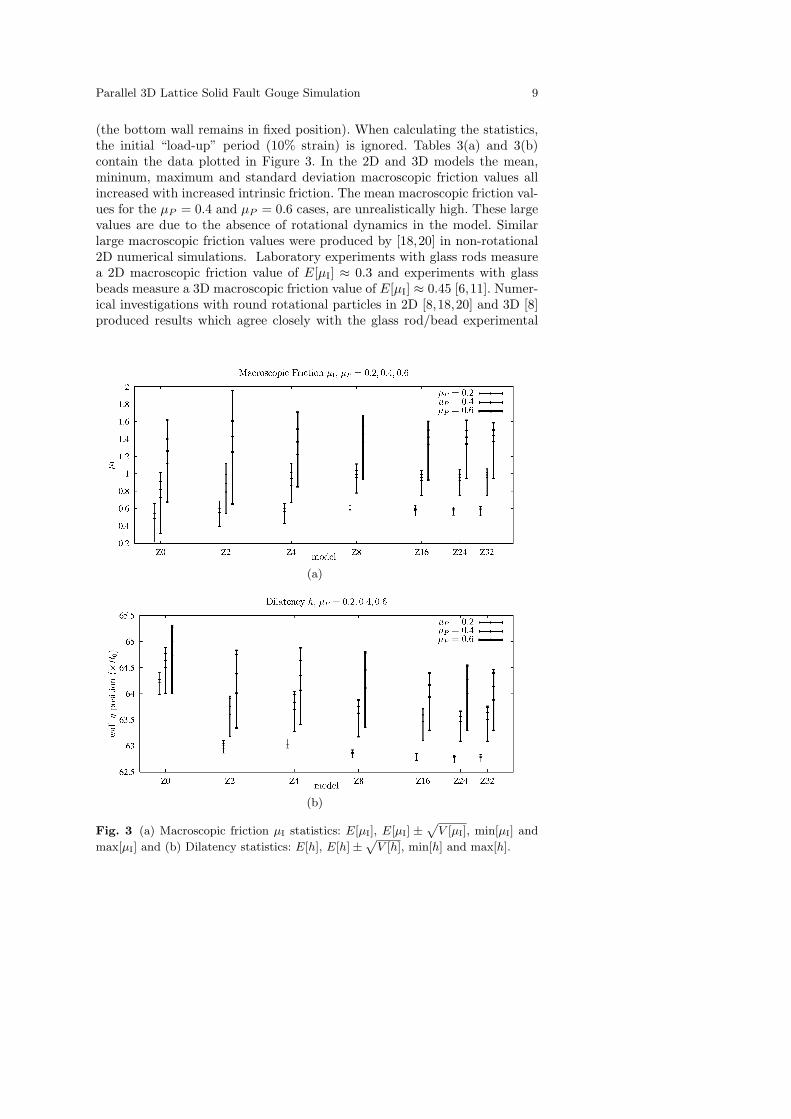
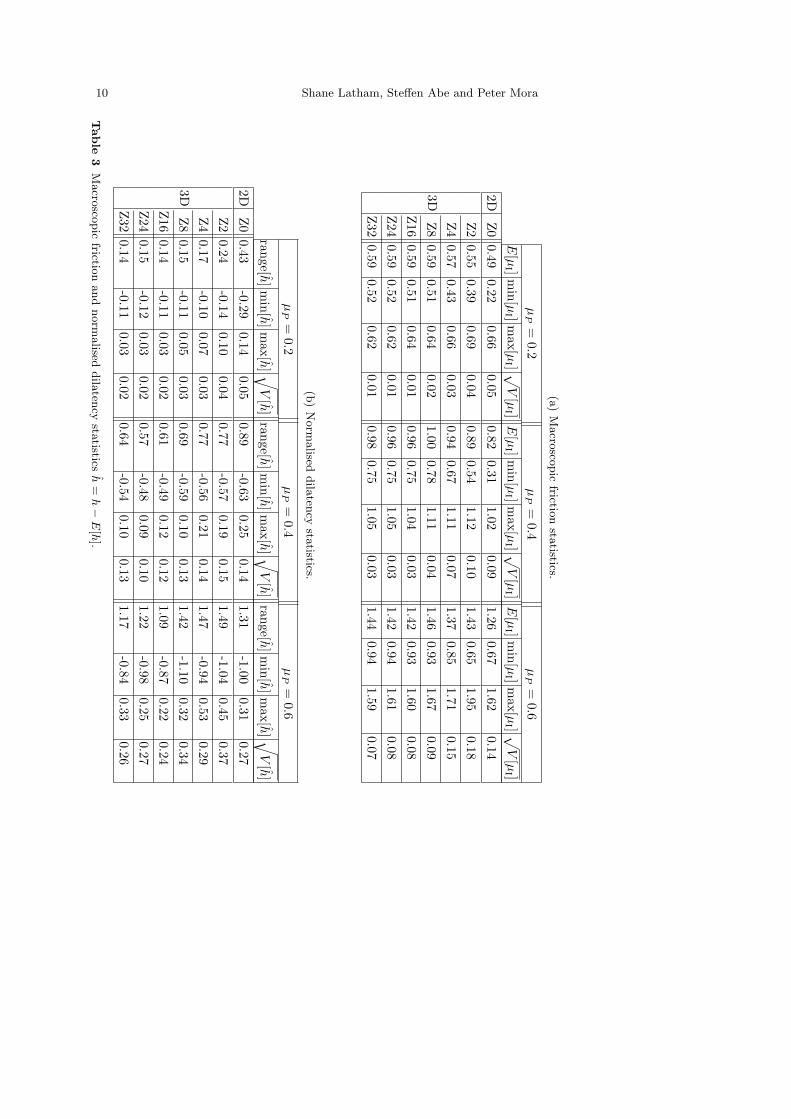
Figures 3(a) and 3(b) plot the macroscopic friction and dilatency statis-tics, respectively, of the 2D and 3D models for three different values of theintrinsic friction coefficient: µP = 0.2, µP = 0.4 and µP = 0.6. Here, thedilatency h is simply measured as the y component of the top wall position
Fig. 2 Snapshots of the Z0 (left) and Z8 (right) gouge regions (for µP = 0.4).Gouge particles are shaded in bands according to their original x coordinate. Thetop row is the original configuration, middle row is 200% shear strain and bottomrow is 400% shear strain.
Parallel 3D Lattice Solid Fault Gouge Simulation 9
(the bottom wall remains in fixed position). When calculating the statistics,the initial “load-up” period (10% strain) is ignored. Tables 3(a) and 3(b)contain the data plotted in Figure 3. In the 2D and 3D models the mean,mininum, maximum and standard deviation macroscopic friction values allincreased with increased intrinsic friction. The mean macroscopic friction val-ues for the µP = 0.4 and µP = 0.6 cases, are unrealistically high. These largevalues are due to the absence of rotational dynamics in the model. Similarlarge macroscopic friction values were produced by [18,20] in non-rotational2D numerical simulations. Laboratory experiments with glass rods measurea 2D macroscopic friction value of E[µI] ≈ 0.3 and experiments with glassbeads measure a 3D macroscopic friction value of E[µI] ≈ 0.45 [6,11]. Numer-ical investigations with round rotational particles in 2D [8,18,20] and 3D [8]produced results which agree closely with the glass rod/bead experimental
(a)
(b)
Fig. 3 (a) Macroscopic friction µI statistics: E[µI], E[µI] ±p
V [µI], min[µI] and
max[µI] and (b) Dilatency statistics: E[h], E[h]±p
V [h], min[h] and max[h].
10 Shane Latham, Steffen Abe and Peter Mora
(a)
Macro
scopic
friction
statistics.
µP
=0.2
µP
=0.4
µP
=0.6
E[µ
I ]min[µ
I ]max[µ
I ] √V
[µI ]
E[µ
I ]min[µ
I ]max[µ
I ] √V
[µI ]
E[µ
I ]min[µ
I ]max[µ
I ] √V
[µI ]
2DZ0
0.490.22
0.660.05
0.820.31
1.020.09
1.260.67
1.620.14
3D
Z2
0.550.39
0.690.04
0.890.54
1.120.10
1.430.65
1.950.18
Z4
0.570.43
0.660.03
0.940.67
1.110.07
1.370.85
1.710.15
Z8
0.590.51
0.640.02
1.000.78
1.110.04
1.460.93
1.670.09
Z16
0.590.51
0.640.01
0.960.75
1.040.03
1.420.93
1.600.08
Z24
0.590.52
0.620.01
0.960.75
1.050.03
1.420.94
1.610.08
Z32
0.590.52
0.620.01
0.980.75
1.050.03
1.440.94
1.590.07
(b)
Norm
alised
dila
tency
statistics.
µP
=0.2
µP
=0.4
µP
=0.6
range[h]min[h]m
ax[h] √V
[h]range[h]m
in[h]max[h] √
V[h]
range[h]min[h]m
ax[h] √V
[h]
2DZ0
0.43-0.29
0.140.05
0.89-0.63
0.250.14
1.31-1.00
0.310.27
3D
Z2
0.24-0.14
0.100.04
0.77-0.57
0.190.15
1.49-1.04
0.450.37
Z4
0.17-0.10
0.070.03
0.77-0.56
0.210.14
1.47-0.94
0.530.29
Z8
0.15-0.11
0.050.03
0.69-0.59
0.100.13
1.42-1.10
0.320.34
Z16
0.14-0.11
0.030.02
0.61-0.49
0.120.12
1.09-0.87
0.220.24
Z24
0.15-0.12
0.030.02
0.57-0.48
0.090.10
1.22-0.98
0.250.27
Z32
0.14-0.11
0.030.02
0.64-0.54
0.100.13
1.17-0.84
0.330.26
Table
3M
acro
scopic
friction
and
norm
alised
dila
tency
statistics
h=
h−
E[h
].
Parallel 3D Lattice Solid Fault Gouge Simulation 11
values. Laboratory experiments with angular sand [6,11] give a higher 3Dmacroscopic friction value of E[µI] ≈ 0.6. 2D numerical simulations [15,16,22], which account for rotational dynamics through the use of aggregate an-gular particles, also give macroscopic friction values of E[µI] ≈ 0.6. In partic-ular, the numerical results from [15,16,22] supported that for a wide range ofinterparticle friction values, the macroscopic friction remains at E[µI] ≈ 0.6when shearing is non-localised. For highly localised shear, the macroscopicfriction values can drop as low as E[µI] ≈ 0.3.
The first notable difference between the 2D and 3D cases are the meanvalues of the macroscopic friction - the 3D values are greater for each valueof intrinsic friction than the respective macroscopic friction values in the 2Dsimulations. This has been observed in similar numerical experiments [8] andconcurs with laboratory rod and bead experiments where the macroscopicfriction was measured to have higher mean values in 3D than 2D [6,11]. Theminimum macroscopic friction value also differs significantly between the 2Dand 3D models where the 3D models show a smaller range of instantaneousmacroscopic friction variation. While the minimum macroscopic friction valueis greater in all the 3D models than the 2D model, the maximum macroscopicfriction values for the larger 3D models are comparable to the 2D models.
The standard deviation values, in Table 3(a), of the Z2 and Z4 modelsare comparable with (and in some cases exceed) those of the 2D model. Itis expected that the variance in the macroscopic friction decreases as thenumber of particles in the model increases and certainly this is the case forthe Z8–Z32 models. In the thin z–dimension Z2 and Z4 cases, the particlesare hampered in the z direction of motion due to the close proximity of thefrictionless confining walls. Hence, particle reorganisation in this dimensionis restricted, promoting gouge dilation and subsequent larger oscillations inthe instantaneous friction. This is supported by the larger dilation maximumvalues for the Z2 and Z4 models in Table 3(b).
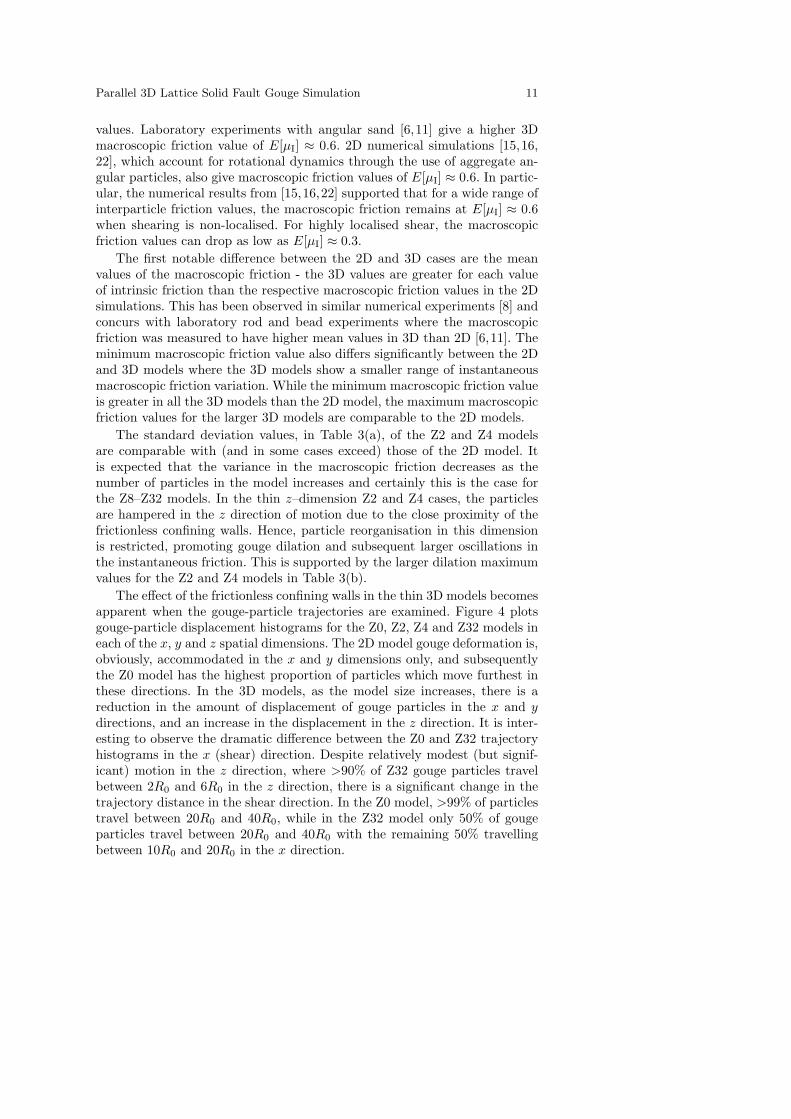
The effect of the frictionless confining walls in the thin 3D models becomesapparent when the gouge-particle trajectories are examined. Figure 4 plotsgouge-particle displacement histograms for the Z0, Z2, Z4 and Z32 models ineach of the x, y and z spatial dimensions. The 2D model gouge deformation is,obviously, accommodated in the x and y dimensions only, and subsequentlythe Z0 model has the highest proportion of particles which move furthest inthese directions. In the 3D models, as the model size increases, there is areduction in the amount of displacement of gouge particles in the x and ydirections, and an increase in the displacement in the z direction. It is inter-esting to observe the dramatic difference between the Z0 and Z32 trajectoryhistograms in the x (shear) direction. Despite relatively modest (but signif-icant) motion in the z direction, where >90% of Z32 gouge particles travelbetween 2R0 and 6R0 in the z direction, there is a significant change in thetrajectory distance in the shear direction. In the Z0 model, >99% of particlestravel between 20R0 and 40R0, while in the Z32 model only 50% of gougeparticles travel between 20R0 and 40R0 with the remaining 50% travellingbetween 10R0 and 20R0 in the x direction.
12 Shane Latham, Steffen Abe and Peter Mora
While the 2D vs 3D values of Table 3(a) agree qualitatively with experi-ment, laboratory mean macroscopic friction values for 3D glass bead experi-ments (0.45) exceed the 2D glass rod mean friction values (0.3) by more than30% [6,11]. The 3D mean values in Table 3(a) exceed the corresponding 2Dvalues by at most 22%. Again, this is likely to be an artifact of the absence
Fig. 4 Gouge particle displacement histograms in the x (top), y (middle) and z(bottom) directions in the µP = 0.2 models.
Parallel 3D Lattice Solid Fault Gouge Simulation 13
of rotational dynamics within the models. Further numerical investigations,which incorporate rotational effects, need to be conducted in order to resolvethe current quantitative differences between laboratory experiment and thenumerical simulation results.
5 Accelerating Energy Release
An increasing number of field observations suggest an evolutionary behaviorof earthquakes. These observations support the Critical Point (CP) hypoth-esis, which suggests that the largest earthquakes can only occur after thesystem has reached a critical state (when stress correlations exist in the sys-tem at all length scales). A power law time-to-failure function has found tofit well with the observed Benioff strain release in the lead-up to some largeevents [3,9]. Therefore, it is of interest to determine whether this same powerlaw time-to-failure function fits cycles in simulated earthquakes. 2D LSMgouge models have previously shown accelerating energy release and stresscorrelation function evolution [16,17].
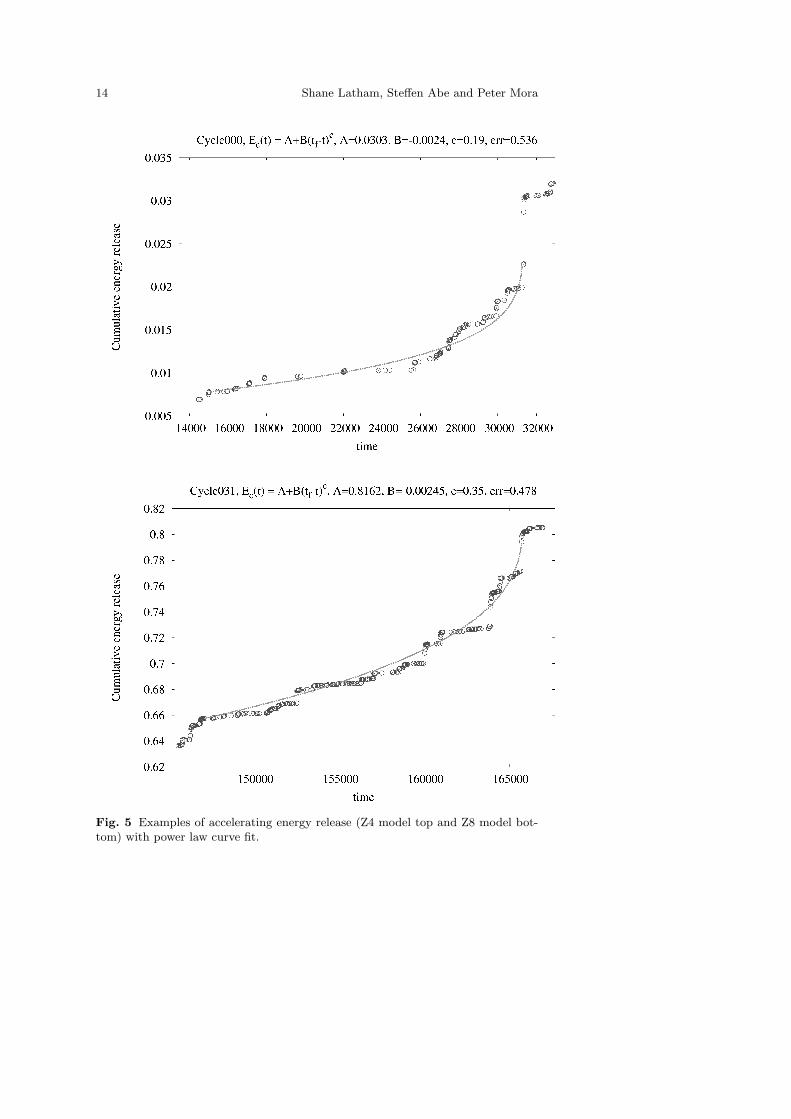
The 3D models were also seen to exhibit the accelerating energy releasebehaviour. Figure 5 shows two earthquake cycles, one from a Z4 model andone from a Z8 model. In these models, the inter-particle friction was set asµP = 0.6 and the shear velocity of the driving plates was slowed by a factorof 10 to 0.0001VP . Each small circle in Figure 5 represents the occurrence ofsimulated earthquake. As well as the cumulative energy release for the cycle,this figure plots an associated fit of the power law function
Ec(t) = A + B(tf − t)c (3)
where A, B, c and tf are the fit parameters with tf representing the failuretime. The RMS error of the power law time-to-failure fit divided by the RMSerror of a linear fit provides a quality–measure for the time-to-failure fits [2].The lower the quality-measure value, the more superior the power-law fitwhen compared with the linear fit. The earthquake cycles of Figure 5, showgood fits of the power law function, with quality–measure values of 0.536 forthe Z4 cycle and 0.478 for the Z8 cycle.
These initial 3D results provide further support for the CP hypothesis.Accelerating energy release is not present before all large earthquake events(simulated or real). It seems possible, however, that the analysis of 3D nu-merical models will provide insight as to the conditions under which a fault(or fault network) behaves as a CP system.
14 Shane Latham, Steffen Abe and Peter Mora
Fig. 5 Examples of accelerating energy release (Z4 model top and Z8 model bot-tom) with power law curve fit.
Parallel 3D Lattice Solid Fault Gouge Simulation 15
6 Conclusions
Using a parallel/MPI implementation of the LSM, simulations of a simplifiedfault gouge produced higher mean macroscopic friction values in 3D modelsthan in 2D models. These simulations support the hypothesis that friction isgreater in 3D than in 2D due to the extra dimension of particle interaction.For the thin 3D models, an end wall effect was observed which restrictedgouge particle motion in the z-dimension and resulted in higher maximummacroscopic friction response than the thickest 3D models. Particle trajec-tories, in the 3D models, were shown to have a significant z displacement(Figure 4), and this dramatically reduced particle displacement in the direc-tion of shear. These results demonstrate the important influence of the thirddimension on both the microscopic and macroscopic dynamics of shear zones.
The 3D gouge simulations have also produced instances of acceleratingenergy release in the lead-up to the larger simulated earthquake events. Thisprovides further support for the CP hypothesis.
The unrealisticly high values observed for the mean macroscopic frictionin both the 2D and 3D models is due to the lack of rotational dynamics inthe model. Future simulation studies will incorporate rotational dynamicsboth directly (by assigning angular properties to individual particles) andindirectly (through the use of bonded aggregates of particles in the gougeregion). By generating 3D models with bonded-aggregate grains, the effectsof grain angularity and grain disintegration on the macroscopic behaviour ofthe 3D system can be studied and their importance to earthquake processesevaluated.
ACKNOWLEDGMENTS
The authors would like to thank Julia Morgan for her review comments,which improved the quality of the manuscript. Funding support for this workis gratefully acknowledged. Project work is supported by the Australian Com-putational Earth Systems Simulator Major National Research Facility, TheUniversity of Queensland and SGI. The ACcESS MNRF is funded by theAustralian Commonwealth Government and participating institutions (Uni.of Queensland, Monash Uni., Melbourne Uni., VPAC, RMIT) and the Victo-rian State Government. Computations were made using the ACcESS MNRFsupercomputer, a 208 processor 1.1 TFlops SGI Altix 3700, which was fundedby the Queensland State Government Smart State Research Facility Fund andSGI.
References
1. Abe, S., Place, D., , and Mora, P. (2004), A parallel implementation of the latticesolid model for the simulation of rock mechanics and earthquake dynamics. PureAppl. Geophys. 161, 2265–2277.
16 Shane Latham, Steffen Abe and Peter Mora
2. Bowman, D. D., Ouillon, G., Sammis, C. G., Sornette, D., and Sornette, A.(1998), An observational test of the critical earthquake concept. J. Geophys.Res. 94, 15635–15637.
3. Bufe, C. G., Nishenko, S. P., and Varnes, D. J. (1994), Seismicity trends andpotential for large earthquakes in the Alaska-Aleutian region. Pure Appl. Geo-phys. 142, 83–89.
4. Bufe, C. G. and Varnes, D. (1993), Predictive modeling of the seismic cycle inthe Greater San Francisco Bay Region. J. Geophys. Res. 98, 9871–9983.
5. Cundall, P. A. and Strack, O. A. D. (1979), A discrete numerical model forgranular assemblies. Geotechnique. 29, 47–65.
6. Frye, K. M. and Marone, C. (2002), The effect of particle dimensionality ongranular friction in laboratory shear zones. Geophys. Res. Lett. 29.
7. Guo, Y. and Morgan, J. (2004), Influence of normal stress and grain shape ongranular friction: Results of discrete element simulations. J. Geoph. Res. 109.doi:10.1029/2004JP003044.
8. Hazzard, J. F. and Mair, K. (2003), The importance of the third dimension ingranular shear. Geophys. Res. Lett. 30(13). 10.1029/2003GL017534.
9. Jaume, S. C. and Sykes, L. R. (1999), Evolving towards a critical point: areview of accelerating seismic moment/energy release prior to large and greatearthquakes. Pure Appl. Geophys. 155, 279–305.
10. Latham, S., Abe, S., and Davies, M. (2004), Scaling evaluation of the latticesolid model on the SGI Altix 3700, In HPCAsia2004, Proceedings of the 7thInternational Conference on High Performance Computing and Grid in the AsiaPacific Region, pp. 226–233.
11. Mair, K., Frye, K. M., and Marone, C. (2002), Influence of grain characteristicson the friction of granular shear zones. J. Geophys. Res. 107.
12. Message Passing Interface Forum. (1997), MPI-2: Extensions to the Message-Passing Interface.
13. Mora, P. and Place, D. (1994), Simulation of the frictional stick-slip instability.Pure Appl. Geophys. 143, 61–87.
14. Mora, P. and Place, D. (1998), Numerical simulation of earthquake faults withgouge: towards a comprehensive explanation for the heat flow paradox. J. Geo-phys. Res. 103, 21067–21089.
15. Mora, P. and Place, D. (1999), The weakness of earthquake faults. Geophys.Res. Lett. 26(1), 123–126.
16. Mora, P., Place, D., Abe, S., and Jaume, S. Lattice solid simulation of thephysics of earthquakes: the model, results and directions. In GeoComplexity andthe Physics of Earthquakes (ed. Rundle, J., Turcotte, D., and Klein, W.), Geo-physical Monograph Series, no. 120. (American Geophys. Union, WashingtonDC 2000), pp. 105–125.
17. Mora, P. and Place, D. (2002), Stress correlation function evolution in latticesolid elasto-dynamic models of shear and fracture zones and earthquake predic-tion. Pure Appl. Geophys. 159, 2413–2427.
18. Morgan, J. K. (1999), Numerical simulations of granular shear zones using thedistinct element method: II. The effect of particle size distribution and inter-particle friction on mechanical behaviour. J. Geoph. Res. 104, 2721–2732.
19. Morgan, J. K. and Boettcher, M. S. (1999), Numerical simulations of granularshear zones using the distinct element method: I. Shear zone kinematics and themicromechnics of localization. J. Geoph. Res. 104, 2703–2719.
Parallel 3D Lattice Solid Fault Gouge Simulation 17
20. Morgan, J. K. (2004), Particle dynamics simulations of rate- and state-dependent frictional sliding of granular fault gouge. Pure Appl. Geophys. 161,1877–1891.
21. Place, D. and Mora, P. (1999), The lattice solid model to simulate the physicsof rocks and earthquakes: incorporation of friction. J. Comp. Physics. 150,332–372.
22. Place, D. and Mora, P. (2000), Numerical simulation of localisation phenomenain a fault zone. Pure Appl. Geophys. 157, 1821–1845.
23. Sykes, L. R. and Jaume, S. C. (1990), Seismic activity on neighboring faultsas a long-term precursor to large earthquakes in the San Francisco Bay region.Nature. 348, 595–599.