Papermaking Factors Affecting Lateral Web Position during ...
146
Western Michigan University Western Michigan University ScholarWorks at WMU ScholarWorks at WMU Master's Theses Graduate College 12-2017 Papermaking Factors Affecting Lateral Web Position during Papermaking Factors Affecting Lateral Web Position during Commercial Heat Set Web Offset Printing Commercial Heat Set Web Offset Printing George W. Shields Follow this and additional works at: https://scholarworks.wmich.edu/masters_theses Part of the Chemical Engineering Commons, and the Wood Science and Pulp, Paper Technology Commons Recommended Citation Recommended Citation Shields, George W., "Papermaking Factors Affecting Lateral Web Position during Commercial Heat Set Web Offset Printing" (2017). Master's Theses. 1991. https://scholarworks.wmich.edu/masters_theses/1991 This Masters Thesis-Open Access is brought to you for free and open access by the Graduate College at ScholarWorks at WMU. It has been accepted for inclusion in Master's Theses by an authorized administrator of ScholarWorks at WMU. For more information, please contact [email protected].
Transcript of Papermaking Factors Affecting Lateral Web Position during ...
Western Michigan University Western Michigan University
ScholarWorks at WMU ScholarWorks at WMU
Master's Theses Graduate College
12-2017
Papermaking Factors Affecting Lateral Web Position during Papermaking Factors Affecting Lateral Web Position during
Commercial Heat Set Web Offset Printing Commercial Heat Set Web Offset Printing
George W. Shields
Follow this and additional works at: https://scholarworks.wmich.edu/masters_theses
Part of the Chemical Engineering Commons, and the Wood Science and Pulp, Paper Technology
Commons
Recommended Citation Recommended Citation Shields, George W., "Papermaking Factors Affecting Lateral Web Position during Commercial Heat Set Web Offset Printing" (2017). Master's Theses. 1991. https://scholarworks.wmich.edu/masters_theses/1991
This Masters Thesis-Open Access is brought to you for free and open access by the Graduate College at ScholarWorks at WMU. It has been accepted for inclusion in Master's Theses by an authorized administrator of ScholarWorks at WMU. For more information, please contact [email protected].

PAPERMAKING FACTORS AFFECTING LATERAL WEB POSITION DURING COMMERCIAL
HEAT SET WEB OFFSET PRINTING
by
George W. Shields
A thesis submitted to the Graduate College in partial fulfillment of the requirements
for the degree of Master of Science Paper and Imaging Science and Engineering
Western Michigan University December 2017
Thesis Committee: Alexandra Pekarovicova, Ph.D., Chair Paul D. Fleming, Ph.D. Jan Pekarovic, Ph.D.

PAPERMAKING FACTORS AFFECTING LATERAL WEB POSITION DURING COMMERCIAL HEAT SET WEB OFFSET PRINTING
George W. Shields, M.S.
Western Michigan University, 2017
The interaction of water with paper plays a role in web handling characteristics during
commercial heat set web offset printing. Water absorption leads to lower web tension for a
given strain.
This research investigates paper properties and their role in preventing lateral web
movement from cross machine air flows in the drying section during normal printing
operations. Tensile properties of sheets are measured at various moisture contents and then
used to determine the equilibrium stress-strain relationship for papers at moisture contents
typical of heat set web offset printing. Permeability, fiber orientation and tensile stiffness are
evaluated against lateral web movement on press. To ascertain whether the absolute amount
of water absorbed or the rate of water absorption is more important, absorption rates are
measured ultrasonically and compared to performance on the printing press. And, an
experimental test is investigated where elongation is measured against changes in relative
humidity.
Understanding the effect of water absorption and absorption rate on the stress-strain
relationship of paper may yield further understanding of web break tendency during heat set
web offset printing.

ii
ACKNOWLEDGEMENTS
Drs. Alexandra Pekarovicova, Dan Fleming and Jan Pekarovic, thank you for your
guidance and patience.
To my colleagues and clients in the business of paper making and printing, thank you for
your encouragement, support and discussions.
To Cathy, without your support and encouragement this would not have been possible.
George W. Shields

iii
TABLE OF CONTENTS
ACKNOWLEDGEMENTS ....................................................................................................................ii
LIST OF TABLES ................................................................................................................................ vi
LIST OF FIGURES ............................................................................................................................ viii
LIST OF ABBREVIATIONS .................................................................................................................. x
INTRODUCTION ............................................................................................................................... 1
PROBLEM STATEMENT .................................................................................................................... 1
LITERATURE REVIEW ....................................................................................................................... 4
General Features of the Stress-Strain Curve ............................................................................... 6
Wood Fiber Structure .................................................................................................................. 9
Wood Pulp Fiber Characteristics ............................................................................................... 13
Chemical pulping ................................................................................................................... 13
Mechanical pulping................................................................................................................ 14
Stock preparation .................................................................................................................. 18
Fiber deformations ................................................................................................................ 19
Fiber Bonding in Dry Paper ....................................................................................................... 20
Hydrogen bonds .................................................................................................................... 21
Bond area ............................................................................................................................... 22
Papermaking.............................................................................................................................. 26
Forming .................................................................................................................................. 26
Table of Contents - continued
iii
Formation ........................................................................................................................... 27
Material distribution in thickness direction ...................................................................... 28
Fiber orientation ................................................................................................................ 29
Fiber orientation misalignment ......................................................................................... 29
Pressing .................................................................................................................................. 32
Drying ..................................................................................................................................... 32
Effects on single fibers ....................................................................................................... 33
Effects on paper ................................................................................................................. 36
Coating, supercalendering and winding ................................................................................ 37
The Stress-Strain Relationship of Dry Paper ............................................................................. 38
The Effect of Water on the Stress-Strain Relationship of Paper ............................................... 48
Salmen’s laminate model ...................................................................................................... 48
Softening of the wood polymers ........................................................................................... 49
Hygro/hydro-expansion. ........................................................................................................ 52
Creep. ..................................................................................................................................... 52
Moisture Transport in Paper ..................................................................................................... 53
The HSWO Printing Process ...................................................................................................... 58
Reels, pre-tensioning and web guiding. ................................................................................ 58
The printing unit. ................................................................................................................... 59
Blanket washing. .................................................................................................................... 63
Drying. .................................................................................................................................... 64

Table of Contents - continued
iv
Chill section. ........................................................................................................................... 65
Silicone application. ............................................................................................................... 65
Web guiding, slitting and turner bars. ................................................................................... 65
Folding. .................................................................................................................................. 66
Web handling during printing................................................................................................ 67
Previous Mill Trials .................................................................................................................... 69
Sensitivity to printing press operations. ................................................................................ 70
Sensitivity to pulping methods. ............................................................................................. 73
Sensitivity to apparent density profiles ................................................................................. 77
EXPERIMENTAL ............................................................................................................................. 81
Printing Press Trials ................................................................................................................... 81
Laboratory Testing .................................................................................................................... 82
Load-elongation response ..................................................................................................... 82
Moisture content. .................................................................................................................. 83
Absorption rate ...................................................................................................................... 83
Ultrasonic intensity. ........................................................................................................... 83
Air permeability. ................................................................................................................ 84
Fiber orientation. ................................................................................................................... 84
Ultrasonic measurement. .................................................................................................. 84
MD/CD tensile ratio. .......................................................................................................... 85
Hygroexpansion and creep. ................................................................................................... 85

Table of Contents - continued
v
RESULTS AND DISCUSSION ........................................................................................................... 87
Printing Trial Results .................................................................................................................. 87
Laboratory Testing .................................................................................................................... 90
Load-elongation response vs relative humidity. ................................................................... 90
Absorption rate ...................................................................................................................... 93
EMTEC ultrasonic intensity ................................................................................................ 94
Air permeability ................................................................................................................. 99
Fiber orientation .................................................................................................................. 100
MD/CD tensile ratio. ........................................................................................................ 100
Ultrasonic measurement. ................................................................................................ 102
Creep and hydroexpansion. ................................................................................................. 104
CONCLUSIONS ............................................................................................................................. 107
FUTURE WORK ............................................................................................................................ 108
APPENDIX A ................................................................................................................................. 110
APPENDIX B ................................................................................................................................. 111
APPENDIX C ................................................................................................................................. 116
REFERENCES ................................................................................................................................ 127
vi
LIST OF TABLES
1. Wood polymer components of hardwoods and softwoods. .................................................... 13
2. Observations of wood material in fractions of mechanical pulp.............................................. 16
3. Modulus parameter for Salmen’s laminate model of the fiber wall. ....................................... 49
4. Results of pulp trials on lateral web position at chill section exit. ........................................... 74
5. Response of dampening solution on lateral web position for two paper machines................ 76
6. Caliper and paper density data for the target and competitive paper machine. ..................... 80
7. Print trial results for target paper machine conditions. ........................................................... 88
8. Ultrasonic intensity measurements according to Gigac, et al. for selected samples. .............. 97
9. Ultrasonic measurements for target PM conditions and one competitive paper. ................ 103
10. Tensile properties, moisture content and Gurley permeability of tested papers. ............... 112
11. Ultrasonic TSI measurements, competitive coated PM. ...................................................... 116
12. Ultrasonic TSI measurement, target PM standard condition. .............................................. 117
13. Ultrasonic TSI measurement, target PM edge flow closed. ................................................. 118
14. Ultrasonic TSI measurements, target PM, higher strain at 20% solids. ............................... 119
15. Ultrasonic TSI measurements, target PM, reduced J/W ratio. ............................................. 120
16. Ultrasonic TSI measurements, target PM increased kraft refining. ..................................... 121
17. Ultrasonic TSI measurements, target PM decreased kraft refining. .................................... 122
18. Ultrasonic TSI measurements, target PM no groundwood refining. .................................... 123

List of Tables – continued
vii
19. Ultrasonic TSI measurements, target PM reduced wet end starch...................................... 124
20. Ultrasonic TSI measurements, target PM increased wet end starch. .................................. 125
21. Ultrasonic TSI measurements, target PM reduced dryer restraint. ..................................... 126
viii
LIST OF FIGURES
1. Load-elongation curve. ............................................................................................................... 6
2. Diagram of wood fiber cell wall arrangement. ......................................................................... 11
3. Fiber, filler and pore distributions and SEM image of sheet cross section. ............................. 28
4. Jet/Wire ratio. ........................................................................................................................... 29
5. Fiber orientation originating from headbox. ............................................................................ 31
6. Flow disturbances caused by slice lip deflection. ..................................................................... 31
7. Failure envelopes for same paper at two moisture contents and range of temperatures. ..... 51
8. Offset printing process schematic. ........................................................................................... 59
9. Two sided offset printing. ......................................................................................................... 62
10. Color separations and overprinting for reproduction in four-color offset printing. .............. 63
11. Dryer nozzle arrangement. ..................................................................................................... 64
12. Turner bar section. .................................................................................................................. 66
13. Ribbons, former and folder schematic. .................................................................................. 67
14. Lateral disturbance on web. ................................................................................................... 69
15. Tension loss from infeed to chill section exit for two papers. ................................................ 71
16. Schematic of printing press and mechanism of lateral web shift. ......................................... 72
17. Caliper and basis weight cross direction profiles for the target paper machine. .................. 78
18. Caliper and basis weight cross direction profiles for a competitive paper machine. ............ 79
19. Paper density variation by roll position for the target and competitive paper machines. .... 80
20. Target printing press chill section exit. ................................................................................... 82
List of Figures – continued
ix
21. Creep and hygroexpansion test set up. .................................................................................. 85
22. Humidity and creep measurement schematic. ....................................................................... 87
23. Print trial results for target paper machine conditions. ......................................................... 89
24. Load-elongation curves for a typical paper sample at 4 humidity levels. .............................. 90
25. Tensile stiffness (tangent line) of load-elongation curves shown in Figure 24. ..................... 91
26. Linear regression for tensile stiffness vs paper moisture content for sample in Figure 24. .. 92
27. Tensile stiffness at printed moisture for paper sample shown in Figure 24. ......................... 92
28. Tensile stiffness at printed moisture content for tested paper samples. .............................. 93
29. Ultrasonic absorption using distilled water as the penetrating medium. .............................. 94
30. Ultrasonic absorption using 16% IPA in water as the penetrating liquid. .............................. 95
31. Gurley permeability results................................................................................................... 100
32. Fiber orientation as measured by tensile ratio. ................................................................... 101
33. Ultrasonic tensile properties test results. ............................................................................. 103
34. Creep and hygroexpansion test results for three paper samples. ....................................... 106
35. Diagram of the target printing press. ................................................................................... 110
x
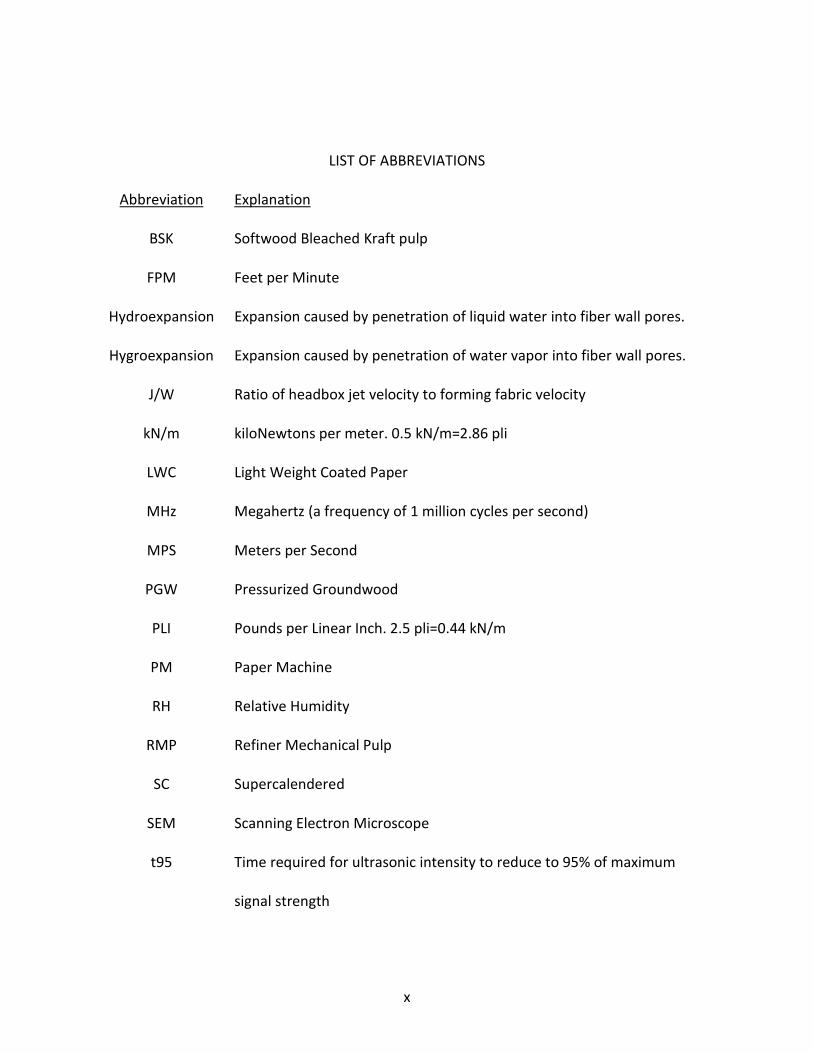
LIST OF ABBREVIATIONS
Abbreviation Explanation
BSK Softwood Bleached Kraft pulp
FPM Feet per Minute
Hydroexpansion Expansion caused by penetration of liquid water into fiber wall pores.
Hygroexpansion Expansion caused by penetration of water vapor into fiber wall pores.
J/W Ratio of headbox jet velocity to forming fabric velocity
kN/m kiloNewtons per meter. 0.5 kN/m=2.86 pli
LWC Light Weight Coated Paper
MHz Megahertz (a frequency of 1 million cycles per second)
MPS Meters per Second
PGW Pressurized Groundwood
PLI Pounds per Linear Inch. 2.5 pli=0.44 kN/m
PM Paper Machine
RH Relative Humidity
RMP Refiner Mechanical Pulp
SC Supercalendered
SEM Scanning Electron Microscope
t95 Time required for ultrasonic intensity to reduce to 95% of maximum
signal strength

List of Abbreviations – continued
xi
TAPPI Technical Association of the Pulp and Paper Industry
TMP Thermomechanical Pulp
TSI Tensile Stiffness Index
USI70 The ultrasonic intensity measurement 70 ms after start of test
1
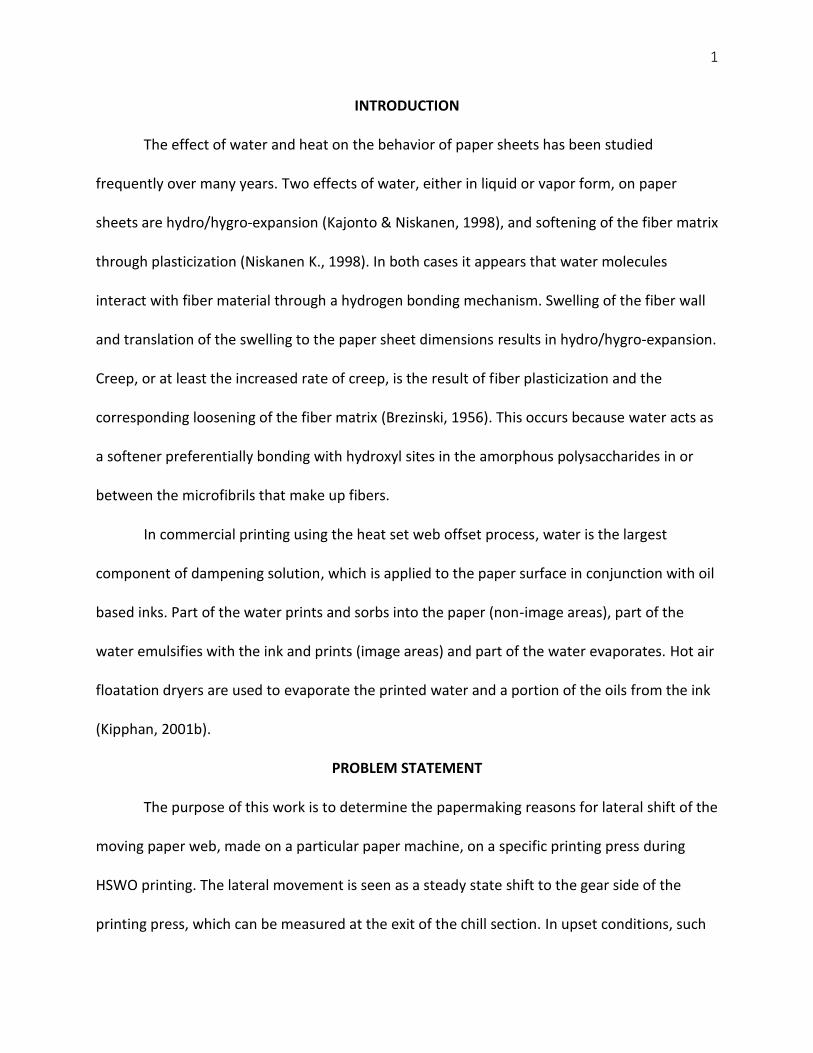
INTRODUCTION
The effect of water and heat on the behavior of paper sheets has been studied
frequently over many years. Two effects of water, either in liquid or vapor form, on paper
sheets are hydro/hygro-expansion (Kajonto & Niskanen, 1998), and softening of the fiber matrix
through plasticization (Niskanen K., 1998). In both cases it appears that water molecules
interact with fiber material through a hydrogen bonding mechanism. Swelling of the fiber wall
and translation of the swelling to the paper sheet dimensions results in hydro/hygro-expansion.
Creep, or at least the increased rate of creep, is the result of fiber plasticization and the
corresponding loosening of the fiber matrix (Brezinski, 1956). This occurs because water acts as
a softener preferentially bonding with hydroxyl sites in the amorphous polysaccharides in or
between the microfibrils that make up fibers.
In commercial printing using the heat set web offset process, water is the largest
component of dampening solution, which is applied to the paper surface in conjunction with oil
based inks. Part of the water prints and sorbs into the paper (non-image areas), part of the
water emulsifies with the ink and prints (image areas) and part of the water evaporates. Hot air
floatation dryers are used to evaporate the printed water and a portion of the oils from the ink
(Kipphan, 2001b).
PROBLEM STATEMENT
The purpose of this work is to determine the papermaking reasons for lateral shift of the
moving paper web, made on a particular paper machine, on a specific printing press during
HSWO printing. The lateral movement is seen as a steady state shift to the gear side of the
printing press, which can be measured at the exit of the chill section. In upset conditions, such
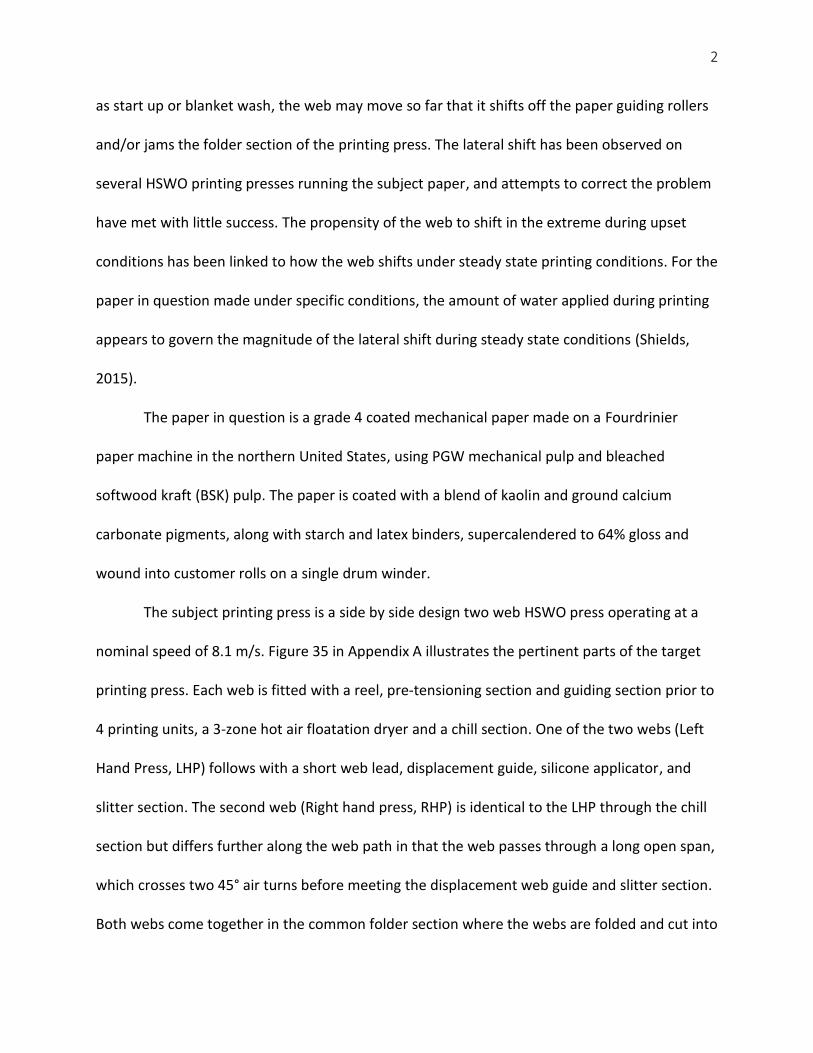
2
as start up or blanket wash, the web may move so far that it shifts off the paper guiding rollers
and/or jams the folder section of the printing press. The lateral shift has been observed on
several HSWO printing presses running the subject paper, and attempts to correct the problem
have met with little success. The propensity of the web to shift in the extreme during upset
conditions has been linked to how the web shifts under steady state printing conditions. For the
paper in question made under specific conditions, the amount of water applied during printing
appears to govern the magnitude of the lateral shift during steady state conditions (Shields,
2015).
The paper in question is a grade 4 coated mechanical paper made on a Fourdrinier
paper machine in the northern United States, using PGW mechanical pulp and bleached
softwood kraft (BSK) pulp. The paper is coated with a blend of kaolin and ground calcium
carbonate pigments, along with starch and latex binders, supercalendered to 64% gloss and
wound into customer rolls on a single drum winder.
The subject printing press is a side by side design two web HSWO press operating at a
nominal speed of 8.1 m/s. Figure 35 in Appendix A illustrates the pertinent parts of the target
printing press. Each web is fitted with a reel, pre-tensioning section and guiding section prior to
4 printing units, a 3-zone hot air floatation dryer and a chill section. One of the two webs (Left
Hand Press, LHP) follows with a short web lead, displacement guide, silicone applicator, and
slitter section. The second web (Right hand press, RHP) is identical to the LHP through the chill
section but differs further along the web path in that the web passes through a long open span,
which crosses two 45° air turns before meeting the displacement web guide and slitter section.
Both webs come together in the common folder section where the webs are folded and cut into
3
books. A key factor in the design of the target press is the extra distance the web travels
between the chill section and web guide on the RHP. The additional distance is 17.4 m.
Assuming a nominal press speed of 8.1 m/s the extra travel time before the web guide is 2.15 s.
The RHP web behavior is the subject of this work.
The hypothesis for why the lateral web shift occurs is related to the air currents within
the floatation dryers of HSWO printing presses. The air currents have a machine direction
component and a cross machine direction, or, lateral component. Low web tension allows the
lateral component of the air flow to move the paper web sideways. Papers with higher web
tension will be less impacted by the lateral air flows and therefore will be more centered on the
printing press. Moisture addition from printing will reduce the tensile stiffness of the paper,
swell the fibers giving rise to hydroexpansion and provide the conditions for increased creep.
All of these effects of moisture addition will have the result of reducing web tension. Drying of
the paper and ink will cause the fibers to contract and increase tensile stiffness, both of which
will increase web tension. The time from water application to drying during HSWO printing is
short and it is possible that the rate of tension loss is more important than residual steady state
tension.
The work for this thesis is divided into field and laboratory portions. The field work
involved making paper on the target paper machine, using various papermaking treatments to
manufacture 11 trial conditions. The trial conditions were printed on the target printing press
and the lateral position of the web at the exit of the chill section was recorded. The conditions
were ranked by deviation from the center position at the chill section exit. In this way,
papermaking factors that impact lateral position were identified.
4
In the laboratory papers from the 11 trial conditions, plus other papers, which do not
experience lateral web shift, were tested for load-elongation behavior and moisture content at
various humidity levels. The moisture content of the papers after printing but before drying was
calculated using a quantity of 3 g/m2 moisture estimated to be added during printing (Trollsas,
1995) (Kela & von Hertzen, 2007). The stress-strain curves for the papers at this elevated
moisture were estimated utilizing linear regression between tensile stiffness and paper
moisture content. The air permeability and water based absorption rates of the papers were
measured using ultrasonic techniques. And, the hygroexpansion and creep of paper under load
were tested for an estimate of hygroexpansion and creep potential during printing.
Hygroexpansion rather than hydroexpansion is studied due to the ease of conditioning paper to
a known moisture content by controlling the relative humidity of the testing environment.
Understanding the methods to reduce the lateral web movement may lead to further
understanding about the impacts of water on sheet properties during HSWO printing and
methods to reduce web break rates for papers made with mechanical pulps.
LITERATURE REVIEW
This thesis is concerned with the effect that paper properties and printing conditions
have on the lateral web position during HSWO printing. Web handling is a “collection of
engineering tools applied to the transport of webs through machines” (Roisum, 1998, p. 4). In a
discussion about material properties that affect web handling, the properties to be concerned
with are tensile strength, stretch, and elastic modulus (Roisum, 1998). In effect, Roisum is
describing the stress-strain curve of paper. Many variables affect the stress-strain relationship

5
of paper including wood source, pulping method, stock preparation methods, papermaking
processes and environmental conditions.
This literature review begins with a general overview of the stress-strain curve, the
corresponding load-elongation curve for paper webs and the properties that can be derived
from it. Next, the fiber properties of wood and wood pulp fibers are discussed. Papermaking
factors such as forming and drying, and the resulting anisotropic nature of machine made
papers, is covered with emphasis on fiber orientation and the straightening of fiber segments
during drying. Seth and Page developed a theory for the stress-strain relationship of paper
relating the shape of the curve to the properties of the constituent fibers and the bonding
between them. Fiber and papermaking factors are discussed in terms of how they relate to the
stress-strain behavior (Seth & Page, 1983).
The effect of moisture on paper properties is reviewed including a discussion on
moisture transport to and within the paper, the effect of moisture on fiber-fiber bonding and
the plasticizing effect of water on the wood polymers. Salmen’s laminate model of fibers
(Salmen N., 1986) is reviewed for information on the impact of water on the softening of the
wood polymers. The hygro/hydro-expansion and creep of fibers and paper is discussed in this
section as well.
Finally, some topics regarding printing and web handling are presented including results
of two previous printing trials, which serve as a background for this work. The impact of water
applied during printing, the differences between papers in response to the water and the
impact of pulp type are illustrated in previous work (Shields, 2015).
6
This review is not meant to be an exhaustive treatment of the above topics, rather it is
meant to touch on issues relevant to the problem at hand – the effect of water on lateral web
movement in HSWO printing.
General Features of the Stress-Strain Curve
In materials science, the stress-strain curve defines the response of a material to a
tensile or compressive force. The units of measurement are force per unit area of the test
specimen (N/m2, Pa), and strain as a percentage of the original specimen test length. The
specimen is stretched (or compressed) and the force required to strain the material is recorded.
In web handling work it is customary to deviate from the materials science norms for the
loading quantity of the specimen. Due to the difficulty in measuring the paper thickness given
the sample roughness and compressibility, it is customary to use the force per unit width of the
sample rather than the stress. In either case, the elastic response of the material can be
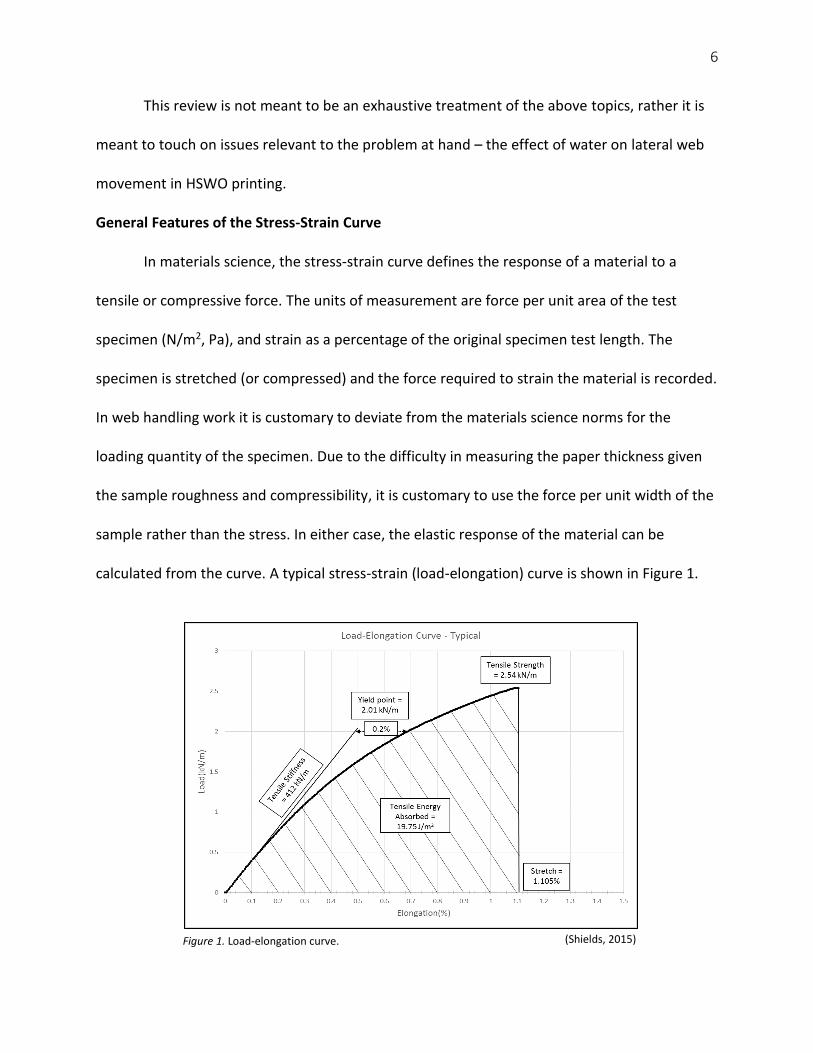
calculated from the curve. A typical stress-strain (load-elongation) curve is shown in Figure 1.
Figure 1. Load-elongation curve. (Shields, 2015)
7
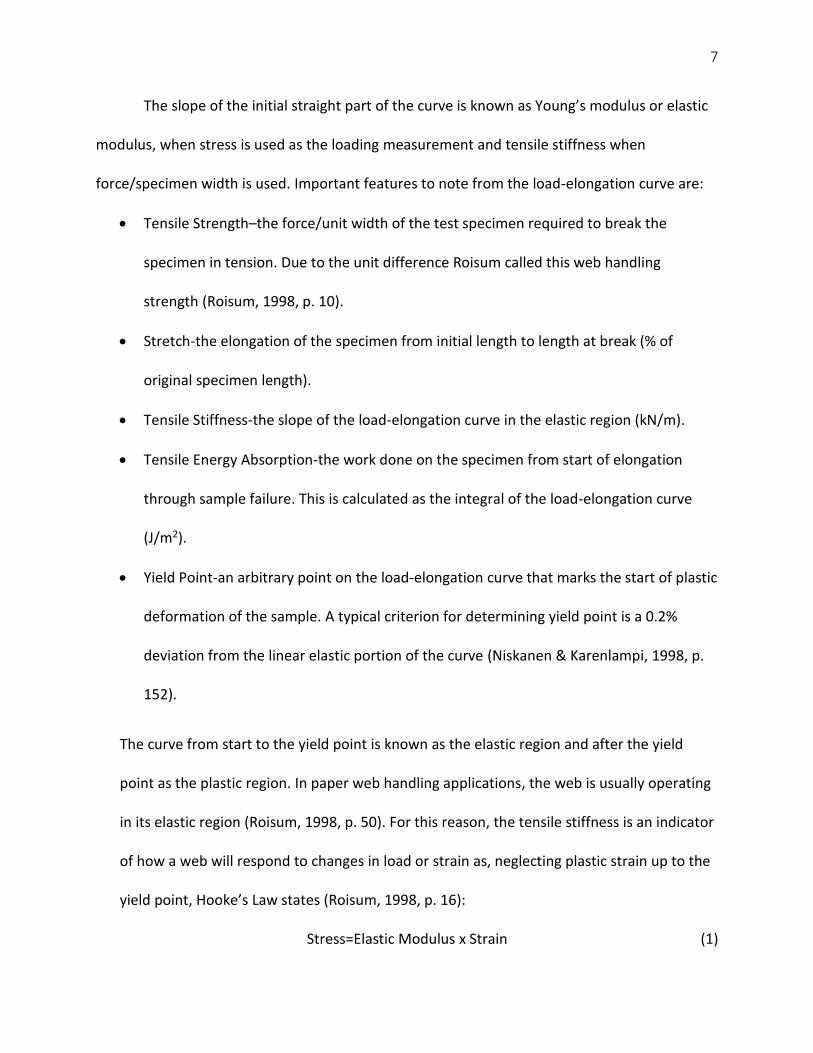
The slope of the initial straight part of the curve is known as Young’s modulus or elastic
modulus, when stress is used as the loading measurement and tensile stiffness when
force/specimen width is used. Important features to note from the load-elongation curve are:
Tensile Strength–the force/unit width of the test specimen required to break the
specimen in tension. Due to the unit difference Roisum called this web handling
strength (Roisum, 1998, p. 10).
Stretch-the elongation of the specimen from initial length to length at break (% of
original specimen length).
Tensile Stiffness-the slope of the load-elongation curve in the elastic region (kN/m).
Tensile Energy Absorption-the work done on the specimen from start of elongation
through sample failure. This is calculated as the integral of the load-elongation curve
(J/m2).
Yield Point-an arbitrary point on the load-elongation curve that marks the start of plastic
deformation of the sample. A typical criterion for determining yield point is a 0.2%
deviation from the linear elastic portion of the curve (Niskanen & Karenlampi, 1998, p.
152).
The curve from start to the yield point is known as the elastic region and after the yield
point as the plastic region. In paper web handling applications, the web is usually operating
in its elastic region (Roisum, 1998, p. 50). For this reason, the tensile stiffness is an indicator
of how a web will respond to changes in load or strain as, neglecting plastic strain up to the
yield point, Hooke’s Law states (Roisum, 1998, p. 16):
Stress=Elastic Modulus x Strain (1)
8
Substituting Force/unit width for stress and Tensile Stiffness for Elastic Modulus (Roisum,
1998, p. 50):
Web Tension=Tensile Stiffness x Strain (2)
Therefore, at a given strain the tensile stiffness governs the tension in the web. Changes in web
properties that affect the tensile stiffness will affect the way in which the web behaves during
subsequent processing and converting operations, as long as the web continues to operate in
its elastic region.
There are two ways to measure the tensile properties of paper. The traditional way is to
place a strip of paper in a tensile tester, which measures the force required to elongate the
sample and records the force at certain intervals of elongation plus the force when the
specimen breaks. The transducer measurements of elongation and force are transferred to a
computer where the tensile properties noted above may be calculated. It is possible to make
the calculations manually as well.
The second method used is ultrasonic measurement technology. In this technique, the
samples are placed horizontally between an ultrasonic sender and receiver at a fixed distance.
An ultrasonic signal of known frequency is sent through the paper, and the time for the signal
to travel from sender to receiver is noted. From this time, the tensile stiffness index can be
calculated (Lindblad & Furst, 2001). The calculation yields the tensile stiffness divided by the
basis weight of the paper sample. To obtain the tensile stiffness the result must be multiplied
by the paper basis weight.
The measurement of tensile stiffness index by ultrasonic measurements yields a higher
magnitude result than measurements by mechanical methods (Niskanen & Karenlampi, 1998,
9
p. 142). In any event the results are related to each other and changes in the results of one
measurement method will relate directly to changes in the other.
Wood Fiber Structure
Cellulosic fibers are what give paper much of its optical and strength properties. While
paper can be made of many different sources, the prevalent material is wood fiber. Wood
fibers are built up of three major components, cellulose, hemicellulose and lignin. The three
components are arranged around a central hollow lumen. Other chemical compounds including
materials collectively called extractives are present. They account for only a small portion of the
fiber material (Alen, 2000a). The extractives play a role in the chemical nature of the fibers and
are known to reduce the bonding potential of, especially, mechanical pulp fibers (Brandal &
Lindheim, 1966). However, for this work the cellulosic and lignin materials will be the focus.
Cellulose is the world’s most abundant biopolymer (Alen, 2000a). Cellulose is made up
of cellobiose units connected by (1→4) β-D glycosidic bonds. Cellobiose molecules are arranged
linearly into a ribbon like structure (Clark as cited in (Walsh, 2006, p. 6)). The degree of
polymerization for native wood cellulose is approximately 10,000 (Alen, 2000a). Cellulose has a
strong tendency for hydrogen bonding and forms aggregates of parallel cellulose chains, which
are called microfibrils. The microfibrils are on the order of 3.5 nm in diameter and of
comparatively long length (1-3 mm). Microfibrils are generally crystalline in nature, but contain
disordered regions approximately every 60 nm. These disordered regions are not crystalline,
but not completely amorphous either, and they are accessible to water only under certain
conditions (Salmen N., 1986). The cellulose microfibrils bundle themselves into even larger
aggregates of 20-25 nm in diameter. Nissan stated that the strength of fibers comes from the
10
crystalline portion of the microfibrils, while flexibility comes from the disordered region
between the crystallites (Nissan, 1961).
Besides cellulose, the two other major components of wood fiber are hemicellulose and
lignin. These two thermoplastic polymers are amorphous in nature. Their chemical structure
depends on the plant source, and their properties are dependent on the surrounding moisture
and temperature (Salmen N., 1986). Hemicellulose polymers of interest to papermaking are
known by their constituent names as glucomannan and xylan. The degree of polymerization for
hemicelluloses is between 100 and 200 and this, along with their amorphous nature makes
hemicellulose more prone to chemical and thermal instability (Alen, 2000a).
Lignin is a crosslinked polymer with phenylpropane units as building blocks, which can
be considered “as a thermoplastic high-molecular-mass material, which serves the dual purpose
of acting as a binder between wood cells and imparting rigidity to the cell walls.” (Alen, 2000a,
p. 40).
Wood fiber cells are layered structures around a central void lumen with two main
walls. The walls consist of a thin primary wall (P) and a secondary wall consisting of three sub-
sections: (S1, S2 and S3). S2 is the thickest section (70-80% of fiber material) and the properties
of this layer dominate the overall fiber properties. Each wood fiber cell is separated from the
adjoining cell structures by the middle lamella, which consists mainly of lignin. The thickness
and microfibril orientation of each wall in a softwood fiber is given by Clark as: middle
lamella=1-2 μm with no microfibrils, P=0.1 μm with very few microfibrils of no fixed angle,
S1=0.1-0.3 μm with microfibrils wound perpendicular to the fiber axis, S2=2-8 μm with
microfibrils wound in a helix pattern oriented close to the fiber axis (usually <30°), and S3=0.1

11
μm with very few microfibrils (Clark, 1985). In each layer, the microfibrils present are
embedded in a matrix of amorphous hemicelluloses and lignin (Salmen N., 1986) (Alen, 2000b).
Figure 2 illustrates the organization of the wood fiber cell wall. The cellulose microfibrils have a
modulus of elasticity higher than the two amorphous components of the cell walls; at least a
factor of 10 higher. Due to the microfibril arrangement in the fiber wall, the strength and
stiffness in the fiber axial direction is higher than in the transverse direction.
The concept of a matrix of amorphous components covering the microfibrils in wood
fiber corresponds with observations made during work on the role of hemicelluloses in fiber
strength (Spielgelberg, 1966). Holocellulose pulp fiber surfaces were examined using an
electron microscope and the author noted a plaster like material covering a fibrillar structure
that was more evident as the coating was removed by extraction phases of increasing severity.
There is also some evidence that a portion of the hemicellulose associates with the cellulose
Lumen
Secondary Wall (S3)
Secondary wall (S2)
Secondary wall (S1)
Primary wall (P)
Middle lamela
Figure 2. Diagram of wood fiber cell wall arrangement. (Salmen N., 1986)
12
(Akerholm & Salmen, 2001) and that a portion of the hemicellulose bonds with lignin (Alen,
2000a).
Of importance, when discussing wood polymers, is a definition of glass transition
temperature (Tg). Caulfield describes Tg as “the temperature at which amorphous polymers turn
from a hard glassy state to a more rubbery form” (Caulfield, 1990, p. 54). This is also referred to
as the softening temperature. As will be discussed in a later section, some of the wood fiber
components have their glass transition temperatures in the normal operating range of HSWO
printing (Salmen & Back, 1980).
There are differences between the cell characteristics of hardwood and softwoods.
Softwoods are composed of approximately 90% fibers (known as tracheids), which are vertically
oriented and long (2-6 mm depending on species). In addition, there are strands of parenchyma
cells in the tree, which can be arranged either horizontally or vertically. These cells are short
and blocky with lengths less than 0.2 mm. Hardwoods have a less homogeneous composition
consisting of about 50% fibers oriented in the vertical direction, approximately 30% vertically
oriented vessel elements, which are less than 0.6 mm in length and parenchyma cells similar to
softwoods. Overall the cell dimensions are smaller than similar cells in softwoods (Alen, 2000b).
The composition of softwoods and hardwoods with respect of the three major wood
components are shown in Table 1.

13
Table 1. Wood polymer components of hardwoods and softwoods.
Polymer Hardwood (Aspen)
%
Softwood (Spruce)
%
Cellulose 43-47 40-44
Hemicellulose 25-35 25-29
Lignin 16-24 25-31 * Extractives make up 2-8%
Wood Pulp Fiber Characteristics
During pulping the native wood fibers are separated from each other by either chemical
or mechanical means.
Chemical pulping. The kraft process is the dominant chemical pulping method (Alen,
2000). Fibers are separated using sodium hydroxide and sodium sulfate at high temperature
and pressure to dissolve much of the lignin and some of the hemicelluloses. The crystalline
microfibrils are left mainly intact (Alen, 2000c). Chips in the digester retain their shape during
pulping, but because the lignin has been dissolved the chips break down to individual fibers
with a very small amount of mechanical work (Gullichsen, 1999). The fibers are further washed
and bleached to an extent governed by the end use. From the original wood material,
approximately 50% is left at the end of the pulping and bleaching processes. 90% of the lignin,
60% of the hemicellulose and 15% of the cellulose dissolves in pulping (Alen, 2000).
Kraft fibers directly from the pulping process (before mechanical treatment) are
characterized as long and slender with low bending stiffness (Retulainen, Niskanen, & Nilsen,
1998b). In optical microscopy work, Page et al. show many pictures of chemical pulp fibers that
are long, flexible and thin (Page, Seth, Jordan, & Barbe, 1985).
(Smook, 2002,
p. 16)
14
Curl is an important fiber property that affects the final sheet tensile properties. Curl is
dependent on chip and fiber processing steps, which will be discussed under the section on
fiber deformations. Important for now is the fact that kraft fibers are much less stiff than their
mechanically pulped counterparts, mainly due to lignin removal and some degradation of the
disordered regions of the microfibrils.
Mechanical pulping. In the mechanical pulping process, fibers in the wood material are
subjected to an energy intensive, oscillating, strain & relaxation cycle. Due to the viscoelastic
nature of wood, the energy used to oscillate the fibers is converted mainly to heat. Grits spaced
in a ground wood pulp stone or closely placed bars on the opposing rotating plates of refiners
are used to impart the stress. In grinding (of interest for this thesis) the wood closest to the
grinding zone heats up with its maximum temperature occurring slightly below the surface of
the wood (approximately 1 mm). A large volume of shower water is simultaneously applied to
the grinding zone for lubrication and temperature control.
The nature of the fibrous material produced by a mechanical pulping process is
dependent on three main variables: (a) the amplitude of the strain (how far do the pulp stone
grits or refiner bars deflect the fibers), (b) the frequency of deflection (higher frequency leads
to higher Tg), and (c) the temperature in the grinding or refining zone. The water soaked
conditions prevailing in the PGW pulping process means that the amorphous cellulosic
polymers have surpassed their glass transition temperature; it is the lignin that needs an
elevated temperature to soften. In commercial PGW applications, the strain frequency from the
grinder stone grits passing over the wood is in the order of 50 kHz. At this strain frequency, the
glass transition temperature of lignin is well above the low frequency Tg of 90 °C, and is closer

15
to 120 °C (Salmen, Lucander, Harkonen, & Sundholm, 1999, p. 49). Operating below this
temperature results in fibers that are cut and damaged as the stiff lignin does not easily release
the fibers from the wood matrix.
The pulps produced by mechanical processes often have their qualities evaluated
according to fiber length fractions obtained by screening the pulp through a fiber classification
device. A typical device for fractionating pulp is the Bauer-McNett machine, which consists of
agitated water filled reservoirs placed in series, which allow only particles of dimensions smaller
than a screen on the reservoir discharge to pass. Four reservoirs of decreasing screen size are
used to separate pulp into desired categories (TAPPI, 2006). During the 1960s, some
researchers were focused on understanding the properties of pulp fractions. One paper in
particular considered the qualities of paper made from the different pulp fractions and drew
conclusions about the pulp characteristics that gave the paper strength, air permeability and
density (Forgacs, 1963). While the work analyzed mechanical pulps from atmospheric grinding
and refining, the results seem to apply to the PGW process as well.
Forgacs, using both optical and scanning electron microscopy, noted that the specific
fractions had properties common to them that were universal over the studied pulps. A
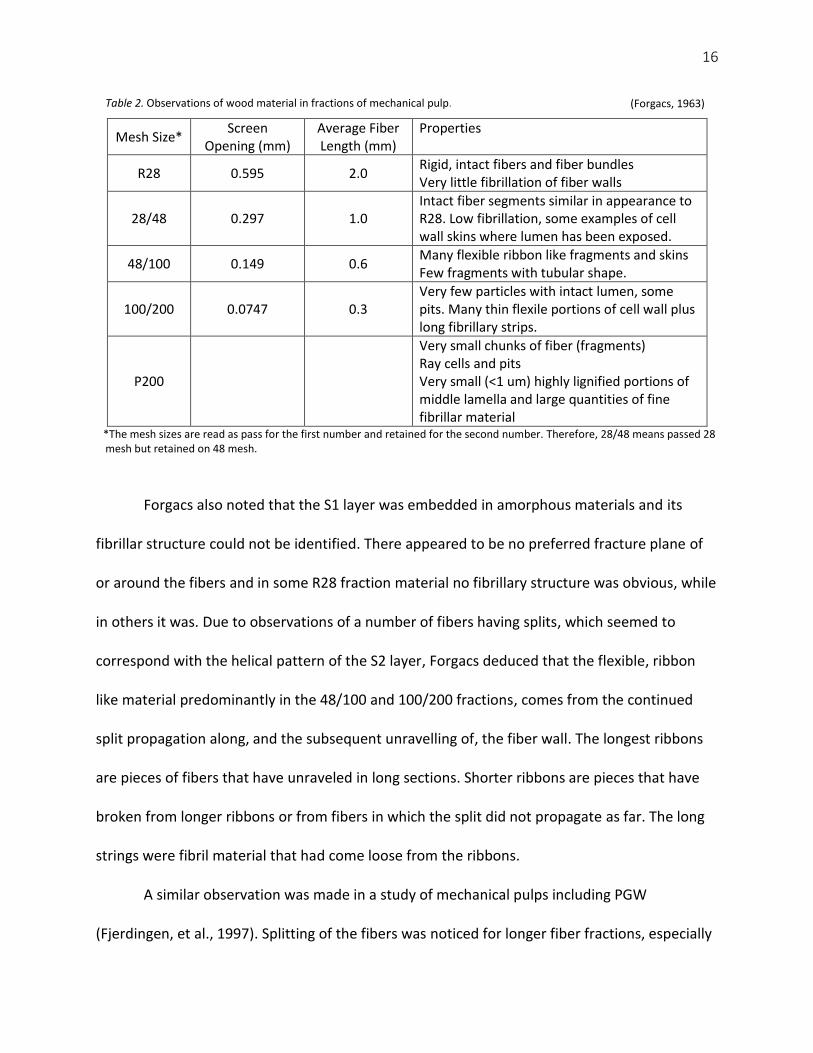
summary of the findings is given in Table 2.
16
Table 2. Observations of wood material in fractions of mechanical pulp.
Mesh Size* Screen
Opening (mm) Average Fiber Length (mm)
Properties
R28 0.595 2.0 Rigid, intact fibers and fiber bundles Very little fibrillation of fiber walls
28/48 0.297 1.0 Intact fiber segments similar in appearance to R28. Low fibrillation, some examples of cell wall skins where lumen has been exposed.
48/100 0.149 0.6 Many flexible ribbon like fragments and skins Few fragments with tubular shape.
100/200 0.0747 0.3 Very few particles with intact lumen, some pits. Many thin flexile portions of cell wall plus long fibrillary strips.
P200
Very small chunks of fiber (fragments) Ray cells and pits Very small (<1 um) highly lignified portions of middle lamella and large quantities of fine fibrillar material
*The mesh sizes are read as pass for the first number and retained for the second number. Therefore, 28/48 means passed 28 mesh but retained on 48 mesh.
Forgacs also noted that the S1 layer was embedded in amorphous materials and its
fibrillar structure could not be identified. There appeared to be no preferred fracture plane of
or around the fibers and in some R28 fraction material no fibrillary structure was obvious, while
in others it was. Due to observations of a number of fibers having splits, which seemed to
correspond with the helical pattern of the S2 layer, Forgacs deduced that the flexible, ribbon
like material predominantly in the 48/100 and 100/200 fractions, comes from the continued
split propagation along, and the subsequent unravelling of, the fiber wall. The longest ribbons
are pieces of fibers that have unraveled in long sections. Shorter ribbons are pieces that have
broken from longer ribbons or from fibers in which the split did not propagate as far. The long
strings were fibril material that had come loose from the ribbons.
A similar observation was made in a study of mechanical pulps including PGW
(Fjerdingen, et al., 1997). Splitting of the fibers was noticed for longer fiber fractions, especially
(Forgacs, 1963)
17
the +48 fraction. In the report, the splits are referred to as mostly in the S2 layer, and
sometimes the helical shape of the split (as per the fibril orientation) was seen. PGW had more
of these splits than TMP. Thin wall fibers gave higher tensile strength likely due to fiber
flexibility and possibly lumen collapse generating higher bonding area.
Ribbons (and strings) found in the 48/100 and 100/200 fractions appears to be flexible
and conform similarly to chemical pulp fibers. They were from the S2 layer and seemed to be
dependent on cell wall thickness. Thicker walled southern pine pulp had fewer ribbons than
northern spruce pulps corresponding to thick walls in the southern pines and thin walls in the
northern pulps. The relationship of these pulp characteristics to paper properties will be
discussed in a later section (Forgacs, 1963).
An interesting paper was published in 2004 dealing with PGW pulp of various poplar
species, which is pertinent for the paper under study in this thesis. As with chemical pulps, the
authors found that aspen mechanical pulps from thin walled species developed more surface
area than thicker walled fibers. Hand sheets made with the thinner wall fibers had more
bonding surface than hand sheets made with thicker walled fibers. The authors concluded that
this is likely due to increased fiber flexibility and the corresponding response to Campbell
effects (capillary forces that draw the fiber surfaces together as water is evaporated from
between them) during drying (Lehtonen, Lehto, & Rudie, 2004).
Mechanical pulping yields are in the order of 98% pulp from the original plant material.
The pulp fibers of mechanical pulp have greatly different characteristics than chemical pulp
including crystallinity (kraft pulp higher), fiber length (kraft pulp higher), flexibility (kraft pulp
higher), coarseness and cell wall thickness (kraft pulp lower). The fibril angle remains the same.
18
Stock preparation. After wood has been pulped, it must be prepared for papermaking.
The most important step, from a paper physics perspective, is refining (sometimes referred to
as beating). This involves passing the fibers between rotating grooved metal plates at low
consistency, typically 3-5% solids content. The goal of refining is to improve the bonding
potential of fibers so they can form a strong sheet with good printing properties. Some refining
of mechanical pulp may be done, although in many cases mechanical pulp can be used without
further treatment. Kraft pulp is refined to increase its contribution to the mechanical strength
properties of the finished sheet. Refining of kraft pulp has the effect of opening pores in the cell
wall, especially for once dried pulps, and loosening the layered structure of the cell walls
(internal fibrillation), which causes the fibers to become more swollen with increased flexibility.
This increase in flexibility has the effect of increasing density in the finished sheet. On the
outside of the fiber, external fibrillation during refining causes loosening of the fibrils and a
partial breakdown of the fiber wall. External fibrillation increases the surface area available for
bonding. Some material is completely removed from the cell wall, which is attributed to fines
(Lumiainen, 2000).
Fines are described for mechanical pulps in Table 2 (P200). The fines content of chemical
pulps is lower than for mechanical pulp and can be classified into two separate types. Primary
fines arrive at stock preparation in the unrefined pulp. They consist of low surface area
parenchyma cells, which are not useful in bonding. During refining, secondary fines are
produced, which consist of pieces of the fibrillary wall analogous to the fines of mechanical
pulp. In either mechanical or chemical pulp fines, the specific surface area of the fines fraction
is quite large, perhaps 7 times as large as fiber surface area for mechanical pulps and 10-20

19
times as large for chemical pulp. This large surface area allows mechanical and secondary
chemical fines to bind substantial amounts of water and improve bonding between fibers
(Retulainen, Niskanen, & Nilsen, 1998b).
Fiber deformations. During processing, the fiber wall can become kinked, curled or a
number of other deformities, and these affect the fiber and resulting sheet properties (Page,
Seth, Jordan, & Barbe, 1985). Paper properties will be discussed below in the section Stress-
Strain Curve of Dry Paper; however, it is important to have a basic understanding of deformities
in pulp and the processes that create them.
Pulps coming to the paper mill have a variety of deformations, which cause the fibers to
deviate from their natural, neutral shape. The deformities were characterized by Page as curl,
dislocations, nodes, kinks, and microcompressions. An index was developed that considers the
curl amount as (Page, Seth, Jordan, & Barbe, 1985, p. 189):
(fiber contour length / longest fiber dimension) – 1 (3)
Straight fibers have curl indices 0-0.05, while curly fibers have a curl index of about 0.5.
Fibers can be categorized quickly using optical scanning devices, which measure the fiber
characteristics and give a curl index distribution for a pulp fiber population. Some paper grades
make use of the curled fibers and even induce curl to achieve the desired product properties
(tissue for instance, which needs the high extensibility afforded by curlated pulp (Page, 1966)).
Physical processes that bend or impose compressive stresses on the cell walls can cause
fiber deformations. Defibering, chipping, dewatering in screw presses (for instance during
bleaching) and high consistency pumping and agitation are typical processes that impart curl. At
high consistency, stresses are transferred from fiber to fiber. Higher yield pulps have less
20
tendency to curl due to stiffness, probably from lignin and the fact that microfibrils have not
been degraded by alkali treatment.
Curl can be removed by gentle agitation at low consistency and higher temperature,
although heat isn’t necessary depending on the pulp type. The likely uncurling process is that in
curled high yield pulps the fibers will straighten as soon as the amorphous matrix softens
enough to allow the stiffer crystalline microfibrils to move to their neutral straight position
(Beath, Neill, & Masse, 1966). In lower yield pulps, the disordered, partly amorphous regions of
the microfibrils have been degraded, such that not enough stress can be generated by the
microfibrils to straighten the fiber once the matrix softens (Page, Seth, Jordan, & Barbe, 1985).
In 1977, Page et al. reported extraordinarily meticulous work, performed on single
fibers, to determine factors affecting elastic modulus. The ends of fibers were glued to separate
glass tabs and then the stress-strain curve measured along with the fiber cross sectional area.
From this curve, the elastic modulus was calculated. The findings from the work were that for
straight fibers from either a kraft pulp of 45% yield or holocellulose, the elastic modulus was
dependent on the fibril angle. However, the modulus falls short of this maximum when
discontinuities in the fiber are present (microcompressions, dislocations, etc.) (Page, El-
Hosseiny, Winkler, & Lancaster, 1977).
Fiber Bonding in Dry Paper
To make a paper sheet, the individual pulp fibers must be connected to one another.
The strength of the connection depends on the strength of the individual bonds, and the
number of bonds or amount of bonded area (Nordman, 1958).

21
Hydrogen bonds. Bonds between fibers are considered to be primarily hydrogen bonds
(Campbell, 1959) (Nordman, 1958) (Ojala, 1999). While there are still questions about the exact
nature of bonding between fibers (Lindstrom, Wagberg, & Larsson, 2005), all theories of fiber
bonding recognize hydrogen bonding as important to the mechanism for holding the fibers,
fibrils and microfibrils together. Cellulose and hemicellulose hydrogen bonding occurs where
the hydrogen atom of an OH is close enough to an oxygen atom, which has a pair of unshared
electrons, to be attracted to both negatively charged centers. The hydrogen atom holds the two
negatively charged centers together (Campbell, 1959). This is also true for the bonding in the
fiber cell wall; the microfibrils are bonded to each other, and the hemicelluloses are internally
bonded through the same mechanism. For the crystalline cellulose in wood fibers, the hydrogen
bonds, in part due to their number, can hold the cellulose molecules together quite strongly
(Ojala, 1999).
It may be that the strength of the bonds in dry paper are not equal. Pulp fibers from
different wood species produced different bond strengths, presumably due to the effect of
differing hemicellulose types (Nordman, 1958). This is supported by (Alen, 2000b) regarding the
different hemicellulose proportions by, and within, wood species. Yan and Li noted that bond
strength was related to surface condition of the fiber and that bonding mechanisms changed
with the surface characteristics (Yan & Li, 2013).
When drying paper, considerable energy is required to evaporate the last molecules of
water from the sheet. This is due to the hydrogen bonds that exist between the water and
cellulosic surfaces. The reverse is also true. The first water available to the dry fiber surfaces
forms hydrogen bonds to the cellulose and hemicellulose. Water will replace bonds between
22
cellulose-cellulose and cellulose-hemicellulose with water to cellulose/hemicellulose hydrogen
bonds (Ojala, 1999). With enough water present a fiber can be removed from a paper sheet
with very little work (Niskanen K., 1998). For crystalline portions of the microfibrils, the
organization of the cellulose chains forms a tight, well bonded crystalline structure that is
inaccessible to water.
Bond area. The bonded area (and number of bonds in the area) is the second important
factor determining the connection between fibers. Bond area has been measured historically as
the difference in light scattering coefficient between sheets formed in water and sheets formed
in a non-hydrogen bonding medium such as butanol. The light scattering coefficient for butanol
formed sheets corresponds to completely unbonded fiber surfaces and gives a measure
proportional to the total area available for bonding. The total physical surface area for bonding
is measured using a silvering technique. The light scattering coefficient for bonded sheets is
lower due to a reduced number of fiber/air interfaces available to scatter light, and should be
proportional to the amount of fiber surface involved in bonding. This method is used before
and after straining a paper specimen to calculate the energy lost over the straining cycle
(Nordman, 1958). The difference in light scattering from before straining to after straining was
attributed to bonding loss. The procedure was repeated for different strain amounts. When the
increase in light scattering coefficient for the various strain cycles are plotted against energy
loss, a linear relationship exists. The bonded area may be overstated as optical contact does not
mean molecular contact. Optical contact implies that the fiber surfaces are very close but does
not guarantee they are close enough for hydrogen bonding, which has a typical bond length of
1.7 Å (Retulainen, Niskanen, & Nilsen, 1998a).

23
Other observations from the testing of Nordman were that the light scattering
coefficient increases during a tensile test beginning at the point where plastic deformation
begins (i.e., during elastic straining bonds were not failing). And, over a given specimen length,
the change in light scattering coefficient due to straining was not constant, indicating varying
degrees of bonding along the specimen. In areas where low light scattering was present before
straining, a larger change in light scattering occurred than in areas where high light scattering
was present before straining. While observing a particular area during straining, it was also
evident that the light scattering coefficient changes in a stepwise rather than smooth manner.
This likely indicates that as bonds break, a redistribution of stresses in the network occurs. As
the redistribution occurs, bond breakage in a particular location may speed up or slow down as
dictated by the network. While considerable error is acknowledged in the bond area
measurement, Nordman makes a comparison between number of bonds estimated by this
method and the number of hydrogen bonds estimated by Nissan’s equation of stress/strain
curve for hydrogen bonded materials (Nissan, 1957) and they are found to be similar, at least in
degree of magnitude (Nordman, 1958).
A comparison was made between thick walled summerwood, and thin walled
springwood, holocellulose fiber bond strength by bonding individual fibers to cellulose film and
fiber shives (McIntosh & Leopold, 1961). Bond strength varied along the length of the fiber,
either due to differences in hemicellulose concentration, or pits on the fiber, which reduced the
bondable surface area. While bond strength of summerwood fibers is about 3 times that of
springwood fibers, sheets made of springwood fibers are stronger due to a higher number of
bonded areas, which in turn is a result of the increased fiber flexibility. This last finding
24
highlights the importance of bonded area to sheet properties and the role that fiber flexibility
plays.
Two papers (Page, Tydeman, & Hunt, 1962a) (Page & Sargent, 1962) were presented at
the 1961 British Paper and Board Makers Industry Research Association Fundamental Research
Conference, which dealt with measurement and characterization of bonded areas. In the first
paper (Page, Tydeman, & Hunt, 1962a), bonded areas in paper sheets were observed by light
microscopy to study bond size, bond frequency and some characteristic features of bonded
areas. Similar hand sheets made of bleached spruce sulphite pulps with zero and 20 minutes of
beating showed larger and more frequent bonded areas, and fewer instances of bonded areas
broken up into smaller patches, for the beaten pulp hand sheets. The authors speculated that
these results are due to the increased fiber flexibility and local plasticity resulting from beating,
which makes the fibers more able to conform to each other.
In the second paper (Page & Sargent, 1962), an examination was made of the same
bonded areas, by both light microscope and electron microscope, of fibers, which had been in
close contact with (formed on) glass or metal substrates. For both metal and glass substrates,
the fibers in the hand sheets conformed to the substrate surface, including very small grooves
present in a metal machine glazing cylinder. The authors noted that this same effect can be
seen when drying hand sheets on a plate at room temperature. When the paper was separated
from the substrate, microfibrils were not raised when the substrate was metal but were raised
when separated from glass. The authors take this to mean that the attraction between cellulose
and glass was greater than the attraction between the microfibril and the bulk fiber network.
For the metal plate, the attraction to the bulk fiber was higher. The authors concluded that the
25
areas of optical contact seen in light microscopy are seen in the electron microscope as areas of
adhesion.
In an investigation into the strength of fibers and fiber bonding, (Davison, 1972) the
author concludes that the total strength of fibers is not fully utilized. He based this opinion on
measurements of zero-span and normal span tensile strength of paper as well as the results of
individual fiber testing. Zero span tensile testing is considered to be indicative of fiber strength
due to the jaws of the tensile tester gripping the same fibers; the network structure is not
involved. In normal span tensile testing, fibers and the bonding between them are under test.
The zero span tensile strength test results of paper samples were higher than normal span
tensile test results.
Secondly, individual fibers were tested for tensile strength and the possible strength of a
paper made from the fibers calculated. Testing sheets from the fibers yielded results less than
half the calculated potential. Bonding was concluded as the weak link. The reduction in tensile
strength detected by Davison may not be related to bonding, but rather fiber deformities
causing uneven stress distribution across the fiber network.
More recently chemical force microscopy has been utilized to characterize the fiber
surface role in bonding (Yan & Li, 2013). In this work, three types of interactions were found
between an -OH modified atomic force microscopy tip and wet fiber surfaces. These
interactions corresponded to different characteristics of the tested chemical and mechanical
pulp fiber surfaces. Three interactions were suggested to correspond to fiber surfaces with the
following characteristics:
26
Solid, unfibrillated surfaces, where surface chemistry plays the dominant role. Van der
Waals forces are the dominant interaction. For mechanical pulp fibers, or chemical pulp
fibers, which had had little refining work done, this interaction dominates.
Swollen, gel like surfaces indicating loosened microfibrils, which were not extended out
from the fiber wall. Hydrogen bonding plays a dominant role in this interaction type as
the surface is highly deformable and the tip can be very close to the available hydrogen
bonding sites. These bonds are stronger than the first type.
Fibrillated surfaces where the microfibrils have extended from the fiber wall. The tip
removal force was stepwise indicating multiple fibril bonds are present. Hydrogen
bonding is the likely bonding mechanism. For mechanical pulps and unrefined chemical
pulps very little of this surface type was present.
The authors conclude that surface deformability plays a dominant role in interfiber
bonding since bonding can only be achieved in areas of close contact.
Papermaking
The objective of papermaking is to convert the pulp fiber from a dilute suspension of
0.5-1% solids content at the head box to a flat sheet with the desired optical and mechanical
properties. For the mechanical properties of interest in this thesis (tensile properties) the
choice of wood fiber material, pulping process, stock preparation and the papermaking unit
operations dictate the outcome. What follows is a brief description of the papermaking unit
operations with focus on those that affect the stress-strain relationship of paper.
Forming. After the pulps and additives have been mixed and diluted to head box
consistency they are sprayed onto a forming fabric, a smooth porous membrane that serves to
27
support the pulp slurry to the press section, and allow water to be removed through it. The
basic structure of the sheet is determined during forming (Norman, 2000). Three important
properties governed during this section of the paper machine are: (a) formation – the small
scale variability of basis weight in the paper, (b) material distribution in the thickness direction
of the sheet, and (c) The orientation of the fibers to the machine direction of the sheet both as
an average across the web and the local variation (Norman, 2000).
Formation. Fibers in suspension will tend to touch and interlock. At very dilute
suspensions or with short coarse fibers this interlocking is more unlikely. With long slender
fibers at rising consistencies this interaction is inevitable. The result is flocculation, which is also
known as the formation of flocs. Flocs can be different sizes depending on the forming
operation. During formation, the stock slurry is subjected to turbulence, whose purpose is to
aid drainage and break up flocs (Norman, 2000). Flocculation will produce a paper with a local
variation of basis weight. More fibers will occur where the local basis weight is higher and less
where the local basis weight is lower.
The local tensile strength value of paper will be high where the fiber amount is highest
and low where there is the least amount of fiber (assuming equal network effects, fiber
orientation, etc.). Therefore, in a strip of paper with high formation variability, the chance that
a sample with low basis weight (and low fiber amount) will be found is also high. The opposite
is true for low formation variability. Tensile strength of paper therefore increases with better
formation (Niskanen & Karenlampi, 1998). The above is true for laboratory made papers,
however not always so in machine made papers. Network effects must be taken into account as

28
the pressure pulses and turbulence imparted to the web during forming can break apart
network structures, other than flocs, that provide strength (Norman, 2000).
Material distribution in thickness direction. Two items related to distribution of fibers, fines
and filler from the top side to bottom side of the sheet are of interest on the former. As the
fiber mat is formed and water is drained through, the smaller particles tend to move with the
water flow. This smaller material includes fines and fillers. At the very surface of the web the
smallest particles may be washed away completely, leaving only medium and long fiber
fractions. In Fourdrinier forming, drainage occurs through the bottom side of the sheet only. In
twin wire formers both sides of the sheet drain. Fourdrinier sheets suffer from two sidedness of
fines and filler due to the one way movement of the water and resulting small particle
movement. Twin wire sheets are more even on their surfaces, but the middle of the sheet
suffers from fines and filler loss. Fines and fillers provide smoothness and for fines, surface
Figure 3. Fiber, filler and pore distributions and SEM image of sheet cross section.

29
strength. Figure 3 shows examples fines and filler distribution of Fourdrinier and twin wire
sheets observed with a scanning electron microscope.
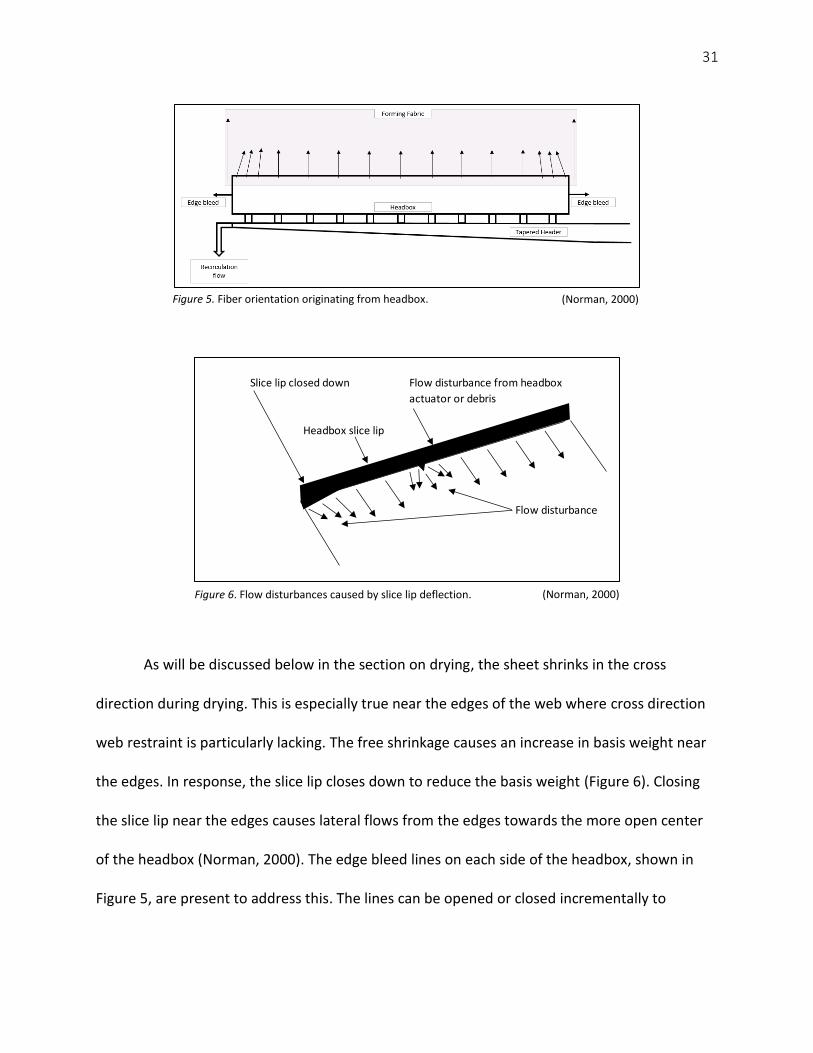
Fiber orientation. Figure 4 shows a schematic of the side view of a headbox and the
beginning part of the forming section. The jet is run at a different speed than the wire to obtain
fiber orientation in the machine direction. The ratio of the jet speed to wire speed is known as
the jet/wire ratio (j/w). One end of the fiber touches the forming fabric and the speed
difference causes the fiber to rotate into alignment with the machine direction (Niskanen,
Kajano, & Pakarinen, 1998) (Norman, 2000). A larger difference, either positive or negative, in
the speed between jet and wire results in fiber distribution that is more aligned to the machine
direction.
Fiber orientation misalignment. For tensile paper properties to be consistent across the
sheet, the average orientation of the fibers should be consistent as well. As discussed above,
the tensile properties of fibers are anisotropic. The average orientation of the fibers relative to
the machine direction is known as fiber orientation angle and it can vary locally across the web
HeadboxJet/wire ratio =
speed of jet / speed of forming fabric
Jet
Breast rollForming
board
Forming
fabric
Figure 4. Jet/Wire ratio. (Shields, 2015)

30
(Niskanen, Kajano, & Pakarinen, 1998). The design of head boxes and the approach piping,
which carries the dilute fiber suspension to the headbox, are important factors in misalignment.
A large volume of stock must be distributed evenly across the headbox with minimal pressure
difference from the front side to the back side and all points in between. To accomplish this the
tapered header shown in Figure 5 is employed to reduce the pipe diameter as stock is diverted
from the approach piping to the headbox across its’ width. The recirculation flow is adjusted to
provide consistent average pressure from one end of the headbox to the other. If this is not
done, lateral flows inside the headbox will occur that will affect the misalignment angle
(Norman, 2000).
The headbox is basically a pressurized box with a narrow opening (nozzle) on one edge
where the stock is sprayed on the forming section of the paper machine. Adequate turbulence
inside the headbox is necessary to prevent flocculation of the fibers before the forming section.
To control the nozzle opening, an adjustable bar known as the slice lip is mounted to the front
face of the box, which opens and closes the nozzle. Adjustments can be made for the entire
width of the headbox at once or local small scale control, typically on the order of 100-150 mm
spacing, is possible as required for cross direction control of the basis weight (Norman, 2000).
Changing the slice opening in a local area changes the flow direction in the stock around the
deviation area. The concept is shown in Figure 6. The transverse flows created by the local
disturbance will change the fiber orientation angle locally as well.
31
As will be discussed below in the section on drying, the sheet shrinks in the cross
direction during drying. This is especially true near the edges of the web where cross direction
web restraint is particularly lacking. The free shrinkage causes an increase in basis weight near
the edges. In response, the slice lip closes down to reduce the basis weight (Figure 6). Closing
the slice lip near the edges causes lateral flows from the edges towards the more open center
of the headbox (Norman, 2000). The edge bleed lines on each side of the headbox, shown in
Figure 5, are present to address this. The lines can be opened or closed incrementally to
Figure 5. Fiber orientation originating from headbox. (Norman, 2000)
Slice lip closed down Flow disturbance from headbox
actuator or debris
Headbox slice lip
Flow disturbance
Figure 6. Flow disturbances caused by slice lip deflection. (Norman, 2000)
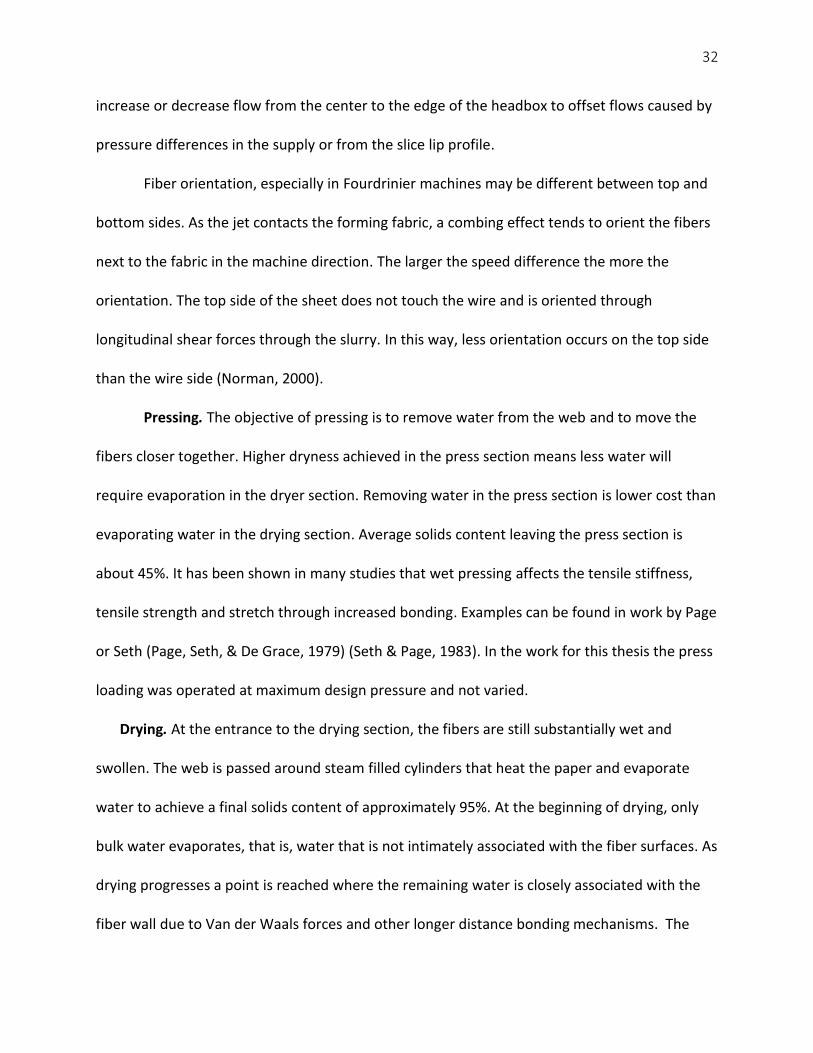
32
increase or decrease flow from the center to the edge of the headbox to offset flows caused by
pressure differences in the supply or from the slice lip profile.
Fiber orientation, especially in Fourdrinier machines may be different between top and
bottom sides. As the jet contacts the forming fabric, a combing effect tends to orient the fibers
next to the fabric in the machine direction. The larger the speed difference the more the
orientation. The top side of the sheet does not touch the wire and is oriented through
longitudinal shear forces through the slurry. In this way, less orientation occurs on the top side
than the wire side (Norman, 2000).
Pressing. The objective of pressing is to remove water from the web and to move the
fibers closer together. Higher dryness achieved in the press section means less water will
require evaporation in the dryer section. Removing water in the press section is lower cost than
evaporating water in the drying section. Average solids content leaving the press section is
about 45%. It has been shown in many studies that wet pressing affects the tensile stiffness,
tensile strength and stretch through increased bonding. Examples can be found in work by Page
or Seth (Page, Seth, & De Grace, 1979) (Seth & Page, 1983). In the work for this thesis the press
loading was operated at maximum design pressure and not varied.
Drying. At the entrance to the drying section, the fibers are still substantially wet and
swollen. The web is passed around steam filled cylinders that heat the paper and evaporate
water to achieve a final solids content of approximately 95%. At the beginning of drying, only
bulk water evaporates, that is, water that is not intimately associated with the fiber surfaces. As
drying progresses a point is reached where the remaining water is closely associated with the
fiber wall due to Van der Waals forces and other longer distance bonding mechanisms. The
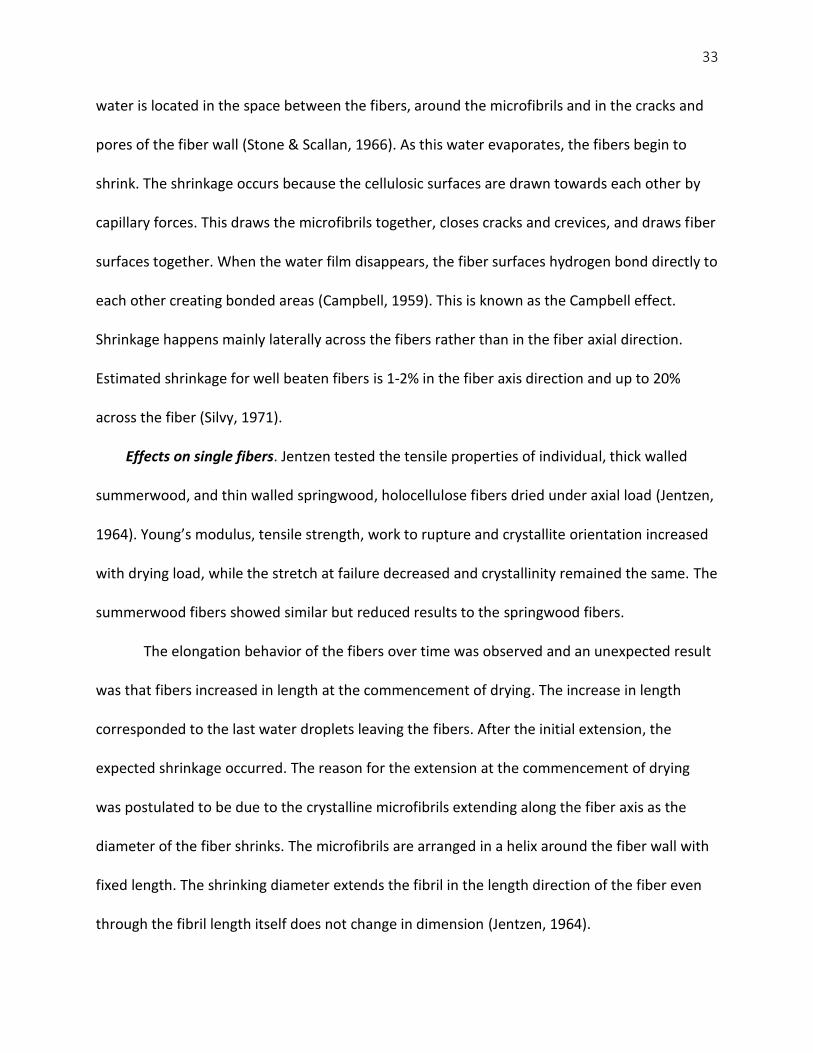
33
water is located in the space between the fibers, around the microfibrils and in the cracks and
pores of the fiber wall (Stone & Scallan, 1966). As this water evaporates, the fibers begin to
shrink. The shrinkage occurs because the cellulosic surfaces are drawn towards each other by
capillary forces. This draws the microfibrils together, closes cracks and crevices, and draws fiber
surfaces together. When the water film disappears, the fiber surfaces hydrogen bond directly to
each other creating bonded areas (Campbell, 1959). This is known as the Campbell effect.
Shrinkage happens mainly laterally across the fibers rather than in the fiber axial direction.
Estimated shrinkage for well beaten fibers is 1-2% in the fiber axis direction and up to 20%
across the fiber (Silvy, 1971).
Effects on single fibers. Jentzen tested the tensile properties of individual, thick walled
summerwood, and thin walled springwood, holocellulose fibers dried under axial load (Jentzen,
1964). Young’s modulus, tensile strength, work to rupture and crystallite orientation increased
with drying load, while the stretch at failure decreased and crystallinity remained the same. The
summerwood fibers showed similar but reduced results to the springwood fibers.
The elongation behavior of the fibers over time was observed and an unexpected result
was that fibers increased in length at the commencement of drying. The increase in length
corresponded to the last water droplets leaving the fibers. After the initial extension, the
expected shrinkage occurred. The reason for the extension at the commencement of drying
was postulated to be due to the crystalline microfibrils extending along the fiber axis as the
diameter of the fiber shrinks. The microfibrils are arranged in a helix around the fiber wall with
fixed length. The shrinking diameter extends the fibril in the length direction of the fiber even
through the fibril length itself does not change in dimension (Jentzen, 1964).
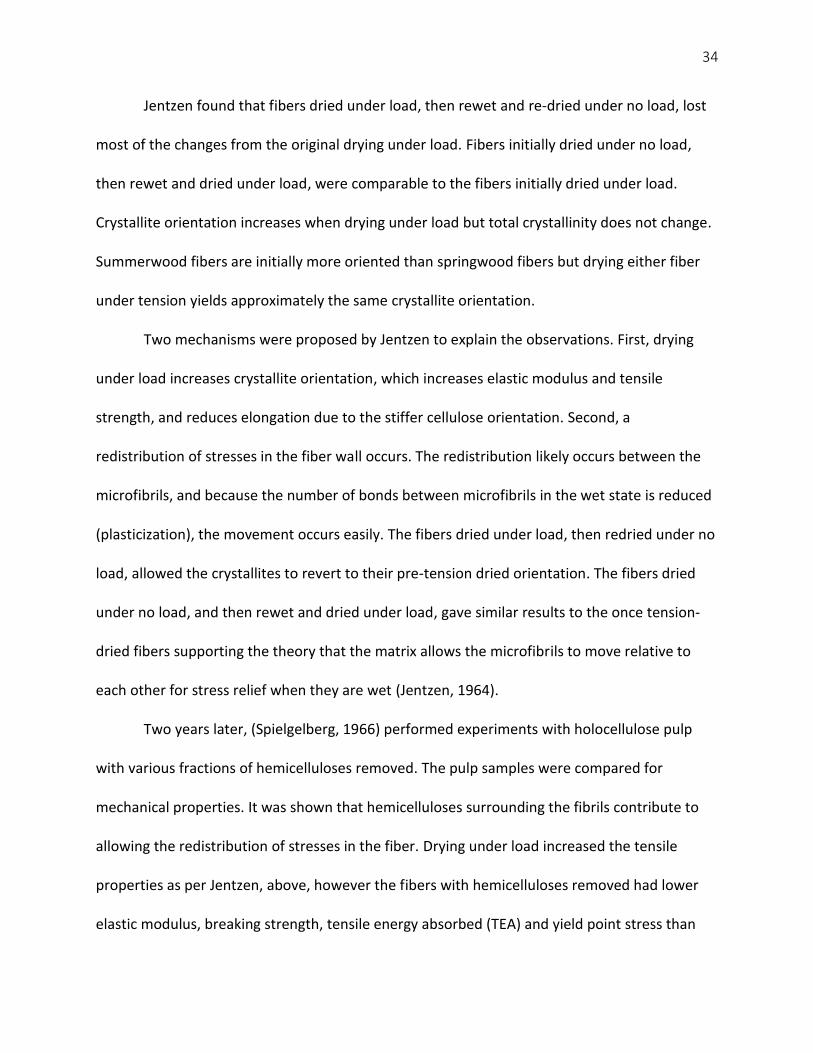
34
Jentzen found that fibers dried under load, then rewet and re-dried under no load, lost
most of the changes from the original drying under load. Fibers initially dried under no load,
then rewet and dried under load, were comparable to the fibers initially dried under load.
Crystallite orientation increases when drying under load but total crystallinity does not change.
Summerwood fibers are initially more oriented than springwood fibers but drying either fiber
under tension yields approximately the same crystallite orientation.
Two mechanisms were proposed by Jentzen to explain the observations. First, drying
under load increases crystallite orientation, which increases elastic modulus and tensile
strength, and reduces elongation due to the stiffer cellulose orientation. Second, a
redistribution of stresses in the fiber wall occurs. The redistribution likely occurs between the
microfibrils, and because the number of bonds between microfibrils in the wet state is reduced
(plasticization), the movement occurs easily. The fibers dried under load, then redried under no
load, allowed the crystallites to revert to their pre-tension dried orientation. The fibers dried
under no load, and then rewet and dried under load, gave similar results to the once tension-
dried fibers supporting the theory that the matrix allows the microfibrils to move relative to
each other for stress relief when they are wet (Jentzen, 1964).
Two years later, (Spielgelberg, 1966) performed experiments with holocellulose pulp
with various fractions of hemicelluloses removed. The pulp samples were compared for
mechanical properties. It was shown that hemicelluloses surrounding the fibrils contribute to
allowing the redistribution of stresses in the fiber. Drying under load increased the tensile
properties as per Jentzen, above, however the fibers with hemicelluloses removed had lower
elastic modulus, breaking strength, tensile energy absorbed (TEA) and yield point stress than

35
unextracted fibers. Stretch and yield point stress decrease when fibers are dried under load. As
hemicellulose is removed, crystallinity increases, indicating bonds moving from cellulose–
hemicellulose-cellulose to cellulose-cellulose. The hemicellulose component makes the bonds
more flexible probably due to its’ branched nature. Heavily extracted holocellulose fibers and
cotton showed similar tensile strength and modulus indicating that as hemicellulose is removed
the bonds become more cellulose-cellulose.
Work on the properties of individual pulp fibers dried under axial compression showed
reduction in modulus and tensile strength, and increase in elongation (Dumbleton, 1972).
Polarized light microscopy revealed that the fiber walls had regularly spaced zones of
discontinuities between intact segments. The discontinuities were found to be areas where the
fiber had buckled in compression. Higher axial compression led to more buckled zones, lower
crystallite orientation, lower modulus and tensile strength, and higher elongation. The intact
segments were found to have slightly higher microfibril angle compared to the uncompressed
fiber, however this increase in angle could account for only 4% of a 20% change in elongation.
The major portion of the elongation is due to the buckled zones. In the buckled zones, the
microfibrils are no longer oriented with the fiber axis and therefore, cannot act cooperatively
with neighboring microfibrils to withstand stress. In the buckled zones, stress concentrations
develop and the tensile strength is reduced. When tensile force is applied to the fiber, the
microfibrils in the buckled zones straighten first offering little resistance. This lowers the initial
modulus and increases elongation.
In summary, single fibers strained in their axial direction during drying will have
increased crystallite orientation, increased elastic modulus, increased tensile strength, and
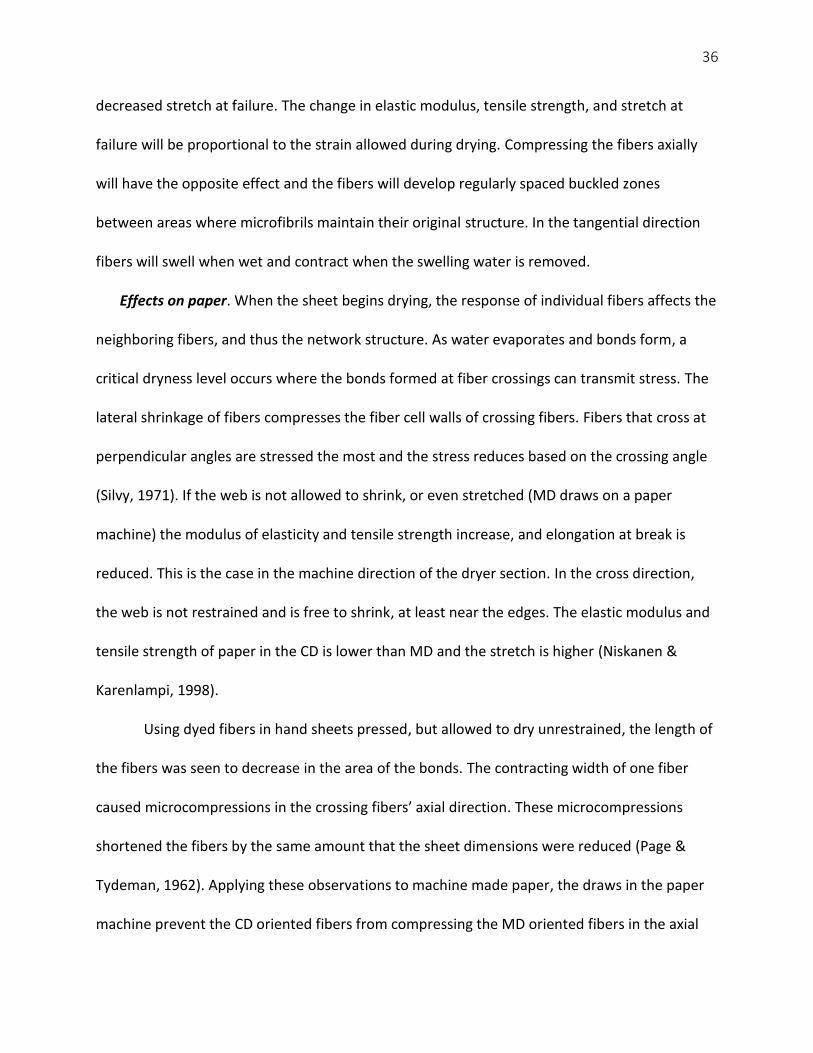
36
decreased stretch at failure. The change in elastic modulus, tensile strength, and stretch at
failure will be proportional to the strain allowed during drying. Compressing the fibers axially
will have the opposite effect and the fibers will develop regularly spaced buckled zones
between areas where microfibrils maintain their original structure. In the tangential direction
fibers will swell when wet and contract when the swelling water is removed.
Effects on paper. When the sheet begins drying, the response of individual fibers affects the
neighboring fibers, and thus the network structure. As water evaporates and bonds form, a
critical dryness level occurs where the bonds formed at fiber crossings can transmit stress. The
lateral shrinkage of fibers compresses the fiber cell walls of crossing fibers. Fibers that cross at
perpendicular angles are stressed the most and the stress reduces based on the crossing angle
(Silvy, 1971). If the web is not allowed to shrink, or even stretched (MD draws on a paper
machine) the modulus of elasticity and tensile strength increase, and elongation at break is
reduced. This is the case in the machine direction of the dryer section. In the cross direction,
the web is not restrained and is free to shrink, at least near the edges. The elastic modulus and
tensile strength of paper in the CD is lower than MD and the stretch is higher (Niskanen &
Karenlampi, 1998).
Using dyed fibers in hand sheets pressed, but allowed to dry unrestrained, the length of
the fibers was seen to decrease in the area of the bonds. The contracting width of one fiber
caused microcompressions in the crossing fibers’ axial direction. These microcompressions
shortened the fibers by the same amount that the sheet dimensions were reduced (Page &
Tydeman, 1962). Applying these observations to machine made paper, the draws in the paper
machine prevent the CD oriented fibers from compressing the MD oriented fibers in the axial

37
direction. The shrinkage of the MD oriented fibers is not restrained and this allows the CD
oriented fibers to be compressed in their axial direction. The microcompressions act similarly to
kinks and curl in that they lower tensile stiffness, tensile strength and increase elongation.
In a study of drying variables on tensile properties of paper made from softwood and
hardwood chemical pulps, the tensile stiffness, tensile strength, strain at break and tensile
energy absorption were all linearly related to the strain allowed during drying (Makela, 2009).
The higher the swellability of the fibers, the more effect drying shrinkage had. Chemical pulp
fibers are therefore more affected by drying shrinkage than mechanical pulp fibers.
Coating, supercalendering and winding. The final sheet properties are modified from the
base paper properties by coating and supercalendering. A blend of pigments and binders in
water is applied to each surface of the running web, which is then dried in air floatation dryers.
The web is under MD tension during this process. The web is then supercalendered, which
involves passing the running web between 9 nipped rolls of alternating steel and cotton filled
denim. The paper is densified and the surface of the paper changes from a rough, dull finish to
a smooth, glossy finish. Finally, the paper is taken to the winders where rolls are cut from the
web to match customer dimensional requirements. For the target paper, the customer rolls are
50” diameter, 49-5/16” wide and contain approximately 85,000 linear feet of paper. The effects
of coating, supercalendering and winding are not considered in this work. Coating and
supercalendering trials have been made in the past with little effect on the lateral web
movement under investigation (Shields, 2016).

38
The Stress-Strain Relationship of Dry Paper
(Seth & Page, 1983) developed a plausible model for the stress-strain relationship of
paper related to properties of individual fibers, the bonding between the fibers and the
condition of the fibers, vis-a-vis kinks, curls and microcompressions. In the early 1960s, a paper
was presented at the Fundamental Research Conference that introduced a new theory
regarding the shrinkage of paper, and how shrinkage affects the properties of paper (Page &
Tydeman, 1962). The authors give a general model of the structure of paper as a randomly
oriented planer assembly of flat fibers bonded at their crossing points. Beating of the fibers
prior to formation can change the sheet structure from an open one to a “matrix of fine
material in the extreme case of a highly beaten sheet” (Page & Tydeman, 1962, p. 398). This
paper drew upon the work outlined in three other papers presented at the same conference. In
the first, (Page, Tydeman, & Hunt, 1962a) the authors presented an exhaustive study of the
optical examination of the bonding of sheets of fibers made under various conditions. The main
conclusions drawn were that drying tension is not of high significance to the size or number of
bonds, that beating time increases the number of bonds/unit length of fiber, the size of the
bonded areas increases with increasing fiber flexibility, and that increased bonding frequency
leads to increased sheet density.
In the second paper (Page & Sargent, 1962), the authors compared optical microscopy
and SEM methods for observing bonded areas between fibers. The main conclusions were that:
the cohesion of microfibrils to each other is quite strong, that the areas seen in the light
microscope as optical contact (areas of adhesion in electron microscope) are of high

39
importance in governing the properties of paper, and that fibrillated material outside the area
of contact is of lesser importance in determining the strength of paper.
In the third paper (Page, Tydeman, & Hunt, 1962b), the authors used optical microscopy
to photograph areas of bonds in sheets before and after tensile straining. Major findings were:
approximately ½ of the bonds were unaffected by straining, 6% broke completely, and half of
the bonds had some partial breakage with small degrees of breakage being most common.
Beating time had no appreciable effect on the results, however drying restraint did. The effect
of drying under tension is to reduce the number of bonds that break, either partially or
completely, and therefore reduce the bonded area lost. Approximately 80% of the bond area
loss, as measured by increased light scattering, was attributable to partial bond breakage, not
complete bond breakage. Partial bond breakage was described as an increase in the light
scattering seen in a region that had less light scattering before straining. Light scattering is
interpreted as areas where the fibers are not close enough to bond. It is possible that this
definition overstates the bonded area as the minimum distance needed for light scattering is
larger than the distance required for bonding. The authors acknowledged this fact but went on
to say that the change in scattering was generally abrupt and was not likely to introduce much
error into the results (Page, Tydeman, & Hunt, 1962a).
In 1965, an early attempt to explain the stress-strain curve of paper through fiber
properties and relative bonded area was made by (Kallmes & Perez, 1965). References to step
wise failure of bonded areas and kinks, curl, and microcompressions as outlined by (Page &
Tydeman, 1962), were made. There was no attempt to quantify relative bonded area by fiber
shape or optical bonded area vs. real bonded area. The theory basically assumes the load

40
carried by the two ends of the fiber are equal and sums the stresses for all fibers crossing a line
perpendicular to the strain direction. Agreement to within 50% of measured values was
obtained.
The Forest Products Laboratory in Wisconsin was active in the 1970s evaluating fiber
characteristics for impact on paper properties. Two studies were published with one focused on
softwood fibers and the other on hardwood fibers. The stress-strain curve of hand sheets made
of softwood kraft pulp from 10 different wood species were compared for stress-strain
relationship plus tear and burst with the results that for beaten pulp (Horn, 1974):
75% of stretch variation between the pulps can be accounted for by fibril angle and # of
fibers/cm3.
80% of tensile and bursting strength variation between pulps can be accounted for by
cell wall thickness and fiber length.
The ratio fiber length / cell wall thickness (L/T ratio) is an even better indicator of tensile
and bursting strength variation.
At high wood densities (>0.450 g/cm3) tensile strength is reduced below the straight line
relationship between tensile strength and L/T.
Modulus of Elasticity variation is highly dependent on fiber coarseness.
The stress-strain curve of hand sheets made of hardwood kraft pulp from 10 different wood
species were compared for stress-strain relationship plus tear and burst. Of interest for this
work are the results that for beaten pulp (Horn, 1978):

41
45% of stretch variation between the pulps can be accounted for by fibril angle. In
multiple regression, 75% of variation can be explained by fiber length and fiber
coarseness.
L/T ratio (fiber length/fiber wall thickness ratio) is the largest predictor of tensile
strength variability between the pulps. The author surmises that higher L/T ratio
equates to more fiber flexibility, which yields more bonding areas.
Parenchyma cells reduce tensile strength, while vessels have little to no impact at
concentrations normally found in pulp.
Modulus of elasticity is predicted by L/T ratio. In multiple regression analysis 95% of
variation is explained by fibril angle and L/T ratio.
Generally, the relationships of fiber morphology to pulp properties are not as strong
with hardwood pulps as with softwood pulps due to heterogeneity of hardwood and the
higher parenchyma content of hardwood pulps.
In 1979 the first of a series of 4 papers that outlined a model of the stress-strain
relationship of paper was published (Page, Seth, & De Grace, 1979). In this article, the authors
use classic work (Cox, 1952), that states that the maximum elastic modulus of paper is equal to
1/3 the elastic modulus of the fibers making up the paper. The factor of 1/3 results from the
paper being isotropic (laboratory hand sheets); other factors are applicable for anisotropic (i.e.-
machine made) papers. Requirements of the model are that the fibers be long and very well
bonded. Page’s team gave qualitative arguments about the shape of the elastic modulus vs light
scattering coefficient (bonded area) curve. The observations of the data for hand sheets of
various fibers pressed to different bonding degrees were that higher wet pressing increases

42
elastic modulus, and that the elastic modulus levels off to a plateau for decreasing levels of light
scattering coefficient (increasing bonding). For low yield kraft pulp beaten to improve bonding
and remove curl, crimps and microcompressions (i.e.-well bonded sheets of long straight
fibers), the elastic modulus of hand sheets approaches 1200 km as wet pressing increases. This
value is approximately 1/3 of the value found in a previous paper for the elastic modulus of
single wood pulp fibers of low yield kraft and holocellulose (Page, El-Hosseiny, Winkler, &
Lancaster, 1977).
To address the difference in paper modulus with changes in bonding, Page et al. again
reference (Cox, 1952) who drew a parallel between reinforced composites and paper. Due to
the need for stress to be transferred from one fiber to neighboring fibers, the stress distribution
along the fiber length is not consistent; it is at its maximum at the axial center of the fiber and
diminishes to zero at the ends. The gradient from maximum to zero takes place over a certain
number of bonded fiber crossings. Increased bonding reduces the length of the fiber needed for
the stress gradient. Utilizing more of the fiber at high stress transfer conditions increases the
elastic modulus of the network (paper).
The plateau that the sheet modulus approaches with increased bonding is different for
different pulps (Page, Seth, & De Grace, 1979). A comparison is made of 2 dried pulp sheets
that were pressed to the same scattering coefficient (degree of bonding) but one pulp has been
beaten while the other has not. The beaten pulp results in a sheet with a higher elastic
modulus. Reasons given from observation of SEM photographs are that the beaten pulp has
had many of its crimps and kinks removed, and because beating causes the fibers to swell and
become more flexible. The more flexible fibers have more frequent and larger bonded areas at

43
the fiber crossings. Upon drying, the transverse shrinkage of one fiber causes
microcompressions in the crossing fibers, which serves to pull the unbonded regions straight.
When the fibers are straighter, they are able to participate in the stress distribution when the
sheet is initially stressed (higher elastic modulus) rather than having to be pulled straight by the
external stress before they can take any load (Page & Tydeman, 1962).
In the second paper of the series (Page & Seth, 1980a), the authors derived an equation
for the elastic modulus of paper and show experimentally the validity of the model. Using light
scattering coefficient as an indicator of bonding, the equation developed for sheets of long,
straight, well bonded fibers is (Page & Seth, 1980a, p. 115):
Ep=1/3 Ef [1-(w/L RBA)(Ef/2Gf)1/2] (4)
where: Ep = elastic modulus of the paper Ef = elastic modulus of the fiber Gf = shear modulus L = fiber length RBA = relative bonded area W = fiber width
For long fibers with high bonded area the equation reduces to (Page & Seth, 1980a, p. 114):
Ep=1/3 Ef (5)
Usually, the modulus of a sheet is less than 1/3 of the fiber elastic modulus due to shorter fiber
length (stress transfer near the fiber ends), or the ratio of the fiber axial elastic modulus to its
shear modulus (bonding). The authors go on to show how the model can be verified
experimentally by plotting the paper elastic modulus vs light scattering coefficient of 7 pulps
pressed to various scattering coefficients. The results of the experiment are fit to the model and
the match is impressive. The effect of pulping technique and drying of pulp prior to re-slushing
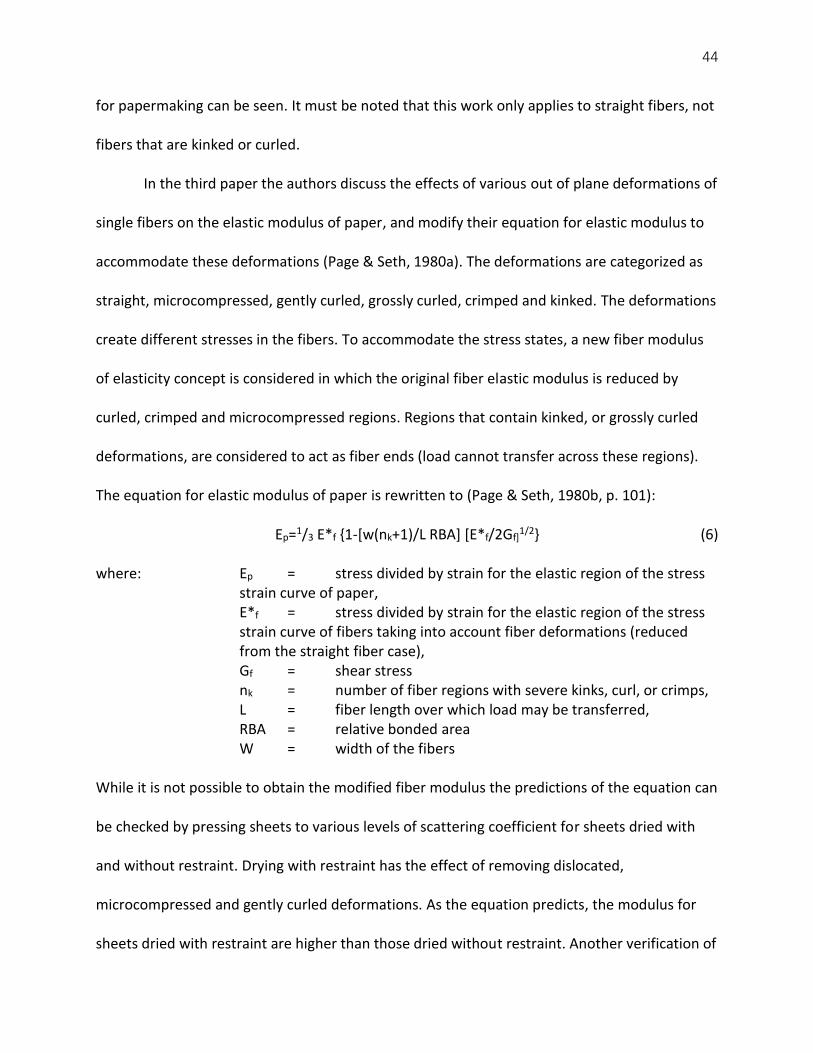
44
for papermaking can be seen. It must be noted that this work only applies to straight fibers, not
fibers that are kinked or curled.
In the third paper the authors discuss the effects of various out of plane deformations of
single fibers on the elastic modulus of paper, and modify their equation for elastic modulus to
accommodate these deformations (Page & Seth, 1980a). The deformations are categorized as
straight, microcompressed, gently curled, grossly curled, crimped and kinked. The deformations
create different stresses in the fibers. To accommodate the stress states, a new fiber modulus
of elasticity concept is considered in which the original fiber elastic modulus is reduced by
curled, crimped and microcompressed regions. Regions that contain kinked, or grossly curled
deformations, are considered to act as fiber ends (load cannot transfer across these regions).
The equation for elastic modulus of paper is rewritten to (Page & Seth, 1980b, p. 101):
Ep=1/3 E*f {1-[w(nk+1)/L RBA] [E*f/2Gf]1/2} (6)
where: Ep = stress divided by strain for the elastic region of the stress strain curve of paper,
E*f = stress divided by strain for the elastic region of the stress strain curve of fibers taking into account fiber deformations (reduced from the straight fiber case), Gf = shear stress nk = number of fiber regions with severe kinks, curl, or crimps, L = fiber length over which load may be transferred, RBA = relative bonded area W = width of the fibers
While it is not possible to obtain the modified fiber modulus the predictions of the equation can
be checked by pressing sheets to various levels of scattering coefficient for sheets dried with
and without restraint. Drying with restraint has the effect of removing dislocated,
microcompressed and gently curled deformations. As the equation predicts, the modulus for
sheets dried with restraint are higher than those dried without restraint. Another verification of
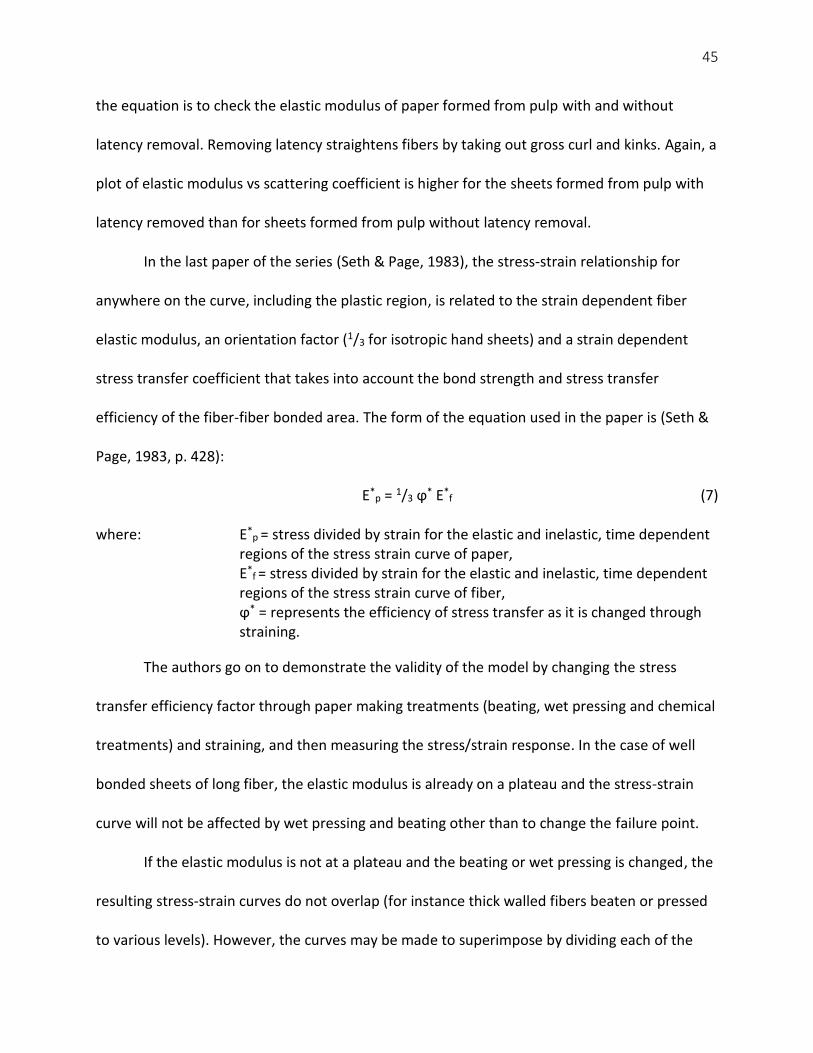
45
the equation is to check the elastic modulus of paper formed from pulp with and without
latency removal. Removing latency straightens fibers by taking out gross curl and kinks. Again, a
plot of elastic modulus vs scattering coefficient is higher for the sheets formed from pulp with
latency removed than for sheets formed from pulp without latency removal.
In the last paper of the series (Seth & Page, 1983), the stress-strain relationship for
anywhere on the curve, including the plastic region, is related to the strain dependent fiber
elastic modulus, an orientation factor (1/3 for isotropic hand sheets) and a strain dependent
stress transfer coefficient that takes into account the bond strength and stress transfer
efficiency of the fiber-fiber bonded area. The form of the equation used in the paper is (Seth &
Page, 1983, p. 428):
E*p = 1/3 ϕ* E*
f (7)
where: E*p = stress divided by strain for the elastic and inelastic, time dependent
regions of the stress strain curve of paper, E*
f = stress divided by strain for the elastic and inelastic, time dependent regions of the stress strain curve of fiber,
ϕ* = represents the efficiency of stress transfer as it is changed through straining.
The authors go on to demonstrate the validity of the model by changing the stress
transfer efficiency factor through paper making treatments (beating, wet pressing and chemical
treatments) and straining, and then measuring the stress/strain response. In the case of well
bonded sheets of long fiber, the elastic modulus is already on a plateau and the stress-strain
curve will not be affected by wet pressing and beating other than to change the failure point.
If the elastic modulus is not at a plateau and the beating or wet pressing is changed, the
resulting stress-strain curves do not overlap (for instance thick walled fibers beaten or pressed
to various levels). However, the curves may be made to superimpose by dividing each of the

46
curves by the efficiency factor. The efficiency factor is the ratio of the elastic moduli of the two
papers: the less well bonded sheet and the highly bonded sheet. The superimposition includes
the plastic regions.
If papermaking treatments change the efficiency factor and the efficiency factor
changes during straining, the stress-strain curves for the resulting papers will not superimpose
(for instance debonding agent added to the pulp). The papermaking agent will reduce the bond
area and weaken the bonds so that they fail during straining. If the curves are divided by the
efficiency factor of the elastic moduli, the elastic portion of the curves superimpose however
the plastic regions do not.
If fiber properties are not constant, the curves of individual sheets cannot be
superimposed even in the elastic region. Classes of fiber property changes in this category are
those that affect the molecular mobility of the fiber wall matrix materials (humidity effects for
instance) and those that change the crimps, microcompressions, etc. To illustrate this
condition, stress-strain curves of sheets made with similar pulps dried restrained or
unrestrained were presented (no superimposition), as well as sheets that have had the fibers
subjected to different amounts of curling action during high consistency pulping (no
superimposition).
The effect of curl, crimps, kinks and microcompressions is further supported by a later
paper (Page, Seth, Jordan, & Barbe, 1985) in which the authors concluded that these fiber
deformations are important factors in determining the final paper properties. Increased
microcompressions, for instance, give higher stretch at failure, lower tensile strength and
higher toughness. Sulphite pulps of high yield were least affected by the effects of curling, RMP
47
and low yield pulps were most affected. The difference in stiffness between the cellulose
microfibrils and the hemicellulose/lignin matrix are the factors the authors used to explain the
results. Once a fiber is curled, the stresses in the microfibrils tend towards straightening the
fiber, whereas the matrix below its glass transition temperature resists the stresses. If the fibers
are treated by latency removal techniques, the matrix materials soften allowing the microfibrils
to straighten. The effect of relative humidity (fiber wall molecular mobility) is shown in curves
from other authors where again, no superimposition of the same sheets subjected to different
humidity levels is possible.
An interesting paper was given at the 10th Fundamental Research Symposium that dealt
with softwood kraft and pressurized groundwood pulps (Lonnberg, 1993). Beginning with the
Page equation (Page, 1969) for tensile strength of paper sheets, Lonnberg adds sheet density
(the Page equation used fiber density) to imply fiber conformability and the ability to form
bonds, and straining speed, to indicate shearing speed and the viscoelasticity of the fibrous
network. The sheet density factor was used to complement bonding area given by light
scattering. The thought was that while many bonding sites are available, only those that are
accessible to other fibers increase tensile strength, and this can be implied by sheet density. It
was found that faster straining gives less time for fiber relaxation, and therefore weaker bonds
break spreading stresses to more neighboring bonds, which lowers the stress per bond and
yields modestly higher tensile strength. Softwood kraft and pressurized groundwood pulps
were fractionated and then various mechanical pulp fractions combined with the long fiber
fraction of kraft pulp in differing proportions. Tensile strength of the sheets formed from the
mixtures increased as more well fibrillated fine material was added (more bonds were

48
introduced). Similar was true for proportions of finer softwood kraft fractions added back to the
coarse fiber fraction. Finer fractions increase the tensile strength (Lonnberg, 1993).
In summary, many fiber and papermaking factors affect the stress-strain curve of dry
paper. The fiber material itself and the pulping method dictate much of the fiber length and
flexibility through cell wall thickness and how much lignin remains after pulping. Fiber
deformations are affected by wood processing, mechanical pulping, stock preparation and
drying restraint. Fiber orientation and the thickness direction distribution of various fiber
fractions is dictated by forming conditions. The tensile properties are all affected by drying
restraint.
The Effect of Water on the Stress-Strain Relationship of Paper
Water plays two important roles where the stress-strain relationship of paper is
concerned. First, water will displace fiber-fiber bonds by hydrogen bonding with hydroxyl
groups between the fibers (Ojala, 1999). Secondly, water softens the amorphous wood
polymers (Salmen L., 1993). Salmen’s laminate model of fibers, and his work on moisture and
temperature effects on the stress-strain relationship of fibers and paper, provides a framework
for the discussion.
Salmen’s laminate model. Salmen’s laminate model (Salmen N., 1986) considers both
micromechanical and macromechanical features of the fiber wall. The micromechanical analysis
takes into account the exact nature of a composite. The macromechanical analysis combines
the characteristics of different layers to obtain overall properties of the construct. The
microfibrils are thus considered as reinforcing elements of a composite material, while the
walls of the fiber are considered the layers. The microfibrils are modeled as crystallites with a

49
certain length/diameter ratio, which is very large (50,000) for dry and moist states, and reduced
(500) for the water immersed state. In this way, Salmen avoided considering the amorphous
disordered cellulose and could focus instead on the generally crystalline cellulose
reinforcement. The hemicellulose and lignin are considered the amorphous matrix that serves
to transfer stress between microfibrils. Salmen was able to show that with certain assumptions
drawn from classic reinforced laminate theory, the model accurately predicts elastic modulus
for undamaged individual fibers, as found by (Page, El-Hosseiny, Winkler, & Lancaster, 1977)
with fibril angle taken into account. The model assumes values for elastic modulus, shear
modulus and Poisson ratio, for each of the polymers below and above the glass transition
temperature, that are consistent with the literature. The values used are listed in Table 3. There
are other more complex models available for the structure of fibers (Akerholm & Salmen,
2001), however for the work of this thesis Salmen’s simple laminate structure model suffices.
Table 3. Modulus parameter for Salmen’s laminate model of the fiber wall.
Below Tg Above Tg
Cellulose Hemi-
cellulose Lignin Cellulose
Hemi- Cellulose
Lignin
Ex* (N/m2)
13.4x10¹⁰ 8x10⁹ isotropic
Same. l/d ratio changed
2.1x10⁷ isotropic
E*** (N/m2)
2.72x10¹⁰ 4x10⁹ 4x10⁹ 1x10⁷ 6x10⁷
G**** (N/m2)
0.44x10¹⁰ 2.1x10⁹ 1.5x10⁹ 0.5x10⁷ 2.25x10⁷
Poisson ratio
0.1 0.2 0.33 0.1 0.2 0.33
*-Ex denotes fiber direction **-E denotes bulk modulus ***-G denotes shear modulus
Softening of the wood polymers. For the three main amorphous wood polymers
(hemicellulose, lignin, and the disordered, amorphous portions of the cellulose chains) the glass
(Salmen N., 1986, p. 8)
50
transition temperature (Tg) of dry material is in the range of 180-230 °C (Salmen N., 1986). They
differ once water is added – water is a plasticizer for the amorphous wood polymers.
Amorphous cellulose and hemicellulose have their water soaked Tg near room temperature. For
the highly crosslinked lignin, the Tg in water soaked conditions is reduced only to about 90 °C.
Lignin will absorb about 5% moisture content, while the cellulosic polymers will absorb up to 5
times as much moisture (Salmen, Lucander, Harkonen, & Sundholm, 1999). For moderate
moisture levels, (corresponding to 25-90% relative humidity), the disordered regions of the
cellulose are unaffected by moisture due to restrictions imposed on them by the crystalline
regions surrounding them. Softening of the disordered regions at room temperature does not
occur until about 50% moisture content (Salmen L., 1993, p. 383). For single fibers in moderate
moisture conditions (25-90% RH) the model predicts the softening adequately. The softening of
the hemicelluloses is the dominant factor in this range of moistures and the microfibrils are
estimated to be unaffected. For water soaked conditions the reduction in modulus is magnified
due to disordered cellulose softening. The reduction in modulus in water soaked conditions
cannot be explained by hemicellulose softening, but rather by a reduction in the reinforcement
shape factor as described above. For water soaked conditions the microfibrils determine the
stiffness of the fibers.
The picture is less clear for paper than for fibers. The effect of moisture and
temperature on the load-elongation curve for a hypothetical paper is shown in Figure 7. The
effect of both control variables on the elastic modulus of paper is apparent. For S2 fibril angles
most typical in fibers (10-30°), the reduction in fiber rigidity from 0-95% RH is only
approximately 10%. Using a model for isotropic paper, if the rigidity of paper were to depend

51
only on the fiber properties, the reduction for paper should be in the order of 20%. Empirical
data suggest 50% is a more realistic reduction indicating some other factor than the fiber
properties is responsible.
It seems likely that the missing factor in the reduction of modulus from Salmen’s model
is the decrease in fiber-fiber bonding due to increased moisture. In an article on the mechanism
of bonding (Campbell, 1959), the author states that water penetrates bonded areas and
replaces cellulose-cellulose bonds with cellulose-water bonds. In (Christensen & Giertz, 1966)
the authors outline 3 theories of water interaction with cellulosic fibers, with the swelling
theory seemingly preferred. Swelling takes place due to water adsorption in the hemicellulose
(disordered regions) of the fiber wall due to hydrogen bonding. Hydrogen bonding dominates
intra and interfiber interactions. As stated earlier in the section on Hydrogen Bonding, every
theory on fiber-fiber interaction recognizes the importance of this type of bonding. It seems
5
4 0% mc hotter
15% mc
3
2
1
1 2 3 4
Elongation, %
0
Load
, kN
/m
Figure 7. Failure envelopes for same paper at two moisture contents and range of temperatures.
(Salmen & Back, 1980, p. 117)
52
likely that hydrogen bonding plays an important role in the stress-strain relationship of paper as
well.
Hygro/hydro-expansion. As noted above, swelling takes place in the amorphous regions
of fibers when exposed to water, either liquid or vapor. The addition of water adds volume to
the amorphous polymers, which in turn causes swelling. The swelling is highly anisotropic due
to the reinforcement provided by the non-water absorbing microfibrils (Salmen L., 1993).
Fibers, when allowed to swell without restriction, will increase in length approximately 1%,
while the lateral direction will increase approximately 20% (Gallay, 1973).
Creep. Creep is defined as the deformation of paper over time in response to a
constant stress. Stress relaxation is defined as the reduction in stress over time for a paper
strained to a given amount and then held. The two phenomena are related. In printing, stress
relaxation is possible between the printing units and chill section. The web is strained at a
constant amount. Stress relaxation may occur over the 2 second span between the last printing
unit and the chill nip.
Increased moisture and temperature increase creep and stress relaxation in paper.
Temperature shifts the glass transition temperature of the amorphous matrix components of
wood fibers to lower temperatures and moisture breaks the bonds between the polymers
(Salmen L., 1993).
Creep and stress relaxation is proportional to the initial load on the web. A higher initial
load will cause more creep or stress relaxation over a given time (Sanborn, 1962). According to
Brezinski, “the deformation is largely due to changes in the molecular configuration in the
amorphous areas of the polymer” (Brezinski, 1956).
53
Moisture Transport in Paper
From the discussion above it is apparent that water affects the properties of paper in at
least two ways: substitution of cellulose-cellulose bonds with water-cellulose bonds, and
plasticization of the fiber walls. If paper is left to equilibrate in an environment of high relative
humidity, the tensile stiffness and tensile strength will decrease and the stretch will increase. In
dry environments, the paper will become brittle with lower stretch and higher tensile strength.
The effect of moisture on the tensile properties of paper is so important that TAPPI standards
call for paper sheets to be left in a standardized, controlled humidity and temperature
environment for 4 hours prior to commencing testing (TAPPI, 2013). In applications such as
HSWO printing the time between water application during printing and subsequent drying is
short; in the order of a few seconds. A key factor in determining paper performance is whether
significant penetration of the paper and fiber walls occurs within this processing time (Lyne,
1993).
During the first Fundamental Research Conference a paper was presented that reviewed
methods of measuring penetration of paper by liquids and gases, and the available laws to
describe the process (Corte, 1958). The author was able to show that the pore structure of
paper could be described with a pore radius distribution that changed depending on beating
level and moisture content. Higher degrees of beating resulted in a reduction of larger pores
and a higher number of smaller pores. An example given was the grease proofing of paper,
where grease resistance can be achieved through increased beating; the pore size gets smaller
and smaller preventing the grease molecules from passing through the paper.

54
One difficulty when describing water penetration into a paper sheet is that water swells
the fiber walls, which changes the pore structure. When water vapor is compared with an inert
gas, the volume/pressure relationship shows flow rates through paper are equal (at equivalent
molecular weights) at low relative humidity, however, at approximately 25% RH the flow rate of
water vapor rises steeply. This was taken to mean that until 25% RH water molecules were
interacting with the fiber walls to cover the available bonding sites. After 25% RH, surface
diffusion was the dominating factor, and the flow rate obeyed Fick’s Law; the flow rate is
related to the surface concentration gradient.
At the second Fundamental Research Conference in 1961 a paper was presented by Brecht
that summarized laws for permeation, diffusion and penetration of fluids into porous materials
(Brecht, 1962). The Hagen-Poiseuille law, Kozeny-Carmen equation, Lucas-Washburn equation,
Knudsen equation (wall slip), Fick’s diffusion law, and Kelvin’s law were all used to describe
various conditions of gas/liquid interaction with paper but no law was sufficient for all
circumstances. Brecht used the classifications from Corte for permeation and summarized the
phenomena as:
Permeation of gases with no influence on the fiber wall can be described by the Hagen-
Poiseuille Law. Density plays a key role in permeation (pore radius to 4th power), which
is most affected by beating and pressing.
Penetration of organic liquids with no influence on pore wall: At constant flow rate the
Hagan-Poiseuille Law dictates; for the initial interaction before steady state flow is
reached capillary suction forces initiate flow then friction becomes a factor as pores fill.
The Lucas-Washburn equation applies with an excess of liquid available and when the

55
pore volume is saturated. If a concentration gradient exists Lucas-Washburn does not
apply. In plane penetration is faster than through sheet penetration. Rosin sizing can
increase oil penetration due to higher porosity and lower contact angle. Separation of
constituents takes place as per an ink example where the pigment does not penetrate as
far as the vehicle. Paper density increase does not impact vehicle penetration but does
limit pigment penetration.
Water permeation- for non-turbulent flow the Kozeny-Carmen equation applies if fibers
have time to fully swell to equilibrium conditions. Swelling leads to a reduction in
permeability coefficient. Penetration is empirically determined and generally increased
viscosity yields increased penetration time and higher water content yields higher
penetration time. At very low moisture content increasing water decreases penetration
time until approximately 4.5% moisture content when a layer of water molecules covers
the fiber surface. This is analogous to Corte’s comments on this subject. For unsized
paper, penetration rate increases with bulk and roughness.
Water vapor – below 25% RH water vapor is similar to air or other non-reacting gas
adjusted for molecular weight. Above 25% RH surface diffusion increases permeation
significantly. This is similar to Corte’s statement on this subject. Thinner papers
acclimatize to changes in moisture content (and temperature) faster than thicker papers
and have an overall lower gradient through the transition time.
Winspear tried to accommodate the swelling of the fiber walls in the Lucas-Washburn
equation by incorporating a factor that is the ratio of wet sheet thickness/dry sheet thickness
(Winspear, 1979). Winspear found that the equivalent pore radius decreased as the water
56
fraction of a water/alcohol mix applied to the paper increased. This seems to be in
contradiction to Corte who found that the flow of a nitrogen/water vapor gas through paper at
a given pore radius increased as moisture content of the gaseous mixture increased. This seems
to indicate that the effective pore radius increases with moisture content.
By the 10th Fundamental Research Conference, research on transport mechanisms was
considering other factors in liquid-paper interactions such as the effect of pressure penetration
(printing nips) and the effect of acid-base versus diffusion interactions on spreading. Lyne
presented a paper outlining three absorption phenomena that must be considered for liquid-
paper interactions: dynamic wetting, spreading and capillary penetration; pressure penetration;
and, diffusion into the fiber wall and swelling (Lyne, 1993).
Wetting can be viewed as an interfacial adhesion between a solid and a liquid. Two
interactions that contribute to wetting are dispersive and acid-base. Dispersion forces (also
known as London-van der Waals forces) are weak, long range interactions between fluctuating
dipoles. Acid–base interactions are stronger, short range forces originating from electron
donor-acceptor exchange between two molecules. Generally wetting is studied under
equilibrium conditions with well-known rules about contact angle dictating wetting propensity.
However, under pressure, liquids may wet solids that would not wet under equilibrium
conditions. When this happens, dispersive interactions dominate the wetting. The wetting may
stop on removal of the pressure. Lyne also refers to a paper by Aspler, et al. on the effect of
surface chemistry of paper on water based ink transfer (Aspler, DeGrace, Beland, Maine, &
Piquard, 1993). Alkaline water based inks transferred more favorably as the paper surface
acidity increased. This is clearly an acid-base interaction (Lyne, 1993).

57
Water behaves differently than other liquids. As relative humidity is increased,
spreading of the liquid film increases, just as penetration of water in paper increases at higher
relative humidity. In test results presented in the paper, contact angle of water on cellophane
decreased with rising relative humidity as did the dispersive component of adhesion while the
acid-base work of adhesion increased (Lyne, 1993).
Pore wall geometry also plays a role in contact angle. A converging pore wall will have
the effect of reducing contact angle, with a corresponding increase in capillary pressure. A
diverging pore wall will reduce pressure. In an experiment with mineral pigments and starch
binder on Millipore filters, penetration rate for oil in a Bristow test was much slower for the
blocky ground calcium carbonate pigment than the platy mica pigment, a result opposite to
intuition. The author surmises that the absorption rate difference is likely caused by a diverging
pore structure of the calcium carbonate coating and converging structure in the mica coating
(Lyne, 1993).
In pressure penetration, Darcy’s law is the typical starting point for discussion. While
this law may work for low density pulp pads such as diapers, it is of little value in printing and
writing grades. When a pressure pulse drives liquid into a pore system, a saturation gradient
exists and this gradient will influence the local permeability. The rate at which the pore system
saturates locally is dependent on the pore size distribution. The author concludes that no law is
sufficient to predict the result of pressure penetration (Lyne, 1993).
Moisture diffusion into the fiber wall results in swelling. The effects of swelling of the
fiber wall in paper will be seen as network expansion (hygro/hydro-expansion). If water
penetrates only the inter-fiber pores rather than the fiber wall pores, no swelling or network
58
expansion takes place. If water penetrates to the intra-fiber pores swelling results and the
network expands. The expanding network increases the size of inter-fiber pores, which
increases the rate of penetration (Lyne, 1993).
Kettle et al. measured uncoated supercalendered base paper treated with no
calendaring, soft nip calendering and supercalendering with and without steam pretreatment.
They found air permeability was highest for the uncalendered sheets followed by the soft nip
and supercalendered sheets without steam treatment, and finally the soft nip and
supercalendered steam treated sheets. Liquid absorption measured with a Bristow test and a
new Liquid Air Displacement test, of the same samples measured for air permeability, followed
the air permeability results although the absolute values of the void space were different in the
two tests. The pore size distribution was measured for the same sheets that were measured for
air permeability. The pore size distribution along with information about the penetrating liquid
was used to model the absorption rate of the sheets. Model results indicated that larger pores
fill quickly and in short times (<1s) larger pores dominate the absorption rate. For longer times
(>1s) smaller pores dominate the absorption rate. Calendering changes the pore size
distribution with few large pores remaining after supercalendering and steam treatment
(Kettle, Matthews, Ridgway, & Wagberg, 1997).
The HSWO Printing Process
Reels, pre-tensioning and web guiding. Paper is delivered to HSWO printing presses in
roll form. The paper rolls are mounted in the roll stand, which has two main functions; to
unwind the paper rolls with minimal tension variation, and to facilitate the changing of rolls as
one expires without interrupting the printing operation. Tension of the web is controlled via a
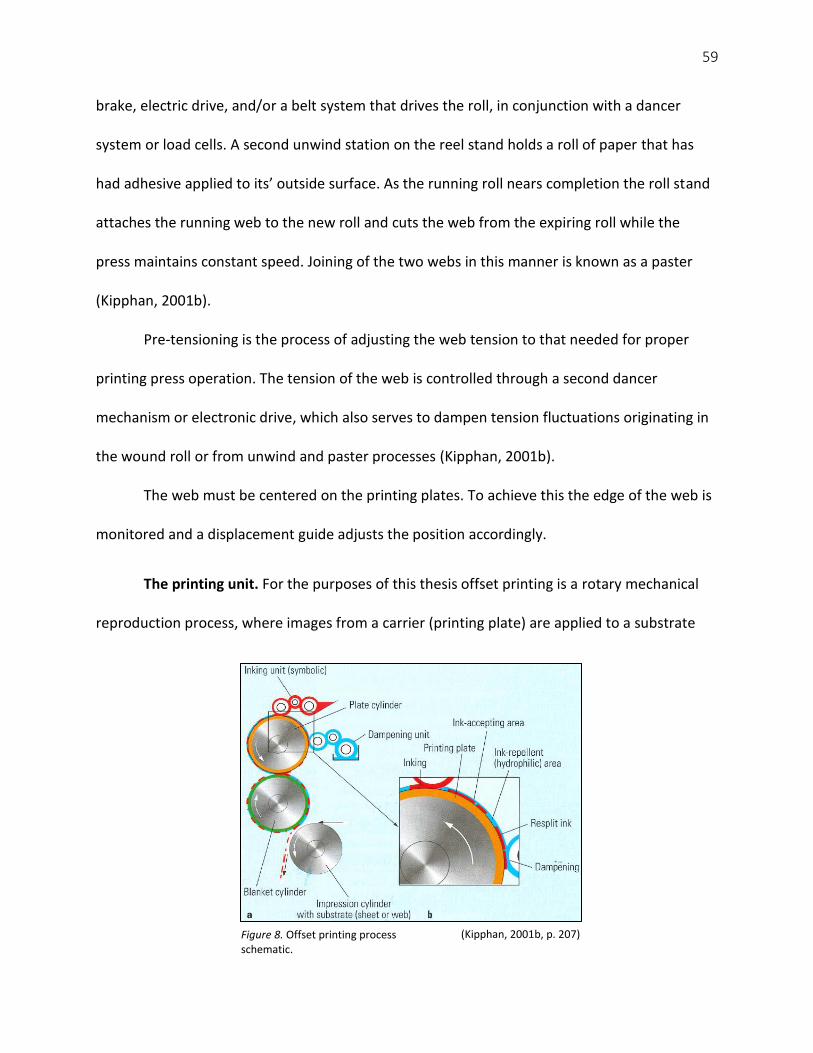
59
brake, electric drive, and/or a belt system that drives the roll, in conjunction with a dancer
system or load cells. A second unwind station on the reel stand holds a roll of paper that has
had adhesive applied to its’ outside surface. As the running roll nears completion the roll stand
attaches the running web to the new roll and cuts the web from the expiring roll while the
press maintains constant speed. Joining of the two webs in this manner is known as a paster
(Kipphan, 2001b).
Pre-tensioning is the process of adjusting the web tension to that needed for proper
printing press operation. The tension of the web is controlled through a second dancer
mechanism or electronic drive, which also serves to dampen tension fluctuations originating in
the wound roll or from unwind and paster processes (Kipphan, 2001b).
The web must be centered on the printing plates. To achieve this the edge of the web is
monitored and a displacement guide adjusts the position accordingly.
The printing unit. For the purposes of this thesis offset printing is a rotary mechanical
reproduction process, where images from a carrier (printing plate) are applied to a substrate
Figure 8. Offset printing process schematic.
(Kipphan, 2001b, p. 207)

60
(paper) using ink. The offset printing process is illustrated in Figure 8. The image to be
reproduced is transferred to the printing plate in a separate process off line from the printing
press. The plates are installed in the press around a cylinder, which is nipped against a second
cylinder with a flexible cover (blanket cylinder), and a third smooth impression cylinder over
which the substrate passes. Ink is applied to the image area of the printing plate. The inked
image transfers to the blanket cylinder, which in turn transfers the ink to the paper.
The image and non-image areas on the printing plate are on the same level. The non-
image areas are hydrophilic while the image areas are oleophilic. The printing ink is made from
an oil base into which various pigments and additives are mixed to achieve the desired
properties (Oittinen & Saarelma, 1998b). As the printing cylinders rotate the surface of the
plate is dampened with a thin film of water based solution (mainly water plus additives). The
surface tension of the dampening solution is reduced to aid in wetting.
The inking unit offers a thin film of ink to the printing plate. The hydrophilic non-image
areas, which have been previously covered with dampening solution prevent ink from
transferring while the oleophilic image areas accept a thin layer of ink. In both the dampening
and inking units, multiple rollers are used to split the water and ink films multiple times, to
make the feed to the printing plate uniform. Often a vibrator roller is utilized in the feed
systems, which oscillates laterally, for even more uniform film coverage. The dampening
solution and ink are transferred to the blanket cylinder via a film splitting process and then split
again between the blanket cylinder and the paper web. On the second and subsequent rotation
of the plate cylinder, dampening solution is applied over the image and non-image areas. Some
of the dampening solution stays on the surface of the ink film left behind from the previous
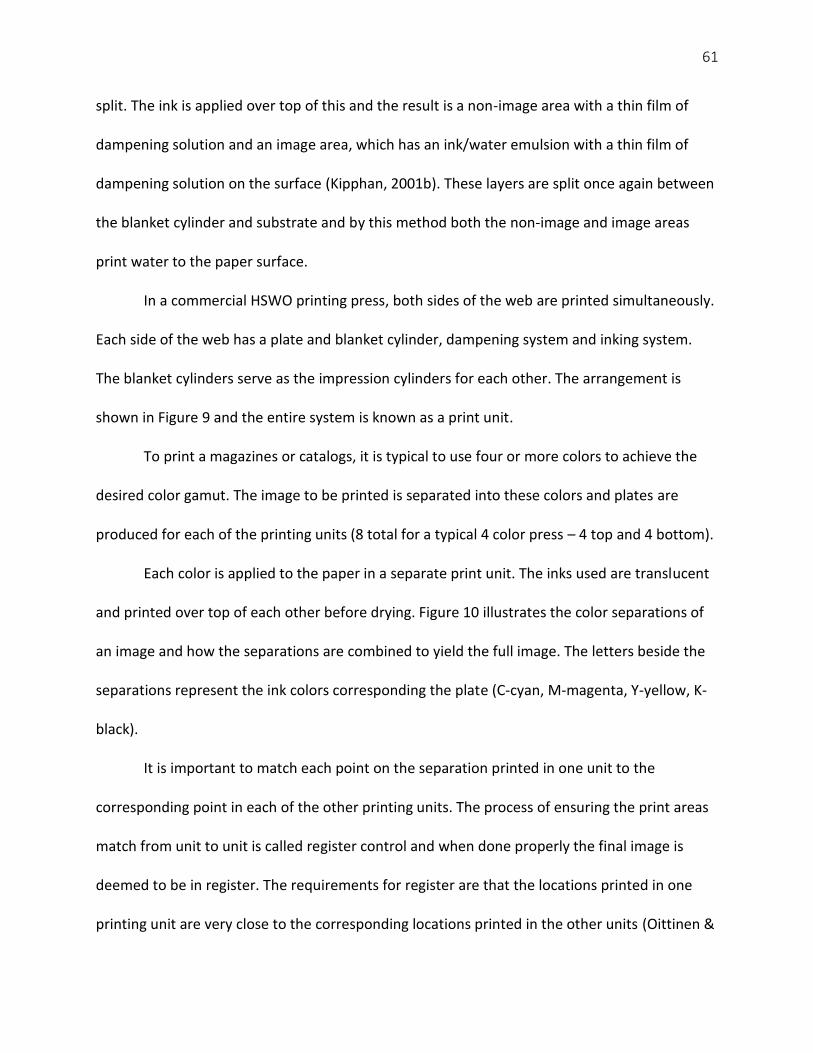
61
split. The ink is applied over top of this and the result is a non-image area with a thin film of
dampening solution and an image area, which has an ink/water emulsion with a thin film of
dampening solution on the surface (Kipphan, 2001b). These layers are split once again between
the blanket cylinder and substrate and by this method both the non-image and image areas
print water to the paper surface.
In a commercial HSWO printing press, both sides of the web are printed simultaneously.
Each side of the web has a plate and blanket cylinder, dampening system and inking system.
The blanket cylinders serve as the impression cylinders for each other. The arrangement is
shown in Figure 9 and the entire system is known as a print unit.
To print a magazines or catalogs, it is typical to use four or more colors to achieve the
desired color gamut. The image to be printed is separated into these colors and plates are
produced for each of the printing units (8 total for a typical 4 color press – 4 top and 4 bottom).
Each color is applied to the paper in a separate print unit. The inks used are translucent
and printed over top of each other before drying. Figure 10 illustrates the color separations of
an image and how the separations are combined to yield the full image. The letters beside the
separations represent the ink colors corresponding the plate (C-cyan, M-magenta, Y-yellow, K-
black).
It is important to match each point on the separation printed in one unit to the
corresponding point in each of the other printing units. The process of ensuring the print areas
match from unit to unit is called register control and when done properly the final image is
deemed to be in register. The requirements for register are that the locations printed in one
printing unit are very close to the corresponding locations printed in the other units (Oittinen &
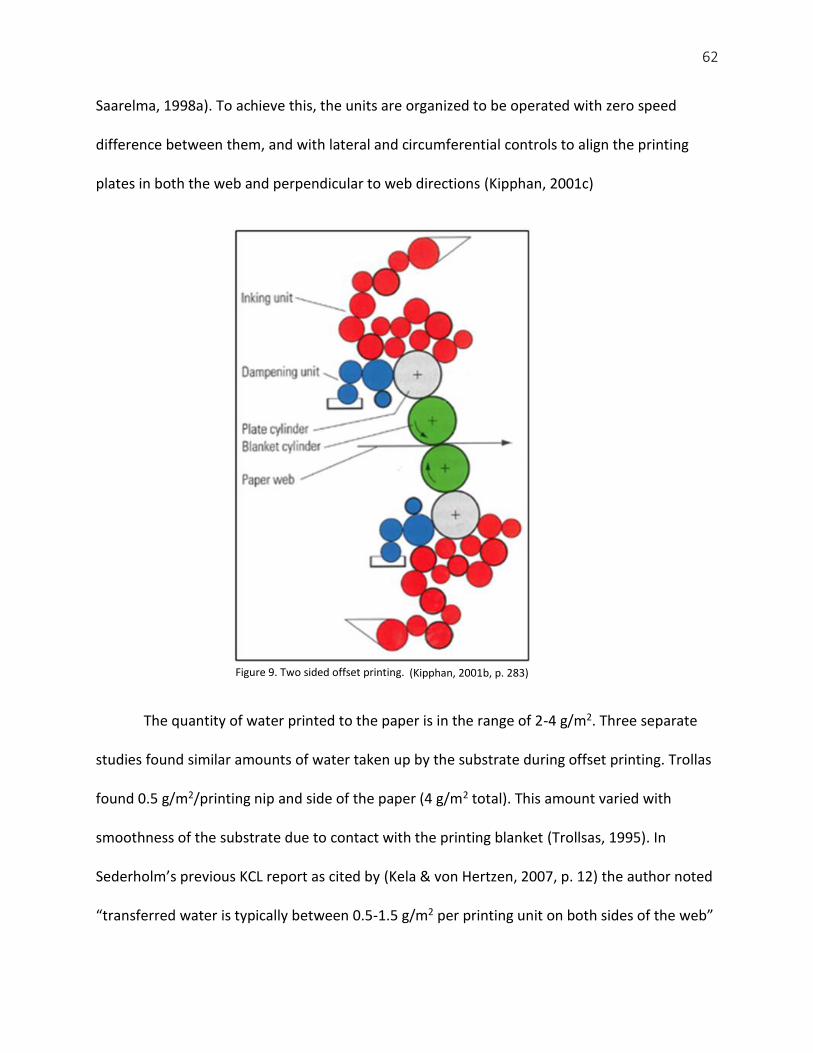
62
Saarelma, 1998a). To achieve this, the units are organized to be operated with zero speed
difference between them, and with lateral and circumferential controls to align the printing
plates in both the web and perpendicular to web directions (Kipphan, 2001c)
The quantity of water printed to the paper is in the range of 2-4 g/m2. Three separate
studies found similar amounts of water taken up by the substrate during offset printing. Trollas
found 0.5 g/m2/printing nip and side of the paper (4 g/m2 total). This amount varied with
smoothness of the substrate due to contact with the printing blanket (Trollsas, 1995). In
Sederholm’s previous KCL report as cited by (Kela & von Hertzen, 2007, p. 12) the author noted
“transferred water is typically between 0.5-1.5 g/m2 per printing unit on both sides of the web”
Figure 9. Two sided offset printing.
(Kipphan, 2001b, p. 283)
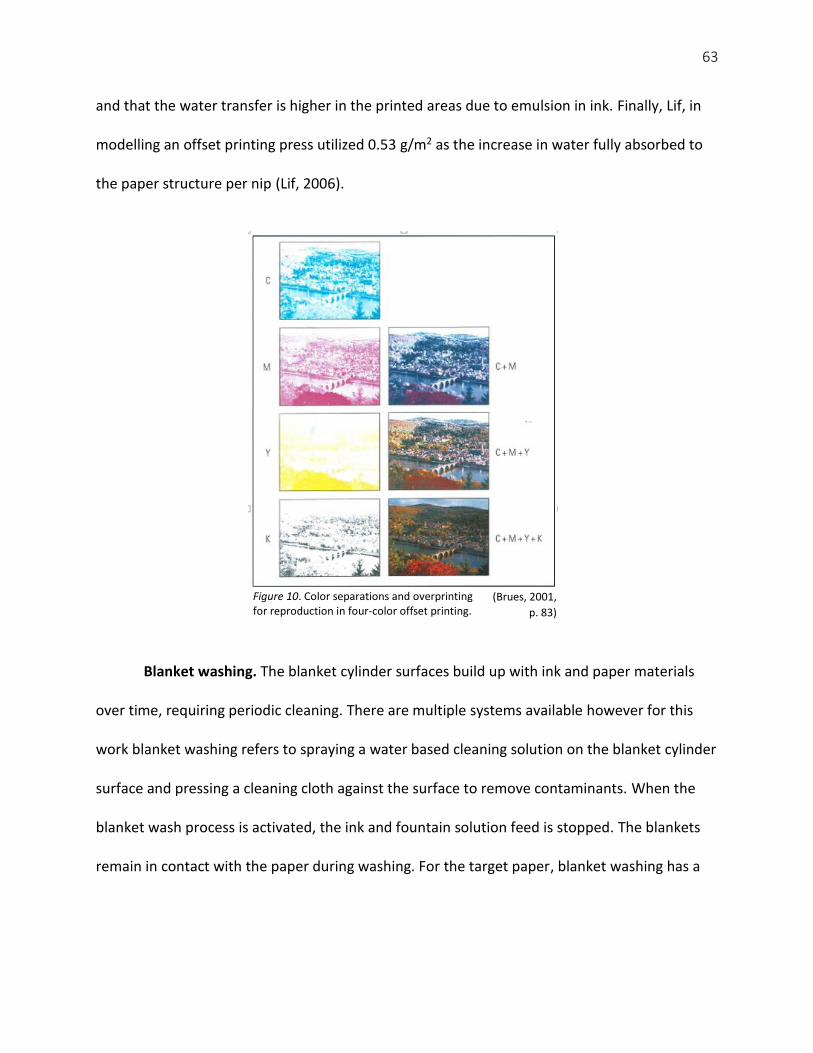
63
and that the water transfer is higher in the printed areas due to emulsion in ink. Finally, Lif, in
modelling an offset printing press utilized 0.53 g/m2 as the increase in water fully absorbed to
the paper structure per nip (Lif, 2006).
Blanket washing. The blanket cylinder surfaces build up with ink and paper materials
over time, requiring periodic cleaning. There are multiple systems available however for this
work blanket washing refers to spraying a water based cleaning solution on the blanket cylinder
surface and pressing a cleaning cloth against the surface to remove contaminants. When the
blanket wash process is activated, the ink and fountain solution feed is stopped. The blankets
remain in contact with the paper during washing. For the target paper, blanket washing has a
Figure 10. Color separations and overprinting for reproduction in four-color offset printing.
(Brues, 2001,
p. 83)
64
significant impact on the lateral web position. The amount of water applied during blanket
washing is higher than during printing.
Drying. After printing, the ink and dampening solution must be dried. A portion of the
ink dries by absorption into the paper and a portion must be evaporated in hot air dryers. The
dryers are set up with nozzles (also known as bars) perpendicular to the web running direction,
above and below the sheet. The nozzles above the web are offset from the nozzles below the
web and hot air is directed through the nozzles at the web surface. Due to the offset nature of
the nozzles the web travels through the dryer section in a serpentine pattern. A typical dryer
nozzle set up is shown in Figure 11. Dryers are designed for a residence time of 1 second
(Kipphan, 2001a). A web travelling at a speed of 8.2 m/s requires a dryer section 8.2 m in
length.
The air in a heatset dryer reaches 315 °C and the web temperature approaches 165 °C
(Kela & von Hertzen, 2007). The web loses moisture and becomes more brittle. The fans and
burners heating and circulating the air are on the back side (gear side) of the dryer hoods. The
air is fed to the dryer nozzles from the back side and returned to the fan suction through the
plenum in which the nozzles are mounted. Due to this ducting arrangement (or plugging of the
Figure 11. Dryer nozzle arrangement. (Shields, 2015)

65
dryer nozzles over time) the pressure may differ over the length of the nozzle and this can lead
to lateral stresses on the paper web. A similar effect will be seen if the gap between the dryer
nozzles changes laterally across the width of the dryer section.
Chill section. After drying, the web is cooled down by passing over a series of smooth
hollow cylinders through which chilled water passes. The web temperature at the chill section
exit should be approximately room temperature. At the exit of the chill section, a nip roller
presses the web tightly against the last chill roll. The chill roll section is connected to a drive
system and in this way the tension between the printing units and chill section can be adjusted.
Silicone application. After printing, drying and cooling, the ink is still not completely dry.
The outside surface of the ink will have hardened to some extent but it may not be stable
enough to resist smearing as the printed images travel through the folder section. A silicone in
water emulsion is applied to both web surfaces, which serves to protect the ink from smearing,
and also assists with preventing finished books from sticking to each other (Kipphan, 2001b).
Web guiding, slitting and turner bars. Prior to slitting and folding, the web must be
aligned. The web guide is a displacement type similar to that used prior to the printing units;
see for example (Roisum, 1998, p. 106). The nature of this type of web guide is to affect the
web position only in and after the guiding element, not prior to the guide. The correction takes
place between pivoting rolls only. The amount of correction possible is determined by how far
the pivoting rollers can pivot and the width of the guiding elements.
The guiding function serves to align the web on the slitters so that cuts are made in
precise locations, and, center the spine of the book in the folder.

66
For efficiency reasons, the paper is supplied in widths that contain multiple pages across
the roll face. To construct a book the pages must be separated from each other and aligned
before assembling them into the book in the folder. The web is slit longitudinally into ribbons
that pass over a series of turner bars. The turner bars align the ribbons over top of each other.
A stack of ribbons is delivered to the folder. The turner bars are hollow cylinders that have
pressurized air supplied to the inside volume. Small holes drilled through the shell allow air to
escape to the roll interior, where it forms a lubricating film on the bar surface, which allows the
ribbons to slide over the bars with minimal friction. Figure 12 shows an arrangement of 3
ribbons passing through the turner bars to be aligned.
Folding. The end product of a typical publication printing press is a “book”; a group of
pages sharing a common backbone (Kipphan, 2001b). In a typical former type folder, the
stacked ribbons are passed over a triangular former, which folds the ribbons in half
longitudinally. Figure 13 illustrates this folding process and the position of the individual pages.
After folding, the ribbons are cut across the running direction creating individual books of
Figure 12. Turner bar section. (Shields, 2015)

67
correct page length. Driven nipped roller pairs around the former allow tension to be adjusted
for optimal folder operation.
Web handling during printing. The production rate of a HSWO printing press is set by
printing units. A speed set point is given to the drive system rotating the print units and the rest
of the press components follow the speed of this reference in one of two ways. Upstream of
the print units the reels and pre-tensioning (infeed) sections operate under tension control,
while the sections downstream of the print units operate under speed control. The tension
control of the infeed section is accomplished as described above. The speed control after the
printing units is referred to as “gain” and represents the speed of the section relative to the
print units speed. Therefore, a chill section gain of 0.3% represents a chill roll surface speed of
1.003 x printing unit speed. The drive system rotates each section at a gain chosen by the
printing press operator, and the gain is selected to accommodate various paper and press
conditions. A nip roll is present in each driven section to negate slippage of the web over the
cylinders and ensure that the web speed is equal to the driven section speed (see for example
Figure 20 for the chill section nip).
Figure 13. Ribbons, former and folder schematic. (Kipphan, 2001b)

68
A typical tension profile along the printing press is described by Oittinen & Saarelma.
Tension increases prior to the printing units and then drops in tension between and following
the printing units (Oittinen & Saarelma, 1998a). It is difficult to know the tension in the span
between the last printing unit and the chill nip as it is not typically measured. The web tension
between the last printing unit and the chill section will be governed by the speed difference
between those two sections, the tension prior to the last printing unit and the tensile stiffness
of the web in this area of the press.
The tensile stiffness of the paper during printing and in the early stages of drying is
lower than the dry paper due to the addition of moisture (and heat). As discussed above, the
elastic modulus of paper (tensile stiffness) is affected by both bond disruption, and
plasticization, as moisture content increases. During drying two counteracting effects are
occurring. Heating the web at a constant moisture will reduce elastic modulus and lower web
tension. At the same time, moisture is being evaporated from the web, which will serve to
increase elastic modulus. The tensile stiffness of the paper changes during moisture absorption
and subsequent drying, however the tension in the open span will be determined by the lowest
tensile stiffness in the span.
During printing, disturbances exist that act in the cross (lateral) direction of the web.
Figure 14 illustrates the effect of a cross direction disturbance on the lateral web position as
influenced by machine direction web tension.

69
As web tension increases the effect of the lateral disturbances decreases, that is, the
resulting angle between the machine direction and the path taken by the web is reduced.
Examples of lateral disturbances include non-uniform paper properties, machine elements out
of alignment, or lateral air flow in the dryer hoods. Therefore, a paper that has more web
tension reduction, due to moisture increase during printing, will be more affected by the lateral
forces existing in the paper/printing system.
Previous Mill Trials
A number of trials have been conducted previously on the target PM, testing various
papermaking operations for impact on lateral web position. Changes to the coating pigment
type, coating binder amount, supercalendering conditions and various additives to base paper
and coating have yielded no change to the lateral web movement. An attempt at sizing the base
Θ1
Θ2
Same lateral disturbance
Web
ten
sio
n
Θ2 > Θ1 therefore web path will
shift further with lower web
tensionPr
inti
ng D
irec
tio
n
Figure 14. Lateral disturbance on web. (Shields, 2015)
70
paper with both ASA and AKD had a noticeable effect on the base paper water drop testing,
however no impact was seen on coating operations in the paper mill (blade tube pressure), or
the lateral web shift at the printing press. The idea of sizing is to limit the penetration of water
into the paper, which will minimize the reduction of tensile stiffness, and the possibility of
creep. Water drop testing measures how long a drop of water placed on the paper surface
takes to absorb into the paper structure. Increased time for absorption, as experienced with the
sized papers, indicates increased sizing. The lateral web movement was not affected by the
sizing. Therefore, it was concluded that water drop testing could not predict lateral web
movement on the target printing press. As noted in the literature review, water applied under
pressure penetration probably does not follow any specific rule predicted by the application of
water under non-pressure situations (Lyne, 1993). Water that would not wet the paper in a
water drop test may well wet the paper under pressure driven penetration.
Sensitivity to printing press operations. More recently two sets of trials showed the
sensitivity of the paper produced on the target paper machine to printing press operations. In
the first trial the target paper machine standard sheet was compared to a competitive sheet of
similar basis weight. Tests included subjecting the sheets to each step of the printing operation
cumulatively and measuring the effect on lateral web position. Figure 15 shows the results of
the test.
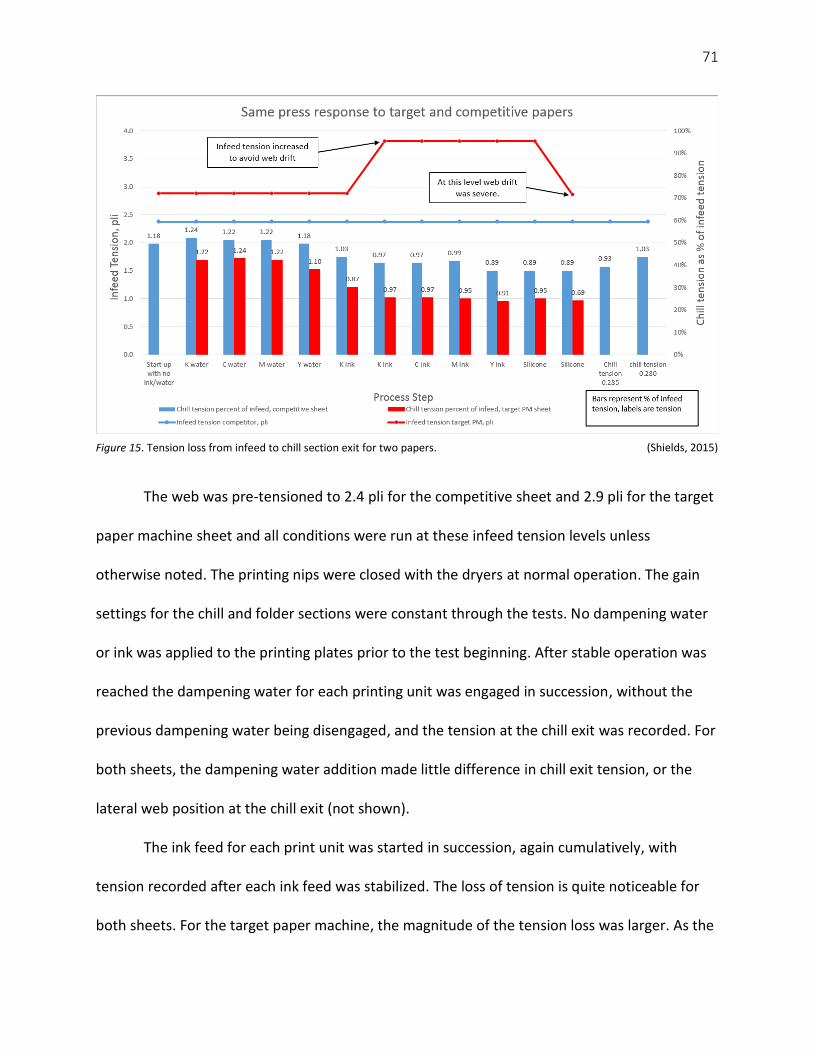
71
The web was pre-tensioned to 2.4 pli for the competitive sheet and 2.9 pli for the target
paper machine sheet and all conditions were run at these infeed tension levels unless
otherwise noted. The printing nips were closed with the dryers at normal operation. The gain
settings for the chill and folder sections were constant through the tests. No dampening water
or ink was applied to the printing plates prior to the test beginning. After stable operation was
reached the dampening water for each printing unit was engaged in succession, without the
previous dampening water being disengaged, and the tension at the chill exit was recorded. For
both sheets, the dampening water addition made little difference in chill exit tension, or the
lateral web position at the chill exit (not shown).
The ink feed for each print unit was started in succession, again cumulatively, with
tension recorded after each ink feed was stabilized. The loss of tension is quite noticeable for
both sheets. For the target paper machine, the magnitude of the tension loss was larger. As the
(Shields, 2015) Figure 15. Tension loss from infeed to chill section exit for two papers.
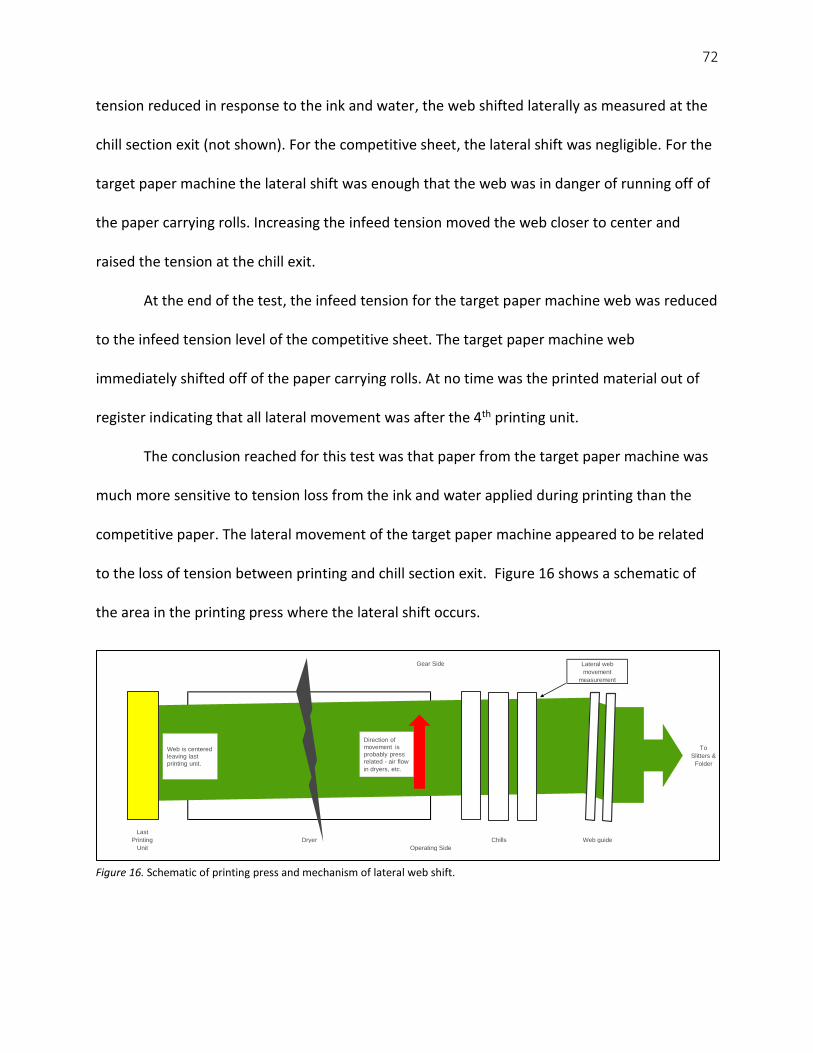
72
tension reduced in response to the ink and water, the web shifted laterally as measured at the
chill section exit (not shown). For the competitive sheet, the lateral shift was negligible. For the
target paper machine the lateral shift was enough that the web was in danger of running off of
the paper carrying rolls. Increasing the infeed tension moved the web closer to center and
raised the tension at the chill exit.
At the end of the test, the infeed tension for the target paper machine web was reduced
to the infeed tension level of the competitive sheet. The target paper machine web
immediately shifted off of the paper carrying rolls. At no time was the printed material out of
register indicating that all lateral movement was after the 4th printing unit.
The conclusion reached for this test was that paper from the target paper machine was
much more sensitive to tension loss from the ink and water applied during printing than the
competitive paper. The lateral movement of the target paper machine appeared to be related
to the loss of tension between printing and chill section exit. Figure 16 shows a schematic of
the area in the printing press where the lateral shift occurs.
Operating Side
Gear Side Lateral web
movement
measurement
Web guide
To
Slitters &
Folder
Last
Printing
Unit
Dryer Chills
Direction of movement is probably press related - air flow
in dryers, etc.
Web is centered leaving last printing unit.
Figure 16. Schematic of printing press and mechanism of lateral web shift.
73
Sensitivity to pulping methods. A second series of tests was designed to isolate paper
machine factors from pulping factors. The target paper machine and a competitive paper
machine made paper with various pulp conditions. For each paper machine three conditions
were considered. For the target paper machine sheets were made with: hardwood PGW and a
standard amount of SBK, softwood PGW and a standard amount of SBK, and softwood PGW
and an increased amount of SBK. The softwood PGW/increased SBK trial point was chosen to
observe the effect of increased fiber length, which should increase tensile stiffness (See
equation 4).
For the competitive paper machine, sheets were made with: hardwood PGW and a
standard amount of SBK, softwood PGW and a standard amount of SBK, and a combination of
hardwood and softwood PGW and a standard amount of SBK. This third trial point is the typical
method of manufacturing paper on the competitive paper machine.
The sheets were printed one after another on the target printing press using the same
printing plates. The lateral position of the web at the chill section exit was noted under normal
printing and blanket wash conditions. The results are shown in Table 4.
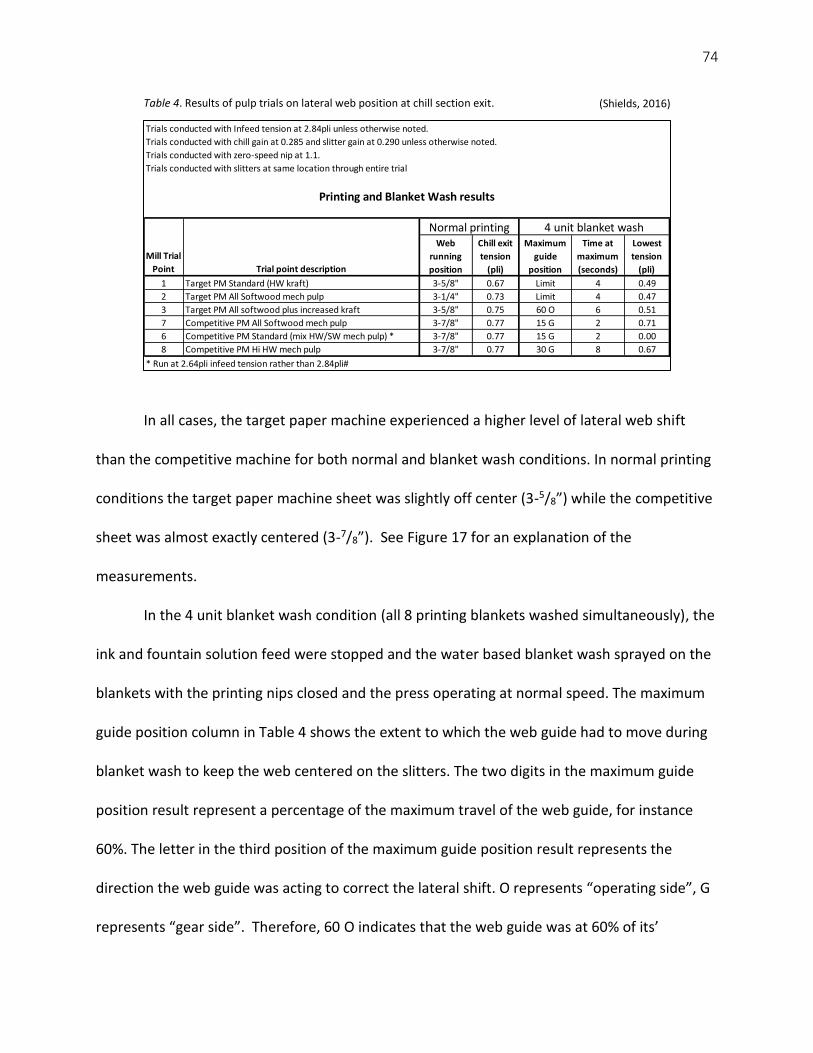
74
Table 4. Results of pulp trials on lateral web position at chill section exit.
In all cases, the target paper machine experienced a higher level of lateral web shift
than the competitive machine for both normal and blanket wash conditions. In normal printing
conditions the target paper machine sheet was slightly off center (3-5/8”) while the competitive
sheet was almost exactly centered (3-7/8”). See Figure 17 for an explanation of the
measurements.
In the 4 unit blanket wash condition (all 8 printing blankets washed simultaneously), the
ink and fountain solution feed were stopped and the water based blanket wash sprayed on the
blankets with the printing nips closed and the press operating at normal speed. The maximum
guide position column in Table 4 shows the extent to which the web guide had to move during
blanket wash to keep the web centered on the slitters. The two digits in the maximum guide
position result represent a percentage of the maximum travel of the web guide, for instance
60%. The letter in the third position of the maximum guide position result represents the
direction the web guide was acting to correct the lateral shift. O represents “operating side”, G
represents “gear side”. Therefore, 60 O indicates that the web guide was at 60% of its’
Trials conducted with Infeed tension at 2.84pli unless otherwise noted.
Trials conducted with chill gain at 0.285 and slitter gain at 0.290 unless otherwise noted.
Trials conducted with zero-speed nip at 1.1.
Trials conducted with slitters at same location through entire trial
1 Target PM Standard (HW kraft) 3-5/8" 0.67 Limit 4 0.49
2 Target PM All Softwood mech pulp 3-1/4" 0.73 Limit 4 0.47
3 Target PM All softwood plus increased kraft 3-5/8" 0.75 60 O 6 0.51
7 Competitive PM All Softwood mech pulp 3-7/8" 0.77 15 G 2 0.71
6 Competitive PM Standard (mix HW/SW mech pulp) * 3-7/8" 0.77 15 G 2 0.00
8 Competitive PM Hi HW mech pulp 3-7/8" 0.77 30 G 8 0.67
* Run at 2.64pli infeed tension rather than 2.84pli#
Mill Trial
Point Trial point description
Printing and Blanket Wash results
Normal printing 4 unit blanket washWeb
running
position
Chill exit
tension
(pli)
Maximum
guide
position
Time at
maximum
(seconds)
Lowest
tension
(pli)
(Shields, 2016)
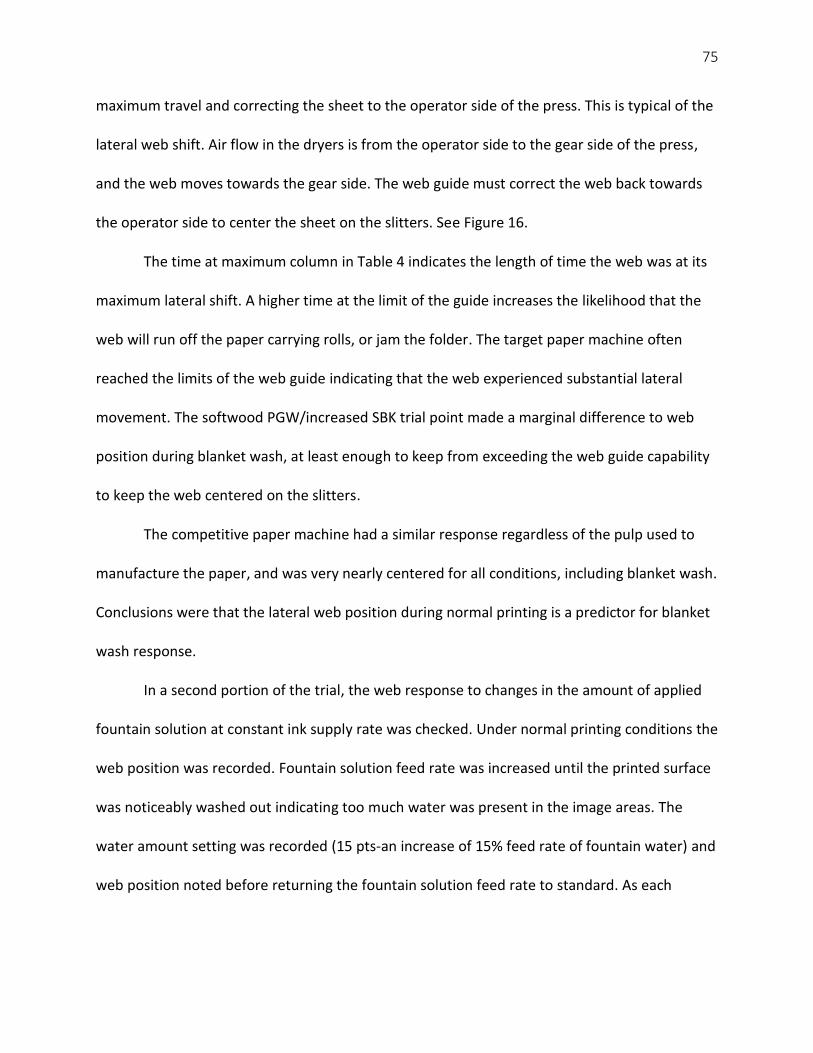
75
maximum travel and correcting the sheet to the operator side of the press. This is typical of the
lateral web shift. Air flow in the dryers is from the operator side to the gear side of the press,
and the web moves towards the gear side. The web guide must correct the web back towards
the operator side to center the sheet on the slitters. See Figure 16.
The time at maximum column in Table 4 indicates the length of time the web was at its
maximum lateral shift. A higher time at the limit of the guide increases the likelihood that the
web will run off the paper carrying rolls, or jam the folder. The target paper machine often
reached the limits of the web guide indicating that the web experienced substantial lateral
movement. The softwood PGW/increased SBK trial point made a marginal difference to web
position during blanket wash, at least enough to keep from exceeding the web guide capability
to keep the web centered on the slitters.
The competitive paper machine had a similar response regardless of the pulp used to
manufacture the paper, and was very nearly centered for all conditions, including blanket wash.
Conclusions were that the lateral web position during normal printing is a predictor for blanket
wash response.
In a second portion of the trial, the web response to changes in the amount of applied
fountain solution at constant ink supply rate was checked. Under normal printing conditions the
web position was recorded. Fountain solution feed rate was increased until the printed surface
was noticeably washed out indicating too much water was present in the image areas. The
water amount setting was recorded (15 pts-an increase of 15% feed rate of fountain water) and
web position noted before returning the fountain solution feed rate to standard. As each
76
successive trial sheet was run, the dampening water feed rate was returned to the same setting
as noted above. The results of this trial are shown in Table 5.
Increasing the fountain solution feed rate caused lateral shift on both the target and
competitive sheets. The target paper machine sheets were affected to a larger degree than the
competitive sheets. The slitter guide column in Table 5 shows the extent to which the web
guide had to move to correct the web position back to center on the slitters. The target PM was
off center at the chill exit under normal printing conditions and moved a further 1” laterally
with increased fountain solution feed. The softwood PGW/increased SBK trial point started
more centered under normal printing conditions and shifted less with increased fountain
solution feed than the softwood PGW/normal SBK condition. Neither target PM condition was
as stable as the competitive sheet, which was very close to centered at the chill exit under
normal printing conditions (with very little web guide correction needed) and only ¼” of lateral
movement with increased fountain solution feed rate.
Finally, the target paper machine web response to decreased fountain solution feed rate
was noted for one of the pulp conditions. The fountain solution feed rate was reduced until
Fountain solution feed increased 15 pts.
Flat print/loss of density on signatures
2 Target PM All Softwood mech pulp 3-1/4" 60 O 2-1/4" Limit 1"
3 Target PM All softwood plus increased kraft 3-5/8" 25 O 3" 80 O 5/8"
6 Competitive PM Standard 3-7/8" C 3-9/16" 35 O 5/16"
8 Competitive PM Hi HW mech pulp 3-7/8" C 3-5/8" 25 O 1/4"
Fountain solution feed decreased 10 pts
Scumming visible on signatures
2 Target PM All Softwood mech pulp 3-1/4" 60 O 3-1/2" 30 O -1/4"
Slitter
guide
position
Difference
in web
position
Fountain solution feed results
Mill
Trial
Point Trial point description
Web
running
position
Slitter
guide
position
Web
running
position
Normal printing Inc Water Feed
Table 5. Response of dampening solution on lateral web position for two paper machines. (Shields, 2016)
77
scumming was visible in the non-image areas indicating not enough water was present on the
printing plate. The web position was noted as shown on the lower portion of Table 5. Reducing
the fountain solution feed rate to the printing plate caused the web to move closer to center at
the chill exit, and the web guide had to make less correction to center the web on the slitters.
For sheets from both paper machines the amount of water applied affects the chill
section exit tension and lateral web position. The effect is greater on sheets from the target
paper machine with one of the conditions showing a full 1” of movement from normal to
increased dampening water amount.
The conclusions from this set of trials were that the paper machine rather than the pulp
type was responsible for the effect of water on the lateral web position, and, the effect of
additional fountain solution is similar (although not as severe) to the effect of blanket washing
on lateral web position. This second fact indicates that the water amount taken on by the web
during normal printing or blanket wash conditions is the most important printing press factor
determining later web position.
Sensitivity to apparent density profiles. Variation in apparent density in the cross
direction was considered as a possible contributor to lateral web movement. A variation across
the web could conceivably contribute to lateral movement due to: variable water absorption
rates, variable permeability, variable in plane tensile properties, etc.
Apparent density can be calculated as the apparent thickness (caliper) multiplied by the
basis weight. In Figure 17 the cross direction caliper profile and cross direction basis weight
profile of the target PM is illustrated. The horizontal lines depict the location of individual
customer rolls. The blacked out area indicates a roll that was not sent to the target pressroom.
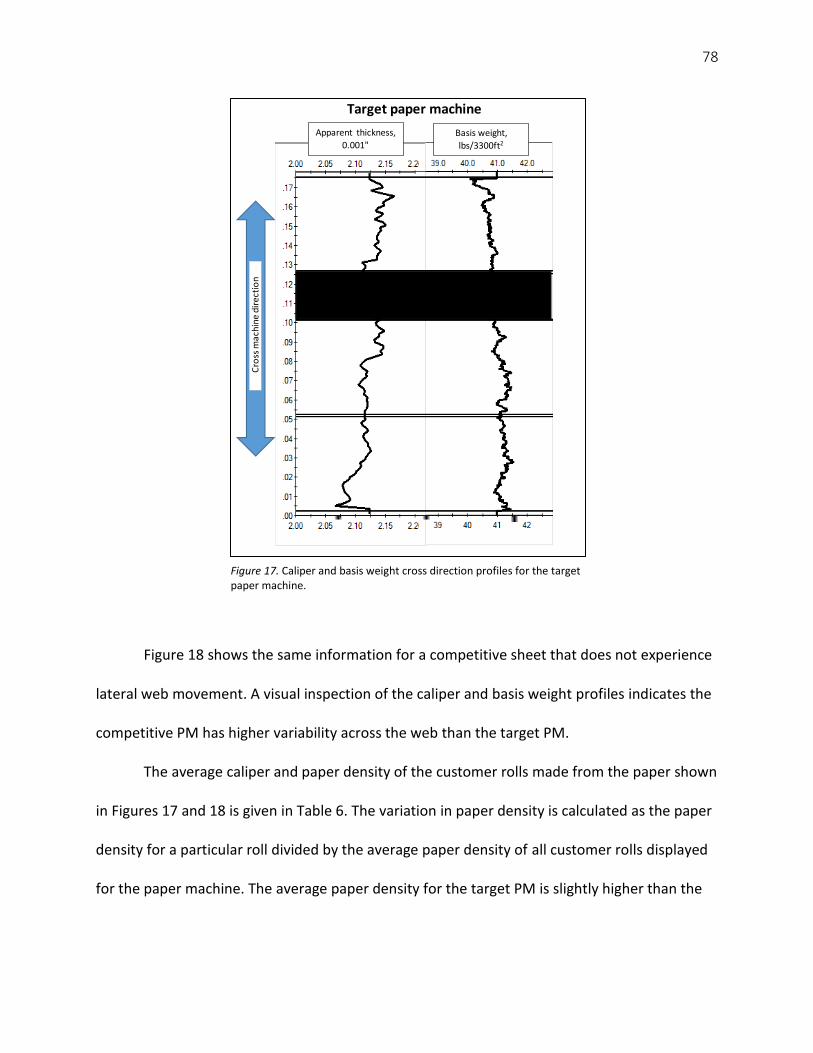
78
Figure 18 shows the same information for a competitive sheet that does not experience
lateral web movement. A visual inspection of the caliper and basis weight profiles indicates the
competitive PM has higher variability across the web than the target PM.
The average caliper and paper density of the customer rolls made from the paper shown
in Figures 17 and 18 is given in Table 6. The variation in paper density is calculated as the paper
density for a particular roll divided by the average paper density of all customer rolls displayed
for the paper machine. The average paper density for the target PM is slightly higher than the
Target paper machine
Apparent thickness,
0.001"Basis weight,
lbs/3300ft2
Cro
ss m
ach
ine
dir
ect
ion
Figure 17. Caliper and basis weight cross direction profiles for the target paper machine.
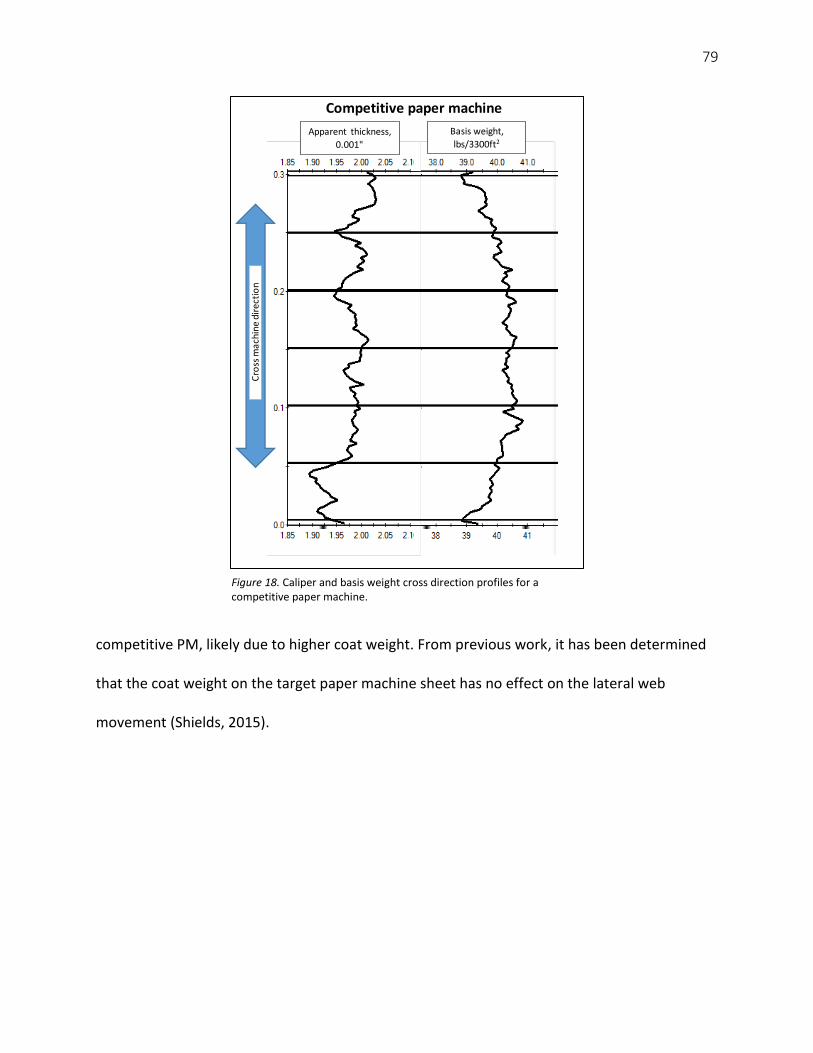
79
competitive PM, likely due to higher coat weight. From previous work, it has been determined
that the coat weight on the target paper machine sheet has no effect on the lateral web
movement (Shields, 2015).
Competitive paper machine
Cro
ss m
ach
ine
dir
ect
ion
Apparent thickness,
0.001"
Basis weight,
lbs/3300ft2
Figure 18. Caliper and basis weight cross direction profiles for a competitive paper machine.
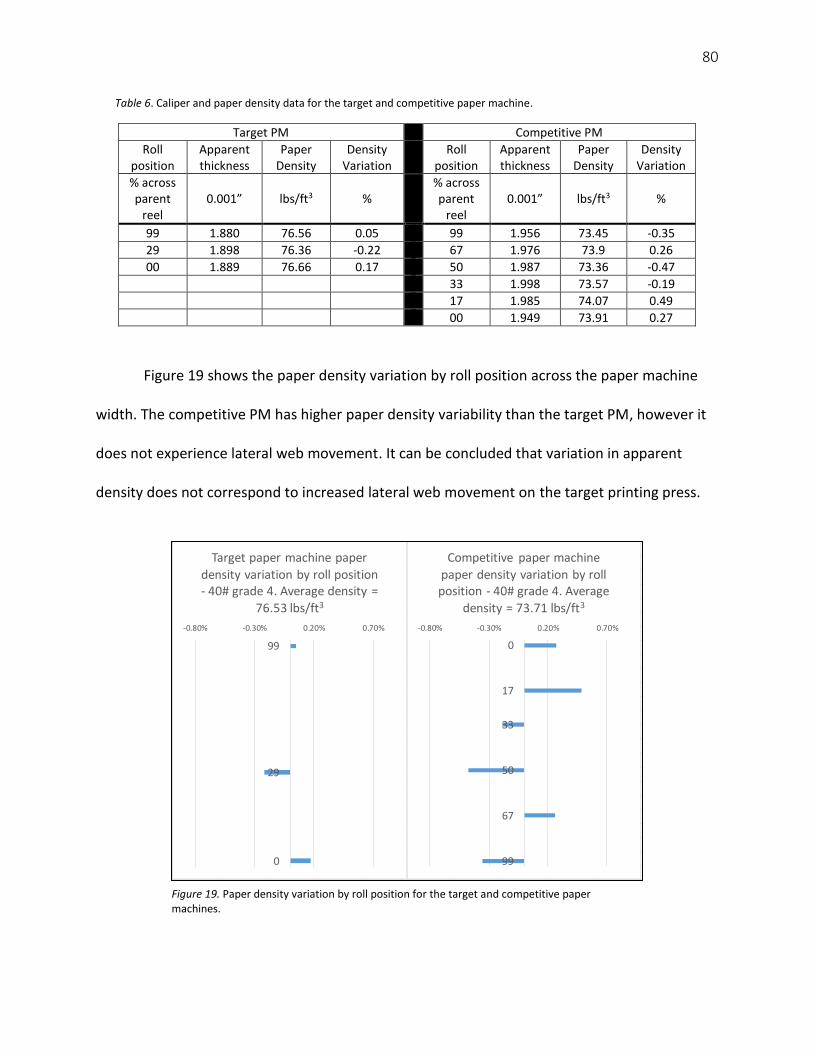
80
Table 6. Caliper and paper density data for the target and competitive paper machine.
Target PM Competitive PM
Roll position
Apparent thickness
Paper Density
Density Variation
Roll
position Apparent thickness
Paper Density
Density Variation
% across parent
reel 0.001” lbs/ft3 %
% across parent
reel 0.001” lbs/ft3 %
99 1.880 76.56 0.05 99 1.956 73.45 -0.35
29 1.898 76.36 -0.22 67 1.976 73.9 0.26
00 1.889 76.66 0.17 50 1.987 73.36 -0.47
33 1.998 73.57 -0.19
17 1.985 74.07 0.49
00 1.949 73.91 0.27
Figure 19 shows the paper density variation by roll position across the paper machine
width. The competitive PM has higher paper density variability than the target PM, however it
does not experience lateral web movement. It can be concluded that variation in apparent
density does not correspond to increased lateral web movement on the target printing press.
-0.80% -0.30% 0.20% 0.70%
0
17
33
50
67
99
Competitive paper machine
paper density variation by roll position - 40# grade 4. Average
density = 73.71 lbs/ft3
-0.80% -0.30% 0.20% 0.70%
99
29
0
Target paper machine paper
density variation by roll position - 40# grade 4. Average density =
76.53 lbs/ft3
Figure 19. Paper density variation by roll position for the target and competitive paper machines.

81
EXPERIMENTAL
Based on the hypothesis that cross directional disturbances in the dryer section act to
move the web laterally, and that the effect of those disturbances are related to the web tension
through the dryer section, and that water taken up by the paper during printing causes a
reduction in tension, a series of tests were conducted to isolate papermaking factors that affect
web tension during printing.
Printing Press Trials
Eleven trial rolls were manufactured on the target paper machine with the following
changes to standard conditions:
vary the fiber orientation through the use of edge flows on the headbox, and selecting
rolls from different positions across the paper web,
increase the strain on the web at approximately 20% moisture content,
increase the strain on the web in the dryer section between 45 – 95% moisture content,
reduce fiber orientation through reduced jet/wire ratio,
vary SBK fiber refining,
vary hardwood PGW fiber refining,
vary the wet end starch addition rate.
The target PM makes parent reels that are 175” wide. The trial rolls are 49-5/16” wide. The
rolls cut from the parent reel were taken from the front edge of the parent reel except one
center roll, where samples were taken from the standard condition. The front edge roll has
slightly different fiber orientation due to slice lip opening as shown in Figures 5 and 6.

82
The trials were printed on the target printing press and the lateral web position was
recorded as noted in Figure 20. The same printing plates and press conditions were used. A
ranking of test rolls by lateral web position was made.
Laboratory Testing
A total of 25 paper samples, including the 11 target PM trials manufactured for the printing
trials, plus 14 other paper samples, 11 of which are known to not suffer from lateral web
movement, were tested in the laboratory conditions. Not all samples were tested for each
activity, however all samples that were tested are from this lot of 25 papers.
Load-elongation response. All 25 papers were tested for machine direction load-
elongation response. The papers were measured at 50% RH, 72% RH, 82% RH and 90% RH after
paper has been allowed to acclimatize for at least 4 hours. The test device was a Lorentzen and
Wettre Tensile Tester, Code 064. The moisture content of the papers at each RH were
measured. Assuming an increase of 3 g/m2 of water during printing, the equilibrium load
Figure 20. Target printing press chill section exit.
Left-actual measurement location, Right-schematic of measurement area.
(Shields, 2016)

83
elongation curve was estimated for the printed, undried paper. TAPPI standard T 494 was
followed with the following exceptions:
Humidity was adjusted per the test conditions described above,
The test span was 100 mm,
The test sample width was 50 mm,
The rate of elongation was 25 mm/min.
Moisture content. At each relative humidity, the weights of the sample coupons were
measured. At the conclusion of testing the oven dry weight of the coupons was obtained.
Moisture content was calculated for each sample at each relative humidity.
Absorption rate. It is possible that the rate of water uptake is more important than the
total amount of water taken up by the web. Faster water absorption might mean that a higher
moisture content is reached in the time between printing and drying. To test the water uptake
rate, two tests were used.
Ultrasonic intensity. The ultrasonic absorption rate was checked for both sides of the
paper samples. The device used was the Emtec EST12 Surface and Sizing Tester. Sample testing
was done in accordance with unit operating instructions (Emtec Electronic GmbH, 2005). The
samples are tested one side at a time and the results were reported as side A and side B for
each tested paper. Analysis of the absorption rates was made according to (Gigac, Stankovska,
& Kasajova, 2011) and (Emtec Electronic GmbH, 2002). The absorption curves were plotted and
two parameters derived from the measurements were reported; t95 and USI70. The shape of
the ultrasound intensity curve tells about how the test fluid penetrates the paper sample.
Overall absorption rate was inferred from the slope of the curve. The faster the reduction in

84
ultrasound intensity, the faster the liquid penetration. The t95 factor calculated with an
isopropyl alcohol in water test liquid gives information about the pore structure of the paper
(Emtec Electronic GmbH, 2002) (Gigac, Stankovska, & Kasajova, 2011). The USI70 factor, using
water as the test fluid gives information about the surface roughness of the paper samples.
Samples were selected from a range of basis weights and coated/uncoated conditions.
Air permeability. The air permeability of all 25 papers was measured using a Technidyne
Profile Plus set up for Gurley permeability. Units for the test results are sec/100 mL. Higher
Gurley porosity results indicate lower permeability. The procedures, according to TAPPI test
method T 460 om-11, section 5.2.1, were followed. Each paper sample was tested 10 times, 5
on each side. The results reported were the average and standard deviation.
Fiber orientation. Fiber orientation was measured two ways. The ratio of machine
direction to cross machine direction tensile strength and ultrasonically.
Ultrasonic measurement. For the 11 sample papers plus sheets that are uncoated or
have the base paper of the coated sheets available, a 34 cm wide strip of paper spanning the
full width of the paper machine was measured every 18 cm. The testing device was a Kajanni
Tensile Stiffness Orientation module mounted in a Metso Paperlab paper testing station. The
following measurements were reported (definitions from (Lindblad & Furst, 2001)):
MD Angle – the angle between the machine direction of the paper and the maximum
tensile stiffness index.
TSI MD – the tensile stiffness index in the machine direction.
TSI CD – the tensile stiffness in the cross machine direction.
TSI Ratio – the ratio between TSI MD and TSI CD.
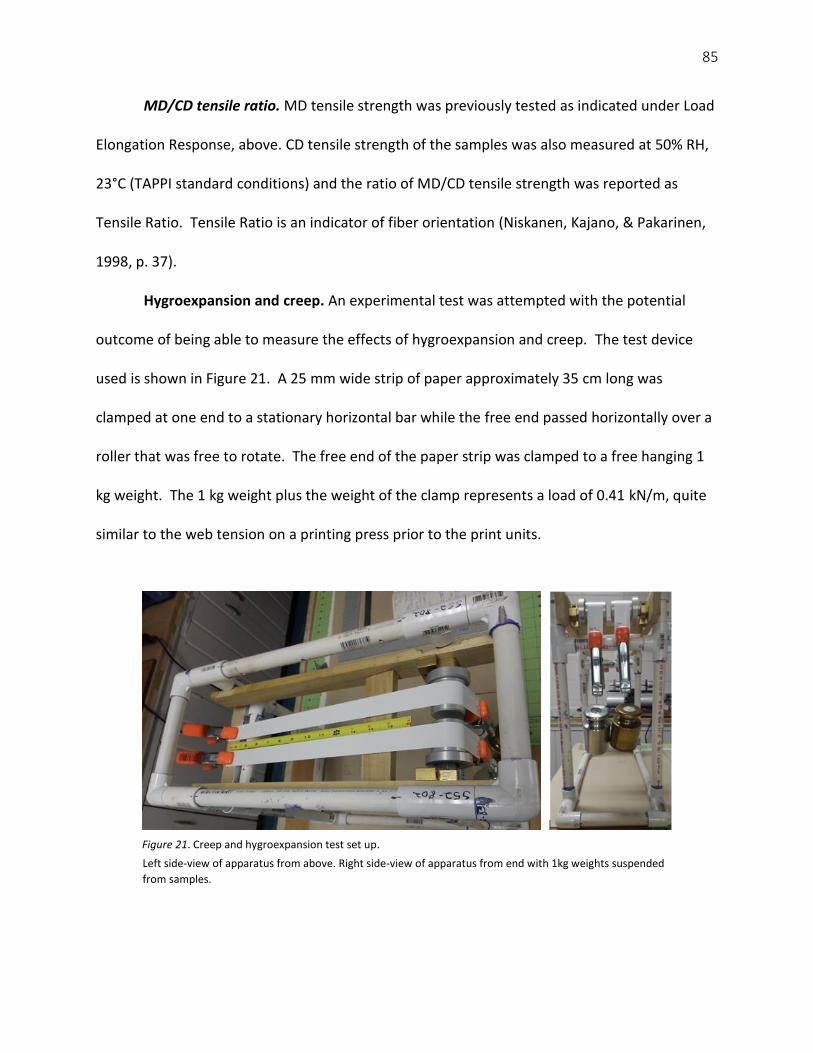
85
MD/CD tensile ratio. MD tensile strength was previously tested as indicated under Load
Elongation Response, above. CD tensile strength of the samples was also measured at 50% RH,
23°C (TAPPI standard conditions) and the ratio of MD/CD tensile strength was reported as
Tensile Ratio. Tensile Ratio is an indicator of fiber orientation (Niskanen, Kajano, & Pakarinen,
1998, p. 37).
Hygroexpansion and creep. An experimental test was attempted with the potential
outcome of being able to measure the effects of hygroexpansion and creep. The test device
used is shown in Figure 21. A 25 mm wide strip of paper approximately 35 cm long was
clamped at one end to a stationary horizontal bar while the free end passed horizontally over a
roller that was free to rotate. The free end of the paper strip was clamped to a free hanging 1
kg weight. The 1 kg weight plus the weight of the clamp represents a load of 0.41 kN/m, quite
similar to the web tension on a printing press prior to the print units.
Left side-view of apparatus from above. Right side-view of apparatus from end with 1kg weights suspended
from samples.
Figure 21. Creep and hygroexpansion test set up.

86
In a 50% RH, 23 °C environment (TAPPI conditions) the weight was attached to the strip
and a mark placed on the sample at 250 mm from the stationary bar. The sample remained
under tension for 30 seconds when the position of the mark was recorded relative to the initial
length. Thirdly, a hand held hot air dryer was used to heat and dry the sample to approximately
125 °C, similar to web temperatures used in HSWO printing. The position of the mark relative
to the original position was recorded. Lastly, the sample was allowed to cool and condition for
30 seconds back to TAPPI conditions and the mark was recorded again.
The samples and test set up were relocated to a 90% RH, 23 °C atmosphere and allowed
to acclimatize for 4 hours. In the 90% RH environment, the paper samples were re-clamped to
the horizontal bar and the 1 kg weight clamped to the free end. The initial position of the mark
was recorded relative to the original position in the 50% RH environment. The testing
procedure followed the protocol from the 50% RH environment of straining for 30 seconds,
heating to approximately 125 °C, and acclimatizing to the 90% RH environment. At each step,
the position of the mark relative to its original 50% RH environment was recorded.
The test was performed on 3 sample conditions with two tests per condition and the
average result reported. The measurement was done with a steel ruler divided into 1/32”
increments. For results not measuring exactly to 1/32”, an estimate to the nearest 1/128” was
made. The samples included the target PM, a competitive PM with similar basis weight, and a
SC grade of 45 g/m2. A schematic of the test set up is shown in Figure 22.
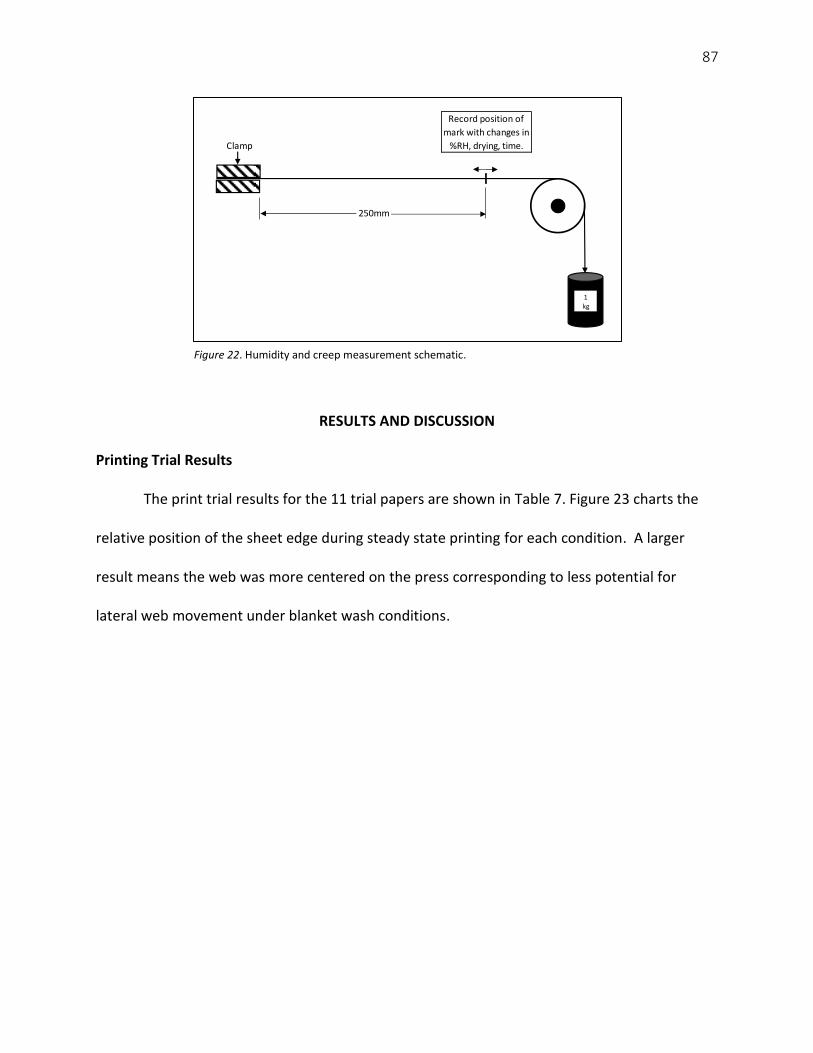
87
RESULTS AND DISCUSSION
Printing Trial Results
The print trial results for the 11 trial papers are shown in Table 7. Figure 23 charts the
relative position of the sheet edge during steady state printing for each condition. A larger
result means the web was more centered on the press corresponding to less potential for
lateral web movement under blanket wash conditions.
Clamp
250mm
Record position of
mark with changes in
%RH, drying, time.
1kg
Figure 22. Humidity and creep measurement schematic.

88
Table 7. Print trial results for target paper machine conditions.
Infeed
Tension
Lateral Web
position at chill
section exit
Press
Speed Chill Gain
Folder
Gain
pli1/32" above 3" fpm % %
1Standard Front Edge
Roll2.96 12 1584 0.325 0.295
2
Standard Center Roll,
increased fiber
orientation
4.00 18 1559 0.32 0.295
3
Edge Flow Closed,
increased fiber
orientation
2.58 31 1641 0.325 0.295
4Increased Strain at
20% Solids2.47 22 1574 0.325 0.295
5
Reduced J/W Ratio,
decreased fiber
orientation
2.84 8 1625 0.325 0.295
6 SBK Refining Increased 2.47 14 1574 0.325 0.295
7SBK Refining
Decreased2.92 12 1584 0.325 0.295
8 Zero PGW Refining 2.84 10 1574 0.325 0.295
9 Lower Wet End Starch 3.91 14 1559 0.32 0.295
10 Higher Wet End Starch 2.92 14 1559 0.325 0.295
11Reduced Strain at 90%
Solids2.66 16 1574 0.325 0.295
Trial Condition

89
One condition performed very well (Edge Flow Closed) running almost centered in the
press during normal printing operations. One condition performed quite poorly (J/W reduced to
-50 fpm) running significantly off center. One condition was marginally better than the Standard
Front Edge roll; Increased Strain at 20% solids. All other conditions were about equal to the
Standard Front Edge Roll.
According to the print trial results, the conditions with higher expected fiber orientation
performed quite well, while the condition with the lowest expected fiber orientation performed
poorly. The Increased Strain at 20% Solids condition performed marginally better than
Figure 23. Print trial results for target paper machine conditions.
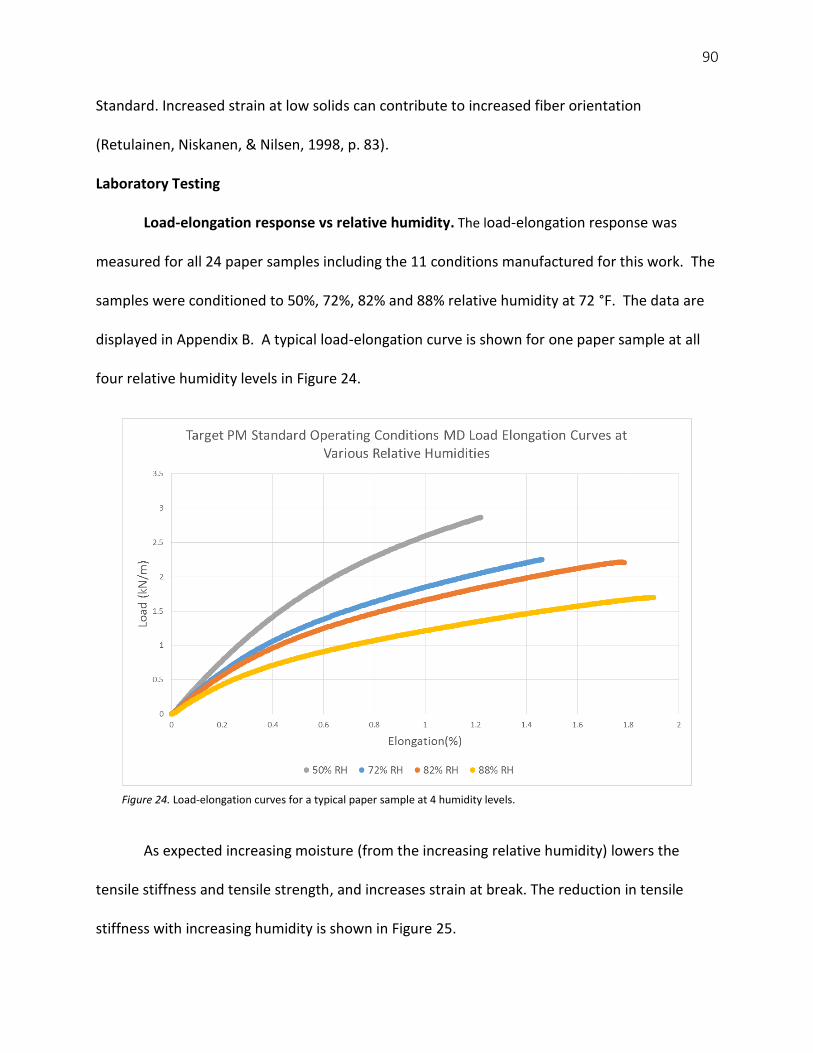
90
Standard. Increased strain at low solids can contribute to increased fiber orientation
(Retulainen, Niskanen, & Nilsen, 1998, p. 83).
Laboratory Testing
Load-elongation response vs relative humidity. The load-elongation response was
measured for all 24 paper samples including the 11 conditions manufactured for this work. The
samples were conditioned to 50%, 72%, 82% and 88% relative humidity at 72 °F. The data are
displayed in Appendix B. A typical load-elongation curve is shown for one paper sample at all
four relative humidity levels in Figure 24.
As expected increasing moisture (from the increasing relative humidity) lowers the
tensile stiffness and tensile strength, and increases strain at break. The reduction in tensile
stiffness with increasing humidity is shown in Figure 25.
Figure 24. Load-elongation curves for a typical paper sample at 4 humidity levels.
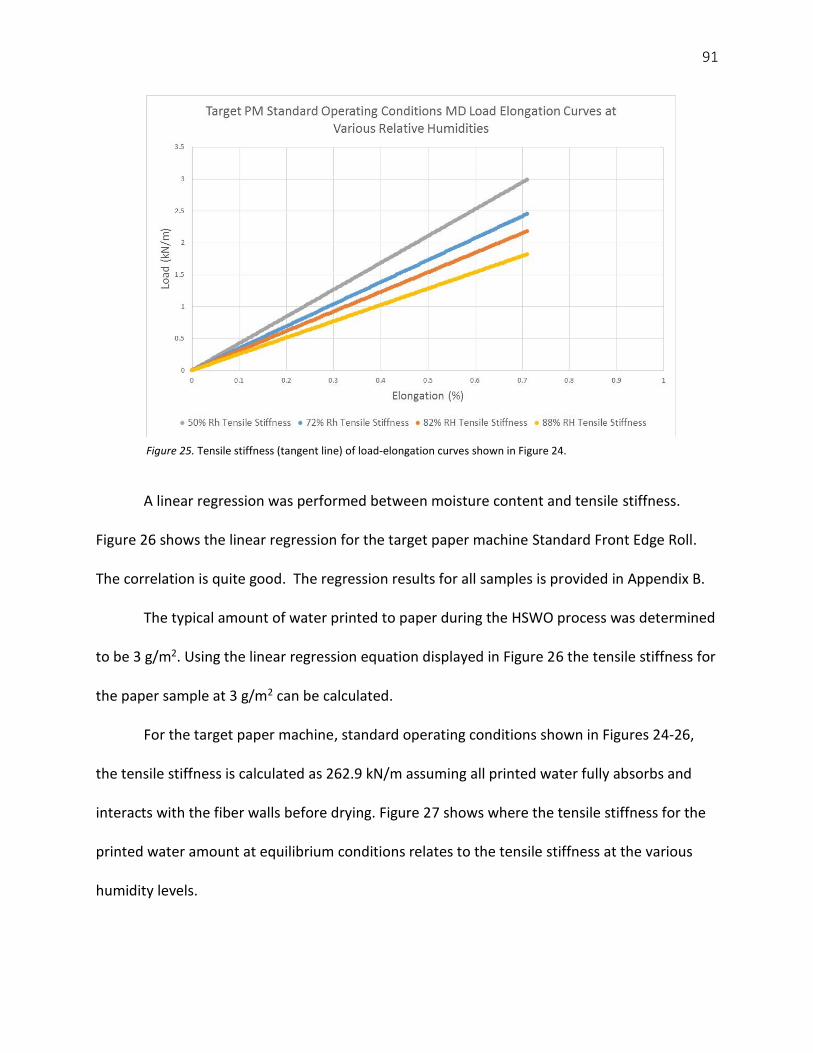
91
A linear regression was performed between moisture content and tensile stiffness.
Figure 26 shows the linear regression for the target paper machine Standard Front Edge Roll.
The correlation is quite good. The regression results for all samples is provided in Appendix B.
The typical amount of water printed to paper during the HSWO process was determined
to be 3 g/m2. Using the linear regression equation displayed in Figure 26 the tensile stiffness for
the paper sample at 3 g/m2 can be calculated.
For the target paper machine, standard operating conditions shown in Figures 24-26,
the tensile stiffness is calculated as 262.9 kN/m assuming all printed water fully absorbs and
interacts with the fiber walls before drying. Figure 27 shows where the tensile stiffness for the
printed water amount at equilibrium conditions relates to the tensile stiffness at the various
humidity levels.
Figure 25. Tensile stiffness (tangent line) of load-elongation curves shown in Figure 24.

92
As shown in the literature review, for a constant strain the tensile stiffness dictates the
web tension over a span. Therefore, a higher tensile stiffness results in a higher web tension
and should result in lower lateral movement of the web between the last printing unit and the
chill section.
Figure 26. Linear regression for tensile stiffness vs paper moisture content for sample in Figure 24.
Figure 27. Tensile stiffness at printed moisture for paper sample shown in Figure 24.
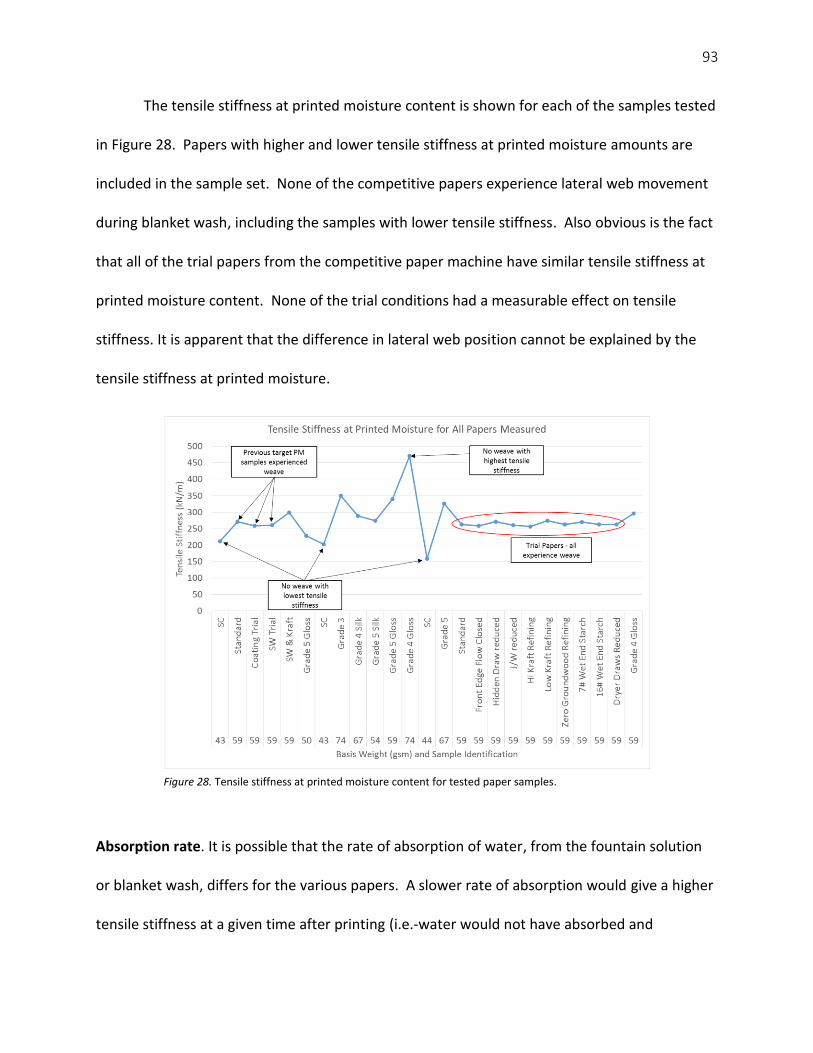
93
The tensile stiffness at printed moisture content is shown for each of the samples tested
in Figure 28. Papers with higher and lower tensile stiffness at printed moisture amounts are
included in the sample set. None of the competitive papers experience lateral web movement
during blanket wash, including the samples with lower tensile stiffness. Also obvious is the fact
that all of the trial papers from the competitive paper machine have similar tensile stiffness at
printed moisture content. None of the trial conditions had a measurable effect on tensile
stiffness. It is apparent that the difference in lateral web position cannot be explained by the
tensile stiffness at printed moisture.
Absorption rate. It is possible that the rate of absorption of water, from the fountain solution
or blanket wash, differs for the various papers. A slower rate of absorption would give a higher
tensile stiffness at a given time after printing (i.e.-water would not have absorbed and
Figure 28. Tensile stiffness at printed moisture content for tested paper samples.
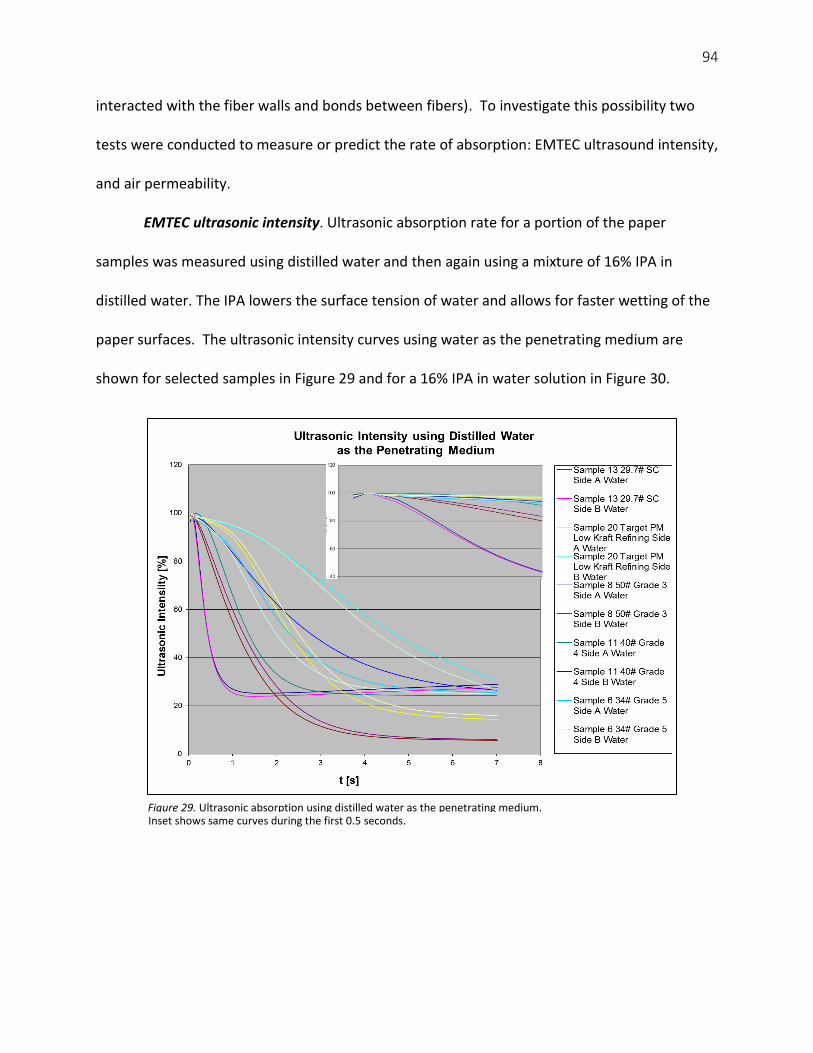
94
interacted with the fiber walls and bonds between fibers). To investigate this possibility two
tests were conducted to measure or predict the rate of absorption: EMTEC ultrasound intensity,
and air permeability.
EMTEC ultrasonic intensity. Ultrasonic absorption rate for a portion of the paper
samples was measured using distilled water and then again using a mixture of 16% IPA in
distilled water. The IPA lowers the surface tension of water and allows for faster wetting of the
paper surfaces. The ultrasonic intensity curves using water as the penetrating medium are
shown for selected samples in Figure 29 and for a 16% IPA in water solution in Figure 30.
Inset shows same curves during the first 0.5 seconds. Figure 29. Ultrasonic absorption using distilled water as the penetrating medium.

95
The Emtec device functions by sending a 2 MHz signal through the penetrating liquid and
paper samples. A portion of the transmitted signal is reflected by liquid/paper interface. A
portion of the signal is scattered by air trapped in the paper structure or on the surface during
the absorption process. And, as the liquid comes in contact with the fiber, the elastic properties
of the fiber change (Emtec Electronic GmbH, 2002). The percentage of the initial ultrasonic
signal reaching the receiver is known as the ultrasonic intensity. The shape of the ultrasonic
absorption curves contains information about the rate that the penetrating liquid is able to sorb
into the paper structure and some information about the paper surface characteristics and
pores.
Figure 30. Ultrasonic absorption using 16% IPA in water as the penetrating liquid.

96
Four factors mainly influence the ultrasonic intensity measured by the device (Emtec
Electronic GmbH, 2002).
Increasing ultrasonic intensity passing through to the receiver, due to decreasing
reflection on the liquid/paper interface.
Decreasing ultrasonic intensity passing through to the receiver, due to scattering from
air that is trapped on the paper surface and in the paper structure.
Increasing ultrasonic intensity passing through to the receiver, due to the pores and
capillaries filling with the penetrating liquid (less air to scatter the signal)
Decreasing ultrasonic intensity passing through to the receiver, due to decreasing
elasticity of the fibers as paper is moistened.
According to Gigac, et al. the decrease of ultrasonic intensity is governed mainly by a
decrease in the elasticity of the swelled fibers, and air being pressed into the largest pores of
the paper structure. (Gigac, Stankovska, & Kasajova, 2011). In Figure 29, the SC sheet results are
the two leftmost curves, one for side A and one for side B. This indicates that the SC sheets, and
not the target paper machine samples, saturate with water fastest. If water absorption rate
were the driving force to lateral web movement, the target paper machine samples should
show the fastest reduction in ultrasonic intensity.
For the IPA/water solution Gigac, et al. found that the liquid displaced air from the pores
and penetrated the uncoated papers immediately. Air was more slowly displaced from coated
papers, due to the higher amount of fine pores in the coating on the paper surface. Figure 30
shows that again, the SC sheets had a faster decrease in ultrasonic intensity than the coated
sheets.
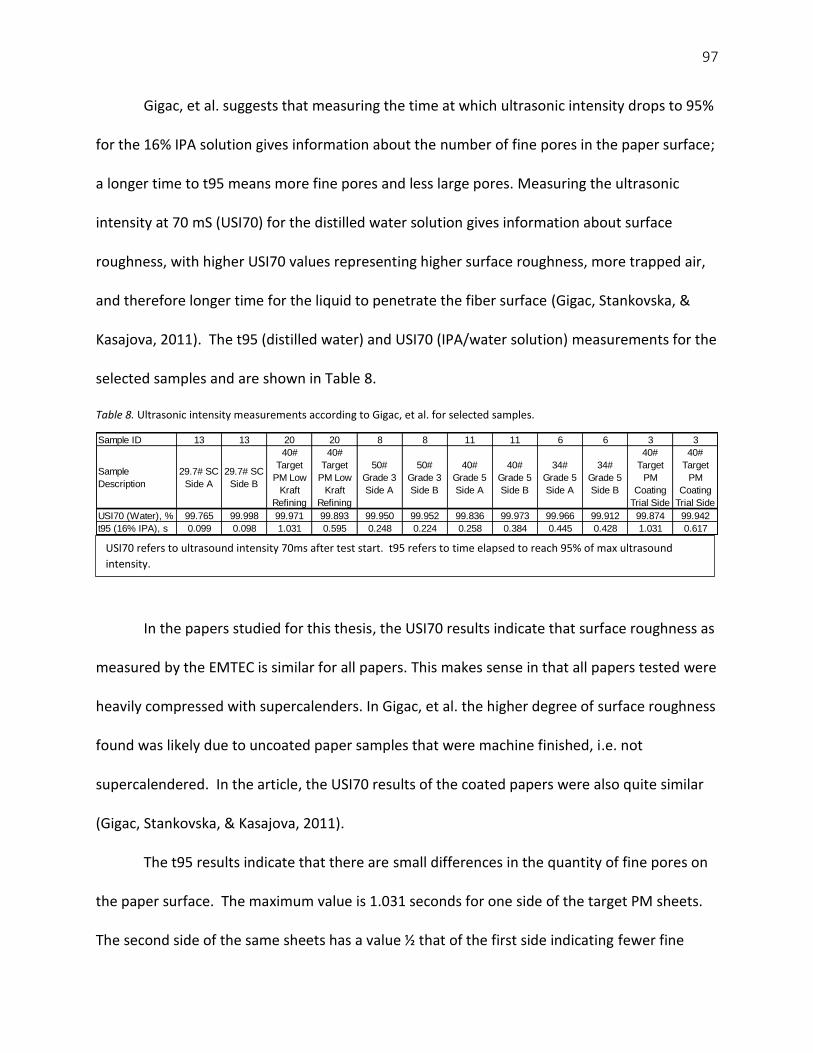
97
Gigac, et al. suggests that measuring the time at which ultrasonic intensity drops to 95%
for the 16% IPA solution gives information about the number of fine pores in the paper surface;
a longer time to t95 means more fine pores and less large pores. Measuring the ultrasonic
intensity at 70 mS (USI70) for the distilled water solution gives information about surface
roughness, with higher USI70 values representing higher surface roughness, more trapped air,
and therefore longer time for the liquid to penetrate the fiber surface (Gigac, Stankovska, &
Kasajova, 2011). The t95 (distilled water) and USI70 (IPA/water solution) measurements for the
selected samples and are shown in Table 8.
Table 8. Ultrasonic intensity measurements according to Gigac, et al. for selected samples.
In the papers studied for this thesis, the USI70 results indicate that surface roughness as
measured by the EMTEC is similar for all papers. This makes sense in that all papers tested were
heavily compressed with supercalenders. In Gigac, et al. the higher degree of surface roughness
found was likely due to uncoated paper samples that were machine finished, i.e. not
supercalendered. In the article, the USI70 results of the coated papers were also quite similar
(Gigac, Stankovska, & Kasajova, 2011).
The t95 results indicate that there are small differences in the quantity of fine pores on
the paper surface. The maximum value is 1.031 seconds for one side of the target PM sheets.
The second side of the same sheets has a value ½ that of the first side indicating fewer fine
USI70 refers to ultrasound intensity 70ms after test start. t95 refers to time elapsed to reach 95% of max ultrasound
intensity.
Sample ID 13 13 20 20 8 8 11 11 6 6 3 3
Sample
Description
29.7# SC
Side A
29.7# SC
Side B
40#
Target
PM Low
Kraft
Refining
40#
Target
PM Low
Kraft
Refining
50#
Grade 3
Side A
50#
Grade 3
Side B
40#
Grade 5
Side A
40#
Grade 5
Side B
34#
Grade 5
Side A
34#
Grade 5
Side B
40#
Target
PM
Coating
Trial Side
40#
Target
PM
Coating
Trial Side
USI70 (Water), % 99.765 99.998 99.971 99.893 99.950 99.952 99.836 99.973 99.966 99.912 99.874 99.942
t95 (16% IPA), s 0.099 0.098 1.031 0.595 0.248 0.224 0.258 0.384 0.445 0.428 1.031 0.617
98
pores and more larger pores. This make some sense as the target paper machine is a
Fourdrinier machine with one side having a more closed surface than the other. Coating
holdout and therefore fine pore concentration is likely to be higher on one side than the other.
The grade 3 sample had t95 values of 0.224 and 0.258 on the two sides indicating fewer fine
pores than the target PM sheet. This could be possible depending on the pigments used in the
coatings. Different pigments give different pore size distribution. In (Gigac, Stankovska, &
Kasajova, 2011), the t95 test results ranged from a minimum of 50 ms for uncoated sheets to
14.8 seconds. In the results of this work the range of measurement for t95 was 98 ms to 1.031
seconds, not nearly the large range that Gigac was working with. The uncoated papers that
were tested by Gigac are not specified as to what calendaring treatment they were subjected to
and it is possible no supercalendered sheets were tested. Kettle, et al. found that for
supercalendered papers large size pores dominated absorption rate in short times (<1 s) but
smaller pores dominated at longer times (Kettle, Matthews, Ridgway, & Wagberg, 1997).
Supercalendering reduced large pores so that mostly small pores remained. In the papers
under test in this work all have been supercalendered, either with or without coating, and it is
evident that large pores are not a major contributor to absorption rate as measured by Emtec.
One issue with relating the Emtec results to printing results may be that, with the Emtec
test, the paper sample and test liquid are under low pressure, whereas in printing the paper
and water is subjected to a high pressure pulse as it passes through the printing nip. In any
event, the ultrasonic intensity measurement did not discern a difference between the papers
for predicting lateral web movement.
99
Air permeability. Gurley air permeability of the samples was measured and the average
results are plotted in Figure 31. The average and standard deviation test results are contained
in Appendix B. Higher permeability (lower Gurley test results) should represent faster
penetration time (Kettle, Matthews, Ridgway, & Wagberg, 1997) and therefore more contact
with fibers leading to lower web tension. The lowest Gurley permeability sheets are the SC
sheets. These are the lightest basis weight papers and therefore have the lowest resistance to
air flow. SC sheets are typically made with a high proportion of mechanical pulp, which is stiffer
than chemical pulp. The resulting sheets are therefore stiffer and bulkier. These two factors are
likely reasons for the low Gurley permeability results. The papers with the highest results are
those of the target paper machine. These papers contain a high proportion of coat weight and
are heavily calendered forming a dense sheet. While the proportion of mechanical pulp is still
significant for these papers, the coating and supercalendering are dominating factors. Most
other samples range in the 1000-3000 s/100 mL range. These papers range from heavier weight
high kraft containing sheets with high levels of calcium carbonate in the coating to grade 5
papers with high proportions of mechanical pulp. It is unclear exactly how these papers are
made, however they come mainly from mills with integrated SBK mills and it is possible that the
base paper portion of the sheet is quite open due to low fines content or lower sheet
consolidation during paper formation or calendering.
While there are differences in air permeability, the papers showing highest air
permeability (lowest Gurley permeability results) do not experience web movement. These are
the SC sheets. In fact, the papers with the lowest permeability are the target paper machine.
Two competitive sheets test in the same permeability range as the target PM and they do not

100
experience lateral web movement on press. It appears that lateral web movement on the
target PM cannot be predicted by Gurley permeability. It is also apparent that the air
permeability results do not correspond with the Emtec results. While the SC sheets have the
lowest Gurley permeability results and the fastest absorption rate, the target PM has the
second fastest absorption rate according to Emtec but the highest Gurley porosity results.
Fiber orientation
MD/CD tensile ratio. A plot of tensile ratio for the available papers is shown in Figure
32. Only SC sheets or samples for which base paper from coated sheets was available were
measured. What is immediately evident is that the trial papers, both from this round of testing
Figure 31. Gurley permeability results.

101
and previous samples for which base paper was available, have the lowest tensile ratio. All trial
papers had some degree of weave whereas none of the competitive sheets, coated or
uncoated, had any degree of weave.
Fiber orientation is largely governed by the j/w ratio, and the degree to which the initial
alignment produced as the fibers touch the forming fabric can be captured. In gap forming
paper machines the stock jet is trapped between the two forming fabrics almost immediately
and the fibers are not free to move relative to each other. In this way, the orientation of the
sheet can be controlled. In Fourdrinier paper machines the stock jet is not trapped between
forming fabrics. The fiber mat is purposely agitated on the forming table to aid in dewatering. It
is quite difficult to attain high levels of fiber orientation on Fourdrinier paper machines.
Figure 32. Fiber orientation as measured by tensile ratio.

102
Ultrasonic measurement. Samples for which cross machine direction strips were
available were measured for fiber orientation properties using ultrasonic measurement
techniques. This included the 11 target paper machine trial samples plus one competitive sheet.
The MD Angle, TSI CD, TSI MD and TSI Ratio are listed for all rolls in Appendix C. Charts showing
the profiles and roll positions are listed as well. In Figure 33 the target PM standard Front Edge
Roll and competitive coated sheet for TSI Ratio, TSI MD and MD Angle are shown.
The black boxes on the TSI ratio charts indicate the locations of the rolls used for the trials. As
with the MD/CD tensile strength ratio, the TSI ratio of the competitive sheet is substantially
higher than the target PM. The TSI MD values are slightly higher for the target PM than the
competitive PM indicating that at equivalent basis weight the target PM would have a slightly
higher tensile stiffness than the competitive sheet. It was found earlier in this section that
tensile stiffness is not an indicator of lateral web movement performance.
The chart of MD angle shows that across the paper machine there is less variation in the
target paper machine than on the competitive PM. An increase in MD angle has the effect of
changing the fiber orientation and therefore the tensile ratio. The higher deviation near the
edges on the competitive PM TSI ratio illustrates this point. The summary of all rolls is displayed
in Table 9.
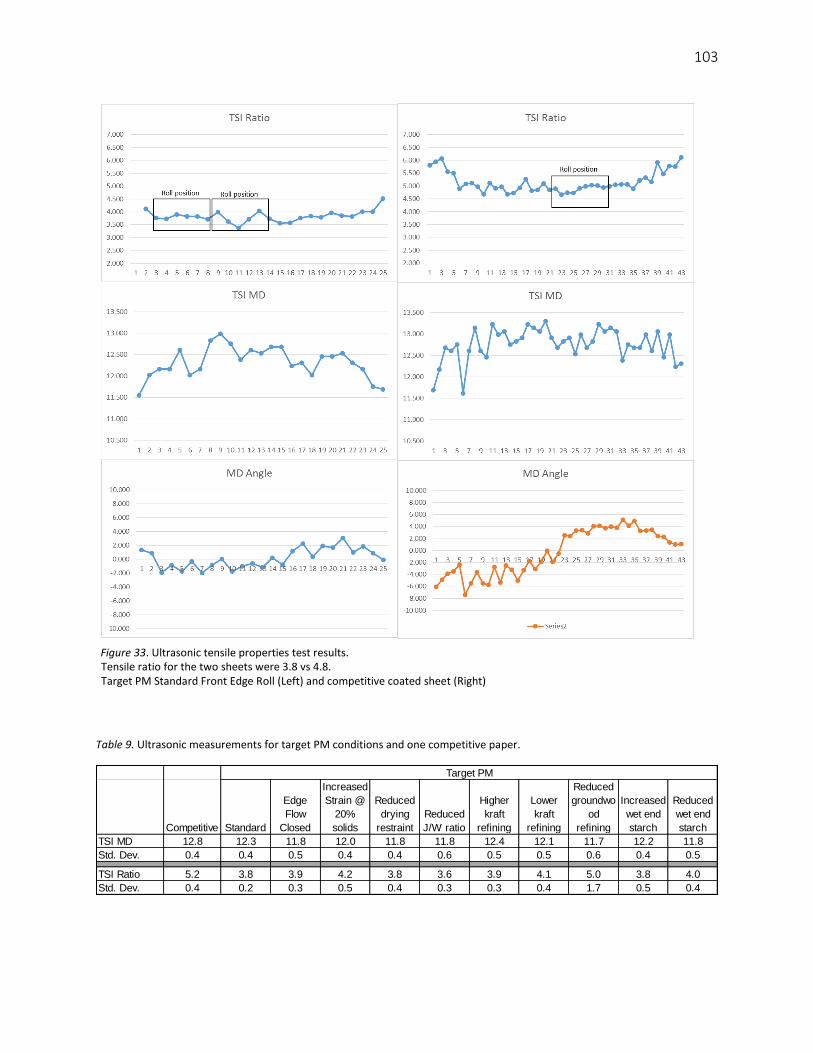
103
Table 9. Ultrasonic measurements for target PM conditions and one competitive paper.
Competitive Standard
Edge
Flow
Closed
Increased
Strain @
20%
solids
Reduced
drying
restraint
Reduced
J/W ratio
Higher
kraft
refining
Lower
kraft
refining
Reduced
groundwo
od
refining
Increased
wet end
starch
Reduced
wet end
starch
TSI MD 12.8 12.3 11.8 12.0 11.8 11.8 12.4 12.1 11.7 12.2 11.8
Std. Dev. 0.4 0.4 0.5 0.4 0.4 0.6 0.5 0.5 0.6 0.4 0.5
TSI Ratio 5.2 3.8 3.9 4.2 3.8 3.6 3.9 4.1 5.0 3.8 4.0
Std. Dev. 0.4 0.2 0.3 0.5 0.4 0.3 0.3 0.4 1.7 0.5 0.4
Target PM
Tensile ratio for the two sheets were 3.8 vs 4.8. Target PM Standard Front Edge Roll (Left) and competitive coated sheet (Right)
Figure 33. Ultrasonic tensile properties test results.

104
Note that the TSI ratio is lower than the competitive paper machine for all target PM
trial points except one. For the reduced groundwood refining test the chart of TSI MD (see
Appendix C) shows quite a bit of variability in the cross machine direction. This trial point was
made in succession with the other conditions that did not have this variation or magnitude.
This measurement result is considered invalid.
From the print testing results, the reduced J/W ratio performed poorly. In Table 9 the
measurement for TSI ratio is the lowest of any sample tested at 3.6. The two samples that
tested highest for the target PM were the Increased Strain at 20% Solids and the Edge Flow
Closed sample. The average results for the CD strip do not show the reason for the improved
printing result. The tensile ratio of the area that the roll was cut from does show a possible
tendency towards higher TSI ratio. In both cases the area of the roll tended towards a ratio of
4.5.
The only item of interest from these results with respect to the lateral movement
performance appears to be TSI ratio, which although the magnitude of the result is higher, is
similar to that found using the ratio of MD to CD tensile strength. Tensile ratio appears to be of
significance in determining reasons for weave on the target PM.
Creep and hydroexpansion. Three samples were selected representing the target PM, a
competitive PM at the same basis weight, and a light weight SC paper. The competitive PM and
SC sheets are known to have no lateral movement on press. These samples represent a spread
of basis weights as well as a comparison between coated and uncoated papers. The results of
the creep and hygroexpansion testing is plotted in Figure 34.

105
For the 50% RH tests, no discernable creep occurred after the initial loading of the
samples. Over 30 seconds, all three samples were stable at the reference length. Upon heating,
all three samples contracted, with the target PM contracting most. Upon cooling and regaining
moisture from the ambient conditions, all three samples recovered their original length while
still under load. These results indicate that no plastic deformation is occurring over the test
duration at 50% RH, i.e. no creep occurs. The samples contract upon heating as the fibers give
up moisture and shrink. The difference in the magnitude of shrinkage can be explained by the
fiber orientation. Fibers shrink laterally. Papers that have higher fiber orientation in the
measured direction will shrink less than papers with lower fiber orientation. The competitive
coated sheet and the SC sheet have similar MD/CD tensile ratio results at 3.7 & 3.5 versus 2.4
for the target PM.
For the 90% RH testing, all samples measured longer after initial application of load than they
were at 50% RH. All samples also increased length after remaining under tension for 30
seconds. The competitive coated PM and light weight SC sheet regained their original 90% RH
length on heating while the target PM did not.
The hygroscopic nature of wood fiber means that paper will absorb water. From 50%
RH to 90% RH, the samples rise in moisture content approximately equal to that gained from
printing 3 g/m2 of water. In fact, the SC sheet gains more than the printed water amount.
The increased moisture of the samples at 90% RH swells the fibers and increases the sample
lengths. Analogous to the drying shrinkage, papers with higher fiber orientation in the
measured direction will grow less than less oriented papers. The higher fiber orientation of the
competitive coated and SC sheets results in less growth due to hygroexpansion.
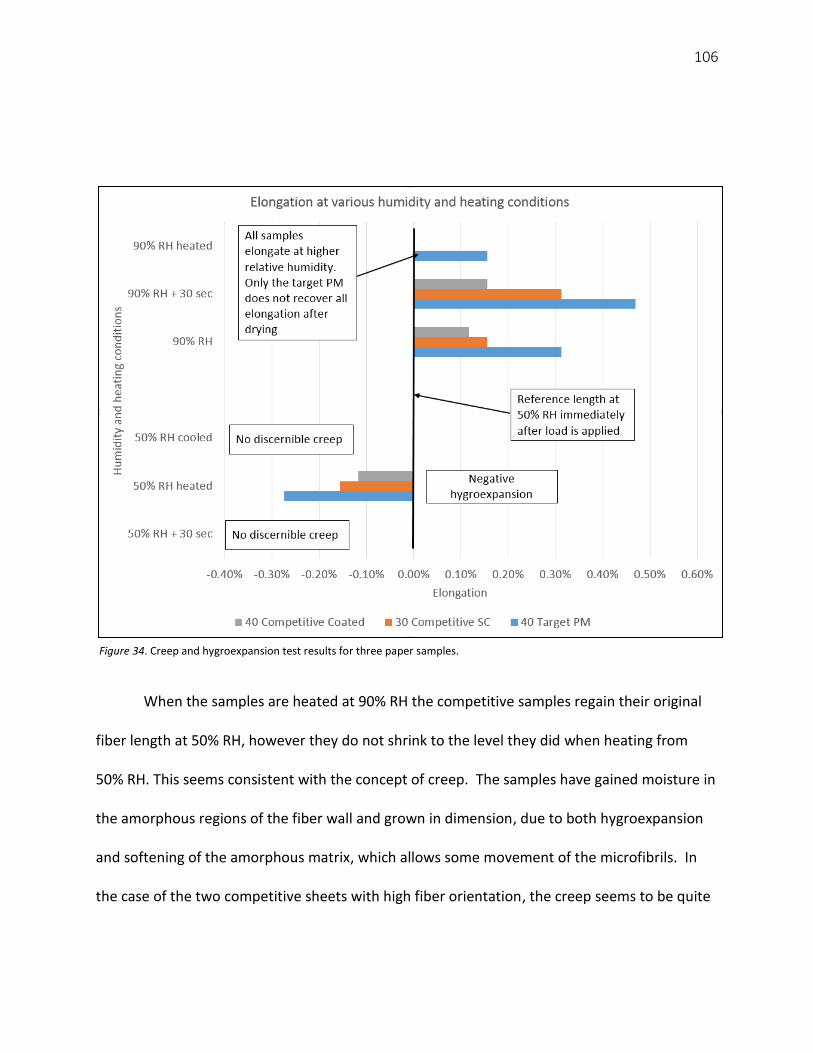
106
When the samples are heated at 90% RH the competitive samples regain their original
fiber length at 50% RH, however they do not shrink to the level they did when heating from
50% RH. This seems consistent with the concept of creep. The samples have gained moisture in
the amorphous regions of the fiber wall and grown in dimension, due to both hygroexpansion
and softening of the amorphous matrix, which allows some movement of the microfibrils. In
the case of the two competitive sheets with high fiber orientation, the creep seems to be quite
Figure 34. Creep and hygroexpansion test results for three paper samples.

107
small; just the difference between 0.1% and 0.15% respectively for the competitive coated and
SC sheets.
For the target PM, the elongation remaining after heating from 90% RH is significantly
higher than that for the competitive sheets. The target PM has less fibrillar reinforcement in
the applied load direction than the competitive sheets, due to the lower fiber orientation. The
amorphous matrix will soften a similar amount as the competitive sheets, however more
movement of fiber walls should be possible due to the lower microfibrillar reinforcement. It
seems most likely that the mechanism allowing the extra creep on the target PM is the lower
fiber orientation yielding lower reinforcement in the loading direction, while the amorphous
components are soft. The additional creep is estimated at 0.4%, the difference between the
strains at 90% RH heated and 50% RH heated results.
CONCLUSIONS
The purpose of the work was to determine the papermaking factors affecting the lateral web
movement on a HSWO printing press. The lateral web movement on the target printing press is
caused by lateral forces in the drying section. The target paper machine experiences more
lateral movement than other papers, most likely due to lower web tension between the last
printing unit and the chill section of the printing press, that is, through the drying section. The
lateral forces in the dryer have more effect on webs with lower web tension.
The expectation was that water addition from printing reduces tensile stiffness of the
paper. The target paper machine is a Fourdrinier sheet and was expected to absorb water very
quickly, at least on one side. The fast absorption rate was expected to cause a larger reduction

108
in tensile stiffness, in the time between printing and drying, for the target PM than for other
papers.
Absorption rate testing showed that SC papers absorb water faster than the target PM,
yet suffer no lateral movement during printing. Air permeability testing showed that the target
PM is quite resistant to air movement through the sheet, a fact that should limit the absorption
rate.
What was found was that the reason for lower web tension in the target paper machine
web is most likely due to lower fiber orientation. Fibers oriented in the direction of stress have
reinforcement from the cellulose microfibrils. During printing the matrix softens to some
degree due to the addition of water. The stiff microfibrils serve to reinforce the matrix and
prevent movement. Fibers oriented in the cross direction do not have this reinforcement.
Therefore, a less oriented sheet has less reinforcement from the microfibrils and is more
susceptible to movement of the matrix. The movement of the matrix appears as creep or stress
relaxation. An experimental test clearly showed that the target PM experiences more plastic
creep deformation, especially at higher moisture content than other sheets.
FUTURE WORK
To study the effect of web tension on the lateral movement of paper, a portable device that
could measure web tension in the span between the printing units and the chill section would
be beneficial. Devices exist that use differential air pressure over a measuring orifice to
measure cross machine direction tension profiles. These devices are expensive and difficult to
calibrate. Another approach would be to use a weight of known horizontal cross sectional area
with an air curtain applied. The air curtain would keep the weight from contacting the web.

109
The weight could be housed in a cage mounted over the running web to keep it stationary. The
weight will deform the sheet locally and the depth of the deformation will be proportional to
the web tension. Calibration would be simplified in that webs with known tension could be
stretched under the device out of the printing machine and the penetration depth measured.
Checking webs with tension above and below the expected running tension on press would give
sufficient range that measurements on press could be interpolated.
To study the hygroexpansion and creep behavior with the experimental test apparatus more
closely, a method of heating the entire span of the test strip during the drying phase would be
beneficial. This would eliminate the effect of the high relative humidity re-softening the sample
during measurement.
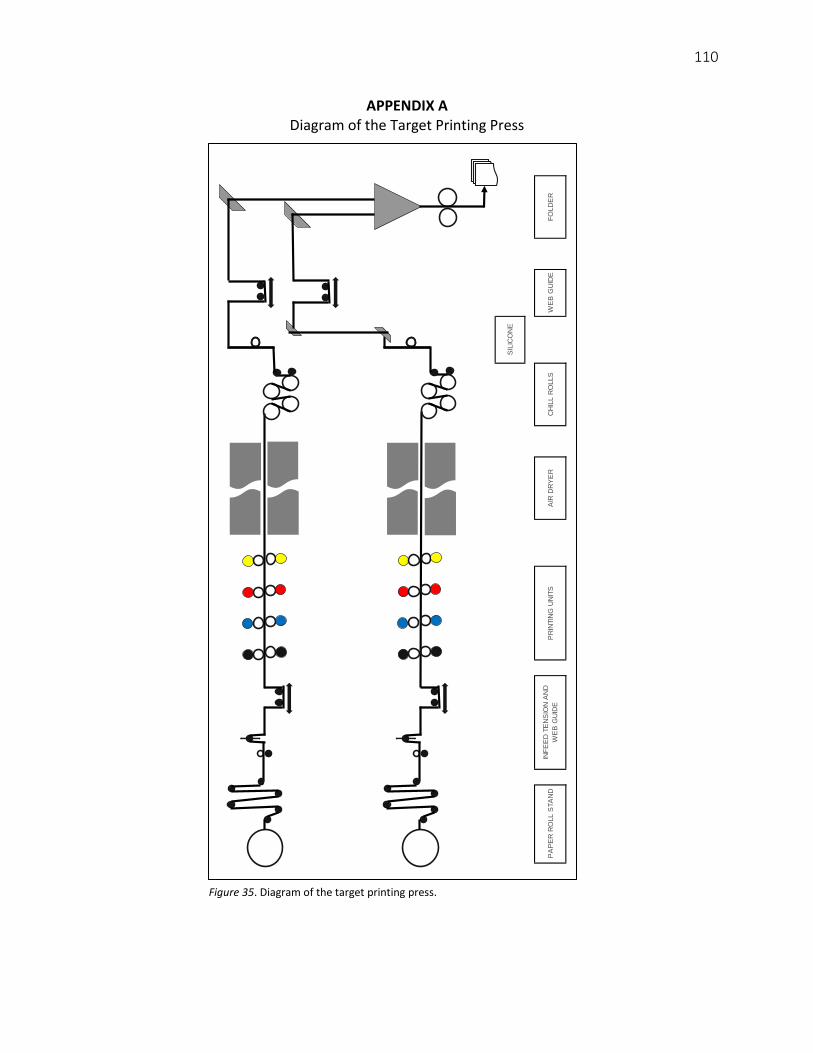
110
APPENDIX A Diagram of the Target Printing Press
WE
B G
UID
EF
OLD
ER
SIL
ICO
NE
PA
PE
R R
OLL S
TA
ND
INF
EE
D T
EN
SIO
N A
ND
WE
B G
UID
EP
RIN
TIN
G U
NIT
SA
IR D
RY
ER
CH
ILL R
OLLS
Figure 35. Diagram of the target printing press.

111
APPENDIX B
Tensile Properties, Moisture Content and
Gurley Permeability of Tested Papers

112
Table 10. Tensile properties, moisture content and Gurley permeability of tested papers.
Bas
is W
eigh
tB
asis
Wei
ght
Co
ndit
ion
Sam
ple
1Sa
mpl
e 2
Ten
sile
Stre
ngt
hSt
retc
hTE
A
Ten
sile
Stif
fnes
sSa
mpl
e 1
Sam
ple
2
Mo
istu
re
Co
nten
t
Sam
ple
1
Mo
istu
re
Co
nten
t
Sam
ple
2
Ave
rage
Mo
istu
re
Co
nten
t
CD
Ten
sile
Stre
ngt
h
Ten
sile
Rat
io
Bas
e
shee
t
Ten
sile
Rat
io
(#/3
300f
t2)
gsm
gg
kN/m
%J/
m2
kN/m
gg
%%
%kN
/m
129
43SC
2.41
262.
4075
2.26
1.09
14.7
232
2.2
2.59
502.
5920
7.6%
7.7%
7.6%
0.58
3.9
3.9
240
59St
anda
rd3.
4202
3.38
992.
71.
2721
.53
407.
73.
5270
3.46
603.
1%2.
2%5.
6%0.
942.
92.
1
340
59C
oat
ing
Tria
l3.
4233
3.42
722.
671.
1919
.67
411.
93.
6130
3.61
805.
5%5.
6%5.
6%0.
982.
72.
3
440
59SW
Tri
al3.
3981
3.38
142.
781.
2521
.43
408.
13.
6090
3.59
006.
2%6.
2%6.
2%1.
012.
82.
3
540
59SW
& K
raft
3.33
643.
3921
2.66
1.19
19.7
541
2.3
3.54
403.
5470
6.2%
4.6%
5.4%
0.99
2.7
2.2
634
50G
rade
5 G
loss
2.56
262.
5886
2.54
1.09
16.8
140
5.9
2.69
802.
7360
5.3%
5.7%
5.5%
0.53
4.8
3.1
729
43SC
2.93
362.
8627
2.36
1.11
15.7
534
83.
1540
3.08
907.
5%7.
9%7.
7%0.
524.
64.
6
850
74G
rade
34.
2451
4.27
723.
961.
4436
.61
560.
24.
4520
4.48
704.
9%4.
9%4.
9%1.
303.
0
945
67G
rade
4 S
ilk3.
6011
3.54
352.
441.
2218
.44
353.
13.
7820
3.72
305.
0%5.
1%5.
0%0.
803.
0
1036
.554
Gra
de 5
Silk
3.10
63.
0885
2.96
1.15
20.4
841
73.
3310
3.32
007.
2%7.
5%7.
4%0.
893.
3
1140
59G
rade
5 G
loss
3.32
13.
3356
3.55
1.23
26.5
850
1.2
3.52
003.
5460
6.0%
6.3%
6.1%
0.71
5.0
1250
74G
rade
4 G
loss
4.23
394.
2487
4.53
1.42
40.1
460
4.3
4.42
304.
4580
4.5%
4.9%
4.7%
0.98
4.6
1329
.744
SC2.
5848
2.53
531.
830.
9610
.56
295.
32.
7650
2.71
707.
0%7.
2%7.
1%0.
533.
53.
5
1445
67G
rade
53.
3573
3.37
62.
961.
0819
.39
460.
13.
5600
3.57
306.
0%5.
8%5.
9%0.
883.
3
1540
59St
anda
rd2.
0702
2.05
612.
871.
221
.04
420.
62.
1768
2.16
675.
1%5.
4%5.
3%0.
943.
02.
4
1640
59Fr
ont
Edg
e Fl
ow
Clo
sed
2.07
832.
0668
2.84
1.22
21.1
841
42.
1840
2.16
265.
1%4.
6%4.
9%1.
112.
62.
3
1740
59H
idde
n D
raw
red
uced
1.97
691.
9865
2.88
1.29
22.7
540
5.1
2.08
732.
0845
5.6%
4.9%
5.3%
1.00
2.9
2.2
1840
59J/
W r
educ
ed1.
9613
1.93
372.
931.
323
.54
419.
42.
0667
2.03
495.
4%5.
2%5.
3%0.
953.
12.
3
1940
59H
i Kra
ft R
efin
ing
1.89
441.
9238
2.91
1.28
23.1
341
9.2
1.99
562.
0188
5.3%
4.9%
5.1%
0.92
3.2
2.3
2040
59Lo
w K
raft
Ref
inin
g2.
092
2.14
782.
991.
3124
.11
431.
42.
2084
2.26
275.
6%5.
3%5.
5%0.
933.
22.
5
2140
59Ze
ro G
roun
dwo
od
Ref
inin
g1.
905
1.92
482.
791.
2321
.341
6.5
2.01
322.
0316
5.7%
5.5%
5.6%
1.00
2.8
2.4
2240
597#
Wet
End
Sta
rch
2.11
642.
1025
2.81
1.16
19.8
742
1.2
2.22
882.
2149
5.3%
5.3%
5.3%
0.96
2.9
2.2
2340
5916
# W
et E
nd S
tarc
h2.
0543
2.08
62.
911.
2322
.142
9.8
2.16
792.
1954
5.5%
5.2%
5.4%
0.95
3.1
2.2
2440
59D
ryer
Dra
ws
Red
uced
2.50
32.
5034
2.69
1.19
19.7
741
8.7
2.62
162.
6396
4.7%
5.4%
5.1%
1.03
2.6
2.5
2540
59G
rade
4 G
loss
12.2
63.
511.
2526
.68
484
13.0
36.
3%6.
3%0.
814.
33.
7
Ove
n D
ry50
% R
H

113
Table 10 – continued
Co
ndit
ion
Ten
sile
Stre
ngt
hSt
retc
hTE
A
Ten
sile
Stif
fnes
sSa
mpl
e 1
Sam
ple
2
Mo
istu
re
Co
nten
t
Sam
ple
1
Mo
istu
re
Co
nten
t
Sam
ple
2
Ave
rage
Mo
istu
re
Co
nten
t
Ten
sile
Stre
ngt
hSt
retc
hTE
A
Ten
sile
Stif
fnes
sSa
mpl
e 1
Sam
ple
2
Mo
istu
re
Co
nten
t
Sam
ple
1
Mo
istu
re
Co
nten
t
Sam
ple
2
Ave
rage
Mo
istu
re
Co
nten
t
kN/m
%J/
m2
kN/m
gg
%%
%kN
/m%
J/m
2kN
/mg
g%
%%
1SC
2.04
1.16
14.3
929
4.2
2.62
832.
6175
8.9%
8.7%
8.8%
1.89
1.59
19.0
725
02.
7068
2.70
5512
.2%
12.4
%12
.3%
2St
anda
rd2.
411.
3520
.49
366.
73.
6565
3.61
366.
9%6.
6%6.
8%2.
071.
5420
.62
325.
63.
7282
3.68
999.
0%8.
8%8.
9%
3C
oat
ing
Tria
l2.
451.
4722
.71
361.
53.
6565
3.66
166.
8%6.
8%6.
8%2.
121.
5120
.43
333.
33.
6963
3.70
398.
0%8.
1%8.
0%
4SW
Tri
al2.
61.
4122
.72
368.
63.
6377
3.61
737.
1%7.
0%7.
0%2.
351.
6123
.87
340.
43.
6909
3.66
778.
6%8.
5%8.
5%
5SW
& K
raft
2.46
1.45
22.8
337
8.2
3.59
153.
6429
7.6%
7.4%
7.5%
2.07
1.64
21.9
131
6.3
3.65
553.
7043
9.6%
9.2%
9.4%
6G
rade
5 G
loss
2.32
1.24
18.2
366.
62.
7222
2.75
996.
2%6.
6%6.
4%2.
021.
3517
.33
323.
22.
7714
2.81
258.
1%8.
6%8.
4%
7SC
2.06
1.33
16.9
330
0.2
3.22
163.
1544
9.8%
10.2
%10
.0%
1.87
1.34
15.5
627
6.5
3.25
903.
1904
11.1
%11
.4%
11.3
%
8G
rade
33.
371.
6836
.29
491.
84.
5117
4.54
816.
3%6.
3%6.
3%2.
881.
7132
.05
446.
74.
5641
4.60
267.
5%7.
6%7.
6%
9G
rade
4 S
ilk2.
261.
5422
.55
327.
23.
8914
3.84
078.
1%8.
4%8.
2%1.
971.
7322
.38
281.
83.
9496
3.89
869.
7%10
.0%
9.8%
10G
rade
5 S
ilk2.
631.
4824
.71
364.
33.
3839
3.37
268.
9%9.
2%9.
1%2.
221.
6423
.77
310.
63.
4673
3.45
4311
.6%
11.8
%11
.7%
11G
rade
5 G
loss
3.17
1.51
30.2
444
0.1
3.56
863.
5935
7.5%
7.7%
7.6%
2.75
1.57
27.6
440
0.5
3.63
333.
6540
9.4%
9.5%
9.5%
12G
rade
4 G
loss
3.88
1.76
43.6
252
2.6
4.54
534.
5446
7.4%
7.0%
7.2%
3.75
2.01
48.5
649
4.5
4.59
724.
5935
8.6%
8.1%
8.3%
13SC
1.68
1.28
13.7
326
3.1
2.81
202.
7590
8.8%
8.8%
8.8%
1.54
1.37
13.6
223
9.3
2.84
522.
7931
10.1
%10
.2%
10.1
%
14G
rade
52.
631.
2821
.05
406.
43.
6063
3.61
507.
4%7.
1%7.
2%2.
521.
4422
.96
382.
93.
6531
3.66
438.
8%8.
5%8.
7%
15St
anda
rd2.
411.
5723
.92
345
2.21
462.
2039
7.0%
7.2%
7.1%
2.15
1.69
23.3
330
6.8
2.25
382.
2426
8.9%
9.1%
9.0%
16Fr
ont
Edg
e Fl
ow
Clo
sed
2.45
1.58
24.6
534
8.6
2.22
392.
2034
7.0%
6.6%
6.8%
2.35
1.78
26.9
532
6.9
2.24
522.
2254
8.0%
7.7%
7.9%
17H
idde
n D
raw
red
uced
2.57
1.57
25.4
835
6.4
2.11
362.
1239
6.9%
6.9%
6.9%
2.26
1.63
23.5
232
52.
1415
2.14
768.
3%8.
1%8.
2%
18J/
W r
educ
ed2.
591.
5525
.17
363.
52.
0923
2.05
536.
7%6.
3%6.
5%2.
361.
6424
.72
341.
62.
1163
2.08
177.
9%7.
7%7.
8%
19H
i Kra
ft R
efin
ing
2.52
1.52
24.0
435
32.
0187
2.04
536.
6%6.
3%6.
4%2.
381.
6625
.21
342.
62.
0434
2.06
537.
9%7.
4%7.
6%
20Lo
w K
raft
Ref
inin
g2.
521.
4923
.57
370.
22.
2430
2.29
487.
2%6.
8%7.
0%2.
391.
6124
.49
349.
62.
2660
2.31
988.
3%8.
0%8.
2%
21Ze
ro G
roun
dwo
od
Ref
inin
g2.
421.
624
.72
349.
62.
0540
2.07
467.
8%7.
8%7.
8%2.
251.
623
.17
333.
92.
0660
2.08
348.
5%8.
2%8.
3%
227#
Wet
End
Sta
rch
2.51
1.55
24.8
237
1.6
2.27
182.
2548
7.3%
7.2%
7.3%
2.29
1.58
23.2
834
7.8
2.28
862.
2751
8.1%
8.2%
8.2%
2316
# W
et E
nd S
tarc
h2.
521.
5625
.19
369.
62.
2071
2.23
107.
4%7.
0%7.
2%2.
261.
6624
.05
320.
32.
2314
2.26
028.
6%8.
4%8.
5%
24D
ryer
Dra
ws
Red
uced
2.47
1.5
23.6
336
5.2
2.66
402.
6782
6.4%
7.0%
6.7%
2.15
1.75
24.2
431
1.9
2.71
012.
7262
8.3%
8.9%
8.6%
25G
rade
4 G
loss
72%
RH
82%
RH
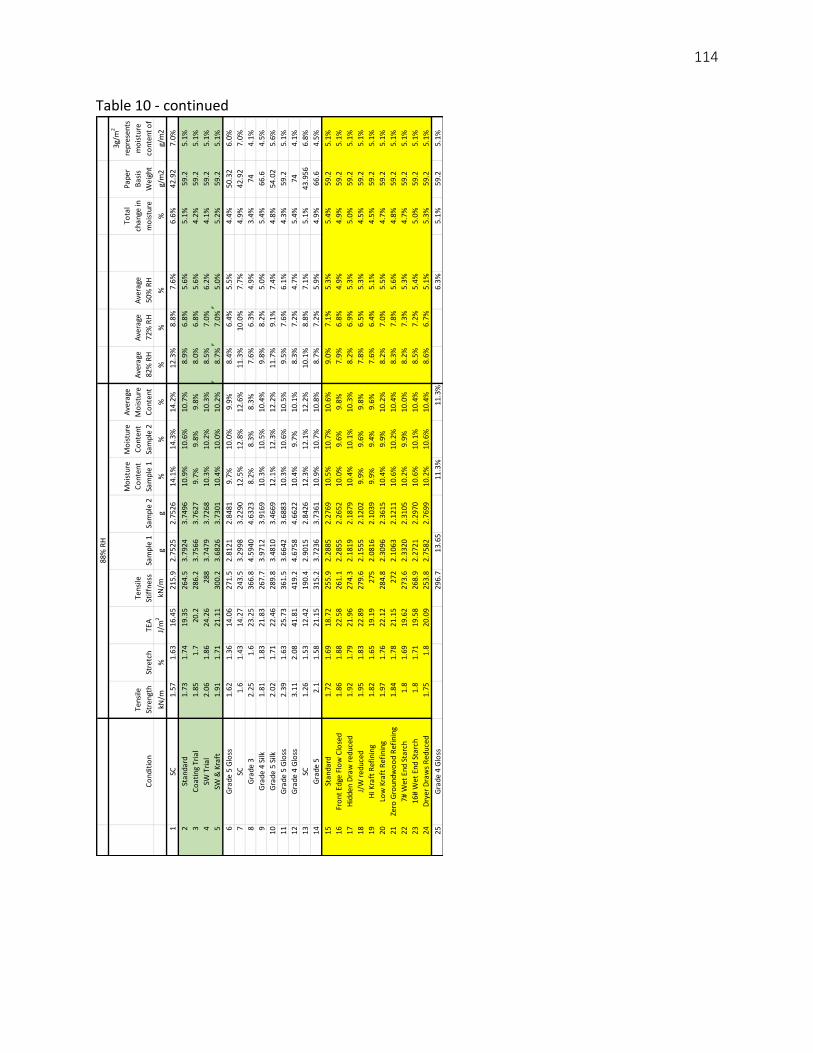
114
Table 10 - continued
Co
ndit
ion
Ten
sile
Stre
ngt
hSt
retc
hTE
A
Ten
sile
Stif
fnes
sSa
mpl
e 1
Sam
ple
2
Mo
istu
re
Co
nten
t
Sam
ple
1
Mo
istu
re
Co
nten
t
Sam
ple
2
Ave
rage
Mo
istu
re
Co
nten
t
Ave
rage
82%
RH
Ave
rage
72%
RH
Ave
rage
50%
RH
Tota
l
chan
ge in
mo
istu
re
Pape
r
Bas
is
Wei
ght
3g/m
2
rep
rese
nts
mo
istu
re
cont
ent
of
kN/m
%J/
m2
kN/m
gg
%%
%%
%%
%g/
m2
g/m
2
1SC
1.57
1.63
16.4
521
5.9
2.75
252.
7526
14.1
%14
.3%
14.2
%12
.3%
8.8%
7.6%
6.6%
42.9
27.
0%
2St
anda
rd1.
731.
7419
.35
264.
53.
7924
3.74
9610
.9%
10.6
%10
.7%
8.9%
6.8%
5.6%
5.1%
59.2
5.1%
3C
oat
ing
Tria
l1.
851.
720
.228
6.2
3.75
663.
7627
9.7%
9.8%
9.8%
8.0%
6.8%
5.6%
4.2%
59.2
5.1%
4SW
Tri
al2.
061.
8624
.26
288
3.74
793.
7268
10.3
%10
.2%
10.3
%8.
5%7.
0%6.
2%4.
1%59
.25.
1%
5SW
& K
raft
1.91
1.71
21.1
130
0.2
3.68
263.
7301
10.4
%10
.0%
10.2
%8.
7%7.
0%5.
0%5.
2%59
.25.
1%
6G
rade
5 G
loss
1.62
1.36
14.0
627
1.5
2.81
212.
8481
9.7%
10.0
%9.
9%8.
4%6.
4%5.
5%4.
4%50
.32
6.0%
7SC
1.6
1.43
14.2
724
3.5
3.29
983.
2290
12.5
%12
.8%
12.6
%11
.3%
10.0
%7.
7%4.
9%42
.92
7.0%
8G
rade
32.
251.
623
.25
366.
84.
5940
4.63
238.
2%8.
3%8.
3%7.
6%6.
3%4.
9%3.
4%74
4.1%
9G
rade
4 S
ilk1.
811.
8321
.83
267.
73.
9712
3.91
6910
.3%
10.5
%10
.4%
9.8%
8.2%
5.0%
5.4%
66.6
4.5%
10G
rade
5 S
ilk2.
021.
7122
.46
289.
83.
4810
3.46
6912
.1%
12.3
%12
.2%
11.7
%9.
1%7.
4%4.
8%54
.02
5.6%
11G
rade
5 G
loss
2.39
1.63
25.7
336
1.5
3.66
423.
6883
10.3
%10
.6%
10.5
%9.
5%7.
6%6.
1%4.
3%59
.25.
1%
12G
rade
4 G
loss
3.11
2.08
41.8
141
9.2
4.67
584.
6622
10.4
%9.
7%10
.1%
8.3%
7.2%
4.7%
5.4%
744.
1%
13SC
1.26
1.53
12.4
219
0.4
2.90
152.
8426
12.3
%12
.1%
12.2
%10
.1%
8.8%
7.1%
5.1%
43.9
566.
8%
14G
rade
52.
11.
5821
.15
315.
23.
7236
3.73
6110
.9%
10.7
%10
.8%
8.7%
7.2%
5.9%
4.9%
66.6
4.5%
15St
anda
rd1.
721.
6918
.72
255.
92.
2885
2.27
6910
.5%
10.7
%10
.6%
9.0%
7.1%
5.3%
5.4%
59.2
5.1%
16Fr
ont
Edg
e Fl
ow
Clo
sed
1.86
1.88
22.5
826
1.1
2.28
552.
2652
10.0
%9.
6%9.
8%7.
9%6.
8%4.
9%4.
9%59
.25.
1%
17H
idde
n D
raw
red
uced
1.92
1.79
21.9
627
4.3
2.18
192.
1879
10.4
%10
.1%
10.3
%8.
2%6.
9%5.
3%5.
0%59
.25.
1%
18J/
W r
educ
ed1.
951.
8322
.89
279.
62.
1555
2.12
029.
9%9.
6%9.
8%7.
8%6.
5%5.
3%4.
5%59
.25.
1%
19H
i Kra
ft R
efin
ing
1.82
1.65
19.1
927
52.
0816
2.10
399.
9%9.
4%9.
6%7.
6%6.
4%5.
1%4.
5%59
.25.
1%
20Lo
w K
raft
Ref
inin
g1.
971.
7622
.12
284.
82.
3096
2.36
1510
.4%
9.9%
10.2
%8.
2%7.
0%5.
5%4.
7%59
.25.
1%
21Ze
ro G
roun
dwo
od
Ref
inin
g1.
841.
7821
.15
272
2.10
632.
1211
10.6
%10
.2%
10.4
%8.
3%7.
8%5.
6%4.
8%59
.25.
1%
227#
Wet
End
Sta
rch
1.8
1.69
19.6
227
3.6
2.33
202.
3105
10.2
%9.
9%10
.0%
8.2%
7.3%
5.3%
4.7%
59.2
5.1%
2316
# W
et E
nd S
tarc
h1.
81.
7119
.58
268.
92.
2721
2.29
7010
.6%
10.1
%10
.4%
8.5%
7.2%
5.4%
5.0%
59.2
5.1%
24D
ryer
Dra
ws
Red
uced
1.75
1.8
20.0
925
3.8
2.75
822.
7699
10.2
%10
.6%
10.4
%8.
6%6.
7%5.
1%5.
3%59
.25.
1%
25G
rade
4 G
loss
296.
713
.65
11.3
%11
.3%
6.3%
5.1%
59.2
5.1%
88%
RH

115
Table 10 – continued
Co
ndit
ion
Tota
l wat
er
prin
ted
fro
m
50%
RH
wit
h
3g/m
2 w
ater
Ten
sile
Stif
fnes
s
at 8
8%
RH
Ten
sile
Stif
fnes
s
at 8
2%
RH
Ten
sile
Stif
fnes
s
at 7
2%
RH
Ten
sile
Stif
fnes
s
at 5
0%
RH
Slo
peO
ffse
t
Co
rrel
atio
n
coef
fici
ent
Ten
sile
Stif
fnes
s at
tota
l wat
er
afte
r pr
inti
ngA
vera
ge
Stan
dard
Dev
iati
on
%kN
/mkN
/mkN
/mkN
/mkN
/mkN
/m r
2kN
/mse
c/1
00m
l
1SC
14.6
%21
5.9
250
294.
232
2.2
-153
6.5
435.
50.
991
211.
243
8.0
14.1
2St
anda
rd10
.7%
264.
532
5.6
366.
740
7.7
-265
0.1
553.
30.
986
270.
686
99.0
2802
.1
3C
oat
ing
Tria
l10
.6%
286.
233
3.3
361.
541
1.9
-291
8.7
568.
30.
988
258.
363
76.0
963.
1
4SW
Tri
al11
.3%
288
340.
436
8.6
408.
1-2
788.
557
4.3
0.97
926
0.5
5936
.032
6.9
5SW
& K
raft
10.0
%30
0.2
316.
337
8.2
412.
3-2
297.
052
9.0
0.96
429
8.8
7508
.043
8.3
6G
rade
5 G
loss
11.5
%27
1.5
323.
236
6.6
405.
9-2
910.
856
1.5
0.98
822
8.2
3720
.015
2.2
7SC
14.7
%24
3.5
276.
530
0.2
348
-209
6.0
510.
20.
998
202.
151
4.0
21.6
8G
rade
38.
9%36
6.8
446.
749
1.8
560.
2-5
338.
482
7.0
0.95
234
9.5
1309
.011
3.8
9G
rade
4 S
ilk9.
5%26
7.7
281.
832
7.2
353.
1-1
570.
843
9.1
0.91
228
9.1
2632
.039
.1
10G
rade
5 S
ilk12
.9%
289.
831
0.6
364.
341
7-2
502.
859
7.9
0.98
927
4.4
1136
.017
.5
11G
rade
5 G
loss
11.2
%36
1.5
400.
544
0.1
501.
2-3
071.
168
4.4
0.98
033
9.9
2451
.029
9.1
12G
rade
4 G
loss
8.8%
419.
249
4.5
522.
660
4.3
-336
3.9
764.
90.
991
470.
572
17.0
346.
0
13SC
13.9
%19
0.4
239.
326
3.1
295.
3-2
040.
944
1.8
0.99
515
8.3
225.
032
.2
14G
rade
510
.4%
315.
238
2.9
406.
446
0.1
-286
5.6
625.
00.
983
325.
826
59.0
71.6
15St
anda
rd10
.3%
255.
930
6.8
345
420.
6-2
953.
256
8.0
0.98
126
2.9
9050
.052
3.6
16Fr
ont
Edg
e Fl
ow
Clo
sed
9.9%
261.
132
6.9
348.
641
4-3
060.
956
1.9
0.99
525
8.0
1013
1.0
463.
1
17H
idde
n D
raw
red
uced
10.3
%27
4.3
325
356.
440
5.1
-259
9.7
539.
40.
998
270.
975
76.0
640.
8
18J/
W r
educ
ed10
.4%
279.
634
1.6
363.
541
9.4
-298
2.5
569.
80.
976
260.
586
88.0
504.
3
19H
i Kra
ft R
efin
ing
10.2
%27
534
2.6
353
419.
2-3
034.
956
6.0
0.95
725
6.3
8770
.033
5.7
20Lo
w K
raft
Ref
inin
g10
.5%
284.
834
9.6
370.
243
1.4
-302
7.8
592.
30.
989
273.
793
69.0
46..
67
21Ze
ro G
roun
dwo
od
Ref
inin
g10
.7%
272
333.
934
9.6
416.
5-3
028.
658
6.4
1.00
026
2.9
7498
.019
0.5
227#
Wet
End
Sta
rch
10.4
%27
3.6
347.
837
1.6
421.
2-3
112.
459
3.5
0.98
326
9.9
8596
.037
8.0
2316
# W
et E
nd S
tarc
h10
.5%
268.
932
0.3
369.
642
9.8
-327
1.9
604.
20.
996
262.
187
85.0
1094
.7
24D
ryer
Dra
ws
Red
uced
10.2
%25
3.8
311.
936
5.2
418.
7-3
064.
057
3.4
0.99
926
2.2
8787
.045
0.6
25G
rade
4 G
loss
11.3
%29
6.7
484
-370
3.7
716.
61
296.
368
56.0
543.
9
Targ
et P
M,
prev
ious
pul
p
tria
ls
Targ
et P
M
pape
rmak
ing
cond
itio
ns t
rial
Line
ar R
egre
ssio
nG
urle
y Pe
rmea
bilit
y

116
APPENDIX C Ultrasonic Tensile Stiffness Index Measurements
Table 11. Ultrasonic TSI measurements, competitive coated PM.
?HostAccessCode? MD ANG TSI MD TSI CD TSIRATProperty Position Orient. Angle MDPosition TSI MD Position TSI CD Position TSI MD / TSI CDUnit cm ° cm mNm cm mNm cm -Average -0.314 12.763 2.493 5.151Deviation 3.758 0.375 0.211 0.401Minimum -7.383 11.621 2.011 4.658Max 5.098 13.302 2.754 6.120
1 18 -6.109 18 11.688 18 2.011 18 5.8112 36 -4.879 36 12.168 36 2.045 36 5.9493 54 -3.910 54 12.679 54 2.090 54 6.0684 72 -3.473 72 12.605 72 2.267 72 5.5605 90 -2.371 90 12.754 90 2.319 90 5.5016 108 -7.383 108 11.621 108 2.372 108 4.8987 126 -5.449 126 12.605 126 2.480 126 5.0838 144 -3.602 144 13.142 144 2.574 144 5.1079 162 -5.449 162 12.605 162 2.532 162 4.978
10 180 -5.758 180 12.456 180 2.665 180 4.67311 198 -2.770 198 13.222 198 2.587 198 5.11112 216 -5.316 216 12.985 216 2.644 216 4.91213 234 -2.504 234 13.063 234 2.630 234 4.96814 252 -3.207 252 12.754 252 2.724 252 4.68215 270 -5.008 270 12.831 270 2.717 270 4.72316 288 -3.297 288 12.908 288 2.622 288 4.92217 306 -1.801 306 13.222 306 2.512 306 5.26318 324 -3.074 324 13.142 324 2.732 324 4.81119 342 -1.891 342 13.063 342 2.694 342 4.84920 360 -0.086 360 13.302 360 2.608 360 5.10021 378 -1.934 378 12.908 378 2.665 378 4.84322 396 -0.484 396 12.679 396 2.594 396 4.88823 414 2.504 414 12.831 414 2.754 414 4.65824 432 2.375 432 12.908 432 2.724 432 4.73925 450 3.297 450 12.530 450 2.651 450 4.72726 468 3.383 468 12.985 468 2.644 468 4.91227 486 2.855 486 12.679 486 2.539 486 4.99328 504 4.043 504 12.831 504 2.553 504 5.02729 522 4.133 522 13.222 522 2.637 522 5.01530 540 3.691 540 13.063 540 2.644 540 4.94131 558 3.957 558 13.142 558 2.637 558 4.98432 576 3.781 576 13.063 576 2.587 576 5.05033 594 5.098 594 12.384 594 2.448 594 5.06034 612 4.133 612 12.754 612 2.519 612 5.06335 630 4.879 630 12.679 630 2.587 630 4.90136 648 3.254 648 12.679 648 2.428 648 5.22137 666 3.297 666 12.985 666 2.435 666 5.33438 684 3.430 684 12.605 684 2.441 684 5.16339 702 2.418 702 13.063 702 2.211 702 5.90940 720 2.285 720 12.456 720 2.278 720 5.46841 738 1.363 738 12.985 738 2.250 738 5.77142 756 1.012 756 12.240 756 2.126 756 5.75843 774 1.055 774 12.310 774 2.011 774 6.120
-10.000
-8.000
-6.000
-4.000
-2.000
0.000
2.000
4.000
6.000
8.000
10.000
1 3 5 7 9 11 13 15 17 19 21 23 25 27 29 31 33 35 37 39 41 43
MD Angle
Series2
10.500
11.000
11.500
12.000
12.500
13.000
13.500
1 3 5 7 9 11 13 15 17 19 21 23 25 27 29 31 33 35 37 39 41 43
TSI MD
2.000
2.500
3.000
3.500
4.000
4.500
5.000
5.500
6.000
6.500
7.000
1 3 5 7 9 11 13 15 17 19 21 23 25 27 29 31 33 35 37 39 41 43
TSI Ratio

117
Table 12. Ultrasonic TSI measurement, target PM standard condition.
?HostAccessCode? MD ANG TSI MD TSI CD TSIRATProperty Position Orient. Angle MDPosition TSI MD Position TSI CD Position TSI MD / TSI CDUnit cm ° cm mNm cm mNm cm -Average 0.151 12.324 2.910 3.834Deviation 1.418 0.359 0.728 0.224Minimum -1.977 11.556 0.997 3.381Max 3.078 12.985 3.549 4.518
1 18 1.363 18 11.556 18 1.201 182 36 0.879 36 12.027 36 2.921 36 4.1173 54 -1.934 54 12.168 54 3.237 54 3.7594 72 -0.836 72 12.168 72 3.256 72 3.7375 90 -1.715 90 12.605 90 3.237 90 3.8946 108 -0.309 108 12.027 108 3.142 108 3.8287 126 -1.977 126 12.168 126 3.189 126 3.8168 144 -0.836 144 12.831 144 3.450 144 3.7199 162 0.043 162 12.985 162 3.256 162 3.988
10 180 -1.715 180 12.754 180 3.527 180 3.61711 198 -1.012 198 12.384 198 3.663 198 3.38112 216 -0.570 216 12.605 216 3.387 216 3.72213 234 -1.188 234 12.530 234 3.105 234 4.03614 252 0.219 252 12.679 252 3.398 252 3.73215 270 -0.746 270 12.679 270 3.560 270 3.56216 288 1.188 288 12.240 288 3.429 288 3.56917 306 2.242 306 12.310 306 3.275 306 3.75818 324 0.352 324 12.027 324 3.132 324 3.84019 342 1.934 342 12.456 342 3.285 342 3.79220 360 1.672 360 12.456 360 3.142 360 3.96521 378 3.078 378 12.530 378 3.256 378 3.84822 396 1.012 396 12.310 396 3.227 396 3.81523 414 1.848 414 12.168 414 3.033 414 4.01224 432 0.879 432 11.754 432 2.938 432 4.00125 450 -0.086 450 11.688 450 2.587 450 4.518
2.000
2.500
3.000
3.500
4.000
4.500
5.000
5.500
6.000
6.500
7.000
1 2 3 4 5 6 7 8 9 10 11 12 13 14 15 16 17 18 19 20 21 22 23 24 25
TSI Ratio
Roll position Roll position
10.500
11.000
11.500
12.000
12.500
13.000
13.500
1 2 3 4 5 6 7 8 9 10 11 12 13 14 15 16 17 18 19 20 21 22 23 24 25
TSI MD
-10.000
-8.000
-6.000
-4.000
-2.000
0.000
2.000
4.000
6.000
8.000
10.000
1 2 3 4 5 6 7 8 9 10 11 12 13 14 15 16 17 18 19 20 21 22 23 24 25
MD Angle

118
Table 13. Ultrasonic TSI measurement, target PM edge flow closed.
?HostAccessCode? MD ANG TSI MD TSI CD TSIRATProperty Position Orient. Angle MDPosition TSI MD Position TSI CD Position TSI MD / TSI CDUnit cm ° cm mNm cm mNm cm -Average -0.774 11.827 2.910 3.874Deviation 2.348 0.477 0.728 0.283Minimum -5.273 10.808 0.997 3.451Max 2.285 12.530 3.549 4.476
1 450 -4.879 450 11.299 450 2.594 450 4.3562 432 -4.879 432 11.890 432 2.739 432 4.3413 414 -5.273 414 11.754 414 3.016 414 3.8984 396 396 396 1.212 3965 378 -3.559 378 10.808 378 3.132 378 3.4516 360 -2.242 360 11.754 360 3.016 360 3.8987 342 -0.570 342 11.890 342 2.872 342 4.1398 324 -3.164 324 12.168 324 1.220 3249 306 -1.977 306 11.958 306 3.123 306 3.829
10 288 -0.613 288 12.240 288 3.169 288 3.86211 270 -1.098 270 12.097 270 3.418 270 3.53912 252 0.000 252 11.235 252 3.077 252 3.65113 234 1.098 234 11.958 234 3.315 234 3.60714 216 2.023 216 11.754 216 3.160 216 3.72015 198 0.703 198 12.027 198 3.429 198 3.50716 180 1.715 180 12.530 180 1.208 18017 162 1.891 162 12.310 162 3.096 162 3.97618 144 -0.176 144 12.097 144 3.132 144 3.86219 126 2.285 126 11.361 126 3.198 126 3.55220 108 0.969 108 12.456 108 3.246 108 3.83721 90 1.848 90 12.530 90 3.208 90 3.90622 72 -0.352 72 11.754 72 2.998 72 3.92123 54 1.363 54 11.754 54 2.913 54 4.03524 36 -0.965 36 11.425 36 2.553 36 4.47625 18 -2.723 18 10.808 18 1.025 18
2.000
2.500
3.000
3.500
4.000
4.500
5.000
5.500
6.000
6.500
7.000
1 2 3 4 5 6 7 8 9 10 11 12 13 14 15 16 17 18 19 20 21 22 23 24 25
TSI Ratio
Roll position
9.500
10.000
10.500
11.000
11.500
12.000
12.500
13.000
1 2 3 4 5 6 7 8 9 10 11 12 13 14 15 16 17 18 19 20 21 22 23 24 25
TSI MD
-10.000
-8.000
-6.000
-4.000
-2.000
0.000
2.000
4.000
6.000
8.000
10.000
1 2 3 4 5 6 7 8 9 10 11 12 13 14 15 16 17 18 19 20 21 22 23 24 25
MD Angle
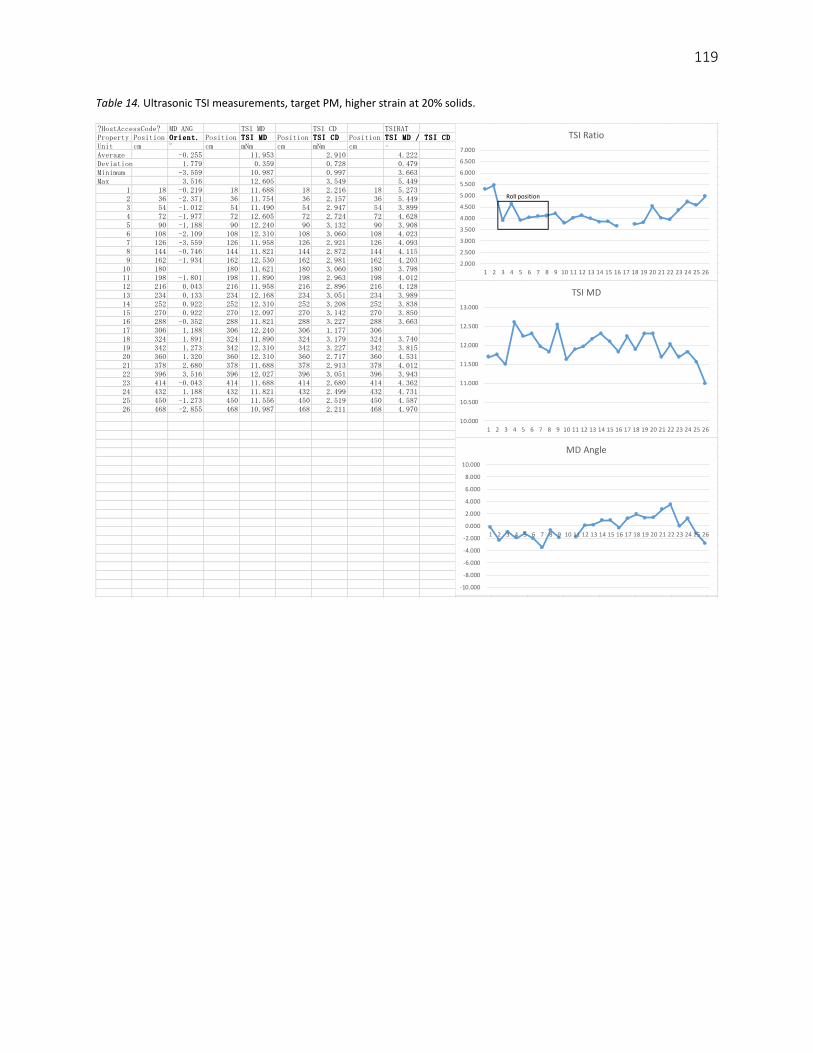
119
Table 14. Ultrasonic TSI measurements, target PM, higher strain at 20% solids.
?HostAccessCode? MD ANG TSI MD TSI CD TSIRATProperty Position Orient. Angle MDPosition TSI MD Position TSI CD Position TSI MD / TSI CDUnit cm ° cm mNm cm mNm cm -Average -0.255 11.953 2.910 4.222Deviation 1.779 0.359 0.728 0.479Minimum -3.559 10.987 0.997 3.663Max 3.516 12.605 3.549 5.449
1 18 -0.219 18 11.688 18 2.216 18 5.2732 36 -2.371 36 11.754 36 2.157 36 5.4493 54 -1.012 54 11.490 54 2.947 54 3.8994 72 -1.977 72 12.605 72 2.724 72 4.6285 90 -1.188 90 12.240 90 3.132 90 3.9086 108 -2.109 108 12.310 108 3.060 108 4.0237 126 -3.559 126 11.958 126 2.921 126 4.0938 144 -0.746 144 11.821 144 2.872 144 4.1159 162 -1.934 162 12.530 162 2.981 162 4.203
10 180 180 11.621 180 3.060 180 3.79811 198 -1.801 198 11.890 198 2.963 198 4.01212 216 0.043 216 11.958 216 2.896 216 4.12813 234 0.133 234 12.168 234 3.051 234 3.98914 252 0.922 252 12.310 252 3.208 252 3.83815 270 0.922 270 12.097 270 3.142 270 3.85016 288 -0.352 288 11.821 288 3.227 288 3.66317 306 1.188 306 12.240 306 1.177 30618 324 1.891 324 11.890 324 3.179 324 3.74019 342 1.273 342 12.310 342 3.227 342 3.81520 360 1.320 360 12.310 360 2.717 360 4.53121 378 2.680 378 11.688 378 2.913 378 4.01222 396 3.516 396 12.027 396 3.051 396 3.94323 414 -0.043 414 11.688 414 2.680 414 4.36224 432 1.188 432 11.821 432 2.499 432 4.73125 450 -1.273 450 11.556 450 2.519 450 4.58726 468 -2.855 468 10.987 468 2.211 468 4.970
2.000
2.500
3.000
3.500
4.000
4.500
5.000
5.500
6.000
6.500
7.000
1 2 3 4 5 6 7 8 9 10 11 12 13 14 15 16 17 18 19 20 21 22 23 24 25 26
TSI Ratio
Roll position
10.000
10.500
11.000
11.500
12.000
12.500
13.000
1 2 3 4 5 6 7 8 9 10 11 12 13 14 15 16 17 18 19 20 21 22 23 24 25 26
TSI MD
-10.000
-8.000
-6.000
-4.000
-2.000
0.000
2.000
4.000
6.000
8.000
10.000
1 2 3 4 5 6 7 8 9 10 11 12 13 14 15 16 17 18 19 20 21 22 23 24 25 26
MD Angle
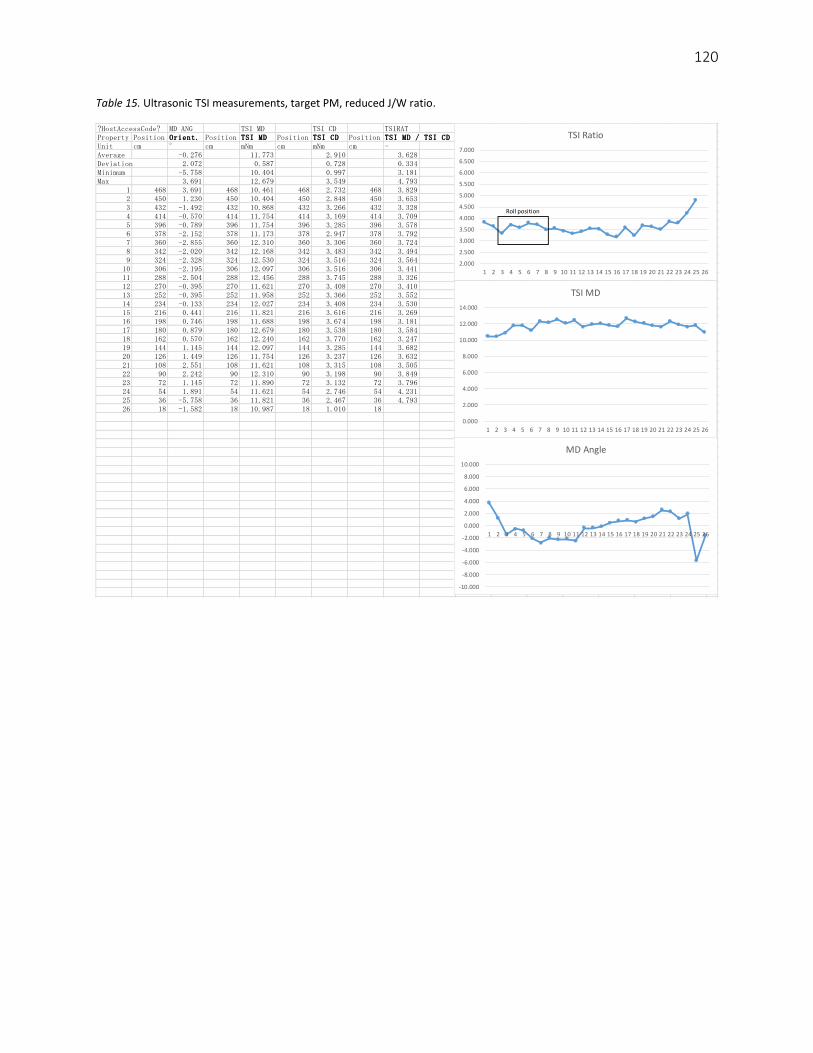
120
Table 15. Ultrasonic TSI measurements, target PM, reduced J/W ratio.
?HostAccessCode? MD ANG TSI MD TSI CD TSIRATProperty Position Orient. Angle MDPosition TSI MD Position TSI CD Position TSI MD / TSI CDUnit cm ° cm mNm cm mNm cm -Average -0.276 11.773 2.910 3.628Deviation 2.072 0.587 0.728 0.334Minimum -5.758 10.404 0.997 3.181Max 3.691 12.679 3.549 4.793
1 468 3.691 468 10.461 468 2.732 468 3.8292 450 1.230 450 10.404 450 2.848 450 3.6533 432 -1.492 432 10.868 432 3.266 432 3.3284 414 -0.570 414 11.754 414 3.169 414 3.7095 396 -0.789 396 11.754 396 3.285 396 3.5786 378 -2.152 378 11.173 378 2.947 378 3.7927 360 -2.855 360 12.310 360 3.306 360 3.7248 342 -2.020 342 12.168 342 3.483 342 3.4949 324 -2.328 324 12.530 324 3.516 324 3.564
10 306 -2.195 306 12.097 306 3.516 306 3.44111 288 -2.504 288 12.456 288 3.745 288 3.32612 270 -0.395 270 11.621 270 3.408 270 3.41013 252 -0.395 252 11.958 252 3.366 252 3.55214 234 -0.133 234 12.027 234 3.408 234 3.53015 216 0.441 216 11.821 216 3.616 216 3.26916 198 0.746 198 11.688 198 3.674 198 3.18117 180 0.879 180 12.679 180 3.538 180 3.58418 162 0.570 162 12.240 162 3.770 162 3.24719 144 1.145 144 12.097 144 3.285 144 3.68220 126 1.449 126 11.754 126 3.237 126 3.63221 108 2.551 108 11.621 108 3.315 108 3.50522 90 2.242 90 12.310 90 3.198 90 3.84923 72 1.145 72 11.890 72 3.132 72 3.79624 54 1.891 54 11.621 54 2.746 54 4.23125 36 -5.758 36 11.821 36 2.467 36 4.79326 18 -1.582 18 10.987 18 1.010 18
2.000
2.500
3.000
3.500
4.000
4.500
5.000
5.500
6.000
6.500
7.000
1 2 3 4 5 6 7 8 9 10 11 12 13 14 15 16 17 18 19 20 21 22 23 24 25 26
TSI Ratio
Roll position
0.000
2.000
4.000
6.000
8.000
10.000
12.000
14.000
1 2 3 4 5 6 7 8 9 10 11 12 13 14 15 16 17 18 19 20 21 22 23 24 25 26
TSI MD
-10.000
-8.000
-6.000
-4.000
-2.000
0.000
2.000
4.000
6.000
8.000
10.000
1 2 3 4 5 6 7 8 9 10 11 12 13 14 15 16 17 18 19 20 21 22 23 24 25 26
MD Angle
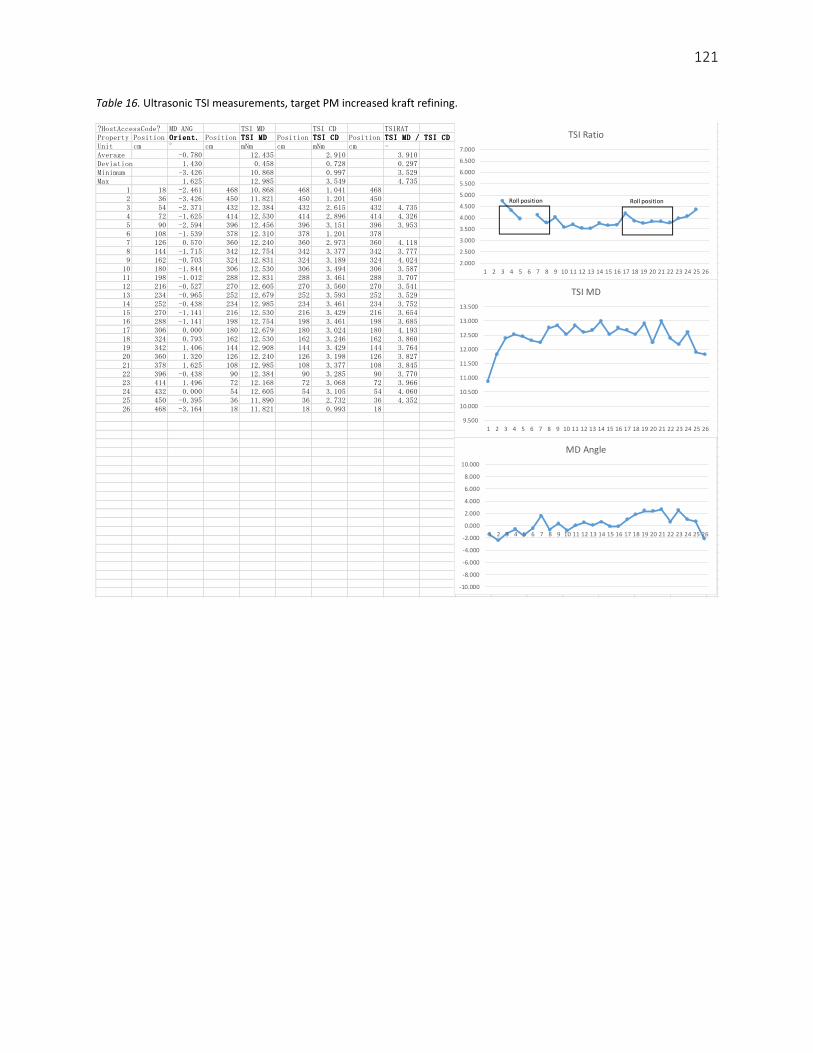
121
Table 16. Ultrasonic TSI measurements, target PM increased kraft refining.
?HostAccessCode? MD ANG TSI MD TSI CD TSIRATProperty Position Orient. Angle MDPosition TSI MD Position TSI CD Position TSI MD / TSI CDUnit cm ° cm mNm cm mNm cm -Average -0.780 12.435 2.910 3.910Deviation 1.430 0.458 0.728 0.297Minimum -3.426 10.868 0.997 3.529Max 1.625 12.985 3.549 4.735
1 18 -2.461 468 10.868 468 1.041 4682 36 -3.426 450 11.821 450 1.201 4503 54 -2.371 432 12.384 432 2.615 432 4.7354 72 -1.625 414 12.530 414 2.896 414 4.3265 90 -2.594 396 12.456 396 3.151 396 3.9536 108 -1.539 378 12.310 378 1.201 3787 126 0.570 360 12.240 360 2.973 360 4.1188 144 -1.715 342 12.754 342 3.377 342 3.7779 162 -0.703 324 12.831 324 3.189 324 4.024
10 180 -1.844 306 12.530 306 3.494 306 3.58711 198 -1.012 288 12.831 288 3.461 288 3.70712 216 -0.527 270 12.605 270 3.560 270 3.54113 234 -0.965 252 12.679 252 3.593 252 3.52914 252 -0.438 234 12.985 234 3.461 234 3.75215 270 -1.141 216 12.530 216 3.429 216 3.65416 288 -1.141 198 12.754 198 3.461 198 3.68517 306 0.000 180 12.679 180 3.024 180 4.19318 324 0.793 162 12.530 162 3.246 162 3.86019 342 1.406 144 12.908 144 3.429 144 3.76420 360 1.320 126 12.240 126 3.198 126 3.82721 378 1.625 108 12.985 108 3.377 108 3.84522 396 -0.438 90 12.384 90 3.285 90 3.77023 414 1.496 72 12.168 72 3.068 72 3.96624 432 0.000 54 12.605 54 3.105 54 4.06025 450 -0.395 36 11.890 36 2.732 36 4.35226 468 -3.164 18 11.821 18 0.993 18
2.000
2.500
3.000
3.500
4.000
4.500
5.000
5.500
6.000
6.500
7.000
1 2 3 4 5 6 7 8 9 10 11 12 13 14 15 16 17 18 19 20 21 22 23 24 25 26
TSI Ratio
Roll position Roll position
9.500
10.000
10.500
11.000
11.500
12.000
12.500
13.000
13.500
1 2 3 4 5 6 7 8 9 10 11 12 13 14 15 16 17 18 19 20 21 22 23 24 25 26
TSI MD
-10.000
-8.000
-6.000
-4.000
-2.000
0.000
2.000
4.000
6.000
8.000
10.000
1 2 3 4 5 6 7 8 9 10 11 12 13 14 15 16 17 18 19 20 21 22 23 24 25 26
MD Angle

122
Table 17. Ultrasonic TSI measurements, target PM decreased kraft refining.
?HostAccessCode? MD ANG TSI MD TSI CD TSIRATProperty Position Orient. Angle MDPosition TSI MD Position TSI CD Position TSI MD / TSI CDUnit cm ° cm mNm cm mNm cm -Average -1.157 12.101 2.910 4.132Deviation 1.726 0.488 0.728 0.424Minimum -4.176 11.049 0.997 3.512Max 2.461 12.908 3.549 5.468
1 18 -0.086 18 11.425 18 2.090 18 5.4682 36 -3.516 36 11.049 36 1.044 363 54 -3.559 54 12.240 54 2.808 54 4.3594 72 -2.723 72 12.168 72 2.913 72 4.1775 90 -2.637 90 12.097 90 2.746 90 4.4056 108 -0.660 108 11.958 108 3.051 108 3.9207 126 -4.176 126 11.890 126 2.921 126 4.0708 144 -1.316 144 12.679 144 3.217 144 3.9419 162 -1.449 162 12.384 162 3.123 162 3.966
10 180 -2.945 180 11.958 180 1.192 18011 198 -1.188 198 12.168 198 3.179 198 3.82812 216 2.461 216 12.027 216 2.989 216 4.02313 234 -0.703 234 11.821 234 3.366 234 3.51214 252 0.484 252 12.754 252 3.105 252 4.10815 270 -1.098 270 12.384 270 2.825 270 4.38416 288 0.266 288 12.679 288 3.398 288 3.73217 306 -0.922 306 12.908 306 3.346 306 3.85818 324 -1.539 324 12.754 324 3.461 324 3.68519 342 -1.449 342 12.908 342 3.123 342 4.13420 360 0.570 360 11.425 360 1.094 36021 378 0.969 378 11.754 378 3.033 378 3.87622 396 -0.395 396 12.168 396 3.336 396 3.64823 414 -0.043 414 11.958 414 2.709 414 4.41424 432 1.758 432 11.958 432 2.840 432 4.21025 450 -2.371 450 11.556 450 2.499 450 4.62426 468 -3.824 468 11.556 468 2.467 468 4.685
2.000
2.500
3.000
3.500
4.000
4.500
5.000
5.500
6.000
6.500
7.000
1 2 3 4 5 6 7 8 9 10 11 12 13 14 15 16 17 18 19 20 21 22 23 24 25 26
TSI Ratio
Roll position
10.000
10.500
11.000
11.500
12.000
12.500
13.000
13.500
1 2 3 4 5 6 7 8 9 10 11 12 13 14 15 16 17 18 19 20 21 22 23 24 25 26
TSI MD
-10.000
-8.000
-6.000
-4.000
-2.000
0.000
2.000
4.000
6.000
8.000
10.000
1 2 3 4 5 6 7 8 9 10 11 12 13 14 15 16 17 18 19 20 21 22 23 24 25 26
MD Angle

123
Table 18. Ultrasonic TSI measurements, target PM no groundwood refining.
?HostAccessCode? MD ANG TSI MD TSI CD TSIRATProperty Position Orient. Angle MDPosition TSI MD Position TSI CD Position TSI MD / TSI CDUnit cm ° cm mNm cm mNm cm -Average -0.717 11.675 2.910 4.963Deviation 2.808 0.587 0.728 1.660Minimum -7.383 10.185 0.997 3.805Max 2.855 12.310 3.549 9.354
1 468 1.145 468 11.890 468 0.985 4682 450 -3.074 450 10.808 450 0.980 4503 432 -1.012 432 11.821 432 2.608 432 4.5324 414 -2.637 414 11.754 414 2.680 414 4.3875 396 -5.184 396 10.349 396 2.473 396 4.1856 378 -3.121 378 11.890 378 2.785 378 4.2697 360 -3.383 360 11.890 360 1.640 360 7.2518 342 -2.371 342 12.097 342 2.881 342 4.1999 324 -4.703 324 12.097 324 1.293 324 9.354
10 306 306 306 0.240 306 7.82911 288 288 10.185 288 1.171 288 8.69912 270 0.746 270 12.240 270 3.105 270 3.94313 252 2.375 252 12.310 252 3.016 252 4.08214 234 2.242 234 12.168 234 3.198 234 3.80515 216 2.855 216 11.621 216 2.856 216 4.06916 198 2.461 198 12.168 198 3.198 198 3.80517 180 2.109 180 11.754 180 1.089 18018 162 -7.383 162 11.049 162 2.658 162 4.15719 144 0.176 144 11.556 144 2.913 144 3.96720 126 1.672 126 11.890 126 2.832 126 4.19921 108 0.660 108 12.240 108 2.717 108 4.50622 90 0.793 90 11.958 90 2.777 90 4.30623 72 1.320 72 12.168 72 2.872 72 4.23624 54 0.746 54 11.688 54 2.630 54 4.44525 36 -0.836 36 11.425 36 2.301 36 4.96626 18 -2.813 18 10.868 18 0.970 18
2.000
2.500
3.000
3.500
4.000
4.500
5.000
5.500
6.000
6.500
7.000
1 2 3 4 5 6 7 8 9 10 11 12 13 14 15 16 17 18 19 20 21 22 23 24 25 26
TSI RatioRoll position
0.000
2.000
4.000
6.000
8.000
10.000
12.000
14.000
1 2 3 4 5 6 7 8 9 10 11 12 13 14 15 16 17 18 19 20 21 22 23 24 25 26
TSI MD
-10.000
-8.000
-6.000
-4.000
-2.000
0.000
2.000
4.000
6.000
8.000
10.000
1 2 3 4 5 6 7 8 9 10 11 12 13 14 15 16 17 18 19 20 21 22 23 24 25 26
MD Angle
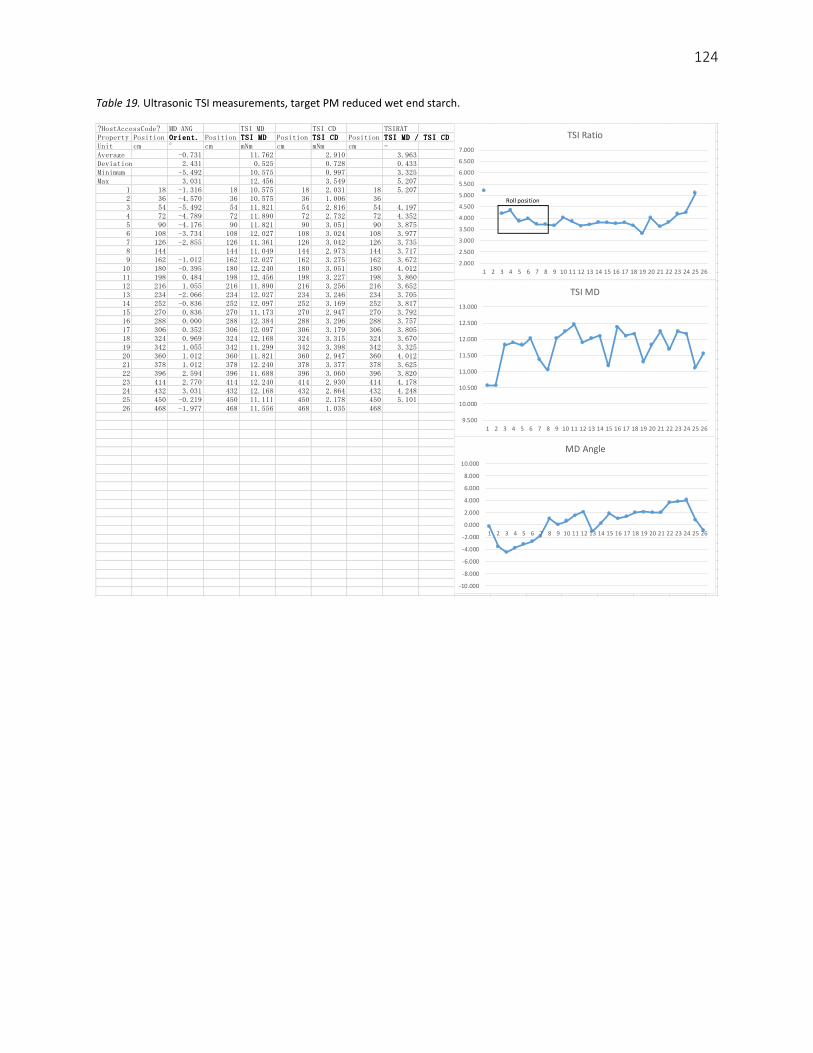
124
Table 19. Ultrasonic TSI measurements, target PM reduced wet end starch.
?HostAccessCode? MD ANG TSI MD TSI CD TSIRATProperty Position Orient. Angle MDPosition TSI MD Position TSI CD Position TSI MD / TSI CDUnit cm ° cm mNm cm mNm cm -Average -0.731 11.762 2.910 3.963Deviation 2.431 0.525 0.728 0.433Minimum -5.492 10.575 0.997 3.325Max 3.031 12.456 3.549 5.207
1 18 -1.316 18 10.575 18 2.031 18 5.2072 36 -4.570 36 10.575 36 1.006 363 54 -5.492 54 11.821 54 2.816 54 4.1974 72 -4.789 72 11.890 72 2.732 72 4.3525 90 -4.176 90 11.821 90 3.051 90 3.8756 108 -3.734 108 12.027 108 3.024 108 3.9777 126 -2.855 126 11.361 126 3.042 126 3.7358 144 144 11.049 144 2.973 144 3.7179 162 -1.012 162 12.027 162 3.275 162 3.672
10 180 -0.395 180 12.240 180 3.051 180 4.01211 198 0.484 198 12.456 198 3.227 198 3.86012 216 1.055 216 11.890 216 3.256 216 3.65213 234 -2.066 234 12.027 234 3.246 234 3.70514 252 -0.836 252 12.097 252 3.169 252 3.81715 270 0.836 270 11.173 270 2.947 270 3.79216 288 0.000 288 12.384 288 3.296 288 3.75717 306 0.352 306 12.097 306 3.179 306 3.80518 324 0.969 324 12.168 324 3.315 324 3.67019 342 1.055 342 11.299 342 3.398 342 3.32520 360 1.012 360 11.821 360 2.947 360 4.01221 378 1.012 378 12.240 378 3.377 378 3.62522 396 2.594 396 11.688 396 3.060 396 3.82023 414 2.770 414 12.240 414 2.930 414 4.17824 432 3.031 432 12.168 432 2.864 432 4.24825 450 -0.219 450 11.111 450 2.178 450 5.10126 468 -1.977 468 11.556 468 1.035 468
2.000
2.500
3.000
3.500
4.000
4.500
5.000
5.500
6.000
6.500
7.000
1 2 3 4 5 6 7 8 9 10 11 12 13 14 15 16 17 18 19 20 21 22 23 24 25 26
TSI Ratio
Roll position
9.500
10.000
10.500
11.000
11.500
12.000
12.500
13.000
1 2 3 4 5 6 7 8 9 10 11 12 13 14 15 16 17 18 19 20 21 22 23 24 25 26
TSI MD
-10.000
-8.000
-6.000
-4.000
-2.000
0.000
2.000
4.000
6.000
8.000
10.000
1 2 3 4 5 6 7 8 9 10 11 12 13 14 15 16 17 18 19 20 21 22 23 24 25 26
MD Angle
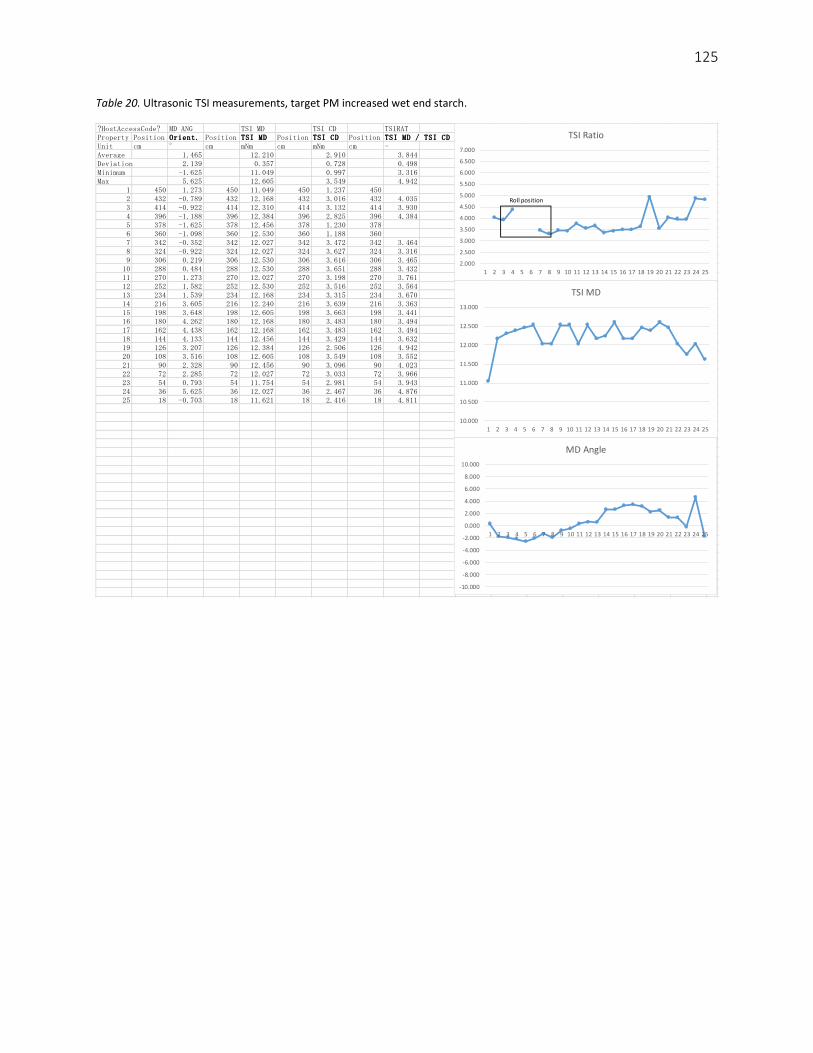
125
Table 20. Ultrasonic TSI measurements, target PM increased wet end starch.
?HostAccessCode? MD ANG TSI MD TSI CD TSIRATProperty Position Orient. Angle MDPosition TSI MD Position TSI CD Position TSI MD / TSI CDUnit cm ° cm mNm cm mNm cm -Average 1.465 12.210 2.910 3.844Deviation 2.139 0.357 0.728 0.498Minimum -1.625 11.049 0.997 3.316Max 5.625 12.605 3.549 4.942
1 450 1.273 450 11.049 450 1.237 4502 432 -0.789 432 12.168 432 3.016 432 4.0353 414 -0.922 414 12.310 414 3.132 414 3.9304 396 -1.188 396 12.384 396 2.825 396 4.3845 378 -1.625 378 12.456 378 1.230 3786 360 -1.098 360 12.530 360 1.188 3607 342 -0.352 342 12.027 342 3.472 342 3.4648 324 -0.922 324 12.027 324 3.627 324 3.3169 306 0.219 306 12.530 306 3.616 306 3.465
10 288 0.484 288 12.530 288 3.651 288 3.43211 270 1.273 270 12.027 270 3.198 270 3.76112 252 1.582 252 12.530 252 3.516 252 3.56413 234 1.539 234 12.168 234 3.315 234 3.67014 216 3.605 216 12.240 216 3.639 216 3.36315 198 3.648 198 12.605 198 3.663 198 3.44116 180 4.262 180 12.168 180 3.483 180 3.49417 162 4.438 162 12.168 162 3.483 162 3.49418 144 4.133 144 12.456 144 3.429 144 3.63219 126 3.207 126 12.384 126 2.506 126 4.94220 108 3.516 108 12.605 108 3.549 108 3.55221 90 2.328 90 12.456 90 3.096 90 4.02322 72 2.285 72 12.027 72 3.033 72 3.96623 54 0.793 54 11.754 54 2.981 54 3.94324 36 5.625 36 12.027 36 2.467 36 4.87625 18 -0.703 18 11.621 18 2.416 18 4.811
2.000
2.500
3.000
3.500
4.000
4.500
5.000
5.500
6.000
6.500
7.000
1 2 3 4 5 6 7 8 9 10 11 12 13 14 15 16 17 18 19 20 21 22 23 24 25
TSI Ratio
Roll position
10.000
10.500
11.000
11.500
12.000
12.500
13.000
1 2 3 4 5 6 7 8 9 10 11 12 13 14 15 16 17 18 19 20 21 22 23 24 25
TSI MD
-10.000
-8.000
-6.000
-4.000
-2.000
0.000
2.000
4.000
6.000
8.000
10.000
1 2 3 4 5 6 7 8 9 10 11 12 13 14 15 16 17 18 19 20 21 22 23 24 25
MD Angle
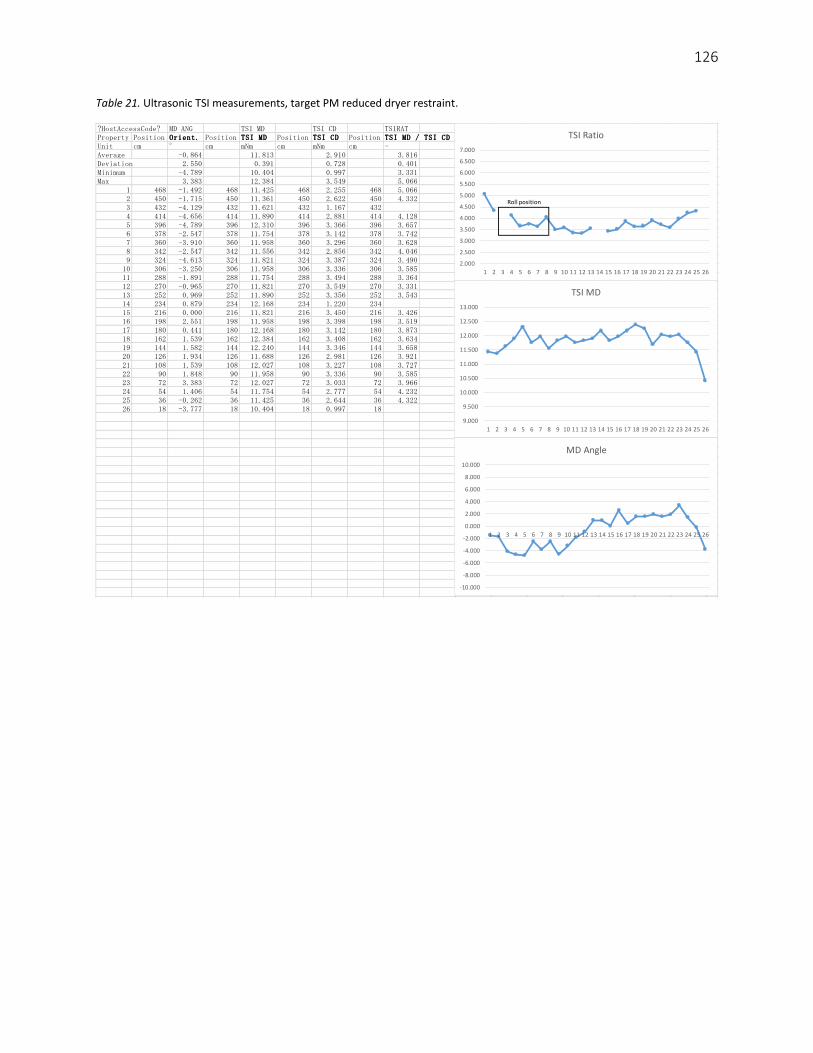
126
Table 21. Ultrasonic TSI measurements, target PM reduced dryer restraint.
?HostAccessCode? MD ANG TSI MD TSI CD TSIRATProperty Position Orient. Angle MDPosition TSI MD Position TSI CD Position TSI MD / TSI CDUnit cm ° cm mNm cm mNm cm -Average -0.864 11.813 2.910 3.816Deviation 2.550 0.391 0.728 0.401Minimum -4.789 10.404 0.997 3.331Max 3.383 12.384 3.549 5.066
1 468 -1.492 468 11.425 468 2.255 468 5.0662 450 -1.715 450 11.361 450 2.622 450 4.3323 432 -4.129 432 11.621 432 1.167 4324 414 -4.656 414 11.890 414 2.881 414 4.1285 396 -4.789 396 12.310 396 3.366 396 3.6576 378 -2.547 378 11.754 378 3.142 378 3.7427 360 -3.910 360 11.958 360 3.296 360 3.6288 342 -2.547 342 11.556 342 2.856 342 4.0469 324 -4.613 324 11.821 324 3.387 324 3.490
10 306 -3.250 306 11.958 306 3.336 306 3.58511 288 -1.891 288 11.754 288 3.494 288 3.36412 270 -0.965 270 11.821 270 3.549 270 3.33113 252 0.969 252 11.890 252 3.356 252 3.54314 234 0.879 234 12.168 234 1.220 23415 216 0.000 216 11.821 216 3.450 216 3.42616 198 2.551 198 11.958 198 3.398 198 3.51917 180 0.441 180 12.168 180 3.142 180 3.87318 162 1.539 162 12.384 162 3.408 162 3.63419 144 1.582 144 12.240 144 3.346 144 3.65820 126 1.934 126 11.688 126 2.981 126 3.92121 108 1.539 108 12.027 108 3.227 108 3.72722 90 1.848 90 11.958 90 3.336 90 3.58523 72 3.383 72 12.027 72 3.033 72 3.96624 54 1.406 54 11.754 54 2.777 54 4.23225 36 -0.262 36 11.425 36 2.644 36 4.32226 18 -3.777 18 10.404 18 0.997 18
2.000
2.500
3.000
3.500
4.000
4.500
5.000
5.500
6.000
6.500
7.000
1 2 3 4 5 6 7 8 9 10 11 12 13 14 15 16 17 18 19 20 21 22 23 24 25 26
TSI Ratio
Roll position
9.000
9.500
10.000
10.500
11.000
11.500
12.000
12.500
13.000
1 2 3 4 5 6 7 8 9 10 11 12 13 14 15 16 17 18 19 20 21 22 23 24 25 26
TSI MD
-10.000
-8.000
-6.000
-4.000
-2.000
0.000
2.000
4.000
6.000
8.000
10.000
1 2 3 4 5 6 7 8 9 10 11 12 13 14 15 16 17 18 19 20 21 22 23 24 25 26
MD Angle

127
REFERENCES
Akerholm, M., & Salmen, L. (2001, February). Interactions between wood polymers studied by FT-IR
spectroscopy. Polymer, 42(3), 963-969.
Alen, R. (2000). Kraft Pulping. In P. Stenius, Forest Products Chemistry (pp. 62-78). Helsinki, Finland:
Fapet Oy.
Alen, R. (2000a). Chemical composition and distribution. In P. Stenius, Forest Products Chemistry (pp. 28-
34). Helsinki: Fapet Oy.
Alen, R. (2000b). Fundamental strucure of wood and fibers. In P. Stenius, Forest Products Chemistry (pp.
13-28). Helsinki: Fapet Oy.
Alen, R. (2000c). Pulping Methods. In P. Stenius, Forest Products Chemistry (pp. 61-86). Helsinki: Fapet
Oy.
Aspler, J. S., DeGrace, J. H., Beland, M. C., Maine, C., & Piquard, L. (1993). Transfer and Setting of Water-
Based Ink, Part II. Journal of Pulp and Paper Science, 10000203-100000208.
Beath, L. R., Neill, M. T., & Masse, F. A. (1966). Latency in Mechanical Wood Pulps. Pulp and Paper
Magazine Canada, T423-T430.
Brandal, J., & Lindheim, A. (1966). The Influence of Extractives in Groundwood Pulp on Fibre Bonding.
Pulp and Paper Magazine of Canada, T431-T435.
Brecht, W. (1962). Effect of Structure on Major Aspects of Paper Behaviour with Fluids. In F. Bolam (Ed.),
The Formation and Structure of Paper (pp. 427-460). London: Fundamental Research
Conference.
Brezinski, J. P. (1956). The Creep Properties of Paper. Tappi, 116-128.
Brues, S. (2001). Color Image Composition. In H. Kipphan, Handbook of Print Media (pp. 79-89). Berlin
Heidelberg: Springer-Verlag.
Campbell, W. B. (1959). The Mechanism of Bonding. Tappi, 999-1001.
Caulfield, D. (1990). Effect of Moisure and Temperature on the Mechancial Properties of Paper. In R. W.
Perkins, R. E. Mark, & J. L. Thorpe (Ed.), Solid Mechanics Advances in Paper Related Industries:
Proceedings of the National Science Foundation Workshop, (pp. 50-62). Syracuse.
Christensen, P. K., & Giertz, H. W. (1966). The Cellulose/Water Relationship. Consolidation of the Paper
Web (pp. 59-84). London: Fundamental Research Conference.
Clark, J. A. (1985). Pulp Technology and Treatment for Paper, 2nd ed. San Francisco: Miller Freeman
Publications.
Corte, H. (1958). The Porous Structure of Paper. In F. Bolam (Ed.), Fundamentals of Papermaking Fibers
(pp. 301-331). London: Fundamental Research Conference.
128
Cox, H. L. (1952). The elasticity and strength of paper and other fibrous materials. British Journal of
Applied Physics, 72-79.
Davison, R. W. (1972). The weak link in paper dry strength. TAPPI, 55(4), 567-573.
Dumbleton, D. F. (1972). Longitudinal Compression of Individual Pulp Fibers. TAPPI, 55(1), 127-135.
Emtec Electronic GmbH. (2002, 02 21). Emtec Measuring Method to Study the Quality of Paper and
Process Liquids, their Interaction and its Influence to Converting Processes. EMTEC Measuring
Systems. Emtec Electronic GmbH.
Emtec Electronic GmbH. (2005, 02 28). Surface & Sizing Tester EST12.2 Operating Instructions. 56(3),
363-370. Emtec Electronic GmgH.
Fjerdingen, H., Forseth, T. F., Gregersen, O. W., Helle, T., Johnsen, P. O., Kure, K., & Reme, P. A. (1997).
Some Mechanical Pulp Fibre Characteristics, Their Process Relationships and Papermaking
Significance. In C. F. Baker (Ed.), Fundamentals of Papermaking Materials. 1, pp. 641-662.
Leatherhead: Pira Intl.
Forgacs, O. L. (1963). The Characterization of Mechanical Pulps. Pulp and Paper Magazine of Canada,
64(2), T89-T-118.
Gallay, W. (1973). Stability of dimensions and form of paper, part 1. TAPPI, 54-63.
Gigac, J., Stankovska, M., & Kasajova, M. (2011). Interactions between offset papers and liquids. Wood
Research, 56(3), 363-370.
Gullichsen, J. (1999). Pulping. In J. Gullichsen, & C. Fogelholm, Chemical Pulping (pp. A14-A16). Helsinki:
Fapet Oy.
Horn, R. A. (1974). Morphology of wood pulp fiber from softwoods and influence on paper strength.
Forest Products Laboratory. Madison: USDA Forest Service.
Horn, R. A. (1978). Morphology of pulp fiber from hardwoods and influence on paper strength. Forest
Products Laboratory. Madison: USDA Forest Service.
Jentzen, C. A. (1964, July). The effect of stress applied during drying on some the the properties of
individual pulp fibers. TAPPI, 47(7), 412-418.
Kajonto, I., & Niskanen, K. (1998). Dimensional Stability. In K. Niskanen, Paper Physics (pp. 222-259).
Helsinki: Fapet Oy.
Kallmes, O. J., & Perez, M. (1965). A new theory for the load/elongation properties of paper. In F. Bolam
(Ed.), Consolidation of the Paper Web (pp. 779-800). Leatherhead: Technical Section British
Paper and Board Industry Research Association.
Kela, L., & von Hertzen, L. (2007). Printing Press Runnability. KCL 0526370.
Kettle, J., Matthews, P., Ridgway, C., & Wagberg, L. (1997). Investigation of the Pore Structure of Paper
by Novel Porosimetric Techniques: Application to Super and Soft-Nip Calendering. In C. F. Baker
129
(Ed.), Fundamentals of Papermaking Materials (pp. 1355-1393). London: Fundamental Research
Conference.
Kipphan, H. (2001a). Drying Methods. In H. Kipphan (Ed.), Handbook of Print Media (pp. 166-179). Berlin
Heidelberg: Springer Verlag.
Kipphan, H. (2001b). Offset Printing. In H. Kipphan (Ed.), Handbook of Print Media (pp. 206-359). Berlin
Heidelberg: Springer-Verlag.
Kipphan, H. (2001c). Quality control/Measurement Techniques. In H. Kipphan (Ed.), Handbook of Print
Media (pp. 99-111). Berlin Heidelberg: Springer-Verlag.
Lehtonen, L. K., Lehto, J. H., & Rudie, A. W. (2004, October). Development of Unbonded and Bonded
Areas in Relation to Populus Species Wood Characteristics in Grinding. Journal of Pulp and Paper
Science, 30(10), 275-278.
Lif, J. O. (2006). Hygro-viscoelastic stress analysis in paper web offset printing. Finite Elements in Analysis
and Design, 341-366.
Lindblad, G., & Furst, T. (2001). The Ultrasonic Measuring Technology on Paper and Board. Kista:
Lorentzen & Wettre.
Lindstrom, T., Wagberg, L., & Larsson, T. (2005). On the Nature of Joint Strength in Paper-A Review of
Dry and Wet Strength Resins Used in Paper Manufacturing. In S. J. I'Anson (Ed.), Advances in
Paper Science and Technology, Transactions of the XIIV Fundamental Research Conference (pp.
457-562). Leatherhead: Pira Intl.
Lonnberg, K. B. (1993). Effect of fibre bonding on tensile strength of printing papers. In C. F. Baker (Ed.),
Products of papermaking : transactions of the 10th Fundamental Research Symposium held at
Oxford (pp. 771-782). Leatherhead: Pira.
Lumiainen, J. (2000). Refining of Chemical Pulp. In H. Paulapuro, Papermaking Part 1, Stock Preparation
and Wet End (pp. 86-121). Helsinki: Fapet Oy.
Lyne, B. M. (1993). On the interaction of liquids with paper under dynamic conditions. Products of
Papermaking (p. 885). Leatherhead: Pira International.
Makela, P. (2009). Effect of Drying Conditions on the Tensile Properties of Paper. In S. J. I'Anson (Ed.),
Advances in Pulp and Paper Research, Trans. XIV Fundamental Research Conference, Oxford,
2009 (pp. 1079-1094). Manchester: Fundamental Research Conference.
McIntosh, D. C., & Leopold, B. (1961). Bonding strength of individual fibres. The Formation and Structure
of Paper (pp. 265-270). Technical Section British Paper and Board Industry Association.
Niskanen, K. (1998). Rheology and moisture effects. In K. Niskanen, Paper Physics (pp. 260-283).
Helsinki: Fapet Oy.
Niskanen, K., & Karenlampi, P. (1998). In-Plane Tensile Properties. In K. Niskanen, Paper Physics (pp. 138-
191). Helsinki: Fapet Oy.
130
Niskanen, K., Kajano, I., & Pakarinen, P. (1998). Fiber Orientation. In K. Niskanen, Paper Physics (pp. 37-
50). Helsinki: Fapet Oy.
Nissan, A. H. (1957). The Rheological Properties of Hydrogen Bonded Solids, Part I & II. Transactions of
the Faraday Society, 53, 700-721.
Nissan, A. H. (1961). General Principles of Adhesion with Particular Reference to the Hydrogen Bond.
Formation and Structure of Paper, Transactions of the 13th Fundamental Research Symposium.
Fundamental Research Conference.
Nordman, L. S. (1958). Bonding in paper sheets. Fundamentals of Papermaking Fibers (pp. 333-347).
Technical Section of the Paper and Board Industry Research Association.
Norman, B. (2000). Web Forming. In H. Paulapuro, Papermaking Part 1, Stock Preparation and Wet End
(pp. 192-250). Helsinki: Fapet Oy.
Oittinen, P., & Saarelma, H. (1998a). Paper in Printing. In P. Oittinen, & H. Saarelma, Printing (pp. 212-
255). Helsinki: Fapet Oy.
Oittinen, P., & Saarelma, H. (1998b). Printing Inks. In P. Oittinen, & H. Saarelma, Printing (pp. 256-286).
Helsinki: Fapet Oy.
Ojala, T. (1999). Hydrogen Bonding. In L. Neimo, Papermaking Chemistry (pp. 29-32). Helsinki: Fapet Oy.
Page, D. H. (1966). The Axial Compression of Fibers - A Newly Discovered Beating Action. Pulp and Paper
Magazine Canada, 67(1), T2-T12.
Page, D. H. (1969). A theory for the Tensile Strength of Paper. TAPPI, 674-681.
Page, D. H., & Sargent, J. W. (1962). The fine structure of fibre bonding. The formation and structure of
paper (pp. 195-200). Technical Section British Paper and Board Industry Research Association.
Page, D. H., & Seth, R. S. (1980a, October). The elastic modulus of paper II. The importance of fiber
modulus, bonding, and fiber length. TAPPI, 63(10), 113-116.
Page, D. H., & Seth, R. S. (1980b). The elastic modulus of paper, III. The effects of dislocations,
microcompressions, curl, crimps, and kinks. TAPPI, 63(6), 99-102.
Page, D. H., & Tydeman, P. A. (1962). A new theory of the shrinkage, structure and properties of paper.
Formation and Structure of Paper (pp. 397-413). London: Technical Section British Paper and
Board Makers Association.
Page, D. H., El-Hosseiny, F., Winkler, K., & Lancaster, A. P. (1977, April). Elastic modulus of single wood
pulp fibers. TAPPI, 60(4), 114-117.
Page, D. H., Seth, R. S., & De Grace, J. H. (1979). The elastic modulus of paper I. The controlling
mechanisms. TAPPI, 99-102.
Page, D. H., Seth, R. S., Jordan, B. D., & Barbe, M. C. (1985). Curls, crimps, kinks and microcompressions
in pulp fibres - their origin, measurement and significance. In V. Punton (Ed.), Papermaking Raw
131
Materials, Transactions of the VIIIth Fundamental Research Symposium, Oxford, 1985 (pp. 183-
227). Manchester: Fundamental Research Committee.
Page, D. H., Tydeman, P. A., & Hunt, M. (1962a). A study of fibre-to-fibre bonding by direct observation.
The formation and structure of paper (pp. 171-193). Technical Section British Paper and Board
Industry Research Association.
Page, D. H., Tydeman, P. A., & Hunt, M. (1962b). The behaviour of fibre-to-fibre bonds in sheets under
dynamic conditions. The formation and structure of paper (pp. 249-263). Technical Section
British Paper and Board Makers Industry Research Association.
Per-Olav, T. (1995). Water uptake in newsprint during offset printing. TAPPI, 78(1), 155-160.
Retulainen, E., Niskanen, K., & Nilsen, N. (1998). Wet straining of the paper web. In K. Niskanen, Paper
Physics (pp. 81-83). Helsinki: Fapet Oy.
Retulainen, E., Niskanen, K., & Nilsen, N. (1998a). Bonding. In K. Niskanen, Paper Physics (pp. 70-76).
Helsinki: Fapet Oy.
Retulainen, E., Niskanen, K., & Nilsen, N. (1998b). Fiber Properties. In K. Niskanen, Paper Physics (pp. 55-
70). Helsinki: Fapet Oy.
Roisum, D. R. (1998). The Mechanics of Web Handling. Atlanta: TAPPI Press.
Salmen, L. (1993). Responses of Paper Properties to Changes in Moisture Content and Temperature.
Products of Papermaking, Transactions of the Xth FRC (pp. 369-430). London: Pira Intl.
Salmen, L., Lucander, M., Harkonen, E., & Sundholm, J. (1999). Fundamental Mechanisms in Mechanical
Pulping and Especially Grinding. In J. Sundholm, Mechanical Pulping (pp. 39-51). Helsinki: Fapet
Oy.
Salmen, N. (1982). Temperature and Water Induced Softening Behaviour of Wood Fiber Based
Materials. Stockholm: Royal Institute of Technology.
Salmen, N. (1986). The Cell Wall as a Composite Structure. In J. Ed. Bristow, & P. Kolseth, Paper Structure
and Properties (pp. 51-73). New York: Marcel Dekker.
Salmen, N. L., & Back, E. (1980, June). Moisture-dependent Thermal Softening of Paper, Evaluated by its
Elastic Modulus. TAPPI, 63(6), 117-120.
Sanborn, I. B. (1962). A study of irreversible, stress-induced changes in the macrostructure of paper.
TAPPI, 465474.
Seth, R., & Page, D. (1983). The stress-strain curve of paper. The Role of Fundamental Research in
Papermaking: Transactions of the symposium held at Cambridge September 1981, vol. 1 (pp.
421-452). London: Mechanical Engineering Publications Ltd.
Shields, G. (2015). Web Weave Trials Sep 23, 2015. Unpublished.
Shields, G. (2016). Web weave trials. Unpublished results.
Silvy, J. (1971). Effects of Drying on Web Characteristics, Part 2. Paper Technology, 12(6), T217-T223.
132
Smook, G. A. (2002). Characteristics of Wood and Wood Pulp Fibers. In G. A. Smook, Handbook for Pulp
and Paper Technologists (pp. 10-205). Vancouver: Angus Wilde Publications Inc.
Spielgelberg, H. L. (1966, September). The effect of hemicelluloses on the mechanical properties of
individual pulp fibers. TAPPI, 49(9), 388-396.
Stone, J. E., & Scallan, A. M. (1966). Influence of Drying on the Pore Structures of the Cell Wall. In F.
Bolam (Ed.), Consolidation of the Paper Web. 1, pp. 145-166. London: Fundamental Research
Conference.
TAPPI. (2006). T 233 cm-06 Fiber Length of Pulp by Classification. TAPPI.
TAPPI. (2013). T 402 SP-13 Standard Conditioning and Testing Atmosphere for Paper, Board, Pulp
Handsheets and Related Products. Atlanta: TAPPI.
Tejado, A., & van de Ven, T. (2010). Why Does Paper get Stronger as it Dries? Materials Today, 13(9), 42-
49.
Trollsas, P. (1995). Water Uptake in Newsprint during Offset Printing. TAPPI, 78(1), 155-160.
UPM Research. (2008). Fines and Filler Distribution. Unpublished.
Walsh, F. L. (2006). An isotropic study of fiber-water interactions (Unpublished doctoral dissertation).
Atlanta: Georgia Institute of Technology.
Winspear, S. (1979). The Characterization of Liquid Acceptance by Paper. Appita, 33(1), 25-31.
Yan, D., & Li, K. (2013). Evaluation of Inter-fiber Bonding in Wood Pulp Fibers by Chemical Force
Microscopy. Materials Science Research, 2(1), 23-33.