Paperboard ontainer Manufacturing - NPES ontainer Manufacturing ... Dry and frozen foods also major...
34
NAICS 32221 Paperboard Container Manufacturing Exclusive Commentary from Dr. Joe Webb and Richard Romano 1
Transcript of Paperboard ontainer Manufacturing - NPES ontainer Manufacturing ... Dry and frozen foods also major...
NAICS 32221
Paperboard Container
Manufacturing
Exclusive Commentary from Dr. Joe Webb and Richard Romano
1
NAICS 32221
Exclusive Commentary
Paperboard Container Manufacturing [NAICS 32221] This is a rollup classification that also includes the sub-NAICS categories Corrugated and Solid Fiber Box Manufacturing (NAICS 32211), Folding Paperboard Box Manufacturing (NAICS 32212), and Other Paperboard Container Manufacturing (NAICS 32219), which are covered in more detail in individual data and commentary sheets.
The Bureau of the Census definition for this business classification:
This industry comprises establishments primarily engaged in converting paperboard into containers without manufacturing paperboard. These establishments use corrugating, cutting, and shaping machinery to form paperboard into containers. Products made by these establishments include boxes, corrugated sheets, pads, pallets, paper dishes, and fiber drums and reels.
The commentary below refers to the aggregate data. Each NAICS is covered in separate commentary and data sheets.
Geographic Distribution
• California (10.1%), Ohio (7.5%), and Texas (6.6%) are the three biggest states for
paperboard container manufacturers.
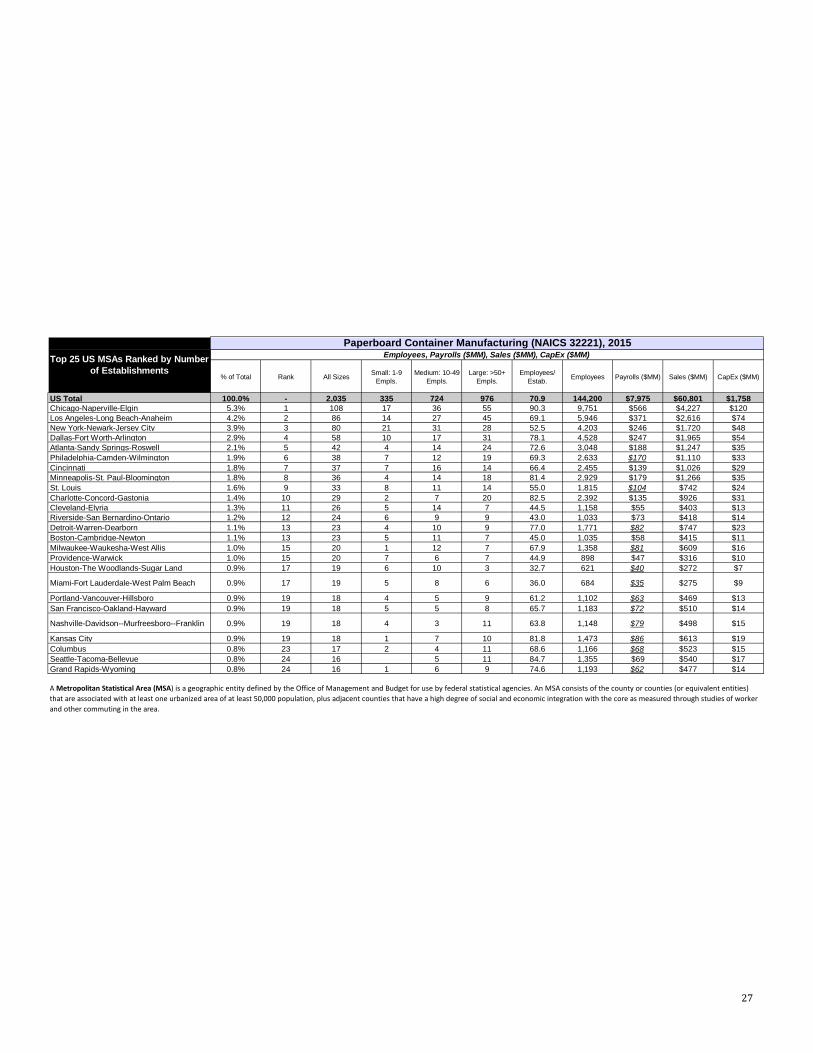
• Chicago-Naperville-Elgin (5.3%), Los Angeles-Long Beach-Anaheim (4.2%), and New York-
Newark-Jersey City (3.9%), and are the top three metro areas for paperboard container
manufacturers.
• In general, Metropolitan Statistical Areas (MSAs) are urbanized areas that have at least
50,000 people. Combined Statistical Areas (CSAs) are much larger metropolitan population
regions that include MSAs as well as associated bordering areas. For more details, please
refer to the “Key Terms and Definitions” beginning on page 7 of this report.
• The top combined statistical areas (CSAs) are:
Combined Statistical Area Los Angeles Chicago % of All Establishments 5.7% 5.6%
Establishments 115 114
Employees 7,350 9,908
Payroll $468 Million $573 Million
Sales $3.2 Billion $4.3 Billion
Capital Expenditures $93 Million $121 Million
2
NAICS 32221
Commentary (continued) Demographics
Establishments
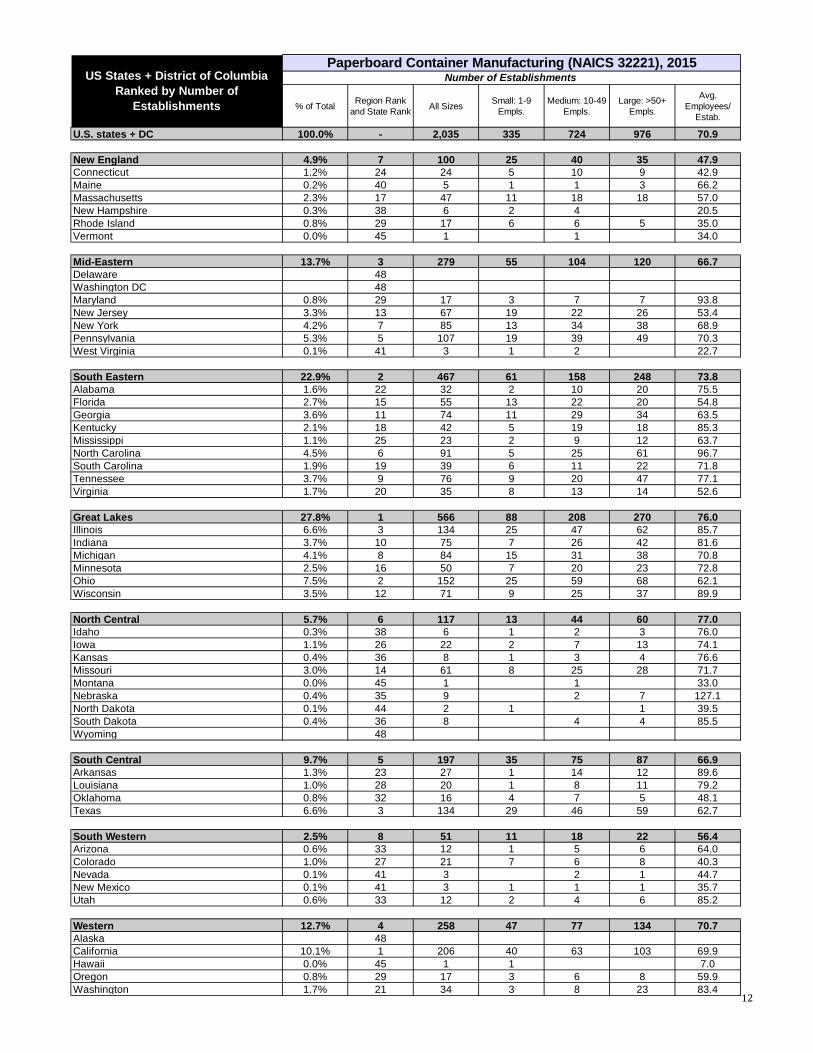
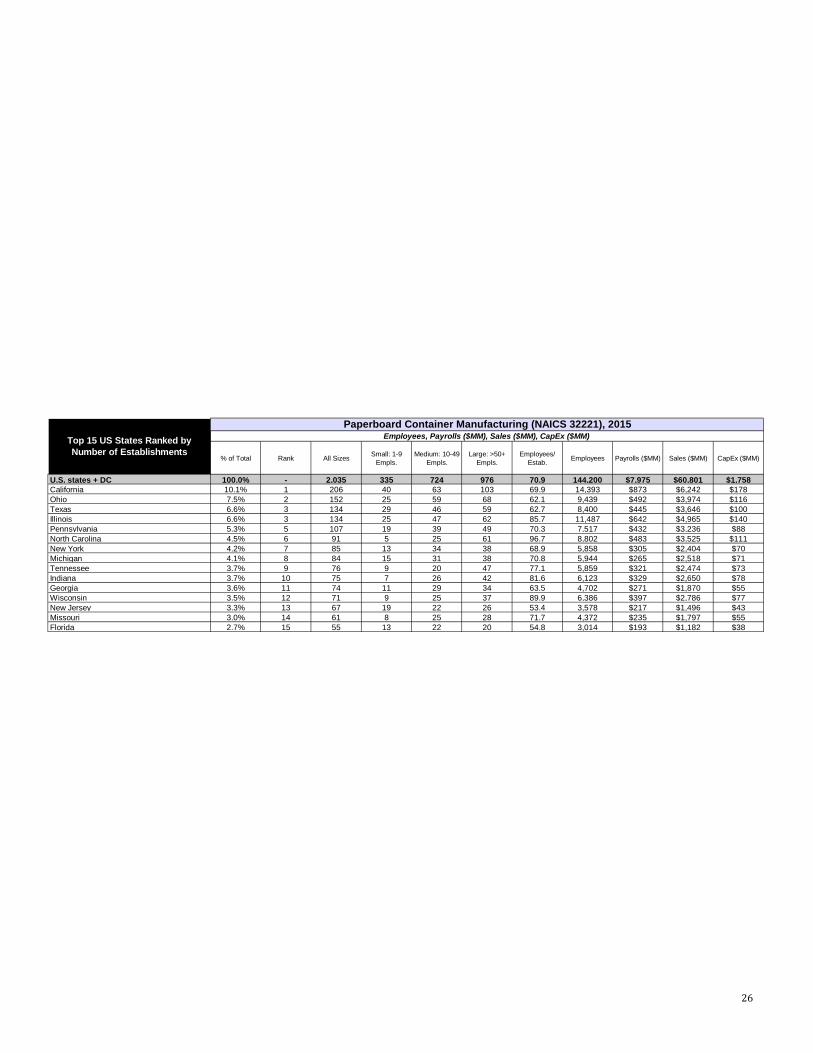
• In 2015, there were 2,035 U.S. paperboard container manufacturers.
Almost one-half (48%) of establishments have more than 50 employees, 36% have
10 to 49 employees, and 16% have under 10 employees.
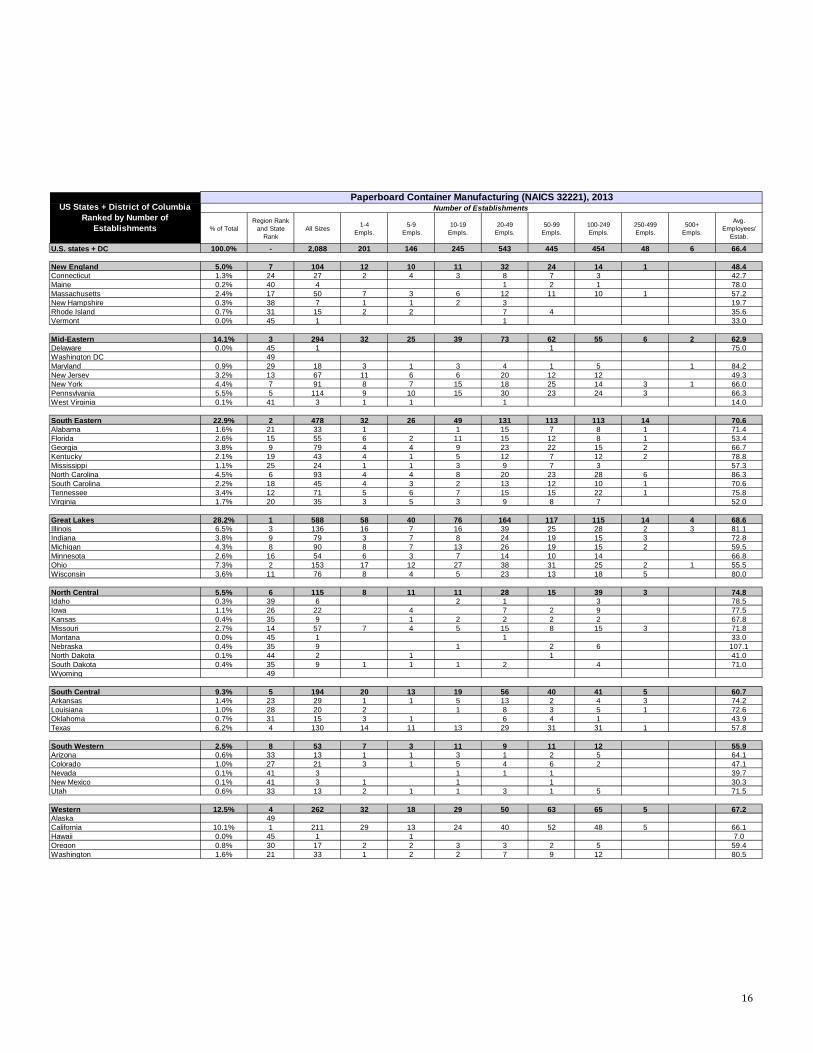
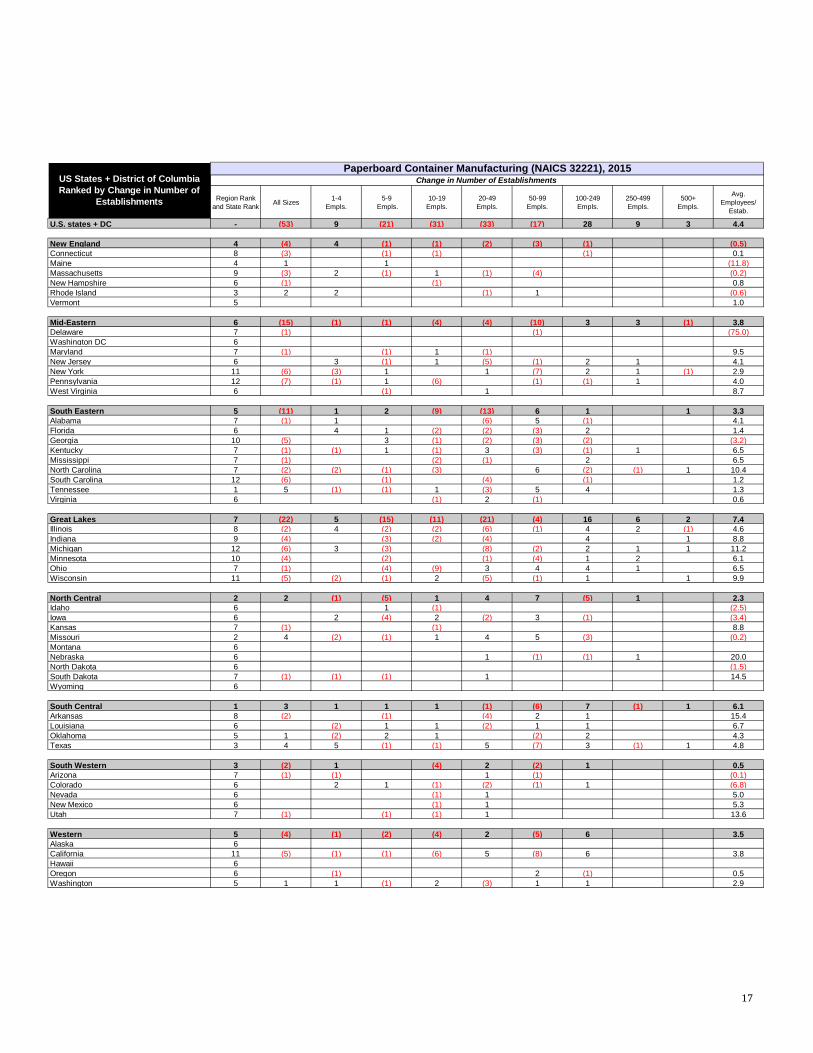
From 2013 to 2015, paperboard container manufacturing establishments declined
by -2.5%.
• Since 2010, establishments in this category have declined by -7.7%.
• The decline has slowed: from 2014 to 2015, establishments declined by
-0.6%.
Establishments in the 1- to 4-employee range grew by +3.4%.
Establishments in the 5- to 9-employee range declined -14.4% from 2014 to 2015.
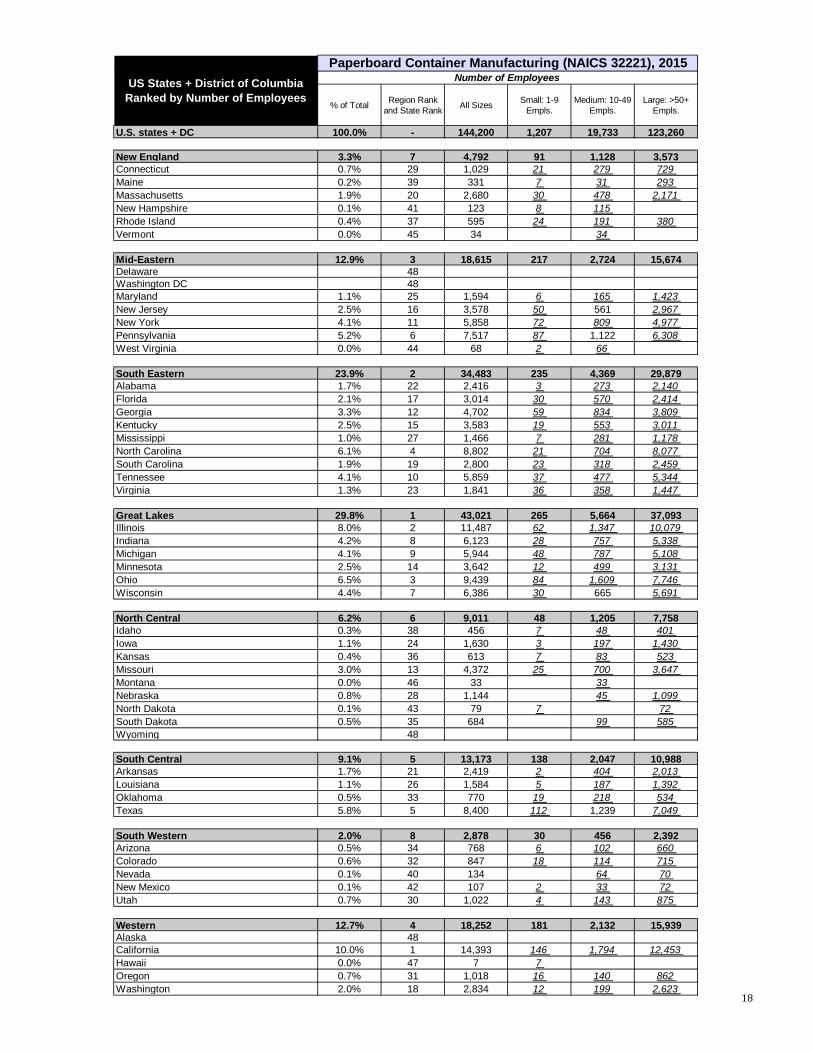
Employees • In 2015, there were a total of 144,200 employees in paperboard container manufacturing
establishments.
• Although overall employment is down -15.0% since 2010, from 2014 to 2015, there was no
change in overall employment in this category.
Employment in the 5- to 9-employee range dropped -15.8% from 2014 to 2015.
Employment growth 2014 to 2015 has been almost exclusively among large and
very large establishments.
• Since 2010, payroll in paperboard container manufacturers grew +16.0%.
From 2014 top 2015, it has grown +4.0%, almost exclusively among large and very
large manufacturers.
Revenues/Value of Shipments • In 2015, paperboard container manufacturers reported revenues of $60.8 billion.
Large manufacturers accounted for 88% of revenues; small manufacturers 1% of
revenues.
• Regionally, paperboard container manufacturers in the Great Lakes region accounted for
almost one-third (30.4%) of revenues.
• Manufacturers in the South Western states only accounted for 2.0% of revenues.
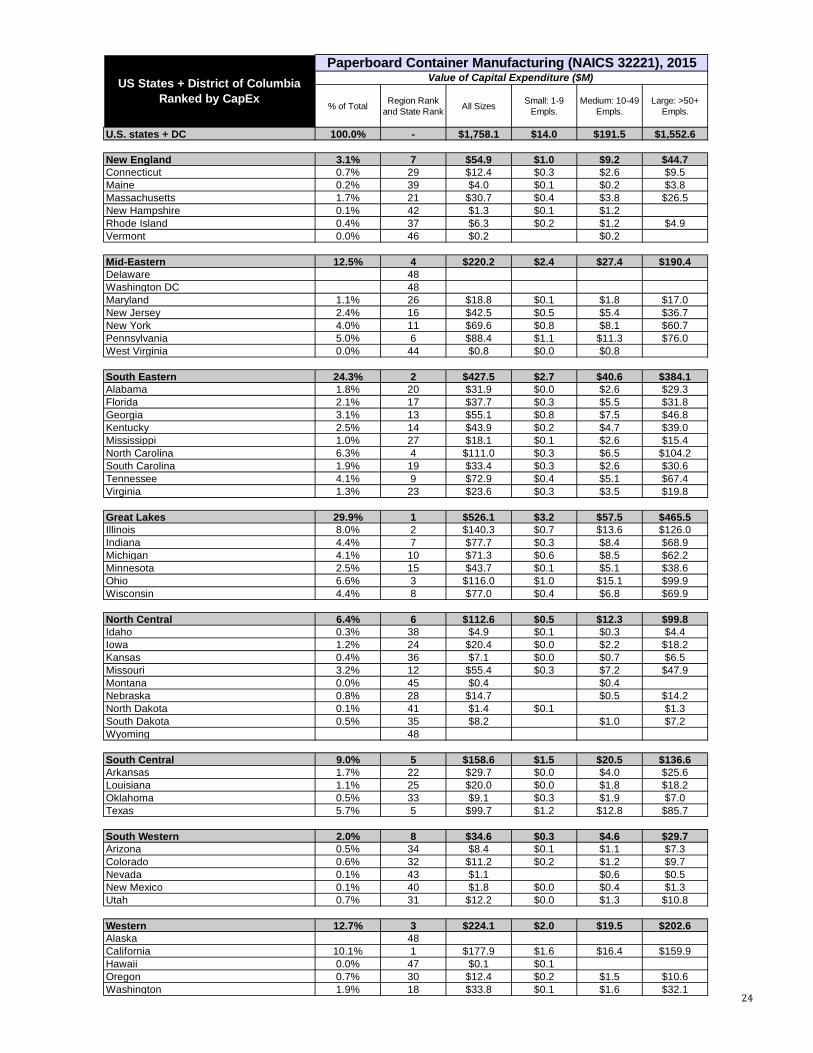
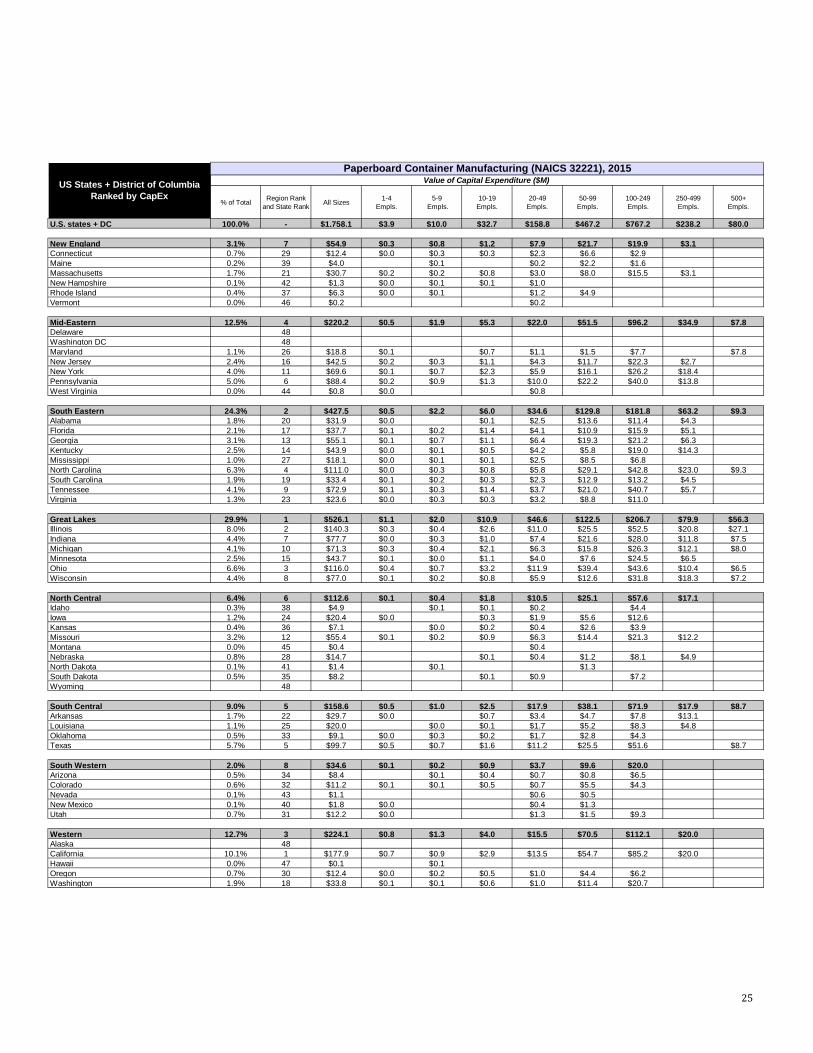
Capital Expenditures • In 2015, paperboard container manufacturers spent $1.8 billion on capital expenditures.
88% of those outlays were by large (50+-employee) establishments, 11% by mid-
size establishments, and only 1% by small establishments.
3
NAICS 32221
Commentary (continued)
Technology Impacts and Competitive Trends Specific trends vary according to creative market. The highlights:
Corrugated and solid fiber box manufacturing:
• Software prototyping of packaging such as boxes results in innovative designs.
New box designs and configurations can optimize logistics of transporting
packages, esp. from overseas manufacturers.
• Environmental concerns becoming more important in box conversion.
Environmental benefits often the byproduct of more efficient and lower-cost
manufacturing techniques (i.e., reducing water consumption).
• Ecommerce driving demand for more and newer types of corrugated boxes.
Change in demand for different sizes—shipped to consumer vs. shipped to retailer.
Distinction between “for retail” and “for ecommerce” packaging materials.
• The latter doesn’t need eye-catching graphics.
Rengo Gemini Packaging System —used by Amazon, among other mail-order and
ecommerce sites—automatically adjusts the height of boxes according to the
merchandise being ordered/shipped.
• Digital inkjet corrugated printing systems were the Big Thing at drupa 2016.
Increase in number of stock-keeping units (SKUs) and other “customization” and
versioning trends reducing run lengths of corrugated materials.
Digital devices also ideal for hard prototyping (vs. software prototyping).
• “Smart packaging”—which incorporates some kind of often electronic functionality—on
the rise.
Packaging Digest identifies two kinds of smart packaging:
• “Active packaging” offers capabilities such as moisture control.
• “Intelligent packaging” offers capabilities that indicate status or
environmental/product changes—such as whether a temperature change
has taken place (vital in pharmaceutical and food shipping).
Smart packaging now has its own new association: the Active & Intelligent
Packaging Industry Association (AIPIA).
• Packaging also making increased use of Quick Response (QR) codes and other smartphone-
scannable graphics, which requires higher-quality printing and, therefore, corrugated
surfaces.
4
NAICS 32221
Commentary (continued) Competitive Trends
• According to 2014 research by Smithers Pira, demand for corrugated packaging has been increasing by more than 4% annually and is expected to amount to almost 115 million tons worth an estimated $176 billion by 2019.
Manufacturers looking to reduce shipping/transportation weights/costs.
Turning to lighter weight boxes.
In Western Europe, finished board weights have been reduced by an average of 5 gsm, according to data from FEFCO.
On the other hand, heavier corrugated material can replace wooden crates, also helping reduce transportation costs.
• Retail-ready packaging (RRP) had been poised for substantial growth—although the current slump in retail may adversely impact demand.
• New liner technologies improve reproduction of graphics on retail-ready packages and associated point-of-sale (POS) materials.
Folding paperboard box manufacturing:
• Migration of chemicals and other materials through paperboard/cardboard has been identified as a serious concern for food and pharmaceutical packaging.
Increased emphasis on anti-migration barriers and other technologies to reduce/eliminate contamination.
• Digital printing of cartons is becoming common.
Accompanied by laser die-cutting to handle shorter runs.
Growth of small boutique and craft businesses—such as microbreweries—fueling demand for high-quality, shorter-run packaging materials.
• Ecommerce driving demand for more and newer types of cartons.
Change in demand for different sizes—shipped to consumer vs. shipped to retailer.
Distinction between “for retail” and “for ecommerce” packaging materials.
• The latter doesn’t need eye-catching graphics.
• As in corrugated packaging, “smart packaging”—which incorporates some kind of often electronic functionality—on the rise on folding cartons.
Packaging Digest identifies two kinds of smart packaging:
• “Active packaging” offers capabilities such as moisture control.
• “Intelligent packaging” offers capabilities that indicate status or environmental/product changes—such as whether a temperature change has taken place (vital in pharmaceutical and food shipping).
Smart packaging now has its own new association: the Active & Intelligent Packaging Industry Association (AIPIA).
• Folding cartons also making increased use of Quick Response (QR) codes and other smartphone-scannable graphics, which requires higher-quality printing and, therefore, corrugated surfaces.
5

NAICS 32221
Commentary (continued)
• Specialty enhancements for retail-ready cartons—like 3D, lenticular imaging, “digital embellishments” (a la Scodfix or MGI)—also becoming important differentiators in retail environments.
Ultraviolet (UV) and electron beam (EB) coatings and other effects also important elements for folding cartons.
• “Unboxing”—recording the removal of a new product (like a video game) from a package and posting it on social media—is a trend. Packaging needs to be ready for its close-up.
• According to Smithers Pira research, healthcare and tobacco products (an ironic combination) are the two largest uses of folding cartons.
Dry and frozen foods also major product categories.
• Manufacturers are striving to reduce overall amount of packaging for a given product.
For reasons of both cost reduction and environmental sustainability.
• Growth of single-person households—especially in Europe—is driving demand for single-serving food packages.
• Introduction off digital printing and “simplified” production allows traditional commercial printers to enter into packaging printing/decoration market.
Barriers to entry still include brand trust, navigating regulatory issues, especially with regard to food and drug packaging.
Other paperboard container manufacturing:
• Products includes in this category include:
Fiber cans and drums (i.e., all-fiber, nonfiber ends of any material) made from purchased paperboard.
Milk cartons.
Sanitary food containers.
Egg cartons.
• Liquid packaging market is a substantial one.
I.e., water, soft drinks, dairy products, and fruit juices.
Single-serve, “grab-and-go” liquid cartons and containers driven by lifestyle/convenience trends.
• Paperboard cartons for liquid packaging face competition for various types of plastics, like PET.
• Top concerns for paperboard cartons esp. in food/liquid packaging is migration of chemicals and other materials.
• Food preservation top concern.
• Recyclability of food/liquid cartons is becoming of chief importance.
• These packages tend to be retail-ready vs. ecommerce type.
Brands utilize innovative designs/graphics to attract consumers.
• Functionality of these cartons is also important.
I.e., ease of opening for older consumers.
6
NAICS 32221
Key Terms and Definitions
Annual Survey of Manufactures (Source) - The Annual Survey of Manufactures (ASM) provides key intercensal measures of manufacturing activity, products, and
location for the public and private sectors. The ASM provides the best measure of current U.S. manufacturing industry
outputs, inputs, operating status, and is the primary basis for updates of the Longitudinal Research Database (LRD). Census
Bureau staff and academic researchers use the LRD for micro data analysis.
Statistics are available on a sample universe of manufacturing establishments with one or more paid employees at any time
during the year for manufacturing classified in NAICS sectors 31–33. Employment, payroll, hours, cost of materials, receipts,
value added, capital expenditures, and relative standard errors data are available for the U.S. and states at the 2- through 4-
digit NAICS levels. Product shipments value data are available at the 6-digit North American Industry Classification System
(NAICS) level and 7-digit NAICS product class levels based on NAICS.
The ASM is conducted annually, except for years ending in 2 and 7, at which time ASM data are included in the manufacturing
sector of the Economic Census.
Consolidated (or Combined) Statistical Area (CSA) - Consolidated Statistical Areas are a combination of metropolitan areas that have significant economic interaction and
dependency. PrintStats includes the top five CSAs in each report based on total population, without regard to the number of
industry establishments. These CSAs are very large, and in fact, larger than many countries. These are the details of their
composition:
• New York CSA is the combination of these Metropolitan and Micropolitan Statistical Areas: New York-Newark-
Jersey City, Bridgeport-Stamford-Norwalk, New Haven-Milford, Allentown-Bethlehem-Easton, Trenton,
Torrington, Kingston, East Stroudsburg
• Los Angeles CSA includes: Los Angeles-Long Beach-Anaheim, Riverside-San Bernardino-Ontario, Oxnard-
Thousand Oaks-Ventura
• Chicago CSA includes: Chicago-Naperville-Elgin, Ottawa-Peru, Kankakee, Michigan City-La Porte
• Washington D.C. CSA includes: Washington-Arlington-Alexandria, DC-VA-MD-WV, Baltimore-Columbia-
Towson, Hagerstown-Martinsburg, Chambersburg-Waynesboro, Winchester, California-Lexington Park, Easton,
Cambridge
• San Francisco CSA includes: San Francisco-Oakland-Hayward, San Jose-Sunnyvale-Santa Clara, Stockton-Lodi,
Santa Rosa, Vallejo-Fairfield, Santa Cruz-Watsonville, Napa
(see also Metropolitan Statistical Area)
Content Creation (Source) - The contribution of information to any medium/media, especially to digital media for an end-user/audience in specific
contexts. “Content” can be text, photographic images, illustrations, graphic design, video, or any other intellectual property.
Typical forms of modern content creation include maintaining and updating web sites, blogging, photography, videography,
online commentary, the maintenance of social media accounts, and editing and distribution of digital media.
County Business Patterns [CBP] (Source) - CBP is an annual series that provides subnational economic data by industry. This series includes the number of
establishments, employment during the week of March 12, first quarter payroll, and annual payroll.
7

NAICS 32221
Key Terms and Definitions (continued)
Demographics (Source) - The statistical characteristics of human populations (such as age or income) used especially to identify markets. In business, a
particular market or segment of the population.
Economic Census (Source) - The Economic Census is the U.S. Government's official five-year measure of American business and the economy. It is
conducted by the U.S. Census Bureau, and response is required by law.
Employee (Source) - An individual hired by another individual or business usually for wages or salary and in a position below the executive level.
Establishment (Source) - An establishment is a single physical location at which business is conducted or where services or industrial operations are
performed. It is not necessarily identical with a company or enterprise, which may consist of one or more establishments.
Estimate (Source) - A value that is usable for some purpose even if input data may be incomplete, uncertain, or unstable. The value is nonetheless
usable because it is derived from the best information available. Typically, deriving an estimate involves using the value of a
statistic derived from a sample to estimate the value of a corresponding population parameter. The sample provides
information that can be projected, through various formal or informal processes, to determine a range most likely to describe
the missing information.
Forecast (Source) - Forecasting is the use of historic data to determine the direction of future trends. Businesses use forecasting to determine
how to allocate their budgets or plan for anticipated expenses for an upcoming period of time. This is typically based on the
projected demand for the goods and services they offer.
In terms of PrintStats, the forecasts are limited to statistical trends based on past statistical data. They are not forecasts based
on industry surveys or assessment of economic, social, or technological changes. The PrintStats forecast data should be
viewed only as a starting point for a formal forecast process.
M3 Manufacturing Survey (Source) - The Manufacturers’ Shipments, Inventories, and Orders (M3) survey provides broad-based, monthly statistical data on
economic conditions in the domestic manufacturing sector. The survey measures current industrial activity and provides an
indication of future business trends.
Metropolitan Area (Source) - A metropolitan area, sometimes referred to as a metro area or commuter belt, is a region consisting of a densely populated
urban core and its less-populated surrounding territories, sharing industry, infrastructure, and housing. A metro area usually
comprises multiple jurisdictions and municipalities: neighborhoods, townships, boroughs, cities, towns, exurbs, suburbs,
counties, districts, states, and even nations like the eurodistricts. As social, economic, and political institutions have changed,
metropolitan areas have become key economic and political regions. Metropolitan areas include one or more urban areas, as
well as satellite cities, towns, and intervening rural areas that are socio-economically tied to the urban core, typically
measured by commuting patterns.
8

NAICS 32221
Key Terms and Definitions (continued)
Metropolitan Statistical Area [MSA] (Source) - In the United States, a metropolitan statistical area (MSA) is a geographical region with a relatively high population density at
its core and close economic ties throughout the area. Such regions are neither legally incorporated as a city or town would
be, nor are they legal administrative divisions like counties or separate entities such as states. As such, the precise definition
of any given metropolitan area can vary with the source. A typical metropolitan area is centered on a single large city that
wields substantial influence over the region (e.g., Chicago or Atlanta). However, some metropolitan areas contain more than
one large city with no single municipality holding a substantially dominant position (e.g., Dallas–Fort Worth metroplex,
Norfolk-Virginia Beach [Hampton Roads], Riverside–San Bernardino [Inland Empire], or Minneapolis–Saint Paul).
MSAs are defined by the Office of Management and Budget (OMB) and used by the Census Bureau and other Federal
government agencies for statistical purposes.
(See also Consolidated Statistical Area)
NAICS (Source) - The North American Industry Classification System (NAICS) is the standard used by Federal statistical agencies in classifying
business establishments for the purpose of collecting, analyzing, and publishing statistical data related to the U.S. business
economy.
Nonemployer Statistics (Source) - Nonemployer Statistics is an annual series that provides subnational economic data for businesses that have no paid
employees and are subject to Federal income tax. The data consist of the number of businesses and total receipts by industry.
Most nonemployers are self-employed individuals operating unincorporated businesses (known as sole proprietorships),
which may or may not be the owner's principal source of income.
The majority of all business establishments in the United States are nonemployers, yet these firms average less than 4
percent of all sales and receipts nationally. Due to their small economic impact, these firms are excluded from most other
Census Bureau business statistics (the primary exception being the Survey of Business Owners). The Nonemployers Statistics
series is the primary resource available to study the scope and activities of nonemployers at a detailed geographic level. For
complementary statistics on the firms that do have paid employees, refer to the County Business Patterns. Additional sources
of data on small businesses include the Economic Census, and the Statistics of U.S. Businesses.
Packaging (Source) - Packaging is the technology of enclosing or protecting products for distribution, storage, sale, and use. Packaging also refers
to the process of designing, evaluating, and producing packages. Packaging can be described as a coordinated system of
preparing goods for transport, warehousing, logistics, sale, and end use. In the graphic arts, packaging refers to the design,
manufacturing, and decoration (usually via printing and related technologies) of corrugated paperboard containers, folding
cardboard cartons and containers, paper bags, flexible plastic packaging, and other paper, paperboard, and plastic materials.
Payroll (Source) - Payroll is the sum total of all compensation a business must pay to its employees for a set period of time or on a given date.
Payroll is reported before deductions for social security, income tax, insurance, union dues, etc. This definition of payroll is
the same as that used by the Internal Revenue Service.
9
NAICS 32221
Key Terms and Definitions (continued)
Quarterly Census of Employment and Wages [QCEW] (Source) - The Quarterly Census of Employment and Wages (QCEW) program publishes a quarterly count of employment and wages
reported by employers covering more than 95 percent of U.S. jobs, available at the county, MSA, state, and national levels by
industry.
Quarterly Services Survey (Source) - The Quarterly Services Survey (QSS) is the only source of service industry indicator performance providing timely estimates
of revenue and expenses for selected service industries. The QSS is a principal economic indicator series that produces, for
selected service industries, quarterly estimates of total operating revenue and the percentage of revenue by class of
customer (government, business, consumers, and individuals). The survey also produces estimates of total operating
expenses from tax-exempt firms in industries that have a large not-for-profit component. In addition, for hospital services,
the survey estimates the number of inpatient days and discharges.
Region (Source) - Census Regions are groupings of states and the District of Columbia that subdivide the United States for the presentation of
Census data. There are four Census regions—Northeast, Midwest, South, and West. Each of the four Census regions is
divided into two or more Census divisions. Each Census region is identified by a single-digit Census code. Puerto Rico and
the Island Areas are not part of any Census region or Census division.
PrintStats uses eight regions based on industrial economic activity rather than the Census regions. The 50 U.S. states and
District of Columbia are allocated as follows:
• New England: Connecticut, Maine, Massachusetts, New Hampshire, Rhode Island, Vermont
• Mid-Eastern: Delaware, District of Columbia, Maryland, New Jersey, New York, Pennsylvania, West Virginia
• South Eastern: Alabama, Florida, Georgia, Kentucky, Mississippi, North Carolina, South Carolina, Tennessee,
Virginia
• Great Lakes: Illinois, Indiana, Michigan, Minnesota, Ohio, Wisconsin
• North Central: Idaho, Iowa, Kansas, Missouri, Montana, Nebraska, North Dakota, South Dakota, Wyoming
• South Central: Arkansas, Louisiana, Oklahoma, Texas
• South Western: Arizona, Colorado, Nevada, New Mexico, Utah
• Western: Alaska, California, Hawaii, Oregon, Washington
10
Paperboard Container Manufacturing (NAICS 32221)
Baseline data from County Business Patterns
This workbook contains the following datasheets (click to open)
Establishments 2015 (Summarized Size Classes)Establishments 2013 (Summarized Size Classes)Establishments 2015 Changes (Summarized Size Classes)Establishments 2015 (Detailed Size Classes)Establishments 2013 (Detailed Size Classes)Establishments 2015 Changes (Detailed Size Classes)Employees 2015 (Summarized Size Classes)Employees 2015 (Detailed Size Classes)Payrolls 2015 (Summarized Size Classes)Payrolls 2015 (Detailed Size Classes)Sales 2015 (Summarized Size Classes)Sales 2015 (Detailed Size Classes)Capital Expenditures 2015 (Summarized Size Classes)Capital Expenditures 2015 (Detailed Size Classes)Top 15 States 2015 Top 25 Metros 2015 Top 5 Major Metropolitan Areas (Combined Statistical Areas)Estimates and Statistical Trend 2016-2022
email: [email protected]
Produced exclusively for NPESCopyright 2017, Non-Routine LLC and Strategies for Management, Inc.
11
% of Total Region Rank and State Rank All Sizes Small: 1-9
Empls.Medium: 10-49
Empls.Large: >50+
Empls.
Avg. Employees/
Estab.
U.S. states + DC 100.0% - 2,035 335 724 976 70.9
New England 4.9% 7 100 25 40 35 47.9 Connecticut 1.2% 24 24 5 10 9 42.9 Maine 0.2% 40 5 1 1 3 66.2 Massachusetts 2.3% 17 47 11 18 18 57.0 New Hampshire 0.3% 38 6 2 4 20.5 Rhode Island 0.8% 29 17 6 6 5 35.0 Vermont 0.0% 45 1 1 34.0
Mid-Eastern 13.7% 3 279 55 104 120 66.7 Delaware 48 Washington DC 48 Maryland 0.8% 29 17 3 7 7 93.8 New Jersey 3.3% 13 67 19 22 26 53.4 New York 4.2% 7 85 13 34 38 68.9 Pennsylvania 5.3% 5 107 19 39 49 70.3 West Virginia 0.1% 41 3 1 2 22.7
South Eastern 22.9% 2 467 61 158 248 73.8 Alabama 1.6% 22 32 2 10 20 75.5 Florida 2.7% 15 55 13 22 20 54.8 Georgia 3.6% 11 74 11 29 34 63.5 Kentucky 2.1% 18 42 5 19 18 85.3 Mississippi 1.1% 25 23 2 9 12 63.7 North Carolina 4.5% 6 91 5 25 61 96.7 South Carolina 1.9% 19 39 6 11 22 71.8 Tennessee 3.7% 9 76 9 20 47 77.1 Virginia 1.7% 20 35 8 13 14 52.6
Great Lakes 27.8% 1 566 88 208 270 76.0 Illinois 6.6% 3 134 25 47 62 85.7 Indiana 3.7% 10 75 7 26 42 81.6 Michigan 4.1% 8 84 15 31 38 70.8 Minnesota 2.5% 16 50 7 20 23 72.8 Ohio 7.5% 2 152 25 59 68 62.1 Wisconsin 3.5% 12 71 9 25 37 89.9
North Central 5.7% 6 117 13 44 60 77.0 Idaho 0.3% 38 6 1 2 3 76.0 Iowa 1.1% 26 22 2 7 13 74.1 Kansas 0.4% 36 8 1 3 4 76.6 Missouri 3.0% 14 61 8 25 28 71.7 Montana 0.0% 45 1 1 33.0 Nebraska 0.4% 35 9 2 7 127.1 North Dakota 0.1% 44 2 1 1 39.5 South Dakota 0.4% 36 8 4 4 85.5 Wyoming 48
South Central 9.7% 5 197 35 75 87 66.9 Arkansas 1.3% 23 27 1 14 12 89.6 Louisiana 1.0% 28 20 1 8 11 79.2 Oklahoma 0.8% 32 16 4 7 5 48.1 Texas 6.6% 3 134 29 46 59 62.7
South Western 2.5% 8 51 11 18 22 56.4 Arizona 0.6% 33 12 1 5 6 64.0 Colorado 1.0% 27 21 7 6 8 40.3 Nevada 0.1% 41 3 2 1 44.7 New Mexico 0.1% 41 3 1 1 1 35.7 Utah 0.6% 33 12 2 4 6 85.2
Western 12.7% 4 258 47 77 134 70.7 Alaska 48 California 10.1% 1 206 40 63 103 69.9 Hawaii 0.0% 45 1 1 7.0 Oregon 0.8% 29 17 3 6 8 59.9 Washington 1.7% 21 34 3 8 23 83.4
US States + District of Columbia Ranked by Number of
Establishments
Paperboard Container Manufacturing (NAICS 32221), 2015Number of Establishments
12

% of Total Region Rank and State Rank All Sizes Small: 1-9
Empls.Medium: 10-49
Empls.Large: >50+
Empls.
Avg. Employees/
Estab.
U.S. states + DC 100.0% - 2,088 347 788 953 66.4
New England 5.0% 7 104 22 43 39 48.4 Connecticut 1.3% 24 27 6 11 10 42.7 Maine 0.2% 40 4 1 3 78.0 Massachusetts 2.4% 17 50 10 18 22 57.2 New Hampshire 0.3% 38 7 2 5 19.7 Rhode Island 0.7% 31 15 4 7 4 35.6 Vermont 0.0% 45 1 1 33.0
Mid-Eastern 14.1% 3 294 57 112 125 62.9 Delaware 0.0% 45 1 1 75.0 Washington DC 49 Maryland 0.9% 29 18 4 7 7 84.2 New Jersey 3.2% 13 67 17 26 24 49.3 New York 4.4% 7 91 15 33 43 66.0 Pennsylvania 5.5% 5 114 19 45 50 66.3 West Virginia 0.1% 41 3 2 1 14.0
South Eastern 22.9% 2 478 58 180 240 70.6 Alabama 1.6% 21 33 1 16 16 71.4 Florida 2.6% 15 55 8 26 21 53.4 Georgia 3.8% 9 79 8 32 39 66.7 Kentucky 2.1% 19 43 5 17 21 78.8 Mississippi 1.1% 25 24 2 12 10 57.3 North Carolina 4.5% 6 93 8 28 57 86.3 South Carolina 2.2% 18 45 7 15 23 70.6 Tennessee 3.4% 12 71 11 22 38 75.8 Virginia 1.7% 20 35 8 12 15 52.0
Great Lakes 28.2% 1 588 98 240 250 68.6 Illinois 6.5% 3 136 23 55 58 81.1 Indiana 3.8% 9 79 10 32 37 72.8 Michigan 4.3% 8 90 15 39 36 59.5 Minnesota 2.6% 16 54 9 21 24 66.8 Ohio 7.3% 2 153 29 65 59 55.5 Wisconsin 3.6% 11 76 12 28 36 80.0
North Central 5.5% 6 115 19 39 57 74.8 Idaho 0.3% 39 6 3 3 78.5 Iowa 1.1% 26 22 4 7 11 77.5 Kansas 0.4% 35 9 1 4 4 67.8 Missouri 2.7% 14 57 11 20 26 71.8 Montana 0.0% 45 1 1 33.0 Nebraska 0.4% 35 9 1 8 107.1 North Dakota 0.1% 44 2 1 1 41.0 South Dakota 0.4% 35 9 2 3 4 71.0 Wyoming 49
South Central 9.3% 5 194 33 75 86 60.7 Arkansas 1.4% 23 29 2 18 9 74.2 Louisiana 1.0% 28 20 2 9 9 72.6 Oklahoma 0.7% 31 15 4 6 5 43.9 Texas 6.2% 4 130 25 42 63 57.8
South Western 2.5% 8 53 10 20 23 55.9 Arizona 0.6% 33 13 2 4 7 64.1 Colorado 1.0% 27 21 4 9 8 47.1 Nevada 0.1% 41 3 2 1 39.7 New Mexico 0.1% 41 3 1 1 1 30.3 Utah 0.6% 33 13 3 4 6 71.5
Western 12.5% 4 262 50 79 133 67.2 Alaska 49 California 10.1% 1 211 42 64 105 66.1 Hawaii 0.0% 45 1 1 7.0 Oregon 0.8% 30 17 4 6 7 59.4 Washington 1.6% 21 33 3 9 21 80.5
US States + District of Columbia Ranked by Number of
Establishments
Paperboard Container Manufacturing (NAICS 32221), 2013Number of Establishments
13

Region Rank and State Rank All Sizes Small: 1-9
Empls.Medium: 10-49
Empls.Large: >50+
Empls.
Avg. Employees/
Estab.
U.S. states + DC - (53) (12) (64) 23 4.4
New England 4 (4) 3 (3) (4) (0.5)Connecticut 8 (3) (1) (1) (1) 0.1 Maine 4 1 1 (11.8)Massachusetts 9 (3) 1 (4) (0.2)New Hampshire 6 (1) (1) 0.8 Rhode Island 3 2 2 (1) 1 (0.6)Vermont 5 1.0
Mid-Eastern 6 (15) (2) (8) (5) 3.8 Delaware 7 (1) (1) (75.0)Washington DC 6 Maryland 7 (1) (1) 9.5 New Jersey 6 2 (4) 2 4.1 New York 11 (6) (2) 1 (5) 2.9 Pennsylvania 12 (7) (6) (1) 4.0 West Virginia 6 (1) 1 8.7
South Eastern 5 (11) 3 (22) 8 3.3 Alabama 7 (1) 1 (6) 4 4.1 Florida 6 5 (4) (1) 1.4 Georgia 10 (5) 3 (3) (5) (3.2)Kentucky 7 (1) 2 (3) 6.5 Mississippi 7 (1) (3) 2 6.5 North Carolina 7 (2) (3) (3) 4 10.4 South Carolina 12 (6) (1) (4) (1) 1.2 Tennessee 1 5 (2) (2) 9 1.3 Virginia 6 1 (1) 0.6
Great Lakes 7 (22) (10) (32) 20 7.4 Illinois 8 (2) 2 (8) 4 4.6 Indiana 9 (4) (3) (6) 5 8.8 Michigan 12 (6) (8) 2 11.2 Minnesota 10 (4) (2) (1) (1) 6.1 Ohio 7 (1) (4) (6) 9 6.5 Wisconsin 11 (5) (3) (3) 1 9.9
North Central 2 2 (6) 5 3 2.3 Idaho 6 1 (1) (2.5)Iowa 6 (2) 2 (3.4)Kansas 7 (1) (1) 8.8 Missouri 2 4 (3) 5 2 (0.2)Montana 6 Nebraska 6 1 (1) 20.0 North Dakota 6 (1.5)South Dakota 7 (1) (2) 1 14.5 Wyoming 6
South Central 1 3 2 1 6.1 Arkansas 8 (2) (1) (4) 3 15.4 Louisiana 6 (1) (1) 2 6.7 Oklahoma 5 1 1 4.3 Texas 3 4 4 4 (4) 4.8
South Western 3 (2) 1 (2) (1) 0.5 Arizona 7 (1) (1) 1 (1) (0.1)Colorado 6 3 (3) (6.8)Nevada 6 5.0 New Mexico 6 5.3 Utah 7 (1) (1) 13.6
Western 5 (4) (3) (2) 1 3.5 Alaska 6 California 11 (5) (2) (1) (2) 3.8 Hawaii 6 Oregon 6 (1) 1 0.5 Washington 5 1 (1) 2 2.9
US States + District of Columbia Ranked by Change in Number of
Establishments
Paperboard Container Manufacturing (NAICS 32221), 2015Change in Number of Establishments
14

% of TotalRegion Rank
and State Rank
All Sizes 1-4Empls.
5-9 Empls.
10-19Empls.
20-49Empls.
50-99Empls.
100-249Empls.
250-499Empls.
500+Empls.
Avg. Employees/
Estab.
U.S. states + DC 100.0% - 2,035 210 125 214 510 428 482 57 9 70.9
New England 4.9% 7 100 16 9 10 30 21 13 1 47.9 Connecticut 1.2% 24 24 2 3 2 8 7 2 42.9 Maine 0.2% 40 5 1 1 2 1 66.2 Massachusetts 2.3% 17 47 9 2 7 11 7 10 1 57.0 New Hampshire 0.3% 38 6 1 1 1 3 20.5 Rhode Island 0.8% 29 17 4 2 6 5 35.0 Vermont 0.0% 45 1 1 34.0
Mid-Eastern 13.7% 3 279 31 24 35 69 52 58 9 1 66.7 Delaware 48 Washington DC 48 Maryland 0.8% 29 17 3 4 3 1 5 1 93.8 New Jersey 3.3% 13 67 14 5 7 15 11 14 1 53.4 New York 4.2% 7 85 5 8 15 19 18 16 4 68.9 Pennsylvania 5.3% 5 107 8 11 9 30 22 23 4 70.3 West Virginia 0.1% 41 3 1 2 22.7
South Eastern 22.9% 2 467 33 28 40 118 119 114 14 1 73.8 Alabama 1.6% 22 32 2 1 9 12 7 1 75.5 Florida 2.7% 15 55 10 3 9 13 9 10 1 54.8 Georgia 3.6% 11 74 4 7 8 21 19 13 2 63.5 Kentucky 2.1% 18 42 3 2 4 15 4 11 3 85.3 Mississippi 1.1% 25 23 1 1 1 8 7 5 63.7 North Carolina 4.5% 6 91 2 3 5 20 29 26 5 1 96.7 South Carolina 1.9% 19 39 4 2 2 9 12 9 1 71.8 Tennessee 3.7% 9 76 4 5 8 12 20 26 1 77.1 Virginia 1.7% 20 35 3 5 2 11 7 7 52.6
Great Lakes 27.8% 1 566 63 25 65 143 113 131 20 6 76.0 Illinois 6.6% 3 134 20 5 14 33 24 32 4 2 85.7 Indiana 3.7% 10 75 3 4 6 20 19 19 3 1 81.6 Michigan 4.1% 8 84 11 4 13 18 17 17 3 1 70.8 Minnesota 2.5% 16 50 6 1 7 13 6 15 2 72.8 Ohio 7.5% 2 152 17 8 18 41 35 29 3 1 62.1 Wisconsin 3.5% 12 71 6 3 7 18 12 19 5 1 89.9
North Central 5.7% 6 117 7 6 12 32 22 34 4 77.0 Idaho 0.3% 38 6 1 1 1 3 76.0 Iowa 1.1% 26 22 2 2 5 5 8 74.1 Kansas 0.4% 36 8 1 1 2 2 2 76.6 Missouri 3.0% 14 61 5 3 6 19 13 12 3 71.7 Montana 0.0% 45 1 1 33.0 Nebraska 0.4% 35 9 1 1 1 5 1 127.1 North Dakota 0.1% 44 2 1 1 39.5 South Dakota 0.4% 36 8 1 3 4 85.5 Wyoming 48
South Central 9.7% 5 197 21 14 20 55 34 48 4 1 66.9 Arkansas 1.3% 23 27 1 5 9 4 5 3 89.6 Louisiana 1.0% 28 20 1 2 6 4 6 1 79.2 Oklahoma 0.8% 32 16 1 3 1 6 2 3 48.1 Texas 6.6% 3 134 19 10 12 34 24 34 1 62.7
South Western 2.5% 8 51 8 3 7 11 9 13 56.4 Arizona 0.6% 33 12 1 3 2 1 5 64.0 Colorado 1.0% 27 21 5 2 4 2 5 3 40.3 Nevada 0.1% 41 3 2 1 44.7 New Mexico 0.1% 41 3 1 1 1 35.7 Utah 0.6% 33 12 2 4 1 5 85.2
Western 12.7% 4 258 31 16 25 52 58 71 5 70.7 Alaska 48 California 10.1% 1 206 28 12 18 45 44 54 5 69.9 Hawaii 0.0% 45 1 1 7.0 Oregon 0.8% 29 17 1 2 3 3 4 4 59.9 Washington 1.7% 21 34 2 1 4 4 10 13 83.4
US States + District of Columbia Ranked by Number of
Establishments
Paperboard Container Manufacturing (NAICS 32221), 2015Number of Establishments
15
% of TotalRegion Rank
and State Rank
All Sizes 1-4Empls.
5-9 Empls.
10-19Empls.
20-49Empls.
50-99Empls.
100-249Empls.
250-499Empls.
500+Empls.
Avg. Employees/
Estab.
U.S. states + DC 100.0% - 2,088 201 146 245 543 445 454 48 6 66.4
New England 5.0% 7 104 12 10 11 32 24 14 1 48.4 Connecticut 1.3% 24 27 2 4 3 8 7 3 42.7 Maine 0.2% 40 4 1 2 1 78.0 Massachusetts 2.4% 17 50 7 3 6 12 11 10 1 57.2 New Hampshire 0.3% 38 7 1 1 2 3 19.7 Rhode Island 0.7% 31 15 2 2 7 4 35.6 Vermont 0.0% 45 1 1 33.0
Mid-Eastern 14.1% 3 294 32 25 39 73 62 55 6 2 62.9 Delaware 0.0% 45 1 1 75.0 Washington DC 49 Maryland 0.9% 29 18 3 1 3 4 1 5 1 84.2 New Jersey 3.2% 13 67 11 6 6 20 12 12 49.3 New York 4.4% 7 91 8 7 15 18 25 14 3 1 66.0 Pennsylvania 5.5% 5 114 9 10 15 30 23 24 3 66.3 West Virginia 0.1% 41 3 1 1 1 14.0
South Eastern 22.9% 2 478 32 26 49 131 113 113 14 70.6 Alabama 1.6% 21 33 1 1 15 7 8 1 71.4 Florida 2.6% 15 55 6 2 11 15 12 8 1 53.4 Georgia 3.8% 9 79 4 4 9 23 22 15 2 66.7 Kentucky 2.1% 19 43 4 1 5 12 7 12 2 78.8 Mississippi 1.1% 25 24 1 1 3 9 7 3 57.3 North Carolina 4.5% 6 93 4 4 8 20 23 28 6 86.3 South Carolina 2.2% 18 45 4 3 2 13 12 10 1 70.6 Tennessee 3.4% 12 71 5 6 7 15 15 22 1 75.8 Virginia 1.7% 20 35 3 5 3 9 8 7 52.0
Great Lakes 28.2% 1 588 58 40 76 164 117 115 14 4 68.6 Illinois 6.5% 3 136 16 7 16 39 25 28 2 3 81.1 Indiana 3.8% 9 79 3 7 8 24 19 15 3 72.8 Michigan 4.3% 8 90 8 7 13 26 19 15 2 59.5 Minnesota 2.6% 16 54 6 3 7 14 10 14 66.8 Ohio 7.3% 2 153 17 12 27 38 31 25 2 1 55.5 Wisconsin 3.6% 11 76 8 4 5 23 13 18 5 80.0
North Central 5.5% 6 115 8 11 11 28 15 39 3 74.8 Idaho 0.3% 39 6 2 1 3 78.5 Iowa 1.1% 26 22 4 7 2 9 77.5 Kansas 0.4% 35 9 1 2 2 2 2 67.8 Missouri 2.7% 14 57 7 4 5 15 8 15 3 71.8 Montana 0.0% 45 1 1 33.0 Nebraska 0.4% 35 9 1 2 6 107.1 North Dakota 0.1% 44 2 1 1 41.0 South Dakota 0.4% 35 9 1 1 1 2 4 71.0 Wyoming 49
South Central 9.3% 5 194 20 13 19 56 40 41 5 60.7 Arkansas 1.4% 23 29 1 1 5 13 2 4 3 74.2 Louisiana 1.0% 28 20 2 1 8 3 5 1 72.6 Oklahoma 0.7% 31 15 3 1 6 4 1 43.9 Texas 6.2% 4 130 14 11 13 29 31 31 1 57.8
South Western 2.5% 8 53 7 3 11 9 11 12 55.9 Arizona 0.6% 33 13 1 1 3 1 2 5 64.1 Colorado 1.0% 27 21 3 1 5 4 6 2 47.1 Nevada 0.1% 41 3 1 1 1 39.7 New Mexico 0.1% 41 3 1 1 1 30.3 Utah 0.6% 33 13 2 1 1 3 1 5 71.5
Western 12.5% 4 262 32 18 29 50 63 65 5 67.2 Alaska 49 California 10.1% 1 211 29 13 24 40 52 48 5 66.1 Hawaii 0.0% 45 1 1 7.0 Oregon 0.8% 30 17 2 2 3 3 2 5 59.4 Washington 1.6% 21 33 1 2 2 7 9 12 80.5
US States + District of Columbia Ranked by Number of
Establishments
Paperboard Container Manufacturing (NAICS 32221), 2013Number of Establishments
16
Region Rank and State Rank All Sizes 1-4
Empls.5-9
Empls.10-19
Empls.20-49
Empls.50-99
Empls.100-249Empls.
250-499Empls.
500+Empls.
Avg. Employees/
Estab.
U.S. states + DC - (53) 9 (21) (31) (33) (17) 28 9 3 4.4
New England 4 (4) 4 (1) (1) (2) (3) (1) (0.5)Connecticut 8 (3) (1) (1) (1) 0.1 Maine 4 1 1 (11.8)Massachusetts 9 (3) 2 (1) 1 (1) (4) (0.2)New Hampshire 6 (1) (1) 0.8 Rhode Island 3 2 2 (1) 1 (0.6)Vermont 5 1.0
Mid-Eastern 6 (15) (1) (1) (4) (4) (10) 3 3 (1) 3.8 Delaware 7 (1) (1) (75.0)Washington DC 6 Maryland 7 (1) (1) 1 (1) 9.5 New Jersey 6 3 (1) 1 (5) (1) 2 1 4.1 New York 11 (6) (3) 1 1 (7) 2 1 (1) 2.9 Pennsylvania 12 (7) (1) 1 (6) (1) (1) 1 4.0 West Virginia 6 (1) 1 8.7
South Eastern 5 (11) 1 2 (9) (13) 6 1 1 3.3 Alabama 7 (1) 1 (6) 5 (1) 4.1 Florida 6 4 1 (2) (2) (3) 2 1.4 Georgia 10 (5) 3 (1) (2) (3) (2) (3.2)Kentucky 7 (1) (1) 1 (1) 3 (3) (1) 1 6.5 Mississippi 7 (1) (2) (1) 2 6.5 North Carolina 7 (2) (2) (1) (3) 6 (2) (1) 1 10.4 South Carolina 12 (6) (1) (4) (1) 1.2 Tennessee 1 5 (1) (1) 1 (3) 5 4 1.3 Virginia 6 (1) 2 (1) 0.6
Great Lakes 7 (22) 5 (15) (11) (21) (4) 16 6 2 7.4 Illinois 8 (2) 4 (2) (2) (6) (1) 4 2 (1) 4.6 Indiana 9 (4) (3) (2) (4) 4 1 8.8 Michigan 12 (6) 3 (3) (8) (2) 2 1 1 11.2 Minnesota 10 (4) (2) (1) (4) 1 2 6.1 Ohio 7 (1) (4) (9) 3 4 4 1 6.5 Wisconsin 11 (5) (2) (1) 2 (5) (1) 1 1 9.9
North Central 2 2 (1) (5) 1 4 7 (5) 1 2.3 Idaho 6 1 (1) (2.5)Iowa 6 2 (4) 2 (2) 3 (1) (3.4)Kansas 7 (1) (1) 8.8 Missouri 2 4 (2) (1) 1 4 5 (3) (0.2)Montana 6 Nebraska 6 1 (1) (1) 1 20.0 North Dakota 6 (1.5)South Dakota 7 (1) (1) (1) 1 14.5 Wyoming 6
South Central 1 3 1 1 1 (1) (6) 7 (1) 1 6.1 Arkansas 8 (2) (1) (4) 2 1 15.4 Louisiana 6 (2) 1 1 (2) 1 1 6.7 Oklahoma 5 1 (2) 2 1 (2) 2 4.3 Texas 3 4 5 (1) (1) 5 (7) 3 (1) 1 4.8
South Western 3 (2) 1 (4) 2 (2) 1 0.5 Arizona 7 (1) (1) 1 (1) (0.1)Colorado 6 2 1 (1) (2) (1) 1 (6.8)Nevada 6 (1) 1 5.0 New Mexico 6 (1) 1 5.3 Utah 7 (1) (1) (1) 1 13.6
Western 5 (4) (1) (2) (4) 2 (5) 6 3.5 Alaska 6 California 11 (5) (1) (1) (6) 5 (8) 6 3.8 Hawaii 6 Oregon 6 (1) 2 (1) 0.5 Washington 5 1 1 (1) 2 (3) 1 1 2.9
US States + District of Columbia Ranked by Change in Number of
Establishments
Paperboard Container Manufacturing (NAICS 32221), 2015Change in Number of Establishments
17
% of Total Region Rank and State Rank All Sizes Small: 1-9
Empls.Medium: 10-49
Empls.Large: >50+
Empls.
U.S. states + DC 100.0% - 144,200 1,207 19,733 123,260
New England 3.3% 7 4,792 91 1,128 3,573 Connecticut 0.7% 29 1,029 21 279 729 Maine 0.2% 39 331 7 31 293 Massachusetts 1.9% 20 2,680 30 478 2,171 New Hampshire 0.1% 41 123 8 115 Rhode Island 0.4% 37 595 24 191 380 Vermont 0.0% 45 34 34
Mid-Eastern 12.9% 3 18,615 217 2,724 15,674 Delaware 48 Washington DC 48 Maryland 1.1% 25 1,594 6 165 1,423 New Jersey 2.5% 16 3,578 50 561 2,967 New York 4.1% 11 5,858 72 809 4,977 Pennsylvania 5.2% 6 7,517 87 1,122 6,308 West Virginia 0.0% 44 68 2 66
South Eastern 23.9% 2 34,483 235 4,369 29,879 Alabama 1.7% 22 2,416 3 273 2,140 Florida 2.1% 17 3,014 30 570 2,414 Georgia 3.3% 12 4,702 59 834 3,809 Kentucky 2.5% 15 3,583 19 553 3,011 Mississippi 1.0% 27 1,466 7 281 1,178 North Carolina 6.1% 4 8,802 21 704 8,077 South Carolina 1.9% 19 2,800 23 318 2,459 Tennessee 4.1% 10 5,859 37 477 5,344 Virginia 1.3% 23 1,841 36 358 1,447
Great Lakes 29.8% 1 43,021 265 5,664 37,093 Illinois 8.0% 2 11,487 62 1,347 10,079 Indiana 4.2% 8 6,123 28 757 5,338 Michigan 4.1% 9 5,944 48 787 5,108 Minnesota 2.5% 14 3,642 12 499 3,131 Ohio 6.5% 3 9,439 84 1,609 7,746 Wisconsin 4.4% 7 6,386 30 665 5,691
North Central 6.2% 6 9,011 48 1,205 7,758 Idaho 0.3% 38 456 7 48 401 Iowa 1.1% 24 1,630 3 197 1,430 Kansas 0.4% 36 613 7 83 523 Missouri 3.0% 13 4,372 25 700 3,647 Montana 0.0% 46 33 33 Nebraska 0.8% 28 1,144 45 1,099 North Dakota 0.1% 43 79 7 72 South Dakota 0.5% 35 684 99 585 Wyoming 48
South Central 9.1% 5 13,173 138 2,047 10,988 Arkansas 1.7% 21 2,419 2 404 2,013 Louisiana 1.1% 26 1,584 5 187 1,392 Oklahoma 0.5% 33 770 19 218 534 Texas 5.8% 5 8,400 112 1,239 7,049
South Western 2.0% 8 2,878 30 456 2,392 Arizona 0.5% 34 768 6 102 660 Colorado 0.6% 32 847 18 114 715 Nevada 0.1% 40 134 64 70 New Mexico 0.1% 42 107 2 33 72 Utah 0.7% 30 1,022 4 143 875
Western 12.7% 4 18,252 181 2,132 15,939 Alaska 48 California 10.0% 1 14,393 146 1,794 12,453 Hawaii 0.0% 47 7 7 Oregon 0.7% 31 1,018 16 140 862 Washington 2.0% 18 2,834 12 199 2,623
US States + District of Columbia Ranked by Number of Employees
Paperboard Container Manufacturing (NAICS 32221), 2015Number of Employees
18
% of Total Region Rank and State Rank All Sizes 1-4
Empls.5-9
Empls.10-19
Empls.20-49
Empls.50-99
Empls.100-249Empls.
250-499Empls.
500+Empls.
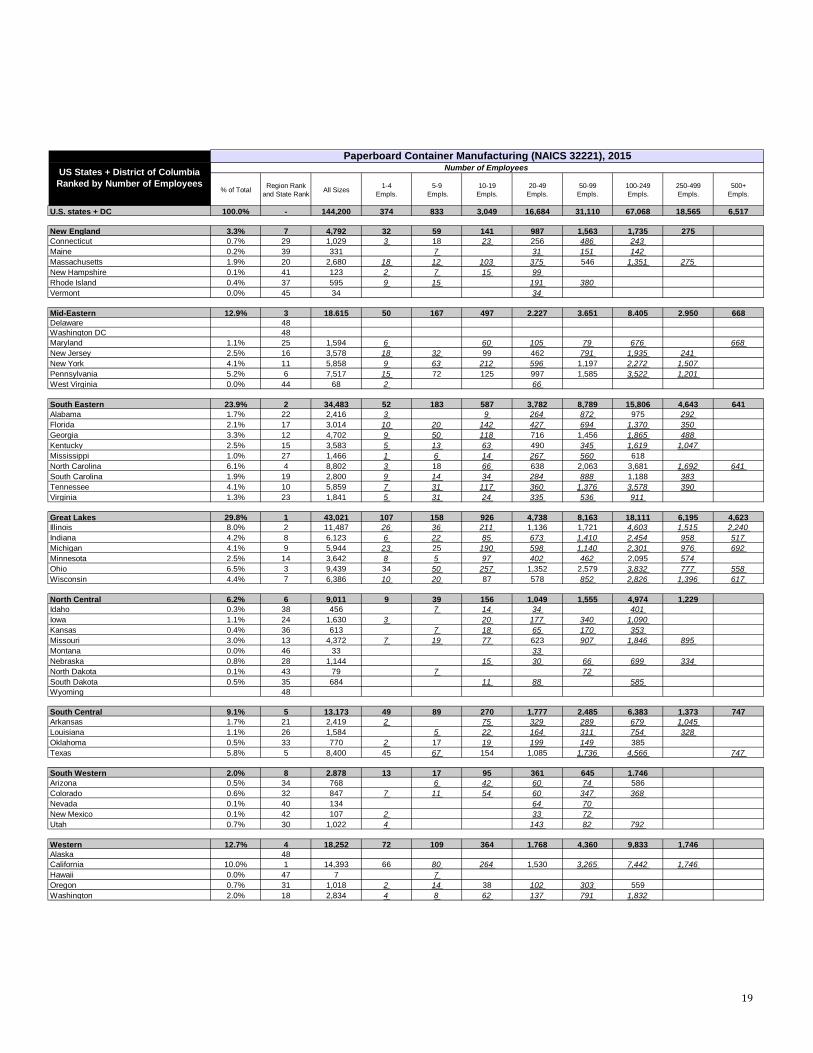
U.S. states + DC 100.0% - 144,200 374 833 3,049 16,684 31,110 67,068 18,565 6,517
New England 3.3% 7 4,792 32 59 141 987 1,563 1,735 275 Connecticut 0.7% 29 1,029 3 18 23 256 486 243 Maine 0.2% 39 331 7 31 151 142 Massachusetts 1.9% 20 2,680 18 12 103 375 546 1,351 275 New Hampshire 0.1% 41 123 2 7 15 99 Rhode Island 0.4% 37 595 9 15 191 380 Vermont 0.0% 45 34 34
Mid-Eastern 12.9% 3 18,615 50 167 497 2,227 3,651 8,405 2,950 668 Delaware 48 Washington DC 48 Maryland 1.1% 25 1,594 6 60 105 79 676 668 New Jersey 2.5% 16 3,578 18 32 99 462 791 1,935 241 New York 4.1% 11 5,858 9 63 212 596 1,197 2,272 1,507 Pennsylvania 5.2% 6 7,517 15 72 125 997 1,585 3,522 1,201 West Virginia 0.0% 44 68 2 66
South Eastern 23.9% 2 34,483 52 183 587 3,782 8,789 15,806 4,643 641 Alabama 1.7% 22 2,416 3 9 264 872 975 292 Florida 2.1% 17 3,014 10 20 142 427 694 1,370 350 Georgia 3.3% 12 4,702 9 50 118 716 1,456 1,865 488 Kentucky 2.5% 15 3,583 5 13 63 490 345 1,619 1,047 Mississippi 1.0% 27 1,466 1 6 14 267 560 618 North Carolina 6.1% 4 8,802 3 18 66 638 2,063 3,681 1,692 641 South Carolina 1.9% 19 2,800 9 14 34 284 888 1,188 383 Tennessee 4.1% 10 5,859 7 31 117 360 1,376 3,578 390 Virginia 1.3% 23 1,841 5 31 24 335 536 911
Great Lakes 29.8% 1 43,021 107 158 926 4,738 8,163 18,111 6,195 4,623 Illinois 8.0% 2 11,487 26 36 211 1,136 1,721 4,603 1,515 2,240 Indiana 4.2% 8 6,123 6 22 85 673 1,410 2,454 958 517 Michigan 4.1% 9 5,944 23 25 190 598 1,140 2,301 976 692 Minnesota 2.5% 14 3,642 8 5 97 402 462 2,095 574 Ohio 6.5% 3 9,439 34 50 257 1,352 2,579 3,832 777 558 Wisconsin 4.4% 7 6,386 10 20 87 578 852 2,826 1,396 617
North Central 6.2% 6 9,011 9 39 156 1,049 1,555 4,974 1,229 Idaho 0.3% 38 456 7 14 34 401 Iowa 1.1% 24 1,630 3 20 177 340 1,090 Kansas 0.4% 36 613 7 18 65 170 353 Missouri 3.0% 13 4,372 7 19 77 623 907 1,846 895 Montana 0.0% 46 33 33 Nebraska 0.8% 28 1,144 15 30 66 699 334 North Dakota 0.1% 43 79 7 72 South Dakota 0.5% 35 684 11 88 585 Wyoming 48
South Central 9.1% 5 13,173 49 89 270 1,777 2,485 6,383 1,373 747 Arkansas 1.7% 21 2,419 2 75 329 289 679 1,045 Louisiana 1.1% 26 1,584 5 22 164 311 754 328 Oklahoma 0.5% 33 770 2 17 19 199 149 385 Texas 5.8% 5 8,400 45 67 154 1,085 1,736 4,566 747
South Western 2.0% 8 2,878 13 17 95 361 645 1,746 Arizona 0.5% 34 768 6 42 60 74 586 Colorado 0.6% 32 847 7 11 54 60 347 368 Nevada 0.1% 40 134 64 70 New Mexico 0.1% 42 107 2 33 72 Utah 0.7% 30 1,022 4 143 82 792
Western 12.7% 4 18,252 72 109 364 1,768 4,360 9,833 1,746 Alaska 48 California 10.0% 1 14,393 66 80 264 1,530 3,265 7,442 1,746 Hawaii 0.0% 47 7 7 Oregon 0.7% 31 1,018 2 14 38 102 303 559 Washington 2.0% 18 2,834 4 8 62 137 791 1,832
US States + District of Columbia Ranked by Number of Employees
Paperboard Container Manufacturing (NAICS 32221), 2015Number of Employees
19
% of Total Region Rank and State Rank All Sizes Small: 1-9
Empls.Medium: 10-49
Empls.Large: >50+
Empls.
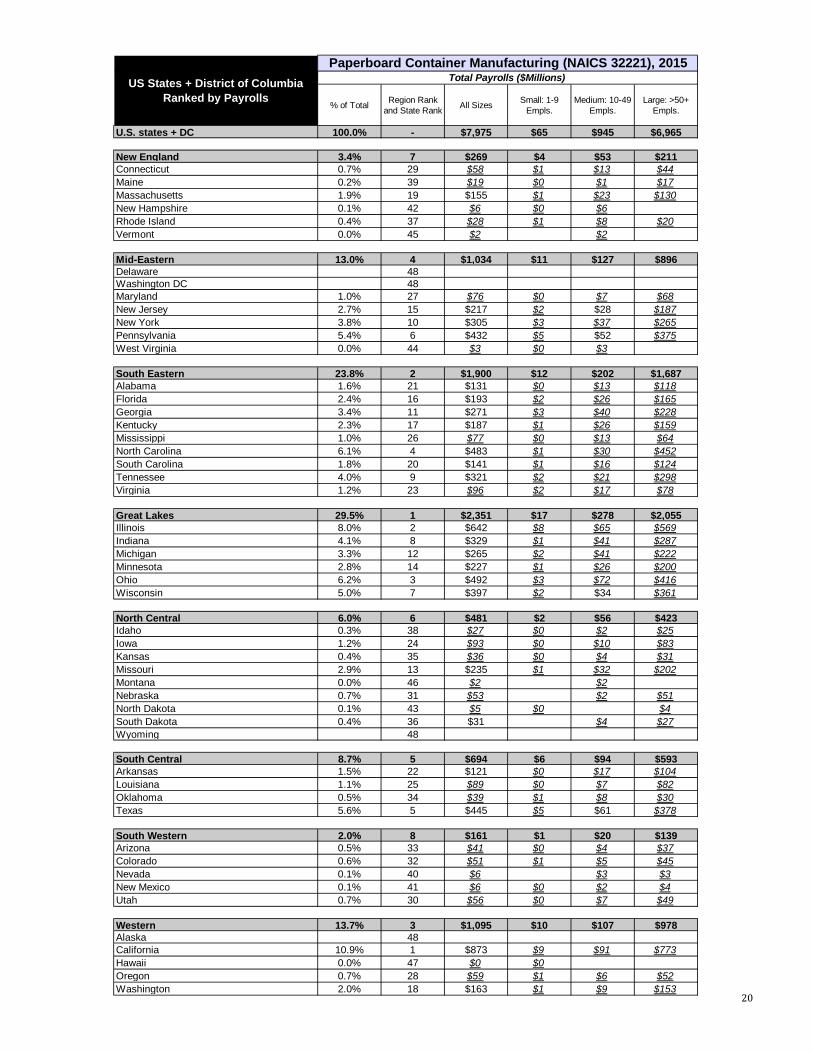
U.S. states + DC 100.0% - $7,975 $65 $945 $6,965
New England 3.4% 7 $269 $4 $53 $211Connecticut 0.7% 29 $58 $1 $13 $44Maine 0.2% 39 $19 $0 $1 $17Massachusetts 1.9% 19 $155 $1 $23 $130New Hampshire 0.1% 42 $6 $0 $6Rhode Island 0.4% 37 $28 $1 $8 $20Vermont 0.0% 45 $2 $2
Mid-Eastern 13.0% 4 $1,034 $11 $127 $896Delaware 48 Washington DC 48 Maryland 1.0% 27 $76 $0 $7 $68New Jersey 2.7% 15 $217 $2 $28 $187New York 3.8% 10 $305 $3 $37 $265Pennsylvania 5.4% 6 $432 $5 $52 $375West Virginia 0.0% 44 $3 $0 $3
South Eastern 23.8% 2 $1,900 $12 $202 $1,687Alabama 1.6% 21 $131 $0 $13 $118Florida 2.4% 16 $193 $2 $26 $165Georgia 3.4% 11 $271 $3 $40 $228Kentucky 2.3% 17 $187 $1 $26 $159Mississippi 1.0% 26 $77 $0 $13 $64North Carolina 6.1% 4 $483 $1 $30 $452South Carolina 1.8% 20 $141 $1 $16 $124Tennessee 4.0% 9 $321 $2 $21 $298Virginia 1.2% 23 $96 $2 $17 $78
Great Lakes 29.5% 1 $2,351 $17 $278 $2,055Illinois 8.0% 2 $642 $8 $65 $569Indiana 4.1% 8 $329 $1 $41 $287Michigan 3.3% 12 $265 $2 $41 $222Minnesota 2.8% 14 $227 $1 $26 $200Ohio 6.2% 3 $492 $3 $72 $416Wisconsin 5.0% 7 $397 $2 $34 $361
North Central 6.0% 6 $481 $2 $56 $423Idaho 0.3% 38 $27 $0 $2 $25Iowa 1.2% 24 $93 $0 $10 $83Kansas 0.4% 35 $36 $0 $4 $31Missouri 2.9% 13 $235 $1 $32 $202Montana 0.0% 46 $2 $2Nebraska 0.7% 31 $53 $2 $51North Dakota 0.1% 43 $5 $0 $4South Dakota 0.4% 36 $31 $4 $27Wyoming 48
South Central 8.7% 5 $694 $6 $94 $593Arkansas 1.5% 22 $121 $0 $17 $104Louisiana 1.1% 25 $89 $0 $7 $82Oklahoma 0.5% 34 $39 $1 $8 $30Texas 5.6% 5 $445 $5 $61 $378
South Western 2.0% 8 $161 $1 $20 $139Arizona 0.5% 33 $41 $0 $4 $37Colorado 0.6% 32 $51 $1 $5 $45Nevada 0.1% 40 $6 $3 $3New Mexico 0.1% 41 $6 $0 $2 $4Utah 0.7% 30 $56 $0 $7 $49
Western 13.7% 3 $1,095 $10 $107 $978Alaska 48 California 10.9% 1 $873 $9 $91 $773Hawaii 0.0% 47 $0 $0Oregon 0.7% 28 $59 $1 $6 $52Washington 2.0% 18 $163 $1 $9 $153
US States + District of Columbia Ranked by Payrolls
Paperboard Container Manufacturing (NAICS 32221), 2015Total Payrolls ($Millions)
20
% of Total Region Rank and State Rank All Sizes 1-4
Empls.5-9
Empls.10-19
Empls.20-49
Empls.50-99
Empls.100-249Empls.
250-499Empls.
500+Empls.
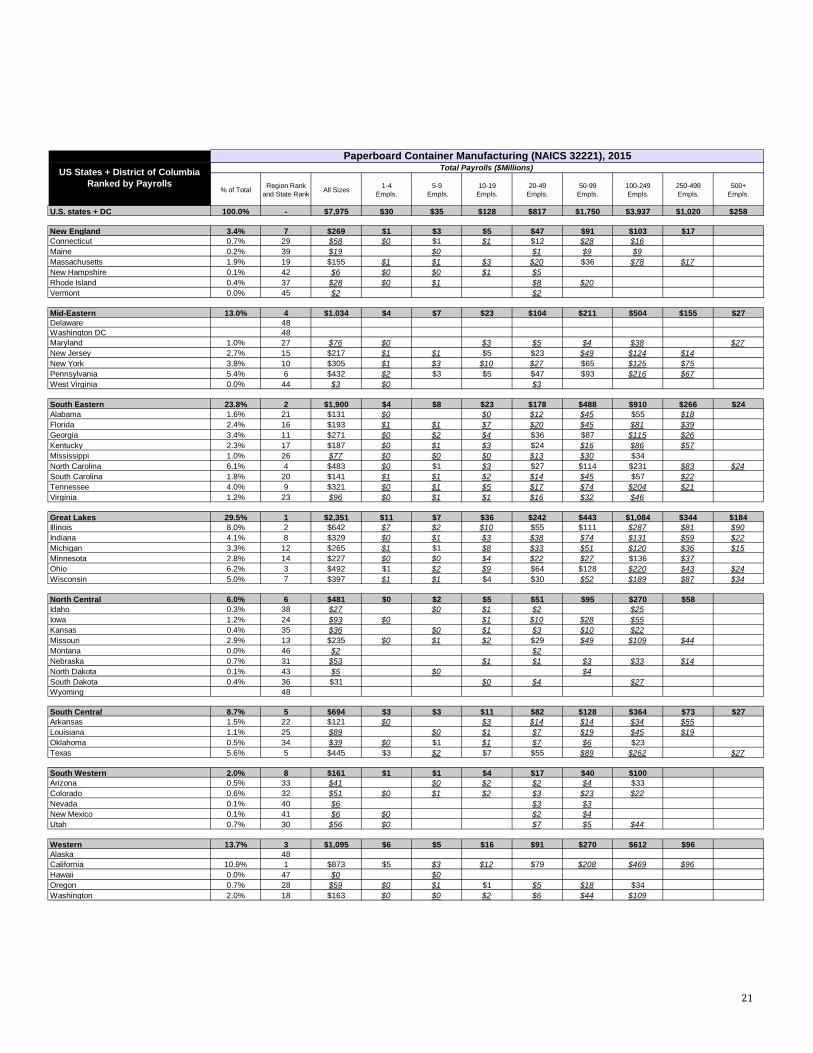
U.S. states + DC 100.0% - $7,975 $30 $35 $128 $817 $1,750 $3,937 $1,020 $258
New England 3.4% 7 $269 $1 $3 $5 $47 $91 $103 $17Connecticut 0.7% 29 $58 $0 $1 $1 $12 $28 $16Maine 0.2% 39 $19 $0 $1 $9 $9Massachusetts 1.9% 19 $155 $1 $1 $3 $20 $36 $78 $17New Hampshire 0.1% 42 $6 $0 $0 $1 $5Rhode Island 0.4% 37 $28 $0 $1 $8 $20Vermont 0.0% 45 $2 $2
Mid-Eastern 13.0% 4 $1,034 $4 $7 $23 $104 $211 $504 $155 $27Delaware 48 Washington DC 48 Maryland 1.0% 27 $76 $0 $3 $5 $4 $38 $27New Jersey 2.7% 15 $217 $1 $1 $5 $23 $49 $124 $14New York 3.8% 10 $305 $1 $3 $10 $27 $65 $125 $75Pennsylvania 5.4% 6 $432 $2 $3 $5 $47 $93 $216 $67West Virginia 0.0% 44 $3 $0 $3
South Eastern 23.8% 2 $1,900 $4 $8 $23 $178 $488 $910 $266 $24Alabama 1.6% 21 $131 $0 $0 $12 $45 $55 $18Florida 2.4% 16 $193 $1 $1 $7 $20 $45 $81 $39Georgia 3.4% 11 $271 $0 $2 $4 $36 $87 $115 $26Kentucky 2.3% 17 $187 $0 $1 $3 $24 $16 $86 $57Mississippi 1.0% 26 $77 $0 $0 $0 $13 $30 $34North Carolina 6.1% 4 $483 $0 $1 $3 $27 $114 $231 $83 $24South Carolina 1.8% 20 $141 $1 $1 $2 $14 $45 $57 $22Tennessee 4.0% 9 $321 $0 $1 $5 $17 $74 $204 $21Virginia 1.2% 23 $96 $0 $1 $1 $16 $32 $46
Great Lakes 29.5% 1 $2,351 $11 $7 $36 $242 $443 $1,084 $344 $184Illinois 8.0% 2 $642 $7 $2 $10 $55 $111 $287 $81 $90Indiana 4.1% 8 $329 $0 $1 $3 $38 $74 $131 $59 $22Michigan 3.3% 12 $265 $1 $1 $8 $33 $51 $120 $36 $15Minnesota 2.8% 14 $227 $0 $0 $4 $22 $27 $136 $37Ohio 6.2% 3 $492 $1 $2 $9 $64 $128 $220 $43 $24Wisconsin 5.0% 7 $397 $1 $1 $4 $30 $52 $189 $87 $34
North Central 6.0% 6 $481 $0 $2 $5 $51 $95 $270 $58Idaho 0.3% 38 $27 $0 $1 $2 $25Iowa 1.2% 24 $93 $0 $1 $10 $28 $55Kansas 0.4% 35 $36 $0 $1 $3 $10 $22Missouri 2.9% 13 $235 $0 $1 $2 $29 $49 $109 $44Montana 0.0% 46 $2 $2Nebraska 0.7% 31 $53 $1 $1 $3 $33 $14North Dakota 0.1% 43 $5 $0 $4South Dakota 0.4% 36 $31 $0 $4 $27Wyoming 48
South Central 8.7% 5 $694 $3 $3 $11 $82 $128 $364 $73 $27Arkansas 1.5% 22 $121 $0 $3 $14 $14 $34 $55Louisiana 1.1% 25 $89 $0 $1 $7 $19 $45 $19Oklahoma 0.5% 34 $39 $0 $1 $1 $7 $6 $23Texas 5.6% 5 $445 $3 $2 $7 $55 $89 $262 $27
South Western 2.0% 8 $161 $1 $1 $4 $17 $40 $100Arizona 0.5% 33 $41 $0 $2 $2 $4 $33Colorado 0.6% 32 $51 $0 $1 $2 $3 $23 $22Nevada 0.1% 40 $6 $3 $3New Mexico 0.1% 41 $6 $0 $2 $4Utah 0.7% 30 $56 $0 $7 $5 $44
Western 13.7% 3 $1,095 $6 $5 $16 $91 $270 $612 $96Alaska 48 California 10.9% 1 $873 $5 $3 $12 $79 $208 $469 $96Hawaii 0.0% 47 $0 $0Oregon 0.7% 28 $59 $0 $1 $1 $5 $18 $34Washington 2.0% 18 $163 $0 $0 $2 $6 $44 $109
US States + District of Columbia Ranked by Payrolls
Paperboard Container Manufacturing (NAICS 32221), 2015Total Payrolls ($Millions)
21
% of Total Region Rank and State Rank All Sizes Small: 1-9
Empls.Medium: 10-49
Empls.Large: >50+
Empls.
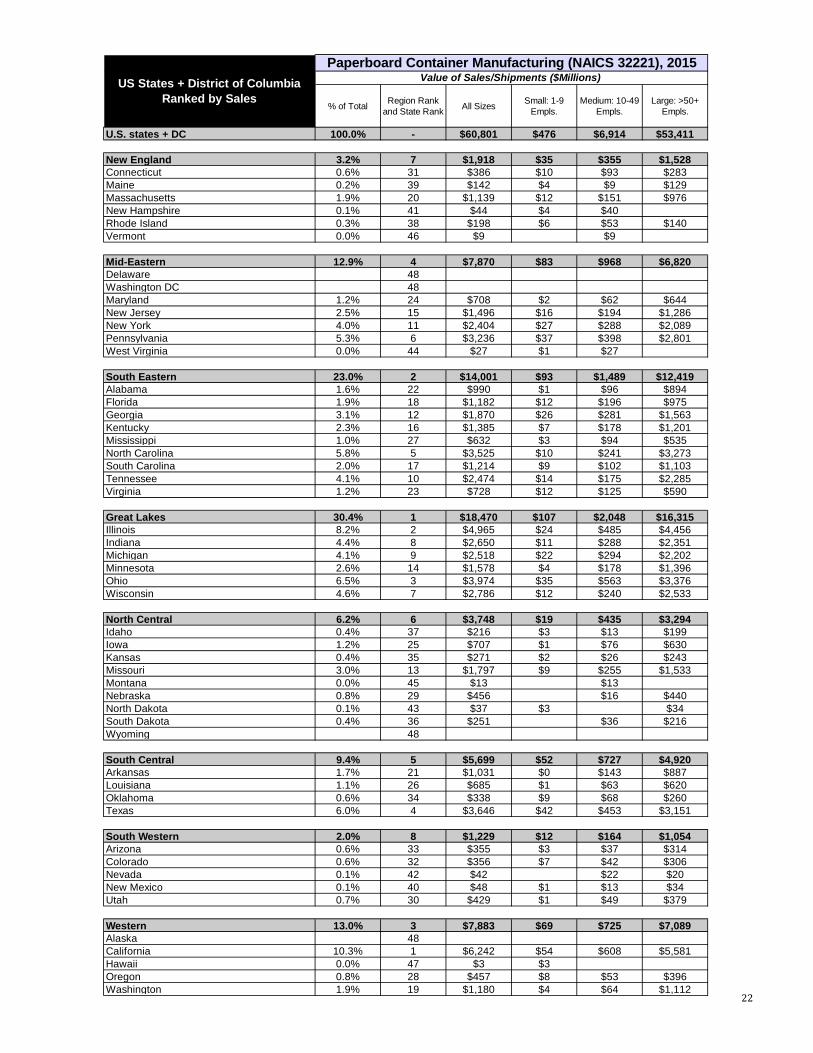
U.S. states + DC 100.0% - $60,801 $476 $6,914 $53,411
New England 3.2% 7 $1,918 $35 $355 $1,528Connecticut 0.6% 31 $386 $10 $93 $283Maine 0.2% 39 $142 $4 $9 $129Massachusetts 1.9% 20 $1,139 $12 $151 $976New Hampshire 0.1% 41 $44 $4 $40Rhode Island 0.3% 38 $198 $6 $53 $140Vermont 0.0% 46 $9 $9
Mid-Eastern 12.9% 4 $7,870 $83 $968 $6,820Delaware 48 Washington DC 48 Maryland 1.2% 24 $708 $2 $62 $644New Jersey 2.5% 15 $1,496 $16 $194 $1,286New York 4.0% 11 $2,404 $27 $288 $2,089Pennsylvania 5.3% 6 $3,236 $37 $398 $2,801West Virginia 0.0% 44 $27 $1 $27
South Eastern 23.0% 2 $14,001 $93 $1,489 $12,419Alabama 1.6% 22 $990 $1 $96 $894Florida 1.9% 18 $1,182 $12 $196 $975Georgia 3.1% 12 $1,870 $26 $281 $1,563Kentucky 2.3% 16 $1,385 $7 $178 $1,201Mississippi 1.0% 27 $632 $3 $94 $535North Carolina 5.8% 5 $3,525 $10 $241 $3,273South Carolina 2.0% 17 $1,214 $9 $102 $1,103Tennessee 4.1% 10 $2,474 $14 $175 $2,285Virginia 1.2% 23 $728 $12 $125 $590
Great Lakes 30.4% 1 $18,470 $107 $2,048 $16,315Illinois 8.2% 2 $4,965 $24 $485 $4,456Indiana 4.4% 8 $2,650 $11 $288 $2,351Michigan 4.1% 9 $2,518 $22 $294 $2,202Minnesota 2.6% 14 $1,578 $4 $178 $1,396Ohio 6.5% 3 $3,974 $35 $563 $3,376Wisconsin 4.6% 7 $2,786 $12 $240 $2,533
North Central 6.2% 6 $3,748 $19 $435 $3,294Idaho 0.4% 37 $216 $3 $13 $199Iowa 1.2% 25 $707 $1 $76 $630Kansas 0.4% 35 $271 $2 $26 $243Missouri 3.0% 13 $1,797 $9 $255 $1,533Montana 0.0% 45 $13 $13Nebraska 0.8% 29 $456 $16 $440North Dakota 0.1% 43 $37 $3 $34South Dakota 0.4% 36 $251 $36 $216Wyoming 48
South Central 9.4% 5 $5,699 $52 $727 $4,920Arkansas 1.7% 21 $1,031 $0 $143 $887Louisiana 1.1% 26 $685 $1 $63 $620Oklahoma 0.6% 34 $338 $9 $68 $260Texas 6.0% 4 $3,646 $42 $453 $3,151
South Western 2.0% 8 $1,229 $12 $164 $1,054Arizona 0.6% 33 $355 $3 $37 $314Colorado 0.6% 32 $356 $7 $42 $306Nevada 0.1% 42 $42 $22 $20New Mexico 0.1% 40 $48 $1 $13 $34Utah 0.7% 30 $429 $1 $49 $379
Western 13.0% 3 $7,883 $69 $725 $7,089Alaska 48 California 10.3% 1 $6,242 $54 $608 $5,581Hawaii 0.0% 47 $3 $3Oregon 0.8% 28 $457 $8 $53 $396Washington 1.9% 19 $1,180 $4 $64 $1,112
US States + District of Columbia Ranked by Sales
Paperboard Container Manufacturing (NAICS 32221), 2015Value of Sales/Shipments ($Millions)
22

% of Total Region Rank and State Rank All Sizes 1-4
Empls.5-9
Empls.10-19
Empls.20-49
Empls.50-99
Empls.100-249Empls.
250-499Empls.
500+Empls.
U.S. states + DC 100.0% - $60,801 $135 $341 $1,127 $5,788 $12,541 $29,859 $8,122 $2,889
New England 3.2% 7 $1,918 $10 $26 $45 $310 $595 $791 $142Connecticut 0.6% 31 $386 $1 $9 $10 $83 $183 $100Maine 0.2% 39 $142 $4 $9 $59 $70Massachusetts 1.9% 20 $1,139 $6 $6 $31 $120 $213 $621 $142New Hampshire 0.1% 41 $44 $1 $3 $4 $36Rhode Island 0.3% 38 $198 $2 $4 $53 $140Vermont 0.0% 46 $9 $9
Mid-Eastern 12.9% 4 $7,870 $17 $65 $179 $788 $1,423 $3,731 $1,371 $295Delaware 48 Washington DC 48 Maryland 1.2% 24 $708 $2 $24 $38 $37 $312 $295New Jersey 2.5% 15 $1,496 $6 $10 $37 $157 $318 $843 $125New York 4.0% 11 $2,404 $3 $24 $76 $212 $450 $951 $688Pennsylvania 5.3% 6 $3,236 $5 $31 $43 $355 $618 $1,625 $558West Virginia 0.0% 44 $27 $1 $27
South Eastern 23.0% 2 $14,001 $18 $75 $207 $1,282 $3,504 $6,761 $1,888 $266Alabama 1.6% 22 $990 $1 $4 $92 $359 $422 $113Florida 1.9% 18 $1,182 $3 $8 $49 $147 $287 $552 $136Georgia 3.1% 12 $1,870 $4 $23 $38 $242 $538 $805 $220Kentucky 2.3% 16 $1,385 $2 $5 $18 $160 $148 $639 $414Mississippi 1.0% 27 $632 $1 $3 $4 $90 $228 $307North Carolina 5.8% 5 $3,525 $1 $9 $27 $215 $801 $1,510 $696 $266South Carolina 2.0% 17 $1,214 $3 $6 $12 $91 $355 $590 $158Tennessee 4.1% 10 $2,474 $2 $11 $45 $130 $561 $1,574 $151Virginia 1.2% 23 $728 $2 $10 $10 $115 $228 $363
Great Lakes 30.4% 1 $18,470 $39 $68 $369 $1,679 $3,296 $8,170 $2,778 $2,071Illinois 8.2% 2 $4,965 $10 $14 $86 $399 $691 $2,098 $637 $1,030Indiana 4.4% 8 $2,650 $2 $9 $34 $254 $578 $1,104 $455 $215Michigan 4.1% 9 $2,518 $9 $12 $73 $221 $437 $1,031 $427 $306Minnesota 2.6% 14 $1,578 $2 $1 $38 $139 $196 $904 $297Ohio 6.5% 3 $3,974 $12 $23 $107 $455 $1,055 $1,736 $339 $247Wisconsin 4.6% 7 $2,786 $4 $8 $31 $210 $340 $1,298 $622 $273
North Central 6.2% 6 $3,748 $4 $15 $61 $374 $654 $2,158 $483Idaho 0.4% 37 $216 $3 $4 $9 $199Iowa 1.2% 25 $707 $1 $9 $67 $145 $485Kansas 0.4% 35 $271 $2 $8 $18 $68 $175Missouri 3.0% 13 $1,797 $3 $6 $31 $224 $378 $802 $353Montana 0.0% 45 $13 $13Nebraska 0.8% 29 $456 $4 $12 $31 $280 $129North Dakota 0.1% 43 $37 $3 $34South Dakota 0.4% 36 $251 $5 $31 $216Wyoming 48
South Central 9.4% 5 $5,699 $18 $34 $91 $636 $1,011 $2,998 $580 $331Arkansas 1.7% 21 $1,031 $0 $24 $119 $123 $312 $453Louisiana 1.1% 26 $685 $1 $6 $58 $133 $360 $127Oklahoma 0.6% 34 $338 $0 $8 $5 $63 $69 $191Texas 6.0% 4 $3,646 $17 $25 $56 $397 $686 $2,135 $331
South Western 2.0% 8 $1,229 $4 $7 $31 $132 $258 $796Arizona 0.6% 33 $355 $3 $13 $24 $23 $291Colorado 0.6% 32 $356 $3 $4 $18 $24 $143 $164Nevada 0.1% 42 $42 $22 $20New Mexico 0.1% 40 $48 $1 $13 $34Utah 0.7% 30 $429 $1 $49 $38 $341
Western 13.0% 3 $7,883 $26 $43 $138 $587 $1,842 $4,426 $821Alaska 48 California 10.3% 1 $6,242 $24 $30 $100 $508 $1,416 $3,344 $821Hawaii 0.0% 47 $3 $3Oregon 0.8% 28 $457 $0 $7 $17 $37 $118 $278Washington 1.9% 19 $1,180 $2 $2 $21 $43 $308 $804
US States + District of Columbia Ranked by Sales
Paperboard Container Manufacturing (NAICS 32221), 2015Value of Sales/Shipments ($Millions)
23
% of Total Region Rank and State Rank All Sizes Small: 1-9
Empls.Medium: 10-49
Empls.Large: >50+
Empls.
U.S. states + DC 100.0% - $1,758.1 $14.0 $191.5 $1,552.6
New England 3.1% 7 $54.9 $1.0 $9.2 $44.7Connecticut 0.7% 29 $12.4 $0.3 $2.6 $9.5Maine 0.2% 39 $4.0 $0.1 $0.2 $3.8Massachusetts 1.7% 21 $30.7 $0.4 $3.8 $26.5New Hampshire 0.1% 42 $1.3 $0.1 $1.2Rhode Island 0.4% 37 $6.3 $0.2 $1.2 $4.9Vermont 0.0% 46 $0.2 $0.2
Mid-Eastern 12.5% 4 $220.2 $2.4 $27.4 $190.4Delaware 48 Washington DC 48 Maryland 1.1% 26 $18.8 $0.1 $1.8 $17.0New Jersey 2.4% 16 $42.5 $0.5 $5.4 $36.7New York 4.0% 11 $69.6 $0.8 $8.1 $60.7Pennsylvania 5.0% 6 $88.4 $1.1 $11.3 $76.0West Virginia 0.0% 44 $0.8 $0.0 $0.8
South Eastern 24.3% 2 $427.5 $2.7 $40.6 $384.1Alabama 1.8% 20 $31.9 $0.0 $2.6 $29.3Florida 2.1% 17 $37.7 $0.3 $5.5 $31.8Georgia 3.1% 13 $55.1 $0.8 $7.5 $46.8Kentucky 2.5% 14 $43.9 $0.2 $4.7 $39.0Mississippi 1.0% 27 $18.1 $0.1 $2.6 $15.4North Carolina 6.3% 4 $111.0 $0.3 $6.5 $104.2South Carolina 1.9% 19 $33.4 $0.3 $2.6 $30.6Tennessee 4.1% 9 $72.9 $0.4 $5.1 $67.4Virginia 1.3% 23 $23.6 $0.3 $3.5 $19.8
Great Lakes 29.9% 1 $526.1 $3.2 $57.5 $465.5Illinois 8.0% 2 $140.3 $0.7 $13.6 $126.0Indiana 4.4% 7 $77.7 $0.3 $8.4 $68.9Michigan 4.1% 10 $71.3 $0.6 $8.5 $62.2Minnesota 2.5% 15 $43.7 $0.1 $5.1 $38.6Ohio 6.6% 3 $116.0 $1.0 $15.1 $99.9Wisconsin 4.4% 8 $77.0 $0.4 $6.8 $69.9
North Central 6.4% 6 $112.6 $0.5 $12.3 $99.8Idaho 0.3% 38 $4.9 $0.1 $0.3 $4.4Iowa 1.2% 24 $20.4 $0.0 $2.2 $18.2Kansas 0.4% 36 $7.1 $0.0 $0.7 $6.5Missouri 3.2% 12 $55.4 $0.3 $7.2 $47.9Montana 0.0% 45 $0.4 $0.4Nebraska 0.8% 28 $14.7 $0.5 $14.2North Dakota 0.1% 41 $1.4 $0.1 $1.3South Dakota 0.5% 35 $8.2 $1.0 $7.2Wyoming 48
South Central 9.0% 5 $158.6 $1.5 $20.5 $136.6Arkansas 1.7% 22 $29.7 $0.0 $4.0 $25.6Louisiana 1.1% 25 $20.0 $0.0 $1.8 $18.2Oklahoma 0.5% 33 $9.1 $0.3 $1.9 $7.0Texas 5.7% 5 $99.7 $1.2 $12.8 $85.7
South Western 2.0% 8 $34.6 $0.3 $4.6 $29.7Arizona 0.5% 34 $8.4 $0.1 $1.1 $7.3Colorado 0.6% 32 $11.2 $0.2 $1.2 $9.7Nevada 0.1% 43 $1.1 $0.6 $0.5New Mexico 0.1% 40 $1.8 $0.0 $0.4 $1.3Utah 0.7% 31 $12.2 $0.0 $1.3 $10.8
Western 12.7% 3 $224.1 $2.0 $19.5 $202.6Alaska 48 California 10.1% 1 $177.9 $1.6 $16.4 $159.9Hawaii 0.0% 47 $0.1 $0.1Oregon 0.7% 30 $12.4 $0.2 $1.5 $10.6Washington 1.9% 18 $33.8 $0.1 $1.6 $32.1
US States + District of Columbia Ranked by CapEx
Paperboard Container Manufacturing (NAICS 32221), 2015Value of Capital Expenditure ($M)
24
% of Total Region Rank and State Rank All Sizes 1-4
Empls.5-9
Empls.10-19
Empls.20-49
Empls.50-99
Empls.100-249Empls.
250-499Empls.
500+Empls.
U.S. states + DC 100.0% - $1,758.1 $3.9 $10.0 $32.7 $158.8 $467.2 $767.2 $238.2 $80.0
New England 3.1% 7 $54.9 $0.3 $0.8 $1.2 $7.9 $21.7 $19.9 $3.1Connecticut 0.7% 29 $12.4 $0.0 $0.3 $0.3 $2.3 $6.6 $2.9Maine 0.2% 39 $4.0 $0.1 $0.2 $2.2 $1.6Massachusetts 1.7% 21 $30.7 $0.2 $0.2 $0.8 $3.0 $8.0 $15.5 $3.1New Hampshire 0.1% 42 $1.3 $0.0 $0.1 $0.1 $1.0Rhode Island 0.4% 37 $6.3 $0.0 $0.1 $1.2 $4.9Vermont 0.0% 46 $0.2 $0.2
Mid-Eastern 12.5% 4 $220.2 $0.5 $1.9 $5.3 $22.0 $51.5 $96.2 $34.9 $7.8Delaware 48 Washington DC 48 Maryland 1.1% 26 $18.8 $0.1 $0.7 $1.1 $1.5 $7.7 $7.8New Jersey 2.4% 16 $42.5 $0.2 $0.3 $1.1 $4.3 $11.7 $22.3 $2.7New York 4.0% 11 $69.6 $0.1 $0.7 $2.3 $5.9 $16.1 $26.2 $18.4Pennsylvania 5.0% 6 $88.4 $0.2 $0.9 $1.3 $10.0 $22.2 $40.0 $13.8West Virginia 0.0% 44 $0.8 $0.0 $0.8
South Eastern 24.3% 2 $427.5 $0.5 $2.2 $6.0 $34.6 $129.8 $181.8 $63.2 $9.3Alabama 1.8% 20 $31.9 $0.0 $0.1 $2.5 $13.6 $11.4 $4.3Florida 2.1% 17 $37.7 $0.1 $0.2 $1.4 $4.1 $10.9 $15.9 $5.1Georgia 3.1% 13 $55.1 $0.1 $0.7 $1.1 $6.4 $19.3 $21.2 $6.3Kentucky 2.5% 14 $43.9 $0.0 $0.1 $0.5 $4.2 $5.8 $19.0 $14.3Mississippi 1.0% 27 $18.1 $0.0 $0.1 $0.1 $2.5 $8.5 $6.8North Carolina 6.3% 4 $111.0 $0.0 $0.3 $0.8 $5.8 $29.1 $42.8 $23.0 $9.3South Carolina 1.9% 19 $33.4 $0.1 $0.2 $0.3 $2.3 $12.9 $13.2 $4.5Tennessee 4.1% 9 $72.9 $0.1 $0.3 $1.4 $3.7 $21.0 $40.7 $5.7Virginia 1.3% 23 $23.6 $0.0 $0.3 $0.3 $3.2 $8.8 $11.0
Great Lakes 29.9% 1 $526.1 $1.1 $2.0 $10.9 $46.6 $122.5 $206.7 $79.9 $56.3Illinois 8.0% 2 $140.3 $0.3 $0.4 $2.6 $11.0 $25.5 $52.5 $20.8 $27.1Indiana 4.4% 7 $77.7 $0.0 $0.3 $1.0 $7.4 $21.6 $28.0 $11.8 $7.5Michigan 4.1% 10 $71.3 $0.3 $0.4 $2.1 $6.3 $15.8 $26.3 $12.1 $8.0Minnesota 2.5% 15 $43.7 $0.1 $0.0 $1.1 $4.0 $7.6 $24.5 $6.5Ohio 6.6% 3 $116.0 $0.4 $0.7 $3.2 $11.9 $39.4 $43.6 $10.4 $6.5Wisconsin 4.4% 8 $77.0 $0.1 $0.2 $0.8 $5.9 $12.6 $31.8 $18.3 $7.2
North Central 6.4% 6 $112.6 $0.1 $0.4 $1.8 $10.5 $25.1 $57.6 $17.1Idaho 0.3% 38 $4.9 $0.1 $0.1 $0.2 $4.4Iowa 1.2% 24 $20.4 $0.0 $0.3 $1.9 $5.6 $12.6Kansas 0.4% 36 $7.1 $0.0 $0.2 $0.4 $2.6 $3.9Missouri 3.2% 12 $55.4 $0.1 $0.2 $0.9 $6.3 $14.4 $21.3 $12.2Montana 0.0% 45 $0.4 $0.4Nebraska 0.8% 28 $14.7 $0.1 $0.4 $1.2 $8.1 $4.9North Dakota 0.1% 41 $1.4 $0.1 $1.3South Dakota 0.5% 35 $8.2 $0.1 $0.9 $7.2Wyoming 48
South Central 9.0% 5 $158.6 $0.5 $1.0 $2.5 $17.9 $38.1 $71.9 $17.9 $8.7Arkansas 1.7% 22 $29.7 $0.0 $0.7 $3.4 $4.7 $7.8 $13.1Louisiana 1.1% 25 $20.0 $0.0 $0.1 $1.7 $5.2 $8.3 $4.8Oklahoma 0.5% 33 $9.1 $0.0 $0.3 $0.2 $1.7 $2.8 $4.3Texas 5.7% 5 $99.7 $0.5 $0.7 $1.6 $11.2 $25.5 $51.6 $8.7
South Western 2.0% 8 $34.6 $0.1 $0.2 $0.9 $3.7 $9.6 $20.0Arizona 0.5% 34 $8.4 $0.1 $0.4 $0.7 $0.8 $6.5Colorado 0.6% 32 $11.2 $0.1 $0.1 $0.5 $0.7 $5.5 $4.3Nevada 0.1% 43 $1.1 $0.6 $0.5New Mexico 0.1% 40 $1.8 $0.0 $0.4 $1.3Utah 0.7% 31 $12.2 $0.0 $1.3 $1.5 $9.3
Western 12.7% 3 $224.1 $0.8 $1.3 $4.0 $15.5 $70.5 $112.1 $20.0Alaska 48 California 10.1% 1 $177.9 $0.7 $0.9 $2.9 $13.5 $54.7 $85.2 $20.0Hawaii 0.0% 47 $0.1 $0.1Oregon 0.7% 30 $12.4 $0.0 $0.2 $0.5 $1.0 $4.4 $6.2Washington 1.9% 18 $33.8 $0.1 $0.1 $0.6 $1.0 $11.4 $20.7
US States + District of Columbia Ranked by CapEx
Paperboard Container Manufacturing (NAICS 32221), 2015Value of Capital Expenditure ($M)
25
% of Total Rank All Sizes Small: 1-9 Empls.
Medium: 10-49 Empls.
Large: >50+ Empls.
Employees/Estab. Employees Payrolls ($MM) Sales ($MM) CapEx ($MM)
U.S. states + DC 100.0% - 2,035 335 724 976 70.9 144,200 $7,975 $60,801 $1,758California 10.1% 1 206 40 63 103 69.9 14,393 $873 $6,242 $178Ohio 7.5% 2 152 25 59 68 62.1 9,439 $492 $3,974 $116Texas 6.6% 3 134 29 46 59 62.7 8,400 $445 $3,646 $100Illinois 6.6% 3 134 25 47 62 85.7 11,487 $642 $4,965 $140Pennsylvania 5.3% 5 107 19 39 49 70.3 7,517 $432 $3,236 $88North Carolina 4.5% 6 91 5 25 61 96.7 8,802 $483 $3,525 $111New York 4.2% 7 85 13 34 38 68.9 5,858 $305 $2,404 $70Michigan 4.1% 8 84 15 31 38 70.8 5,944 $265 $2,518 $71Tennessee 3.7% 9 76 9 20 47 77.1 5,859 $321 $2,474 $73Indiana 3.7% 10 75 7 26 42 81.6 6,123 $329 $2,650 $78Georgia 3.6% 11 74 11 29 34 63.5 4,702 $271 $1,870 $55Wisconsin 3.5% 12 71 9 25 37 89.9 6,386 $397 $2,786 $77New Jersey 3.3% 13 67 19 22 26 53.4 3,578 $217 $1,496 $43Missouri 3.0% 14 61 8 25 28 71.7 4,372 $235 $1,797 $55Florida 2.7% 15 55 13 22 20 54.8 3,014 $193 $1,182 $38
Top 15 US States Ranked by Number of Establishments
Paperboard Container Manufacturing (NAICS 32221), 2015Employees, Payrolls ($MM), Sales ($MM), CapEx ($MM)
26
% of Total Rank All Sizes Small: 1-9 Empls.
Medium: 10-49 Empls.
Large: >50+ Empls.
Employees/Estab. Employees Payrolls ($MM) Sales ($MM) CapEx ($MM)
US Total 100.0% - 2,035 335 724 976 70.9 144,200 $7,975 $60,801 $1,758Chicago-Naperville-Elgin 5.3% 1 108 17 36 55 90.3 9,751 $566 $4,227 $120Los Angeles-Long Beach-Anaheim 4.2% 2 86 14 27 45 69.1 5,946 $371 $2,616 $74New York-Newark-Jersey City 3.9% 3 80 21 31 28 52.5 4,203 $246 $1,720 $48Dallas-Fort Worth-Arlington 2.9% 4 58 10 17 31 78.1 4,528 $247 $1,965 $54Atlanta-Sandy Springs-Roswell 2.1% 5 42 4 14 24 72.6 3,048 $188 $1,247 $35Philadelphia-Camden-Wilmington 1.9% 6 38 7 12 19 69.3 2,633 $170 $1,110 $33Cincinnati 1.8% 7 37 7 16 14 66.4 2,455 $139 $1,026 $29Minneapolis-St. Paul-Bloomington 1.8% 8 36 4 14 18 81.4 2,929 $179 $1,266 $35St. Louis 1.6% 9 33 8 11 14 55.0 1,815 $104 $742 $24Charlotte-Concord-Gastonia 1.4% 10 29 2 7 20 82.5 2,392 $135 $926 $31Cleveland-Elyria 1.3% 11 26 5 14 7 44.5 1,158 $55 $403 $13Riverside-San Bernardino-Ontario 1.2% 12 24 6 9 9 43.0 1,033 $73 $418 $14Detroit-Warren-Dearborn 1.1% 13 23 4 10 9 77.0 1,771 $82 $747 $23Boston-Cambridge-Newton 1.1% 13 23 5 11 7 45.0 1,035 $58 $415 $11Milwaukee-Waukesha-West Allis 1.0% 15 20 1 12 7 67.9 1,358 $81 $609 $16Providence-Warwick 1.0% 15 20 7 6 7 44.9 898 $47 $316 $10Houston-The Woodlands-Sugar Land 0.9% 17 19 6 10 3 32.7 621 $40 $272 $7
Miami-Fort Lauderdale-West Palm Beach 0.9% 17 19 5 8 6 36.0 684 $35 $275 $9
Portland-Vancouver-Hillsboro 0.9% 19 18 4 5 9 61.2 1,102 $63 $469 $13San Francisco-Oakland-Hayward 0.9% 19 18 5 5 8 65.7 1,183 $72 $510 $14
Nashville-Davidson--Murfreesboro--Franklin 0.9% 19 18 4 3 11 63.8 1,148 $79 $498 $15
Kansas City 0.9% 19 18 1 7 10 81.8 1,473 $86 $613 $19Columbus 0.8% 23 17 2 4 11 68.6 1,166 $68 $523 $15Seattle-Tacoma-Bellevue 0.8% 24 16 5 11 84.7 1,355 $69 $540 $17Grand Rapids-Wyoming 0.8% 24 16 1 6 9 74.6 1,193 $62 $477 $14
Top 25 US MSAs Ranked by Number of Establishments
Paperboard Container Manufacturing (NAICS 32221), 2015Employees, Payrolls ($MM), Sales ($MM), CapEx ($MM)
A Metropolitan Statistical Area (MSA) is a geographic entity defined by the Office of Management and Budget for use by federal statistical agencies. An MSA consists of the county or counties (or equivalent entities) that are associated with at least one urbanized area of at least 50,000 population, plus adjacent counties that have a high degree of social and economic integration with the core as measured through studies of worker and other commuting in the area.
27

% of Total Estabs Rank (Popn.) All Sizes Small: 1-9
Empls.Medium: 10-49
Empls.Large: >50+
Empls.Employees/
Estab. Employees Payrolls ($MM) Sales ($MM) CapEx ($MM)
US Total 100.0% - 2,035 335 724 976 70.9 144,200 $7,975 $60,801 $1,758New York 5.2% 1 105 25 42 38 55.3 5,805 $334 $2,346 $67Los Angeles 5.7% 2 115 21 37 57 63.9 7,350 $468 $3,191 $93Chicago 5.6% 3 114 19 39 56 86.9 9,908 $573 $4,278 $121Washington D.C. 0.9% 4 18 3 9 6 56.8 1,022 $59 $455 $12San Francisco 1.9% 5 39 8 14 17 67.3 2,626 $150 $1,109 $31
Chicago CSA includes: Chicago-Naperville-Elgin, Ottawa-Peru, Kankakee, Michigan City-La PorteWashington D.C. CSA includes: Washington-Arlington-Alexandria, DC-VA-MD-WV, Baltimore-Columbia-Towson, Hagerstown-Martinsburg, Chambersburg-Waynesboro, Winchester, California-Lexington Park, Easton, CambridgeSan Francisco CSA includes: San Francisco-Oakland-Hayward, San Jose-Sunnyvale-Santa Clara, Stockton-Lodi, Santa Rosa, Vallejo-Fairfield, Santa Cruz-Watsonville, Napa
Top 5 Combined Statistical Areas (CSA) ranked by Population
Paperboard Container Manufacturing (NAICS 32221), 2015Employees, Payrolls ($MM), Sales ($MM), CapEx ($MM)
New York CSA is the combination of these Metropolitan and Micropolitan Statistical Areas: New York-Newark-Jersey City, Bridgeport-Stamford-Norwalk, New Haven-Milford, Allentown-Bethlehem-Easton, Trenton, Torrington, Kingston, East StroudsburgLos Angeles CSA includes: Los Angeles-Long Beach-Anaheim, Riverside-San Bernardino-Ontario, Oxnard-Thousand Oaks-Ventura
28
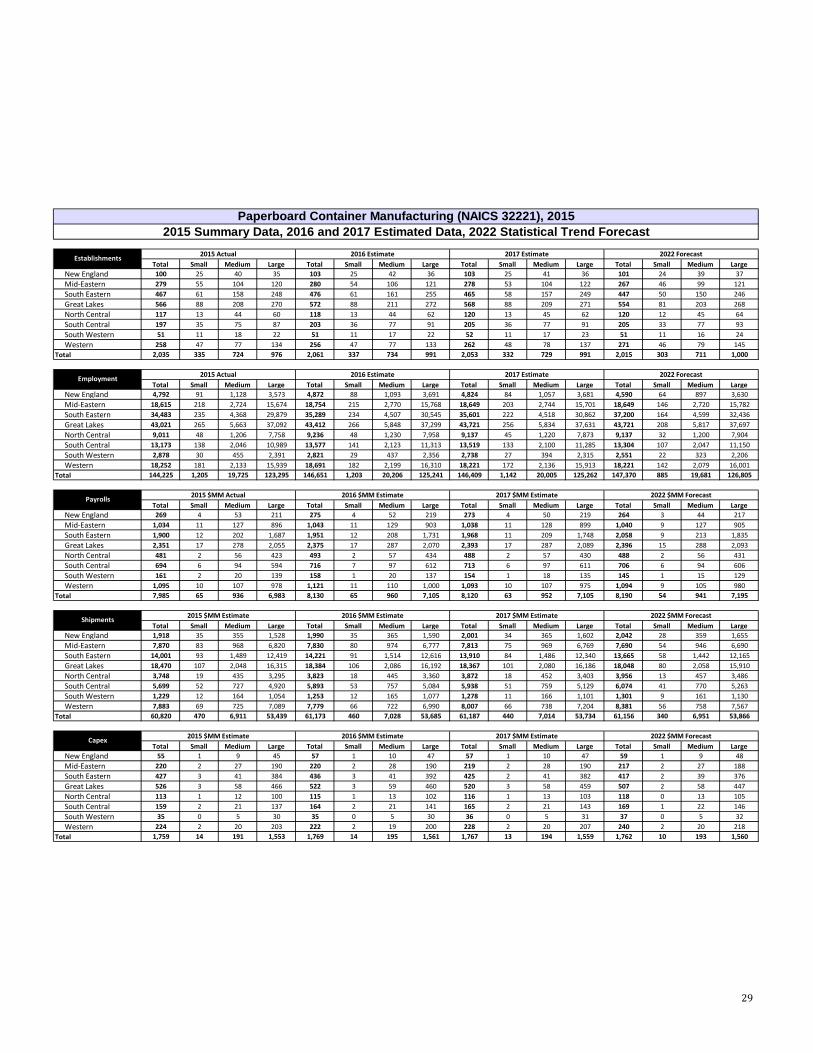
Total Small Medium Large Total Small Medium Large Total Small Medium Large Total Small Medium LargeNew England 100 25 40 35 103 25 42 36 103 25 41 36 101 24 39 37Mid-Eastern 279 55 104 120 280 54 106 121 278 53 104 122 267 46 99 121South Eastern 467 61 158 248 476 61 161 255 465 58 157 249 447 50 150 246Great Lakes 566 88 208 270 572 88 211 272 568 88 209 271 554 81 203 268North Central 117 13 44 60 118 13 44 62 120 13 45 62 120 12 45 64South Central 197 35 75 87 203 36 77 91 205 36 77 91 205 33 77 93South Western 51 11 18 22 51 11 17 22 52 11 17 23 51 11 16 24Western 258 47 77 134 256 47 77 133 262 48 78 137 271 46 79 145
Total 2,035 335 724 976 2,061 337 734 991 2,053 332 729 991 2,015 303 711 1,000
Total Small Medium Large Total Small Medium Large Total Small Medium Large Total Small Medium LargeNew England 4,792 91 1,128 3,573 4,872 88 1,093 3,691 4,824 84 1,057 3,681 4,590 64 897 3,630Mid-Eastern 18,615 218 2,724 15,674 18,754 215 2,770 15,768 18,649 203 2,744 15,701 18,649 146 2,720 15,782South Eastern 34,483 235 4,368 29,879 35,289 234 4,507 30,545 35,601 222 4,518 30,862 37,200 164 4,599 32,436Great Lakes 43,021 265 5,663 37,092 43,412 266 5,848 37,299 43,721 256 5,834 37,631 43,721 208 5,817 37,697North Central 9,011 48 1,206 7,758 9,236 48 1,230 7,958 9,137 45 1,220 7,873 9,137 32 1,200 7,904South Central 13,173 138 2,046 10,989 13,577 141 2,123 11,313 13,519 133 2,100 11,285 13,304 107 2,047 11,150South Western 2,878 30 455 2,391 2,821 29 437 2,356 2,738 27 394 2,315 2,551 22 323 2,206Western 18,252 181 2,133 15,939 18,691 182 2,199 16,310 18,221 172 2,136 15,913 18,221 142 2,079 16,001
Total 144,225 1,205 19,725 123,295 146,651 1,203 20,206 125,241 146,409 1,142 20,005 125,262 147,370 885 19,681 126,805
Total Small Medium Large Total Small Medium Large Total Small Medium Large Total Small Medium LargeNew England 269 4 53 211 275 4 52 219 273 4 50 219 264 3 44 217Mid-Eastern 1,034 11 127 896 1,043 11 129 903 1,038 11 128 899 1,040 9 127 905South Eastern 1,900 12 202 1,687 1,951 12 208 1,731 1,968 11 209 1,748 2,058 9 213 1,835Great Lakes 2,351 17 278 2,055 2,375 17 287 2,070 2,393 17 287 2,089 2,396 15 288 2,093North Central 481 2 56 423 493 2 57 434 488 2 57 430 488 2 56 431South Central 694 6 94 594 716 7 97 612 713 6 97 611 706 6 94 606South Western 161 2 20 139 158 1 20 137 154 1 18 135 145 1 15 129Western 1,095 10 107 978 1,121 11 110 1,000 1,093 10 107 975 1,094 9 105 980
Total 7,985 65 936 6,983 8,130 65 960 7,105 8,120 63 952 7,105 8,190 54 941 7,195
Total Small Medium Large Total Small Medium Large Total Small Medium Large Total Small Medium LargeNew England 1,918 35 355 1,528 1,990 35 365 1,590 2,001 34 365 1,602 2,042 28 359 1,655Mid-Eastern 7,870 83 968 6,820 7,830 80 974 6,777 7,813 75 969 6,769 7,690 54 946 6,690South Eastern 14,001 93 1,489 12,419 14,221 91 1,514 12,616 13,910 84 1,486 12,340 13,665 58 1,442 12,165Great Lakes 18,470 107 2,048 16,315 18,384 106 2,086 16,192 18,367 101 2,080 16,186 18,048 80 2,058 15,910North Central 3,748 19 435 3,295 3,823 18 445 3,360 3,872 18 452 3,403 3,956 13 457 3,486South Central 5,699 52 727 4,920 5,893 53 757 5,084 5,938 51 759 5,129 6,074 41 770 5,263South Western 1,229 12 164 1,054 1,253 12 165 1,077 1,278 11 166 1,101 1,301 9 161 1,130Western 7,883 69 725 7,089 7,779 66 722 6,990 8,007 66 738 7,204 8,381 56 758 7,567
Total 60,820 470 6,911 53,439 61,173 460 7,028 53,685 61,187 440 7,014 53,734 61,156 340 6,951 53,866
Total Small Medium Large Total Small Medium Large Total Small Medium Large Total Small Medium LargeNew England 55 1 9 45 57 1 10 47 57 1 10 47 59 1 9 48Mid-Eastern 220 2 27 190 220 2 28 190 219 2 28 190 217 2 27 188South Eastern 427 3 41 384 436 3 41 392 425 2 41 382 417 2 39 376Great Lakes 526 3 58 466 522 3 59 460 520 3 58 459 507 2 58 447North Central 113 1 12 100 115 1 13 102 116 1 13 103 118 0 13 105South Central 159 2 21 137 164 2 21 141 165 2 21 143 169 1 22 146South Western 35 0 5 30 35 0 5 30 36 0 5 31 37 0 5 32Western 224 2 20 203 222 2 19 200 228 2 20 207 240 2 20 218
Total 1,759 14 191 1,553 1,769 14 195 1,561 1,767 13 194 1,559 1,762 10 193 1,560
Paperboard Container Manufacturing (NAICS 32221), 20152015 Summary Data, 2016 and 2017 Estimated Data, 2022 Statistical Trend Forecast
Establishments 2015 Actual 2016 Estimate 2017 Estimate 2022 Forecast
Payrolls 2015 $MM Actual 2016 $MM Estimate 2017 $MM Estimate 2022 $MM Forecast
Employment 2015 Actual 2016 Estimate 2017 Estimate 2022 Forecast
Capex 2015 $MM Estimate 2016 $MM Estimate 2017 $MM Estimate 2022 $MM Forecast
Shipments 2015 $MM Estimate 2016 $MM Estimate 2017 $MM Estimate 2022 $MM Forecast
29

Paperboard Container Manufacturing (NAICS 32221)Establishments by State: All
30
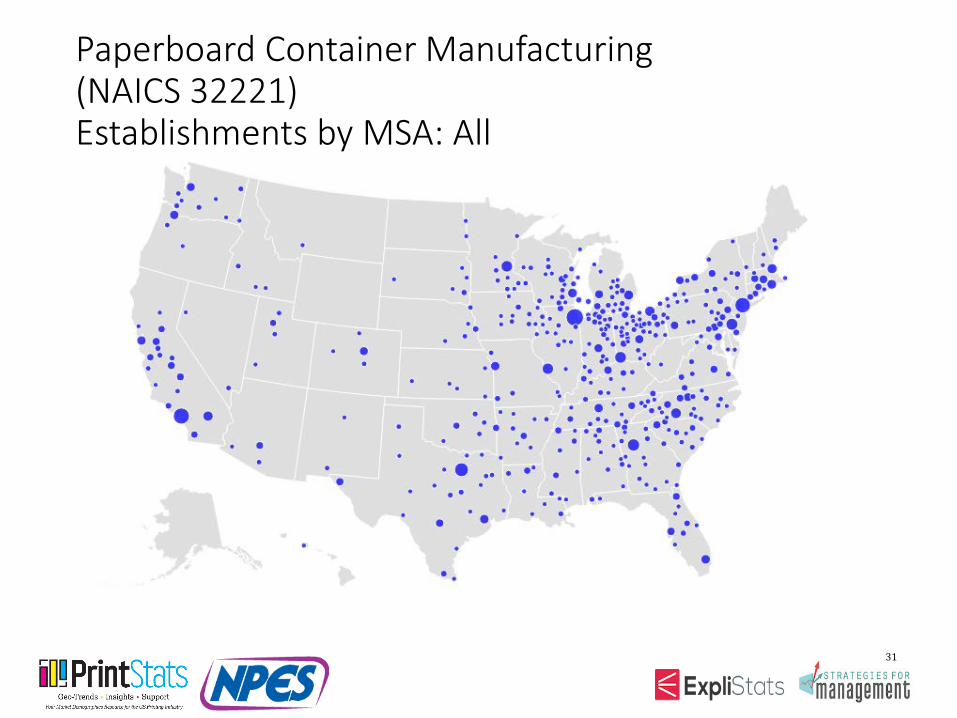
Paperboard Container Manufacturing (NAICS 32221)Establishments by MSA: All
31
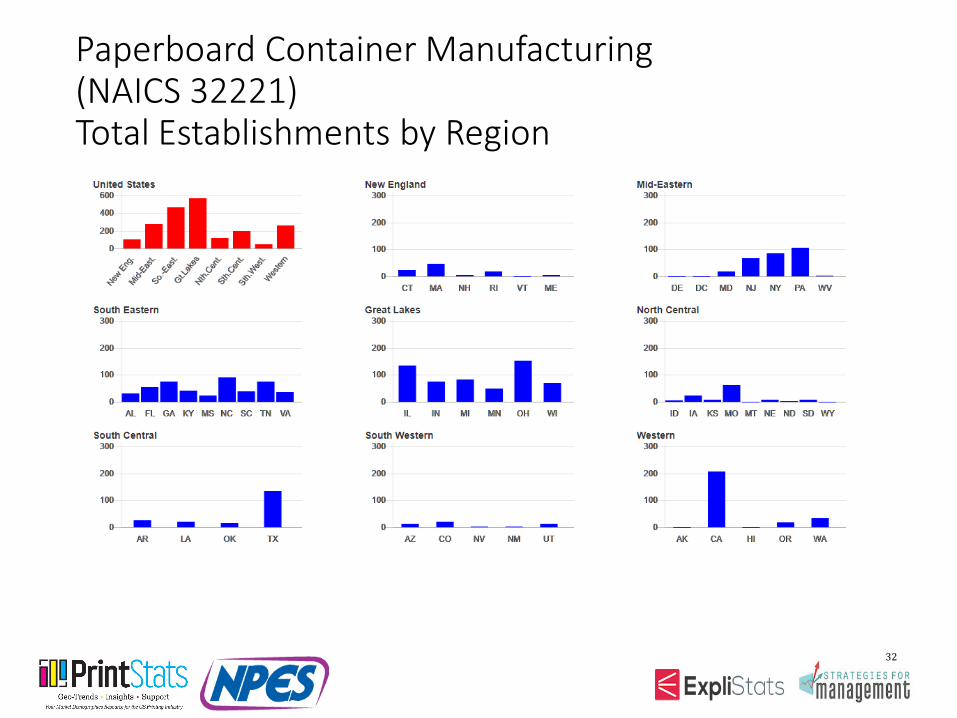
Paperboard Container Manufacturing (NAICS 32221)Total Establishments by Region
32

Available Reports
33
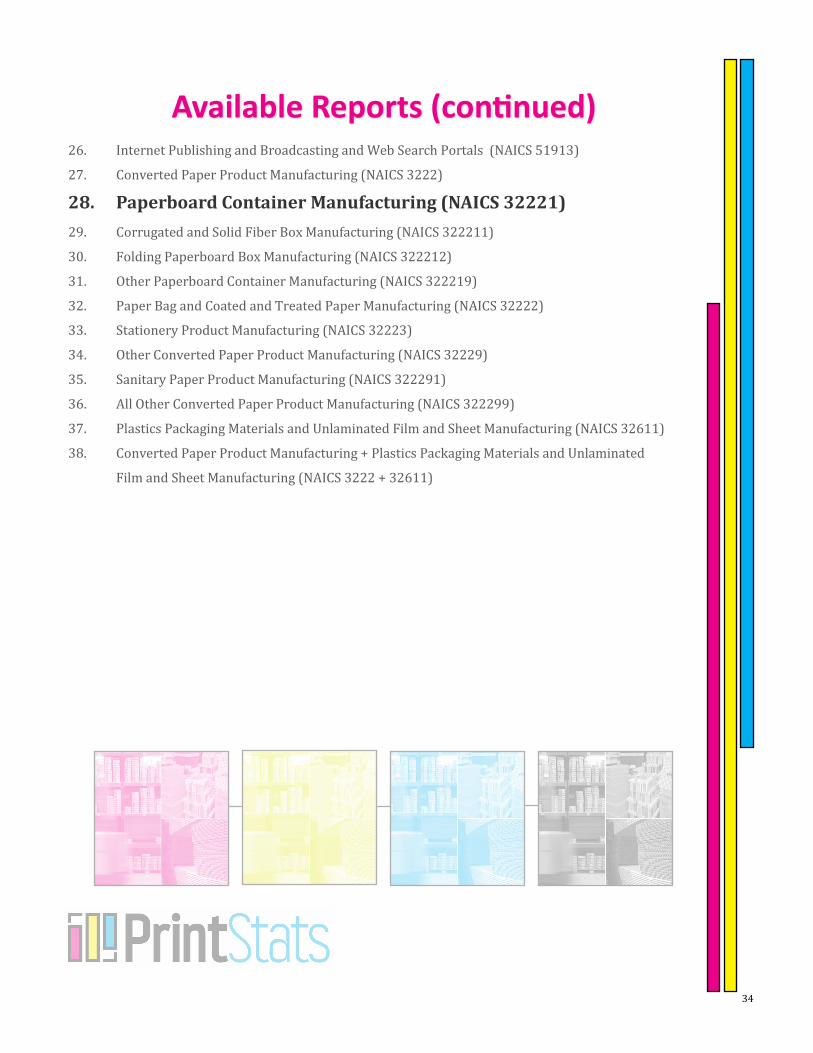
28. Paperboard Container Manufacturing (NAICS 32221)
Available Reports (continued)
34