PAPER OPEN ACCESS Wi-Fi Enabled Modular Sensing System For ...
7
IOP Conference Series: Materials Science and Engineering PAPER • OPEN ACCESS Wi-Fi Enabled Modular Sensing System For Smart Home Applications To cite this article: Dar Hung Chiam et al 2019 IOP Conf. Ser.: Mater. Sci. Eng. 495 012019 View the article online for updates and enhancements. You may also like A Study of Wi-Fi Security in City Environment H Valchanov, J Edikyan and V Aleksieva - Wi-Fi Service enhancement at CERN V Ducret, A Sosnowski, B Gonzalez Caballero et al. - Wi-Fi Devices Individual Identification based on Envelope Front Characteristic Dongze Lv, Junlin Chen and Yanting Che - This content was downloaded from IP address 65.21.228.167 on 05/11/2021 at 05:00
Transcript of PAPER OPEN ACCESS Wi-Fi Enabled Modular Sensing System For ...

IOP Conference Series Materials Science and Engineering
PAPER bull OPEN ACCESS
Wi-Fi Enabled Modular Sensing System For SmartHome ApplicationsTo cite this article Dar Hung Chiam et al 2019 IOP Conf Ser Mater Sci Eng 495 012019
View the article online for updates and enhancements
You may also likeA Study of Wi-Fi Security in CityEnvironmentH Valchanov J Edikyan and V Aleksieva
-
Wi-Fi Service enhancement at CERNV Ducret A Sosnowski B GonzalezCaballero et al
-
Wi-Fi Devices Individual Identificationbased on Envelope Front CharacteristicDongze Lv Junlin Chen and Yanting Che
-
This content was downloaded from IP address 6521228167 on 05112021 at 0500
Content from this work may be used under the terms of the Creative Commons Attribution 30 licence Any further distributionof this work must maintain attribution to the author(s) and the title of the work journal citation and DOI
Published under licence by IOP Publishing Ltd
CUTSE
IOP Conf Series Materials Science and Engineering 495 (2019) 012019
IOP Publishing
doi1010881757-899X4951012019
1
Wi-Fi Enabled Modular Sensing System For Smart Home Applications
DAR HUNG CHIAM KAY LI NG KING HANN LIM KE SAN YAM CDT 250 98009 Miri Sarawak Malaysia
Email cdh950611gmailcom
Abstract Advancement of sensory systems and internet connectivity has enabled the mass growth of Internet of Things (IoT) in 21st century The concept of smart home applies IoT protocol by connecting all electronic appliances onto a server host wirelessly for home activities monitoring management and control All-in-one Wi-Fi enabled smart home devices comprise of multiple sensors for home environment control However some built-in sensors are not always in use all time and it incurs the cost of production Hence a portable Wi-Fi enabled Modular Sensory System (Wi-MSS) is proposed in this paper aiming to give flexibility to users in customizing their own smart home sensory devices while enabling the automation of electronic appliances by following usersrsquo rule and condition setting Wi-MSS comprises of a Wi-Fi host with multiple analog-to-digital micro-USB ports for sensory plug-in In addition an interactive interface is created in the cloud service for information management and data visualization in Wi-MSS The data is visualized in an interactive way enabling users to analyse their behaviour on using home appliances through Internet and mobile phone
1 Introduction The recent development of Internet of Things (IoT) has applied multiple sensory system and internet connectivity to various applications especially smart home system [1] IoT enabled us in building smart homes smart environments where most of the monitoring control and decision making can be automated IoT applications can be categorized into two categories ie ambient data collection and analytics and real time reactive application [2] The first category of IoT system collects information processes data offline makes simple action and acts as a predictor for future data Second category of IoT application is based on real-time reactive system for example autonomous vehicle Combining these two category into one device will increase the flexibility and scalability of the product [3]
The concept of smart home applies IoT protocol by connecting all home appliances together via a host server for home activity monitoring management and control However the mobility of center processing unit sitting at one corner of the house reduces the flexibility of controlling mechanism [4] Hence smart home devices connecting via mobile phone for ease monitoring has become the trend nowadays as it enables users to monitor all appliances at anywhere at any time via internet A billion of information is retrieved from home appliances to a mobile phone and subsequently the information should be presented interactively for data visualization and analysis Data collected from smart devices such as smart phones can be used to analyze human daily behavior and activities [5] Through data visualization and analysis the behavior of a user can be retrieved The user behavior analyzed can be used for the smart home appliances for the intelligent control and learning [6]
In the existing market smart home devices such as D-Link Wi-Fi smart plug [7] Digi XBee Smart Plug [8] Belkin WeMo [9] contain multiple sensors to monitor home appliancesrsquo power consumption lighting control via network and feedback to user about the userrsquos power usage behavior inside all-in-one system On the other hand Icontrol Network Pipers [10] is an all-in-in Wi-Fi-enabled smart home security and automation hub to detect motion temperature humidity light and sound Lowersquos Iris smart home monitoring and control system enables wide range of smart devices and appliances from home
CUTSE
IOP Conf Series Materials Science and Engineering 495 (2019) 012019
IOP Publishing
doi1010881757-899X4951012019
2
security sensors to a smart sprinkler system [11] However all the above-mentioned devices embed with sensors inside the smart devices and it reduces the flexibility of customization Redundant sensors are somehow increasing the cost of production as if they were placed at the wrong corner of the home
In this paper a portable Wi-Fi Enabled Modular Sensory System (Wi-MSS) is proposed for smart home activity monitoring management and control The proposed modular device enables users to customize their own sensors through multiple micro-USB ports associated with a Wi-Fi module It aims to reduce the wastage of unused sensors which are embedded inside a device In our proposed device five types of modular sensors such as current transducer motion detector temperature humidity and light dependent sensors are built into micro-USB modules Those sensors can be interchanged easily by the users with the proposed Wi-MSS Subsequently users can customize its automation procedure with plug-in sensors by setting up rules and conditions for home appliances activation In addition those sensors will collect and deliver data to mobile phone for data visualization and monitoring The data collected can be used for user behavioral analysis as well as electrical appliances behavior analysis It is believed that this is a green initiative by reducing the abusive waste of electronic sensors automating the on-off process of devices when under usage and understanding the user behavior on how they utilize their appliances at home daily
Figure 1 The overall block diagram of the proposed Wi-MSS for generic smart home application
Figure 2 The functionality of multiple Wi-MSS control via Internet and cloud computing
In Figure 1 a detailed block diagram of proposed Wi-MSS for smart home monitoring is demonstrated Inside the Wi-MSS module the major electronic components are Real Time Clock (RTC) Current sensor (ACS 712) SD card module 240 VAC to 5 VDC power converter Wi-Fi module ESP 8266 Logic Shifter Arduino Nano micro-USB ports which can be connected to various kind of sensor modules (temperature humidity motion and light dependent resistor) and relay After the completion of hardware a user interactive interface is designed for data visualization management and control as shown in Figure 2 Subsequently hardware and software integration is implemented with a few case scenarios at home environment for data analysis and evaluation In this paper Section II discusses about three-stage design methodology for Wi-MSS Section III reveals the products and its verification of Wi-MSS In the final section a conclusion and future work is drawn about the benefits of Wi-MSS
CUTSE
IOP Conf Series Materials Science and Engineering 495 (2019) 012019
IOP Publishing
doi1010881757-899X4951012019
3
Figure 3 Three stages of Wi-MSS design including hardware prototyping software integration and data logging
verification
2 Design Methodology of Wi-MSS Three stages of design methodology for the proposed Wi-Fi-enabled modular sensing system is illustrated in Figure 3 Stage 1 consists of hardware design and prototype construction using ESP8266 Wi-Fi module Arduino Nano board ACS 712 current transducer and some other electronic devices to form them into a modular size Stage 2 involves the software design using cloud server and ESP8266 as a stand-alone server Software design also includes the algorithm functional design for Wi-MSS Stage 3 is carried on to verify the integration of modular sensory system and cloud as well as ESP8266 server in home environment The detail of the project implementation is demonstrated in the following sections
21 Stage 1 -- Hardware design of modular sensory system In the first stage component sourcing and purchasing from internet such as element14 and RS
components are surveyed and investigated The accurate components with correct specification is ordered for the hardware construction Once components are received a series of test and evaluation will be done to ensure the components are in proper function Subsequently the assembly of the components will be started off by following the circuit schematic as shown in Figure 4 In addition relay switch connections will be designed to enable AC current flow The usage of ESP 8266 Wi-Fi module is further studied for wireless communication The server feature of the ESP 8266 Wi-Fi module is explored The internal memory of ESP 8266 is 1-Mb flash memory
Figure 4 The circuit connection of Wi-MSS
22 Stage 2--Software design of data analytic display using Fusionex Giant In stage 2 once a single unit of Wi-MSS is completed a user interface is created on the cloud where it can be access from anywhere with network In this project Fusionex Giant is used as the cloud platform to collect power information from Wi-Fi module The collected data is demonstrated in an interactive graphical format followed by the data visualization and analysis A complete set prototype is subsequently built to test the functionality and verify the output of different sensors Multiple units of the proposed Wi-MSS are duplicated after the verification of functionality of first prototype Testing will be done again to ensure the two cells of Wi-MSS works accordingly
23 Stage 3-- Verification of modular sensory system inside home environment In this stage several real-case scenarios of the applications of the proposed prototypes are set up for
smart home system evaluation The prototypes functionality will be tested in real situation For example the temperature sensor will be installed and temperature data will be monitored together with a functional thermometer This is to make sure that the data collected by the Wi-MSS is correct and at the same time to test its accuracy as well as robustnessAn improved version of software or hardware will be upgraded if it is required
CUTSE
IOP Conf Series Materials Science and Engineering 495 (2019) 012019
IOP Publishing
doi1010881757-899X4951012019
4
3 Results amp Discussion The implementation of stage 1 is completed with the finalized circuit diagram as shown in Figure 4 The Wi-MSS circuit diagram consists of input AC adaptor output AC plug ACS 712 AC-DC converter RTC Relay Nano Arduino SD card micro-USB port LM 1117 ESP module and Logic shifter Figure 5 (a) shows the Wi-MSS prototype testing with a load 55W rated fan
Figure 5 (a) Wi-MSS prototype testing with a load 55W table fan (b) The complete overview of Wi-MSS prototype construction
There are ten components in Wi-MSS shown in Figure 5(b) All labeled components are described as follows
1 Power source which supplies power to Wi-MSS system and serve as an adaptor for electronics devices
2 Current transducer uses to capture current flowing to the load for power consumption calculation and monitoring
3 Relay receives a signal from the microcontroller to activate the load 4 Power module or converter which convert AC source to DC source to power up the electronics
module 5 ESP8266 Wi-Fi module acts as a master controller It transmits data to internet through Wi-Fi and
it has built-in sleep mode function 6 Real-time clock enables the record of clocking system for day and night power consumption
analysis 7 Logic shifter converts 5V to 33V for different module communication 8 Micro-USB connector is a modular sensing system for various types of sensors enabled such as
IR sensor LDR motion temperature and current 9 SD card module logs all captured data in certain period before transmitting to internet for
visualization 10 Arduino Nano acts as a slave controller I2C protocol is used to communicate with master
controller It obtains more ADC and GPIO pins for data collection and capturing The harvested data of the 55W fan is collected and uploaded to the Fusionex Giant cloud for display
as shown in Figure 6(a) Our data is uploaded to ldquodatasparkfunrdquo database At this stage we download the data stream manually from the database in CSV format The CSV file is then uploaded to Fusionex analytics for data visualization and analysis Figure 6(b) shows the collected one hour power data of the
(a) (b)
CUTSE
IOP Conf Series Materials Science and Engineering 495 (2019) 012019
IOP Publishing
doi1010881757-899X4951012019
5
55W fan The fluctuation of the power at the beginning of the graph shows the switching event during the test Figure 7 shows the switching test on interval of 10 seconds carried out
Figure 6 (a) Captured data is transferred via wireless connectivity and displayed on a screen using Fusionex
Giant (b) One hour data logging on a load 55W table fan
Figure 7 10-seconds interval on-off data of 55W fan
The sensors data are collected and saved on SD card The sensors data will be uploaded to sparkfun database on each interval for example 5-minute interval in order to save the power consumption of micro-controller On the Fusionex Giant the sensors data will be displayed using graphical method (graphs or charts) depending on the type of data Each sensor can have multiple displays (For example 5-minutes hourly daily monthly graphs) Fusionex Giant is adopted for the current development due to the ease of data analyzing tools provided in the software
Multiple Wi-MSS can upload their data individually onto the same server The devices will be named separately and the sensors data will be uploaded to Sparkfun database as usual At Sparkfun database the data are categorized into user-defined parameters before sending it to Fusionex Giant At Fusionex Giant the user behavior can be observed For example userrsquos total power usage per month is displayed this data shown on Fusionex Giant graph can be further split into multiple displays of individual sensors power consumption Users can easily know their electricity consumption behavior using this graphical method
Besides human behavior study will also be conducted on the power data collected The devices behavior can be analyzed by comparing to efficient devices available in the market Users can harvest their electrical appliances health status easily Based on the electrical appliancesrsquo health report users can easily decide whether they should do maintenance on the devices or to purchase a new one to replace the existing device Figure 8 shows the final prototype of the proposed Wi-MSS module where all the electronic components are arranged into a 603575mm casing with the Wi-Fi module outside of the body This version of prototype consists of all the ready-made modules and can be upgraded to even compact design using printed circuit board in future
(a) (b)
CUTSE
IOP Conf Series Materials Science and Engineering 495 (2019) 012019
IOP Publishing
doi1010881757-899X4951012019
6
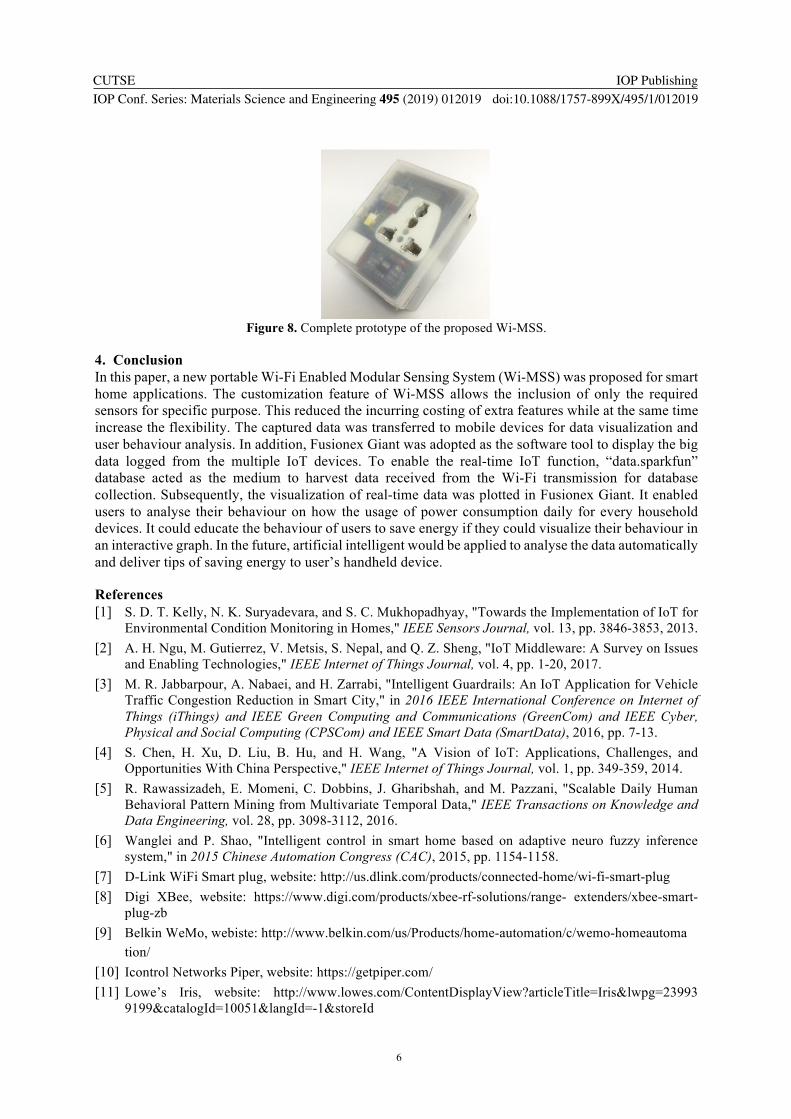
Figure 8 Complete prototype of the proposed Wi-MSS
4 Conclusion In this paper a new portable Wi-Fi Enabled Modular Sensing System (Wi-MSS) was proposed for smart home applications The customization feature of Wi-MSS allows the inclusion of only the required sensors for specific purpose This reduced the incurring costing of extra features while at the same time increase the flexibility The captured data was transferred to mobile devices for data visualization and user behaviour analysis In addition Fusionex Giant was adopted as the software tool to display the big data logged from the multiple IoT devices To enable the real-time IoT function ldquodatasparkfunrdquo database acted as the medium to harvest data received from the Wi-Fi transmission for database collection Subsequently the visualization of real-time data was plotted in Fusionex Giant It enabled users to analyse their behaviour on how the usage of power consumption daily for every household devices It could educate the behaviour of users to save energy if they could visualize their behaviour in an interactive graph In the future artificial intelligent would be applied to analyse the data automatically and deliver tips of saving energy to userrsquos handheld device
References [1] S D T Kelly N K Suryadevara and S C Mukhopadhyay Towards the Implementation of IoT for
Environmental Condition Monitoring in Homes IEEE Sensors Journal vol 13 pp 3846-3853 2013 [2] A H Ngu M Gutierrez V Metsis S Nepal and Q Z Sheng IoT Middleware A Survey on Issues
and Enabling Technologies IEEE Internet of Things Journal vol 4 pp 1-20 2017 [3] M R Jabbarpour A Nabaei and H Zarrabi Intelligent Guardrails An IoT Application for Vehicle
Traffic Congestion Reduction in Smart City in 2016 IEEE International Conference on Internet of Things (iThings) and IEEE Green Computing and Communications (GreenCom) and IEEE Cyber Physical and Social Computing (CPSCom) and IEEE Smart Data (SmartData) 2016 pp 7-13
[4] S Chen H Xu D Liu B Hu and H Wang A Vision of IoT Applications Challenges and Opportunities With China Perspective IEEE Internet of Things Journal vol 1 pp 349-359 2014
[5] R Rawassizadeh E Momeni C Dobbins J Gharibshah and M Pazzani Scalable Daily Human Behavioral Pattern Mining from Multivariate Temporal Data IEEE Transactions on Knowledge and Data Engineering vol 28 pp 3098-3112 2016
[6] Wanglei and P Shao Intelligent control in smart home based on adaptive neuro fuzzy inference system in 2015 Chinese Automation Congress (CAC) 2015 pp 1154-1158
[7] D-Link WiFi Smart plug website httpusdlinkcomproductsconnected-homewi-fi-smart-plug [8] Digi XBee website httpswwwdigicomproductsxbee-rf-solutionsrange- extendersxbee-smart-
plug-zb [9] Belkin WeMo webiste httpwwwbelkincomusProductshome-automationcwemo-homeautoma
tion [10] Icontrol Networks Piper website httpsgetpipercom [11] Lowersquos Iris website httpwwwlowescomContentDisplayViewarticleTitle=Irisamplwpg=23993
9199ampcatalogId=10051amplangId=-1ampstoreId

Content from this work may be used under the terms of the Creative Commons Attribution 30 licence Any further distributionof this work must maintain attribution to the author(s) and the title of the work journal citation and DOI
Published under licence by IOP Publishing Ltd
CUTSE
IOP Conf Series Materials Science and Engineering 495 (2019) 012019
IOP Publishing
doi1010881757-899X4951012019
1
Wi-Fi Enabled Modular Sensing System For Smart Home Applications
DAR HUNG CHIAM KAY LI NG KING HANN LIM KE SAN YAM CDT 250 98009 Miri Sarawak Malaysia
Email cdh950611gmailcom
Abstract Advancement of sensory systems and internet connectivity has enabled the mass growth of Internet of Things (IoT) in 21st century The concept of smart home applies IoT protocol by connecting all electronic appliances onto a server host wirelessly for home activities monitoring management and control All-in-one Wi-Fi enabled smart home devices comprise of multiple sensors for home environment control However some built-in sensors are not always in use all time and it incurs the cost of production Hence a portable Wi-Fi enabled Modular Sensory System (Wi-MSS) is proposed in this paper aiming to give flexibility to users in customizing their own smart home sensory devices while enabling the automation of electronic appliances by following usersrsquo rule and condition setting Wi-MSS comprises of a Wi-Fi host with multiple analog-to-digital micro-USB ports for sensory plug-in In addition an interactive interface is created in the cloud service for information management and data visualization in Wi-MSS The data is visualized in an interactive way enabling users to analyse their behaviour on using home appliances through Internet and mobile phone
1 Introduction The recent development of Internet of Things (IoT) has applied multiple sensory system and internet connectivity to various applications especially smart home system [1] IoT enabled us in building smart homes smart environments where most of the monitoring control and decision making can be automated IoT applications can be categorized into two categories ie ambient data collection and analytics and real time reactive application [2] The first category of IoT system collects information processes data offline makes simple action and acts as a predictor for future data Second category of IoT application is based on real-time reactive system for example autonomous vehicle Combining these two category into one device will increase the flexibility and scalability of the product [3]
The concept of smart home applies IoT protocol by connecting all home appliances together via a host server for home activity monitoring management and control However the mobility of center processing unit sitting at one corner of the house reduces the flexibility of controlling mechanism [4] Hence smart home devices connecting via mobile phone for ease monitoring has become the trend nowadays as it enables users to monitor all appliances at anywhere at any time via internet A billion of information is retrieved from home appliances to a mobile phone and subsequently the information should be presented interactively for data visualization and analysis Data collected from smart devices such as smart phones can be used to analyze human daily behavior and activities [5] Through data visualization and analysis the behavior of a user can be retrieved The user behavior analyzed can be used for the smart home appliances for the intelligent control and learning [6]
In the existing market smart home devices such as D-Link Wi-Fi smart plug [7] Digi XBee Smart Plug [8] Belkin WeMo [9] contain multiple sensors to monitor home appliancesrsquo power consumption lighting control via network and feedback to user about the userrsquos power usage behavior inside all-in-one system On the other hand Icontrol Network Pipers [10] is an all-in-in Wi-Fi-enabled smart home security and automation hub to detect motion temperature humidity light and sound Lowersquos Iris smart home monitoring and control system enables wide range of smart devices and appliances from home
CUTSE
IOP Conf Series Materials Science and Engineering 495 (2019) 012019
IOP Publishing
doi1010881757-899X4951012019
2
security sensors to a smart sprinkler system [11] However all the above-mentioned devices embed with sensors inside the smart devices and it reduces the flexibility of customization Redundant sensors are somehow increasing the cost of production as if they were placed at the wrong corner of the home
In this paper a portable Wi-Fi Enabled Modular Sensory System (Wi-MSS) is proposed for smart home activity monitoring management and control The proposed modular device enables users to customize their own sensors through multiple micro-USB ports associated with a Wi-Fi module It aims to reduce the wastage of unused sensors which are embedded inside a device In our proposed device five types of modular sensors such as current transducer motion detector temperature humidity and light dependent sensors are built into micro-USB modules Those sensors can be interchanged easily by the users with the proposed Wi-MSS Subsequently users can customize its automation procedure with plug-in sensors by setting up rules and conditions for home appliances activation In addition those sensors will collect and deliver data to mobile phone for data visualization and monitoring The data collected can be used for user behavioral analysis as well as electrical appliances behavior analysis It is believed that this is a green initiative by reducing the abusive waste of electronic sensors automating the on-off process of devices when under usage and understanding the user behavior on how they utilize their appliances at home daily
Figure 1 The overall block diagram of the proposed Wi-MSS for generic smart home application
Figure 2 The functionality of multiple Wi-MSS control via Internet and cloud computing
In Figure 1 a detailed block diagram of proposed Wi-MSS for smart home monitoring is demonstrated Inside the Wi-MSS module the major electronic components are Real Time Clock (RTC) Current sensor (ACS 712) SD card module 240 VAC to 5 VDC power converter Wi-Fi module ESP 8266 Logic Shifter Arduino Nano micro-USB ports which can be connected to various kind of sensor modules (temperature humidity motion and light dependent resistor) and relay After the completion of hardware a user interactive interface is designed for data visualization management and control as shown in Figure 2 Subsequently hardware and software integration is implemented with a few case scenarios at home environment for data analysis and evaluation In this paper Section II discusses about three-stage design methodology for Wi-MSS Section III reveals the products and its verification of Wi-MSS In the final section a conclusion and future work is drawn about the benefits of Wi-MSS
CUTSE
IOP Conf Series Materials Science and Engineering 495 (2019) 012019
IOP Publishing
doi1010881757-899X4951012019
3
Figure 3 Three stages of Wi-MSS design including hardware prototyping software integration and data logging
verification
2 Design Methodology of Wi-MSS Three stages of design methodology for the proposed Wi-Fi-enabled modular sensing system is illustrated in Figure 3 Stage 1 consists of hardware design and prototype construction using ESP8266 Wi-Fi module Arduino Nano board ACS 712 current transducer and some other electronic devices to form them into a modular size Stage 2 involves the software design using cloud server and ESP8266 as a stand-alone server Software design also includes the algorithm functional design for Wi-MSS Stage 3 is carried on to verify the integration of modular sensory system and cloud as well as ESP8266 server in home environment The detail of the project implementation is demonstrated in the following sections
21 Stage 1 -- Hardware design of modular sensory system In the first stage component sourcing and purchasing from internet such as element14 and RS
components are surveyed and investigated The accurate components with correct specification is ordered for the hardware construction Once components are received a series of test and evaluation will be done to ensure the components are in proper function Subsequently the assembly of the components will be started off by following the circuit schematic as shown in Figure 4 In addition relay switch connections will be designed to enable AC current flow The usage of ESP 8266 Wi-Fi module is further studied for wireless communication The server feature of the ESP 8266 Wi-Fi module is explored The internal memory of ESP 8266 is 1-Mb flash memory
Figure 4 The circuit connection of Wi-MSS
22 Stage 2--Software design of data analytic display using Fusionex Giant In stage 2 once a single unit of Wi-MSS is completed a user interface is created on the cloud where it can be access from anywhere with network In this project Fusionex Giant is used as the cloud platform to collect power information from Wi-Fi module The collected data is demonstrated in an interactive graphical format followed by the data visualization and analysis A complete set prototype is subsequently built to test the functionality and verify the output of different sensors Multiple units of the proposed Wi-MSS are duplicated after the verification of functionality of first prototype Testing will be done again to ensure the two cells of Wi-MSS works accordingly
23 Stage 3-- Verification of modular sensory system inside home environment In this stage several real-case scenarios of the applications of the proposed prototypes are set up for
smart home system evaluation The prototypes functionality will be tested in real situation For example the temperature sensor will be installed and temperature data will be monitored together with a functional thermometer This is to make sure that the data collected by the Wi-MSS is correct and at the same time to test its accuracy as well as robustnessAn improved version of software or hardware will be upgraded if it is required
CUTSE
IOP Conf Series Materials Science and Engineering 495 (2019) 012019
IOP Publishing
doi1010881757-899X4951012019
4
3 Results amp Discussion The implementation of stage 1 is completed with the finalized circuit diagram as shown in Figure 4 The Wi-MSS circuit diagram consists of input AC adaptor output AC plug ACS 712 AC-DC converter RTC Relay Nano Arduino SD card micro-USB port LM 1117 ESP module and Logic shifter Figure 5 (a) shows the Wi-MSS prototype testing with a load 55W rated fan
Figure 5 (a) Wi-MSS prototype testing with a load 55W table fan (b) The complete overview of Wi-MSS prototype construction
There are ten components in Wi-MSS shown in Figure 5(b) All labeled components are described as follows
1 Power source which supplies power to Wi-MSS system and serve as an adaptor for electronics devices
2 Current transducer uses to capture current flowing to the load for power consumption calculation and monitoring
3 Relay receives a signal from the microcontroller to activate the load 4 Power module or converter which convert AC source to DC source to power up the electronics
module 5 ESP8266 Wi-Fi module acts as a master controller It transmits data to internet through Wi-Fi and
it has built-in sleep mode function 6 Real-time clock enables the record of clocking system for day and night power consumption
analysis 7 Logic shifter converts 5V to 33V for different module communication 8 Micro-USB connector is a modular sensing system for various types of sensors enabled such as
IR sensor LDR motion temperature and current 9 SD card module logs all captured data in certain period before transmitting to internet for
visualization 10 Arduino Nano acts as a slave controller I2C protocol is used to communicate with master
controller It obtains more ADC and GPIO pins for data collection and capturing The harvested data of the 55W fan is collected and uploaded to the Fusionex Giant cloud for display
as shown in Figure 6(a) Our data is uploaded to ldquodatasparkfunrdquo database At this stage we download the data stream manually from the database in CSV format The CSV file is then uploaded to Fusionex analytics for data visualization and analysis Figure 6(b) shows the collected one hour power data of the
(a) (b)
CUTSE
IOP Conf Series Materials Science and Engineering 495 (2019) 012019
IOP Publishing
doi1010881757-899X4951012019
5
55W fan The fluctuation of the power at the beginning of the graph shows the switching event during the test Figure 7 shows the switching test on interval of 10 seconds carried out
Figure 6 (a) Captured data is transferred via wireless connectivity and displayed on a screen using Fusionex
Giant (b) One hour data logging on a load 55W table fan
Figure 7 10-seconds interval on-off data of 55W fan
The sensors data are collected and saved on SD card The sensors data will be uploaded to sparkfun database on each interval for example 5-minute interval in order to save the power consumption of micro-controller On the Fusionex Giant the sensors data will be displayed using graphical method (graphs or charts) depending on the type of data Each sensor can have multiple displays (For example 5-minutes hourly daily monthly graphs) Fusionex Giant is adopted for the current development due to the ease of data analyzing tools provided in the software
Multiple Wi-MSS can upload their data individually onto the same server The devices will be named separately and the sensors data will be uploaded to Sparkfun database as usual At Sparkfun database the data are categorized into user-defined parameters before sending it to Fusionex Giant At Fusionex Giant the user behavior can be observed For example userrsquos total power usage per month is displayed this data shown on Fusionex Giant graph can be further split into multiple displays of individual sensors power consumption Users can easily know their electricity consumption behavior using this graphical method
Besides human behavior study will also be conducted on the power data collected The devices behavior can be analyzed by comparing to efficient devices available in the market Users can harvest their electrical appliances health status easily Based on the electrical appliancesrsquo health report users can easily decide whether they should do maintenance on the devices or to purchase a new one to replace the existing device Figure 8 shows the final prototype of the proposed Wi-MSS module where all the electronic components are arranged into a 603575mm casing with the Wi-Fi module outside of the body This version of prototype consists of all the ready-made modules and can be upgraded to even compact design using printed circuit board in future
(a) (b)
CUTSE
IOP Conf Series Materials Science and Engineering 495 (2019) 012019
IOP Publishing
doi1010881757-899X4951012019
6
Figure 8 Complete prototype of the proposed Wi-MSS
4 Conclusion In this paper a new portable Wi-Fi Enabled Modular Sensing System (Wi-MSS) was proposed for smart home applications The customization feature of Wi-MSS allows the inclusion of only the required sensors for specific purpose This reduced the incurring costing of extra features while at the same time increase the flexibility The captured data was transferred to mobile devices for data visualization and user behaviour analysis In addition Fusionex Giant was adopted as the software tool to display the big data logged from the multiple IoT devices To enable the real-time IoT function ldquodatasparkfunrdquo database acted as the medium to harvest data received from the Wi-Fi transmission for database collection Subsequently the visualization of real-time data was plotted in Fusionex Giant It enabled users to analyse their behaviour on how the usage of power consumption daily for every household devices It could educate the behaviour of users to save energy if they could visualize their behaviour in an interactive graph In the future artificial intelligent would be applied to analyse the data automatically and deliver tips of saving energy to userrsquos handheld device
References [1] S D T Kelly N K Suryadevara and S C Mukhopadhyay Towards the Implementation of IoT for
Environmental Condition Monitoring in Homes IEEE Sensors Journal vol 13 pp 3846-3853 2013 [2] A H Ngu M Gutierrez V Metsis S Nepal and Q Z Sheng IoT Middleware A Survey on Issues
and Enabling Technologies IEEE Internet of Things Journal vol 4 pp 1-20 2017 [3] M R Jabbarpour A Nabaei and H Zarrabi Intelligent Guardrails An IoT Application for Vehicle
Traffic Congestion Reduction in Smart City in 2016 IEEE International Conference on Internet of Things (iThings) and IEEE Green Computing and Communications (GreenCom) and IEEE Cyber Physical and Social Computing (CPSCom) and IEEE Smart Data (SmartData) 2016 pp 7-13
[4] S Chen H Xu D Liu B Hu and H Wang A Vision of IoT Applications Challenges and Opportunities With China Perspective IEEE Internet of Things Journal vol 1 pp 349-359 2014
[5] R Rawassizadeh E Momeni C Dobbins J Gharibshah and M Pazzani Scalable Daily Human Behavioral Pattern Mining from Multivariate Temporal Data IEEE Transactions on Knowledge and Data Engineering vol 28 pp 3098-3112 2016
[6] Wanglei and P Shao Intelligent control in smart home based on adaptive neuro fuzzy inference system in 2015 Chinese Automation Congress (CAC) 2015 pp 1154-1158
[7] D-Link WiFi Smart plug website httpusdlinkcomproductsconnected-homewi-fi-smart-plug [8] Digi XBee website httpswwwdigicomproductsxbee-rf-solutionsrange- extendersxbee-smart-
plug-zb [9] Belkin WeMo webiste httpwwwbelkincomusProductshome-automationcwemo-homeautoma
tion [10] Icontrol Networks Piper website httpsgetpipercom [11] Lowersquos Iris website httpwwwlowescomContentDisplayViewarticleTitle=Irisamplwpg=23993
9199ampcatalogId=10051amplangId=-1ampstoreId

CUTSE
IOP Conf Series Materials Science and Engineering 495 (2019) 012019
IOP Publishing
doi1010881757-899X4951012019
5
55W fan The fluctuation of the power at the beginning of the graph shows the switching event during the test Figure 7 shows the switching test on interval of 10 seconds carried out
Figure 6 (a) Captured data is transferred via wireless connectivity and displayed on a screen using Fusionex
Giant (b) One hour data logging on a load 55W table fan
Figure 7 10-seconds interval on-off data of 55W fan
The sensors data are collected and saved on SD card The sensors data will be uploaded to sparkfun database on each interval for example 5-minute interval in order to save the power consumption of micro-controller On the Fusionex Giant the sensors data will be displayed using graphical method (graphs or charts) depending on the type of data Each sensor can have multiple displays (For example 5-minutes hourly daily monthly graphs) Fusionex Giant is adopted for the current development due to the ease of data analyzing tools provided in the software
Multiple Wi-MSS can upload their data individually onto the same server The devices will be named separately and the sensors data will be uploaded to Sparkfun database as usual At Sparkfun database the data are categorized into user-defined parameters before sending it to Fusionex Giant At Fusionex Giant the user behavior can be observed For example userrsquos total power usage per month is displayed this data shown on Fusionex Giant graph can be further split into multiple displays of individual sensors power consumption Users can easily know their electricity consumption behavior using this graphical method
Besides human behavior study will also be conducted on the power data collected The devices behavior can be analyzed by comparing to efficient devices available in the market Users can harvest their electrical appliances health status easily Based on the electrical appliancesrsquo health report users can easily decide whether they should do maintenance on the devices or to purchase a new one to replace the existing device Figure 8 shows the final prototype of the proposed Wi-MSS module where all the electronic components are arranged into a 603575mm casing with the Wi-Fi module outside of the body This version of prototype consists of all the ready-made modules and can be upgraded to even compact design using printed circuit board in future
(a) (b)
CUTSE
IOP Conf Series Materials Science and Engineering 495 (2019) 012019
IOP Publishing
doi1010881757-899X4951012019
6
Figure 8 Complete prototype of the proposed Wi-MSS
4 Conclusion In this paper a new portable Wi-Fi Enabled Modular Sensing System (Wi-MSS) was proposed for smart home applications The customization feature of Wi-MSS allows the inclusion of only the required sensors for specific purpose This reduced the incurring costing of extra features while at the same time increase the flexibility The captured data was transferred to mobile devices for data visualization and user behaviour analysis In addition Fusionex Giant was adopted as the software tool to display the big data logged from the multiple IoT devices To enable the real-time IoT function ldquodatasparkfunrdquo database acted as the medium to harvest data received from the Wi-Fi transmission for database collection Subsequently the visualization of real-time data was plotted in Fusionex Giant It enabled users to analyse their behaviour on how the usage of power consumption daily for every household devices It could educate the behaviour of users to save energy if they could visualize their behaviour in an interactive graph In the future artificial intelligent would be applied to analyse the data automatically and deliver tips of saving energy to userrsquos handheld device
References [1] S D T Kelly N K Suryadevara and S C Mukhopadhyay Towards the Implementation of IoT for
Environmental Condition Monitoring in Homes IEEE Sensors Journal vol 13 pp 3846-3853 2013 [2] A H Ngu M Gutierrez V Metsis S Nepal and Q Z Sheng IoT Middleware A Survey on Issues
and Enabling Technologies IEEE Internet of Things Journal vol 4 pp 1-20 2017 [3] M R Jabbarpour A Nabaei and H Zarrabi Intelligent Guardrails An IoT Application for Vehicle
Traffic Congestion Reduction in Smart City in 2016 IEEE International Conference on Internet of Things (iThings) and IEEE Green Computing and Communications (GreenCom) and IEEE Cyber Physical and Social Computing (CPSCom) and IEEE Smart Data (SmartData) 2016 pp 7-13
[4] S Chen H Xu D Liu B Hu and H Wang A Vision of IoT Applications Challenges and Opportunities With China Perspective IEEE Internet of Things Journal vol 1 pp 349-359 2014
[5] R Rawassizadeh E Momeni C Dobbins J Gharibshah and M Pazzani Scalable Daily Human Behavioral Pattern Mining from Multivariate Temporal Data IEEE Transactions on Knowledge and Data Engineering vol 28 pp 3098-3112 2016
[6] Wanglei and P Shao Intelligent control in smart home based on adaptive neuro fuzzy inference system in 2015 Chinese Automation Congress (CAC) 2015 pp 1154-1158
[7] D-Link WiFi Smart plug website httpusdlinkcomproductsconnected-homewi-fi-smart-plug [8] Digi XBee website httpswwwdigicomproductsxbee-rf-solutionsrange- extendersxbee-smart-
plug-zb [9] Belkin WeMo webiste httpwwwbelkincomusProductshome-automationcwemo-homeautoma
tion [10] Icontrol Networks Piper website httpsgetpipercom [11] Lowersquos Iris website httpwwwlowescomContentDisplayViewarticleTitle=Irisamplwpg=23993
9199ampcatalogId=10051amplangId=-1ampstoreId