Paper for Presentation at 14 VDF Tokyo monthly Workshop ... · 1 Paper for Presentation at 14th VDF...
33
1 Paper for Presentation at 14 th VDF Tokyo monthly Workshop, November 2004. A General Equilibrium Analysis of the Economic Impacts of Vietnam’s Accession to AFTA. By Nguyen Van Ba 1 ************ I. Introduction. The foreign trade policy reforms, along with the liberalization in foreign investment area, have been the key features of “Open Door” policy of Vietnam since the launching of “DOI MOI”. In order to open up the domestic economy and integrate into the regional and the world market, Vietnamese government have adopted a series of changes in its foreign trade regime, which include: the relaxation of controls on entry into foreign trade activities; relaxation of controls used to manage imports and exports and introduction of a tariffs system; phases out of foreign exchange controls and adoption of a more market oriented exchange rate policy, accompanying by a large devaluation of Vietnamese Dong against US$ to the level of free market rate 2 ; and joins the regional and multilateral trading agreements. Concerning the process of joining regional and multilateral trading agreements, Vietnam has signed a trade agreement with the European Union in 1992. The country joined the Association of Southeast Asian Nations (ASEAN) and became a member of ASEAN Free Trade Area (AFTA) since 1995. It joined the Asian Pacific Economic Corporation (APEC) in 1998. Vietnam also signed a bilateral trade agreement (BTA) with the United States in 2001. And the process of negotiating for accession to WTO has been started since 1995. 1 2 nd -year PhD Candidate student at the Graduate School of Economics, Shiga University. E-mail address: [email protected] 2 It is worth noting that before the reform free market price of foreign exchange is usually 20 times higher than the official rate.
Transcript of Paper for Presentation at 14 VDF Tokyo monthly Workshop ... · 1 Paper for Presentation at 14th VDF...
1
Paper for Presentation at 14th VDF Tokyo monthly Workshop, November 2004. A General Equilibrium Analysis of the Economic Impacts of
Vietnam’s Accession to AFTA. By Nguyen Van Ba1
************
I. Introduction.
The foreign trade policy reforms, along with the liberalization in foreign
investment area, have been the key features of “Open Door” policy of Vietnam since
the launching of “DOI MOI”. In order to open up the domestic economy and
integrate into the regional and the world market, Vietnamese government have
adopted a series of changes in its foreign trade regime, which include: the relaxation
of controls on entry into foreign trade activities; relaxation of controls used to
manage imports and exports and introduction of a tariffs system; phases out of
foreign exchange controls and adoption of a more market oriented exchange rate
policy, accompanying by a large devaluation of Vietnamese Dong against US$ to the
level of free market rate 2 ; and joins the regional and multilateral trading
agreements.
Concerning the process of joining regional and multilateral trading
agreements, Vietnam has signed a trade agreement with the European Union in
1992. The country joined the Association of Southeast Asian Nations (ASEAN) and
became a member of ASEAN Free Trade Area (AFTA) since 1995. It joined the Asian
Pacific Economic Corporation (APEC) in 1998. Vietnam also signed a bilateral trade
agreement (BTA) with the United States in 2001. And the process of negotiating for
accession to WTO has been started since 1995. 1 2nd-year PhD Candidate student at the Graduate School of Economics, Shiga University. E-mail address: [email protected]
2 It is worth noting that before the reform free market price of foreign exchange is usually 20 times higher than the official rate.
2
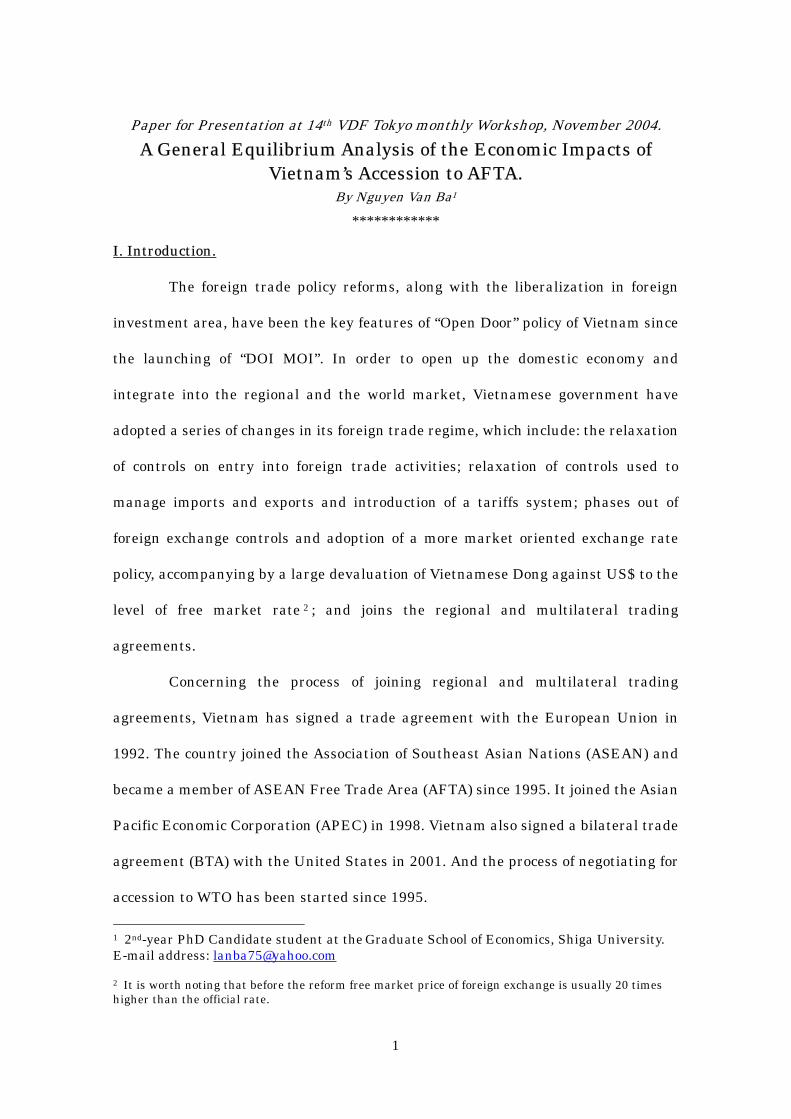
As a result of the trade liberalization policy, foreign trade performance of
Vietnam was remarkable with the annual average growth rate of both exports and
imports were about 30 percent up until the onset of the Asian Financial Crisis in
1997. The number of enterprises involved in foreign trade activities has blossomed
to thousands compare with only some State-monopoly Foreign Trade Corporations
before the reforms3. Both exports and imports values of Vietnam in term of the U. S
dollars expended about ten times within the period from 1990 to 2002 (Figure 1).
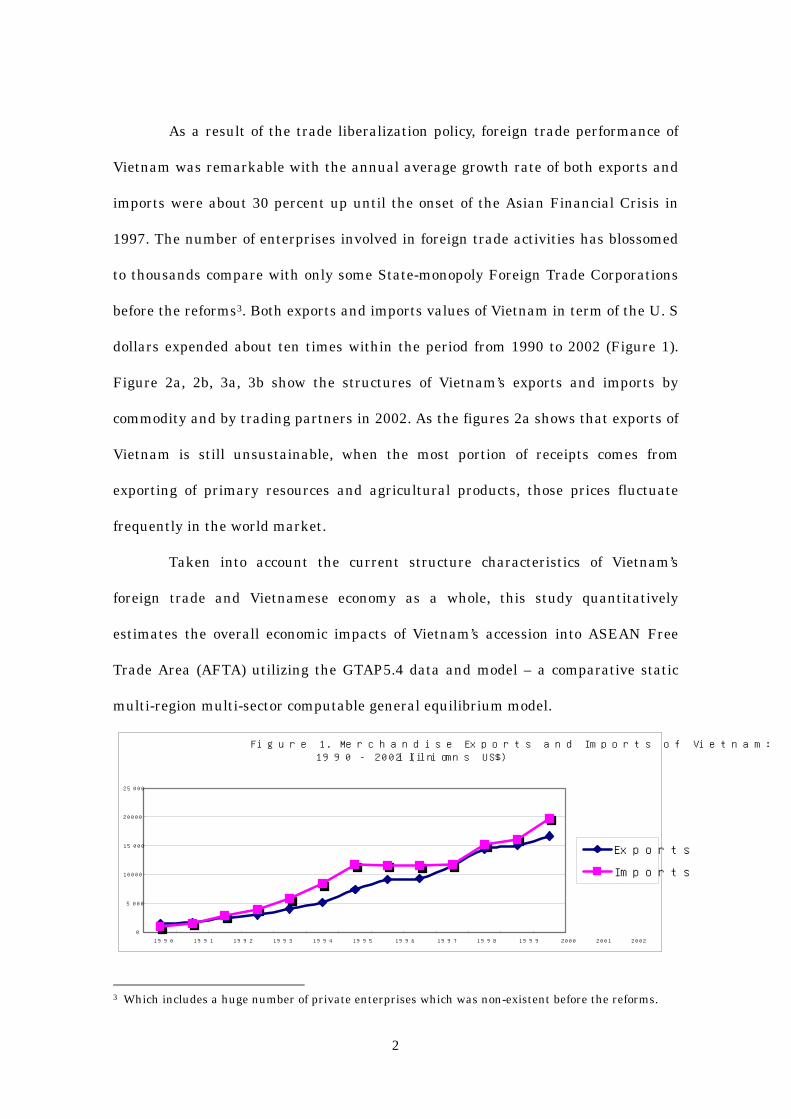
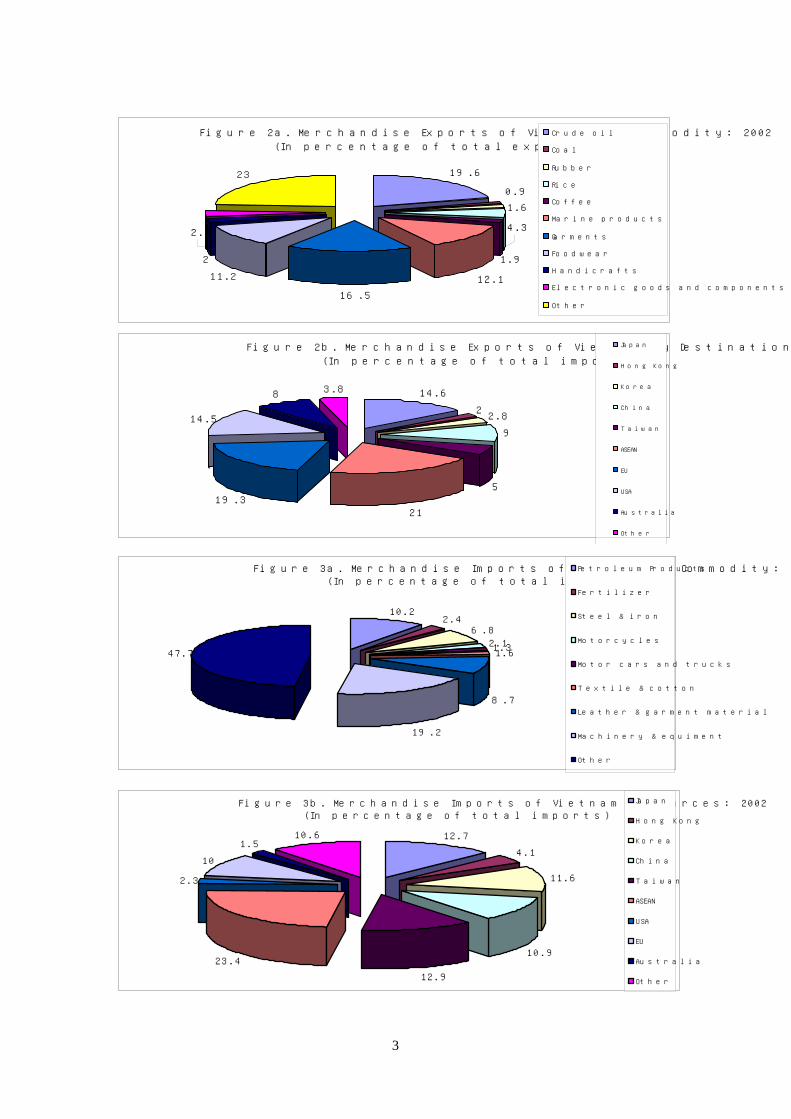
Figure 2a, 2b, 3a, 3b show the structures of Vietnam’s exports and imports by
commodity and by trading partners in 2002. As the figures 2a shows that exports of
Vietnam is still unsustainable, when the most portion of receipts comes from
exporting of primary resources and agricultural products, those prices fluctuate
frequently in the world market.
Taken into account the current structure characteristics of Vietnam’s
foreign trade and Vietnamese economy as a whole, this study quantitatively
estimates the overall economic impacts of Vietnam’s accession into ASEAN Free
Trade Area (AFTA) utilizing the GTAP5.4 data and model – a comparative static
multi-region multi-sector computable general equilibrium model.
Figure 1. Merchandise Exports and Imports of Vietnam: 1990 - 2002 (in millions US$)
0
5000
10000
15000
20000
25000
1990 1991 1992 1993 1994 1995 1996 1997 1998 1999 2000 2001 2002
Exports
Imports
3 Which includes a huge number of private enterprises which was non-existent before the reforms.
3
Figure 2a. Merchandise Exports of Vietnam by Commodity: 2002
(In percentage of total exports)
19.6
12.1
16.5
11.2
23
1.6
0.9
1.9
4.3
2
2.9
Crude oil
Coal
Rubber
Rice
Coffee
Marine products
Garments
Foodwear
Handicrafts
Electronic goods and components
Other
Figure 2b. Merchandise Exports of Vietnam by Destination: 2002
(In percentage of total imports)
14.6
22.8
9
5
2119.3
14.5
8 3.8
Japan
Hong Kong
Korea
China
Taiwan
ASEAN
EU
USA
Australia
Other
Figure 3a. Merchandise Imports of Vietnam by Commodity: 2002(In percentage of total imports)
10.22.4
6.8
2.11.31.6
8.7
19.2
47.7
Petroleum Products
Fertilizer
Steel & iron
Motorcycles
Motor cars and trucks
Textile & cotton
Leather & garment material
Machinery & equiment
Other
Figure 3b. Merchandise Imports of Vietnam by Sources: 2002(In percentage of total imports)
12.7
4.1
11.6
10.9
12.9
23.4
2.3
10
1.510.6
Japan
Hong Kong
Korea
China
Taiwan
ASEAN
USA
EU
Australia
Other
4
II. Emergence of ASEAN Free Trade Area (AFTA) and Commitments of Vietnam.
1. Emergence of ASEAN and AFTA.
The Association of Southeast Asian Nations or ASEAN was formally
established on 8th August 1967 in Bangkok by the five original Member Countries,
namely, Indonesia, Malaysia, the Philippine, Singapore and Thailand. Brunei
Darussalam joined in 1984, Vietnam in 1995, Laos and Myanmar in 1997, and
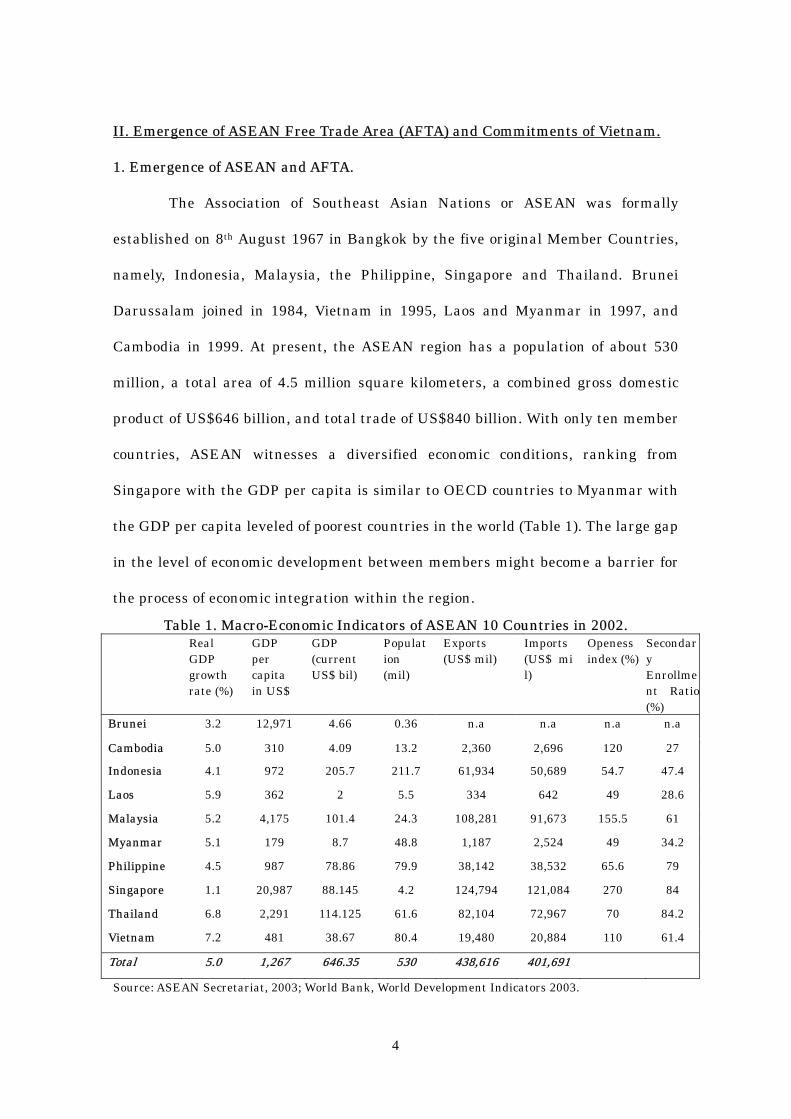
Cambodia in 1999. At present, the ASEAN region has a population of about 530
million, a total area of 4.5 million square kilometers, a combined gross domestic
product of US$646 billion, and total trade of US$840 billion. With only ten member
countries, ASEAN witnesses a diversified economic conditions, ranking from
Singapore with the GDP per capita is similar to OECD countries to Myanmar with
the GDP per capita leveled of poorest countries in the world (Table 1). The large gap
in the level of economic development between members might become a barrier for
the process of economic integration within the region.
Table 1. Macro-Economic Indicators of ASEAN 10 Countries in 2002. Real
GDP growth rate (%)
GDP per capita in US$
GDP (current US$ bil)
Population (mil)
Exports (US$ mil)
Imports (US$ mil)
Openess index (%)
Secondary Enrollment Ratio(%)
Brunei 3.2 12,971 4.66 0.36 n.a n.a n.a n.a
Cambodia 5.0 310 4.09 13.2 2,360 2,696 120 27
Indonesia 4.1 972 205.7 211.7 61,934 50,689 54.7 47.4
Laos 5.9 362 2 5.5 334 642 49 28.6
Malaysia 5.2 4,175 101.4 24.3 108,281 91,673 155.5 61
Myanmar 5.1 179 8.7 48.8 1,187 2,524 49 34.2
Philippine 4.5 987 78.86 79.9 38,142 38,532 65.6 79
Singapore 1.1 20,987 88.145 4.2 124,794 121,084 270 84
Thailand 6.8 2,291 114.125 61.6 82,104 72,967 70 84.2
Vietnam 7.2 481 38.67 80.4 19,480 20,884 110 61.4
Total 5.0 1,267 646.35 530 438,616 401,691
Source: ASEAN Secretariat, 2003; World Bank, World Development Indicators 2003.

5
In order to facilitate the economic cooperation and promote intraregional
trade between the members countries, in 1992, at the Fourth ASEAN Summit held
in Singapore, the Member Countries agreed to launch a scheme toward an ASEAN
Free Trade Area or AFTA within 15 years beginning from 1st January 1993. The
Common Effective Preferential Tariff (CEPT) scheme was designed to bring down
tariffs on all manufactured and processed agricultural products to 0-5 percent
within 15 years. During the 26th ASEAN Economic Ministers Meeting in September
1994, the time frame was shortened from fifteen to ten years, with the aim of
achieving the AFTA goals by the year of 2003 (by 2006 for Vietnam, 2008 for the
Laos and Myanmar and 2010 for Cambodia). In addition, the Meeting has agreed to
include all unprocessed agricultural products in the CEPT scheme.
There are four product lists are used as the instrument to determine the
pace and scope of liberalization under the CEPT scheme, including – the Inclusion
List (IL), the Temporary Exclusion List (TEL), the Sensitive List (SL) and the
General Exception List (GEL):
- Inclusion List. Products in the Inclusion List are those that have to undergo
immediate liberalization through reduction in intra-regional tariff rates, removal of
quantitative restrictions and other non-tariff barriers. Tariffs on these products
should be down to a maximum of 20% by the year 1998 and to 0-5% by the year 2002.
The new members of ASEAN have up to 2006 (Viet Nam), 2008 (Laos and
Myanmar) and 2010 (Cambodia) to meet this deadline. By the year 2000, there were
53,294 tariff lines in the Inclusion List representing 82.78% of all tariff lines in
ASEAN.
- Temporary Exclusion List. Products in the Temporary Exclusion List can be
shielded from trade liberalization only for a temporary period of time. However, all
6
these products would have to be transferred into the Inclusion List and begin a
process of tariff reduction so that tariffs would come down to 0-5%. Starting on 1
January 1996, annual installments of products from the TEL have been transferred
into the Inclusion List and then reduce to 0-5 percent by 2003. By the year 2000,
there remained 9,674 tariff lines in the TEL representing about 15.04% of all tariff
lines in ASEAN.
- Sensitive List. This contains unprocessed agricultural products, which are given a
longer time frame before being integrated with the free trade area. The commitment
to reduce tariffs to 0-5%, remove quantitative restrictions and other non-tariff
barriers is extended up to the year 2010. The new members of ASEAN have up to
2013 (Viet Nam), 2015 (Laos and Myanmar) and 2017 (Cambodia) to meet this
deadline. By the year 2000, there would be 370 tariff lines in the Sensitive List
making up 0.58% of all tariff lines in ASEAN.
- General Exception List. These products are permanently excluded from the free
trade area for reasons of protection of national security, public morals, human,
animal or plant life and health and articles of artistic, historic and archaeological
value. There are 1,036 tariff lines in the GE List representing about 1.61% of all
tariff lines in ASEAN.
As Figure 4 shown, by the year of 2000, there are 62,968 tariff lines out of
64,374 lines in the IL and TEL. This means that 98.1 percent of tariff lines will be
between 0-5 percent by 2003 (by 2006 for Vietnam and by 2008 for Laos and
Myanmar). The share of the SL and GEL, 0.58 percent and 1.61 percent respectively,
appear to be small relative to the IL and TEL.

7
Figure 4. Share of CEPT Package by 2000.
Sources: ASEAN Secretariat, ASEAN Free Trade Area: An Update, 1999.
Table 2 shows the CEPT product list by country. Although, the SL and the
GEL account for a relatively small share in total tariff lines, some commodities in
the SL and the GEL represent high trade volume and/or high tariff rates. For
instant, Indonesia includes a high portion of unprocessed agricultural products in
the SL including rice, wheat, and soy bean, which account for a large share of
import values from ASEAN. For Vietnam and Laos the import values in the GEL
correspond to 10 percent and 37 percent of total imports from ASEAN respectively4.
Table 2. CEPT Product Lists. IL TEL SL GEL
Country Tariff lines
Share (%)
Tariff lines
Share (%)
Tariff lines
Share (%)
Tariff lines
Share (%)
Total
Brunei 6105 94.0 135 2.1 14 0.2 239 3.7 6493Indonesia 6622 91.8 545 7.6 4 0.1 45 0.6 7216Laos 533 15.0 2831 79.7 96 2.7 91 2.6 3551Malaysia 8648 95.1 276 3.0 104 1.1 63 0.7 9091Myanmar 2356 43.1 2987 54.6 21 0.4 108 2.0 5472Philippine 5221 91.6 385 6.8 68 1.2 28 0.5 5702Singapore 5739 98.0 0 0.0 0 0.0 120 2.0 5859Thailand 9040 99.1 79 0.9 7 0.1 0 0.0 9126Vietnam 1718 57.0 1147 38.0 23 0.8 127 4.2 3015Total 45982 82.8 8385 15.1 337 0.6 821 1.5 55525Source: ASEAN Secretariat, CEPT Product Lists, 1998.
4 Fukase and Martin, 2001.
8
One of the important natures of the CEPT scheme is that the concessions
are granted on a reciprocal, product by product basic. A product is eligible for
concession under the scheme has to meet three conditions. Firstly, the product
should be included in the IL of the both importing and exporting countries. Secondly,
in order to receive all concession, the product must have a CEPT tariff of 20 percent
or below. Thirdly, the product has to satisfy the local content requirement of at least
40 percent. In the short run, the reciprocal requirement of the CEPT scheme
provides incentives for the member countries to include their commodities in the IL
and to reduce tariffs below 20 percent to receive concessions. The CEPT scheme also
involves a phased reduction in tariff. Another key feature of the CEPT is that
member countries are required to eliminate all quantitative restrictions and
non-tariff barriers (NTBs) on products on which they receive CEPT concessions
within a period of five years after receiving concessions. The NTBs covers
para-tariff measures, price control measures, finance measures, monopolistic
measures, and technical measures (ASEAN Secretariat, 1995).
2. Position of Vietnam in ASEAN and Its Commitments in AFTA.
Vietnam officially became the seventh member of ASEAN on 28th July of
1995. As a consequence of its membership, Vietnam has agreed to join with other
ASEAN countries to form an ASEAN Free Trade Area. Vietnam is the second
populous country in ASEAN after Indonesia with its 80 million people in 2002.
However, Vietnam is still a low-income economy in the region with relatively small
share of GDP and trade values, about 6 percent and 4.8 percent respectively (Table
1). As a transitional economy, Vietnam has been one of the fastest growing
economies in the 1990’s. In 2002, total exports plus imports relative to GDP reached
110 percent, a relatively high figure for a populous economy. Compare with five

9
original members of ASEAN, Vietnam’s economy is predominantly agricultural and
primary production, particularly, economic structure of Vietnam is reflected in its
imports and exports commodity structures (Figure 2a and 3a). As represents in
Figure 2b, 21 percent of Vietnam exports in 2002 go to ASEAN countries. Within the
region, Singapore is the largest market for Vietnam made products, follows by
Philippine, Thailand. Concerning the imports side, in 2002, Vietnam sourced about
24 percent of its imports from ASEAN countries (Figure 3b). Similar with the export
market share, the biggest source of Vietnam’s imports is Singapore, followed by
Thailand and Malaysia.
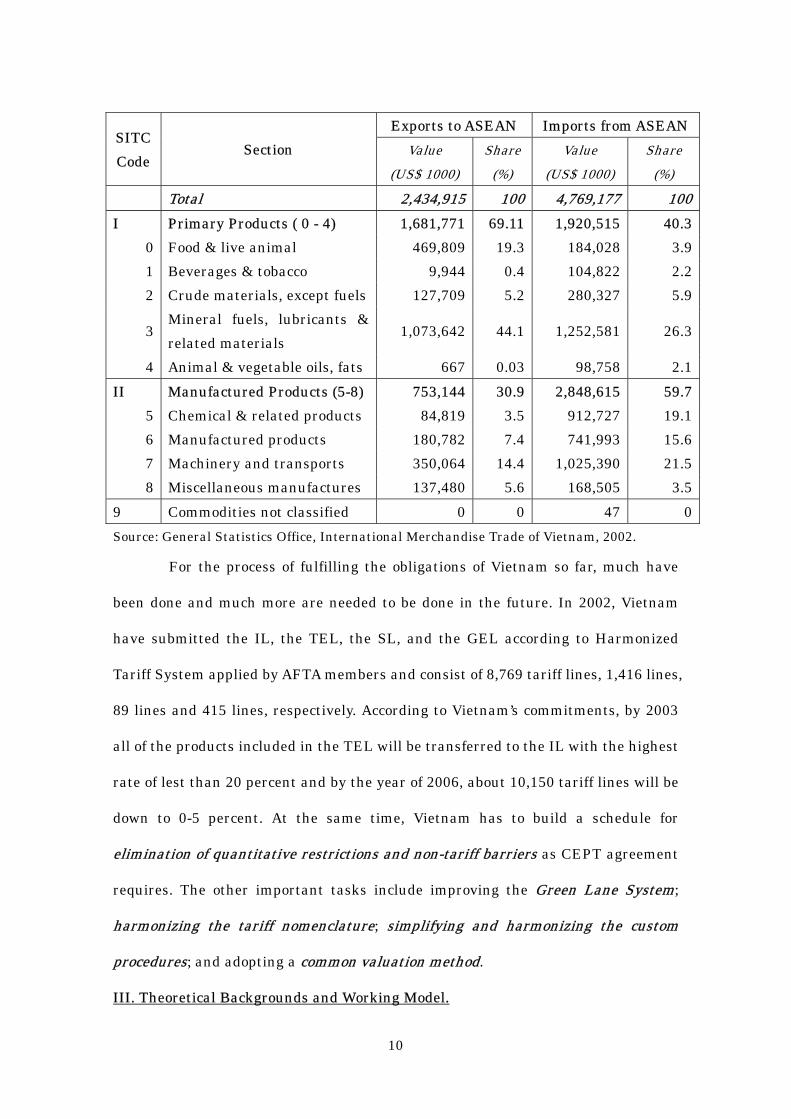
Table 3 illustrates the composition of Vietnam’s trade with ASEAN-10 by
commodity in 2002. Primary products exports accounted for nearly 70 percent of
Vietnam total exports value to ASEAN, in which a large share was crude oil
exported to Singapore. There was only 30 percent of export revenues come from
manufactures exports. The fact means that liberalization of partner markets for
primary products of Vietnam is much more important for Vietnam than
liberalization for manufactured products5. In contrast, Vietnam imported about 60
percent of manufactured products in total imports from ASEAN and only 40 percent
of primary products in 2002 6 (Table 3). It is clearly that, fulfilling CEPT
obligations7 means increasing the share of manufactured exports to Vietnam in the
future and domestic producers should anticipate the stiffer competition from
cheaper imported manufacturing products from ASEAN countries.
Table 3. Trade with ASEAN by SITC 1-digit commodity in 2002. 5 It is worth noting that almost unprocessed agricultural products still lies in the Sensitive List of CEPT scheme. 6 I believe that the main portion of sector 3: Mineral fuels, lubricant and related materials is petroleum products come from Singapore. 7 Almost all tariff lines of manufactured products are included in the Inclusion List of CEPT.
10
Exports to ASEAN Imports from ASEANSITC Code
Section Value (US$ 1000)
Share (%)
Value (US$ 1000)
Share (%)
Total 2,434,915 100 4,769,177 100I Primary Products ( 0 - 4) 1,681,771 69.11 1,920,515 40.3
0 Food & live animal 469,809 19.3 184,028 3.91 Beverages & tobacco 9,944 0.4 104,822 2.22 Crude materials, except fuels 127,709 5.2 280,327 5.9
3 Mineral fuels, lubricants & related materials
1,073,642 44.1 1,252,581 26.3
4 Animal & vegetable oils, fats 667 0.03 98,758 2.1II Manufactured Products (5-8) 753,144 30.9 2,848,615 59.7
5 Chemical & related products 84,819 3.5 912,727 19.16 Manufactured products 180,782 7.4 741,993 15.67 Machinery and transports 350,064 14.4 1,025,390 21.58 Miscellaneous manufactures 137,480 5.6 168,505 3.5
9 Commodities not classified 0 0 47 0Source: General Statistics Office, International Merchandise Trade of Vietnam, 2002.
For the process of fulfilling the obligations of Vietnam so far, much have
been done and much more are needed to be done in the future. In 2002, Vietnam
have submitted the IL, the TEL, the SL, and the GEL according to Harmonized
Tariff System applied by AFTA members and consist of 8,769 tariff lines, 1,416 lines,
89 lines and 415 lines, respectively. According to Vietnam’s commitments, by 2003
all of the products included in the TEL will be transferred to the IL with the highest
rate of lest than 20 percent and by the year of 2006, about 10,150 tariff lines will be
down to 0-5 percent. At the same time, Vietnam has to build a schedule for
elimination of quantitative restrictions and non-tariff barriers as CEPT agreement
requires. The other important tasks include improving the Green Lane System;
harmonizing the tariff nomenclature; simplifying and harmonizing the custom
procedures; and adopting a common valuation method.
III. Theoretical Backgrounds and Working Model.

11
1. Theory of Preferential Trade Liberalization.
The preferential trade liberalization is the liberalization of foreign trade
barriers on discriminatory basic. Under AFTA, Vietnam and ASEAN members will
eliminate their barriers to trade with each others only, when the trade barriers with
other trading partners remain unchanged. In order to evaluate the economic
impacts of such preferential trade liberalization, the theoretical impacts will be
considered bellows.
First, we consider the effects of changes in the rates of protection that
Vietnam levies on its imports. The concept of trade creation and trade diversion are
central to the evaluation of discriminatory trade liberalization. Trade creation
measures the gains from expanding trade in the products being liberalized. Trade
diversion, in contrast, measures the reductions in trade of products disadvantages
by the preferential liberalization. To aid understanding of the concept of trade
creation, the market for goods imported from ASEAN is illustrated in Figure
Figure 5a. Welfare impacts of Vietnam’s liberalization of ASEAN members’ imports.
In the initial equilibrium, Vietnam imposes a tariff t from the ASEAM members (Pd
Dasean
Pd
Pasean
Pw
0m 1m0
a
cb
d e
12
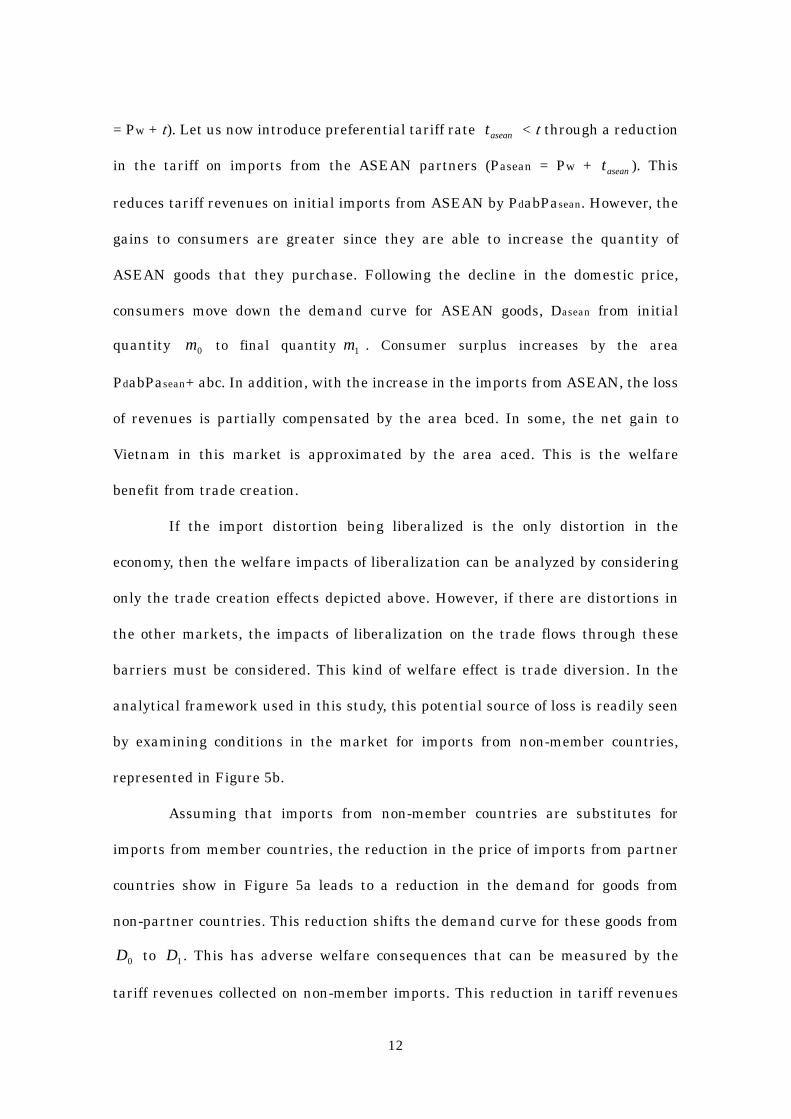
= Pw + t). Let us now introduce preferential tariff rate aseant < t through a reduction
in the tariff on imports from the ASEAN partners (Pasean = Pw + aseant ). This
reduces tariff revenues on initial imports from ASEAN by PdabPasean. However, the
gains to consumers are greater since they are able to increase the quantity of
ASEAN goods that they purchase. Following the decline in the domestic price,
consumers move down the demand curve for ASEAN goods, Dasean from initial
quantity 0m to final quantity 1m . Consumer surplus increases by the area
PdabPasean+ abc. In addition, with the increase in the imports from ASEAN, the loss
of revenues is partially compensated by the area bced. In some, the net gain to
Vietnam in this market is approximated by the area aced. This is the welfare
benefit from trade creation.
If the import distortion being liberalized is the only distortion in the
economy, then the welfare impacts of liberalization can be analyzed by considering
only the trade creation effects depicted above. However, if there are distortions in
the other markets, the impacts of liberalization on the trade flows through these
barriers must be considered. This kind of welfare effect is trade diversion. In the
analytical framework used in this study, this potential source of loss is readily seen
by examining conditions in the market for imports from non-member countries,
represented in Figure 5b.
Assuming that imports from non-member countries are substitutes for
imports from member countries, the reduction in the price of imports from partner
countries show in Figure 5a leads to a reduction in the demand for goods from
non-partner countries. This reduction shifts the demand curve for these goods from
0D to 1D . This has adverse welfare consequences that can be measured by the
tariff revenues collected on non-member imports. This reduction in tariff revenues

13
corresponds to a reduction in welfare because each unit of the good that was
previously imported was worth dp to consumers in the imported market, but cost
the country only wp to purchase in world markets. The welfare loss to Vietnam is
the loss in tariff revenues shown by the area abcd (Figure 5b)
Figure 5b. Impact of preferential liberalization on imports
from non-member countries.
. Whether, there is a net gain or loss to Vietnam depends on the relative
sizes of the two shaded areas in Figure 5a and Figure5b.
Now we turn to the analysis of impacts of liberalization of trade barriers on
Vietnam exports to member countries. In the export side, Vietnam will experience a
term of trade gains. The reduction in the ASEAN members’ tariff on exports from
Vietnam shifts the demand curve for exports from 0pD to 1pD . The result is an
increase in both the volume of exports from Vietnam to ASEAN, and an increase in the
price received for these exports (shaded area pp ef wp ).
0D
1D
Price
Imports from non-members
wp
tpw + a
c
b
d
1m0
0m

14
Figure 5c. Term of Trade impacts of improved access to member markets.
All of the impacts of discriminatory trade liberalization outlined above need
to be taken into account simultaneously in forming an overall assessment of the
proposed approach. While diagrams of the type shown above help understanding,
they do not provide a practical basic for making on overall evaluation. By contrast,
quantitative models allow all of these effects to be taken into account at once.
2. Working Model.
In order to quantitatively evaluate the economic impacts of Vietnam
accession into AFTA, this study make use of Global Trade Analysis (GTAP) Model –
a comparative static standard multi-sector multi-region Computable General
Equilibrium Model – which incorporates the necessary links between global factor
demand, production structures, trade and protections. The GTAP model is
documented comprehensively in Hertel (1997), with updated information on the
0pD
pp
wp
e
f
0
0x 1x
f
1ES
1pD

15
GTAP website 8 . The model assumes that firm use constant return to scale
technology in perfect competitive markets. Household consumption behavior is
represented by a constant difference elasticity (CDE) expenditure function, while
consumption and government demand are characterized by constant value shares.
The equilibrium levels of production and consumption are determined by global
demand and supply of the products and zero economic profit for firms. Trade goods
are linked through international trade. A key assumption of the model is that
Vietnamese consumers distinguished between imported and domestic goods, and
between imports by country of origin, under the so-called Armington (1969)
assumption.
The version of the model utilized in this study is based on the Version 5.4
GTAP data base. The based year of this data set is 1997. The data base depict the
real world economic structure in 1997, which consists of 57 sector of production and
78 regions.
IV. Simulation Designs and Results Analysis.
1. Simulation Designs.
In order to explore the quantitative effects of CEPT liberalization on
Vietnam economy, three simulations according to the CEPT scheme schedule in
which Vietnam has committed is going to implemented. Due to the lack of
information about Brunei in GTAP 5.4 data base, this study concentrates on the
liberalization of Vietnam against ASEAN-5, namely, Indonesia, Malaysia, the
Philippine, Singapore and Thailand. First, the liberalization of products include in
the Including List and the Temporal Excluding List which is supposed to be in the
8 www.gtap.agecon.purdue.edu/

16
range of 0-5 percent by 1st January of 2006. Second, the tariffs on the products
(mostly unprocessed agricultural products) lie in the Sensitive List will be down to
0-5 percent by 2013 (for Vietnam). Third, the liberalization of products in the
General Excluding List is examined. This is realistically to considered the
possibility of liberalization of some products in the GEL, because Vietnam has the
largest number of tariff lines in the GEL, which include not only the products as
defined by the 9B section of CEPT/AFTA 1992, but also the products which receives
strong protection such as motor vehicles and parts. At this moment, the Ministry of
Finance of Vietnam has proposed to the Prime Minister for reviewing the GEL and
further phase out those kinds of products.
The simulations are designed as below:
Simulation Design: Scenario 1: AFTA1, Vietnam liberalizes the products in the Inclusion List and Temporary Excluding List and the ASEAN-5 members reciprocate the concessions. Scenario 2: AFTA2, Senario 1 plus liberalization of products in the Sensitive List and ASEAN-5 members reciprocate the concessions. Scenario 3: AFTA3, Senario 2 plus liberalization of products in the General Exclusion List and ASEAN-5 members reciprocate concessions.
In order to run the simulations as above making use of the GTAP 5.4 data
base and standard model which consists of 57 sectors and 78 countries/regions, an
aggregation scheme of regions and sectors must be preceded.
REGIONS AGGREGATION.
1. VNM: Vietnam 5. SGP: Singapore 2. IND: Indonesia 6. THA: Thailand 3. MYS: Malaysia 7. JPN: Japan 4. PHL: The Philippine 8. ROW: Rest of the world

17
SECTORS AGGREGATION. 5. LIGHMANU(light manufacturing)27. textiles 28. wearing apparel 29. leather products 30. wood products 31. paper products & publishing
6. FUELS 32. Petroleum, coal products
1. AGR (Agricultures and Forestry) 1. paddy rice 2. wheat 3. cereal grains nec 4. vegetables, fruits, nuts 5. oil seeds 6. sugar cane, sugar beet 7. plant based fibers 8. crops nec 9. bovine cattle, sheep, goats, horses 10. animal products nec 11. raw milk 12. wool, silk-worn cocoons 13. forestry 14 fishing
7. BASMANU(basic manufacturing) 33. chemical, rubber, plastic products 34. mineral products nec 35. ferrous metal 36. metal nec 37. metal products
8. AUTO (auto vehicle and others) 38. motor vehicle and parts 39. transport equipments nec
2. RESOURCE (natural resources) 15. coal 16. oil 17. gas 18. mineral nec
9. ELECTMACH 40. electronic equipments 41. machinery equipment and nec 42. manufactures nec
3. FOODS 19. bovine meat products 20. meat products nec 21. vegetables oil and fats 22. dairy products 23. processed rice 24. sugar 25. food products nec 4. BEVTAB (beverages and tobacco) 26. beverages and tobacco products
10. SVCES (services) 43. electricity 44. gas manuf., distribution 45. water 46. construction 47. trade 48. transport nec 49. water transport 50. air transport 51. communication 52. financial services nec 53. insurance 54. business service nec 55. recreational & other services 56. public services 57. dwelling

18
Before implementing the experiments of CEPT tariff liberalization, it is
worth looking at the initial rates of protection imposed on Vietnam’s exports by the
ASEAN members and the rates of protection that Vietnam levies on imports from
members countries in the based year (the based year of GTAP 5.4 data is 1997)
according to the above aggregation.
Table 4a. Ad valorem import tax rates imposed by Vietnam on imports from ASEAN-5 members countries (%).
Products 2 IND 3 MYS 4 PHL 5 SGP 6 THA
1 AGR 0.76 2.53 8.04 20.12 0.39
2 NATFUEL 2.32 4.39 1.44 0.74 1.71
3 FOOD 30.07 20.27 11.27 32.56 1.35
4 BEVTAB 99.14 96.33 36.1 99.96 75
5 LIGHMANU 21.1 9.19 15.07 26.04 23.91
6 FUELS 0 38.6 6.53 38.73 34.74
7 BASMANU 5.1 9.69 2.11 9.75 9.28
8 AUTO 47.5 38.08 15.93 21.79 52.88
9 ELECMACH 14.55 23.67 3.71 9.81 13.81
Table 4b. Ad Valorem import tax rates imposed by ASEAN-5 members countries on Vietnam’s exports in 1997(%).
Products 2 IND 3 MYS 4 PHL 5 SGP 6 THA
1 AGR 4.11 69.89 11.6 0.39 18.37
2 NATFUEL 2.71 0.18 0 0 3.13
3 FOOD 3.98 32.55 49.64 7.77 40.33
4 BEVTAB 86.11 9.44 17.03 0 50.96
5 LIGHMANU 19.07 21.05 32 0 41.47
6 FUELS 0 0 0 0 0
7 BASMANU 8.99 2.32 0 0 14.27
8 AUTO 3.47 26.19 0 0 10.67
9 ELECMACH 1.34 6.92 0 0 6.87
Source: GTAP 5.4 data base.

19
2. Results Analysis.
a) Change in Direction of Trade.
Table 5b and Table 6b below provide the information about the changes in
direction of exports and imports of Vietnam with ASEAN member countries, Japan
and the rest of the world as the results of CEPT liberalization.
First, we look at the changes in direction of exports of Vietnam after
liberalization of AFTA 1 (involves the liberalization of products in the IL and TEL).
The exports of Vietnam to Malaysia, the Philippine and Thailand sharply increase
by 67%, 100% and 67%, respectively. That is due to the high protection rate of those
three countries on Vietnam export products before the liberalization. While exports
to Singapore slightly decease due the very low rate of import tariff that Singapore
levied on Vietnam exports (almost at 0%) before the liberalization (Table 4b). The
lowered protection in ASEAN countries makes Vietnam exporters change their
markets to ASEAN countries, exports to Japan and ROW, where the rates of
protection remain unchanged, decrease by 2.9% and 3.5%, respectively. Exports of
three liberalized sectors, including foods, light manufactures and electric and
machinery, contribute most to increases of exports to ASEAN members. When
Vietnam and ASEAN members liberalize the SL, which consist of almost
unprocessed agriculture products (AFTA 2), which is the comparative advantage
sectors of Vietnam at the moment, agricultural exports of Vietnam is double,
contrasting with the AFTA1 scenario, exports of those products decrease in all
markets. Malaysia is account for the largest parts of increase due to its inclusion of
many unprocessed agriculture in its SL.
The most interesting results are in the third scenario when Vietnam and
ASEAN members liberalize the GEL, exports of Vietnam to all ASEAN member
20
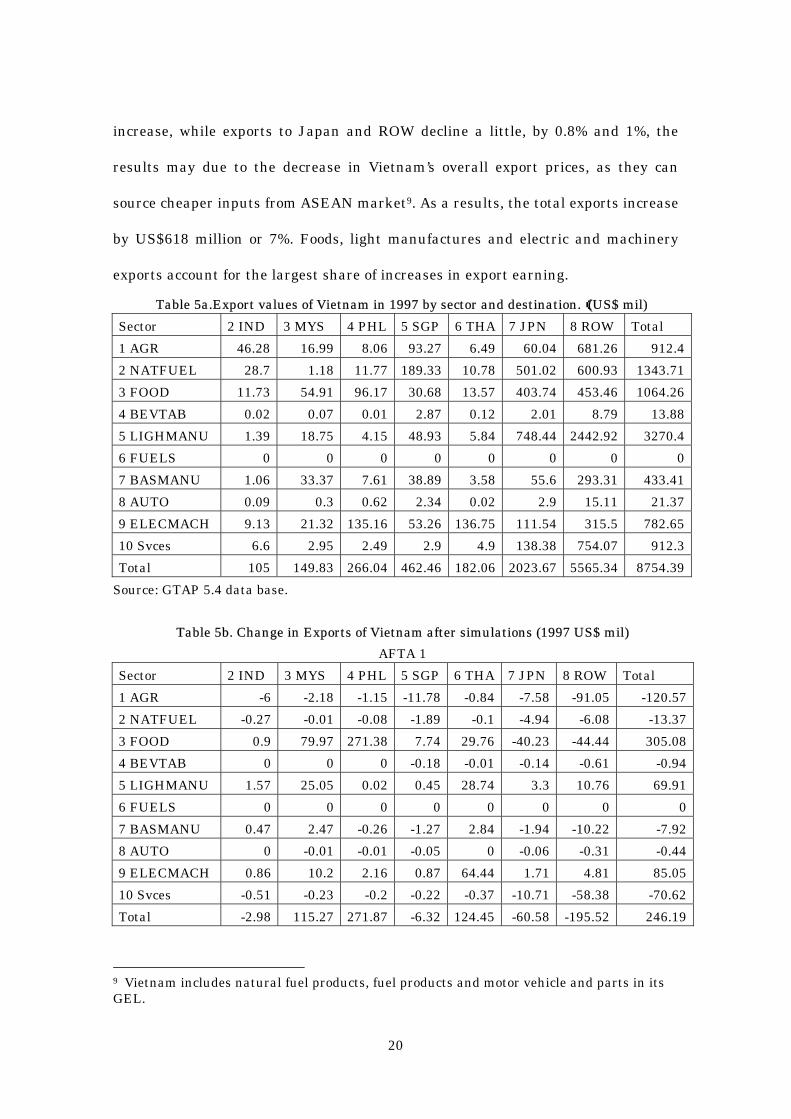
increase, while exports to Japan and ROW decline a little, by 0.8% and 1%, the
results may due to the decrease in Vietnam’s overall export prices, as they can
source cheaper inputs from ASEAN market9. As a results, the total exports increase
by US$618 million or 7%. Foods, light manufactures and electric and machinery
exports account for the largest share of increases in export earning.
Table 5a.Export values of Vietnam in 1997 by sector and destination.((US$ mil) Sector 2 IND 3 MYS 4 PHL 5 SGP 6 THA 7 JPN 8 ROW Total 1 AGR 46.28 16.99 8.06 93.27 6.49 60.04 681.26 912.42 NATFUEL 28.7 1.18 11.77 189.33 10.78 501.02 600.93 1343.713 FOOD 11.73 54.91 96.17 30.68 13.57 403.74 453.46 1064.264 BEVTAB 0.02 0.07 0.01 2.87 0.12 2.01 8.79 13.885 LIGHMANU 1.39 18.75 4.15 48.93 5.84 748.44 2442.92 3270.46 FUELS 0 0 0 0 0 0 0 07 BASMANU 1.06 33.37 7.61 38.89 3.58 55.6 293.31 433.418 AUTO 0.09 0.3 0.62 2.34 0.02 2.9 15.11 21.379 ELECMACH 9.13 21.32 135.16 53.26 136.75 111.54 315.5 782.6510 Svces 6.6 2.95 2.49 2.9 4.9 138.38 754.07 912.3Total 105 149.83 266.04 462.46 182.06 2023.67 5565.34 8754.39
Source: GTAP 5.4 data base.
Table 5b. Change in Exports of Vietnam after simulations (1997 US$ mil) AFTA 1
Sector 2 IND 3 MYS 4 PHL 5 SGP 6 THA 7 JPN 8 ROW Total 1 AGR -6 -2.18 -1.15 -11.78 -0.84 -7.58 -91.05 -120.572 NATFUEL -0.27 -0.01 -0.08 -1.89 -0.1 -4.94 -6.08 -13.373 FOOD 0.9 79.97 271.38 7.74 29.76 -40.23 -44.44 305.084 BEVTAB 0 0 0 -0.18 -0.01 -0.14 -0.61 -0.945 LIGHMANU 1.57 25.05 0.02 0.45 28.74 3.3 10.76 69.916 FUELS 0 0 0 0 0 0 0 07 BASMANU 0.47 2.47 -0.26 -1.27 2.84 -1.94 -10.22 -7.928 AUTO 0 -0.01 -0.01 -0.05 0 -0.06 -0.31 -0.449 ELECMACH 0.86 10.2 2.16 0.87 64.44 1.71 4.81 85.0510 Svces -0.51 -0.23 -0.2 -0.22 -0.37 -10.71 -58.38 -70.62Total -2.98 115.27 271.87 -6.32 124.45 -60.58 -195.52 246.19
9 Vietnam includes natural fuel products, fuel products and motor vehicle and parts in its GEL.

21
AFTA 2 1 AGR -1.99 132.71 2.43 -17.61 4.77 -11.93 -142.91 -34.532 NATFUEL -0.34 -0.01 -0.11 -2.34 -0.13 -6.12 -7.53 -16.583 FOOD 0.24 73.12 254.53 5.66 27.38 -60.21 -66.55 234.164 BEVTAB 0 -0.01 0 -0.24 -0.01 -0.18 -0.8 -1.255 LIGHMANU 1.54 24.53 -0.03 -0.19 28.32 -5.95 -19.93 28.296 FUELS 0 0 0 0 0 0 0 07 BASMANU 0.45 2.04 -0.34 -1.71 2.77 -2.56 -13.51 -12.868 AUTO 0 -0.01 -0.02 -0.08 0 -0.1 -0.54 -0.769 ELECMACH 0.76 9.89 0.82 0.35 62.46 0.6 1.68 76.5610 Svces -0.58 -0.26 -0.23 -0.25 -0.43 -12.29 -66.99 -81.03Total 0.08 242.01 257.05 -16.42 125.13 -98.76 -317.09 191.99
AFTA 3 1 AGR -1.72 133.61 2.49 -16.06 4.81 -11.65 -139.58 -28.12 NATFUEL 4.44 0.02 -0.06 3.97 2.19 -2.71 -3.34 4.513 FOOD 0.76 78.59 267.61 7.37 29.25 -44.65 -49.38 289.564 BEVTAB 0.71 0.06 0.01 0.16 1.48 0.12 0.5 3.055 LIGHMANU 1.69 26.76 0.18 2.39 30.09 31.87 106.21 199.196 FUELS 0 0 0 0 0 0 0 07 BASMANU 0.54 4.15 0.07 0.46 3.15 0.51 2.68 11.568 AUTO 0.14 5.43 0.48 1.88 0.11 2.27 11.83 22.139 ELECMACH 1.33 11.67 8.51 3.38 73.98 6.95 19.6 125.4310 Svces -0.06 -0.03 -0.03 -0.02 -0.02 -1.44 -7.76 -9.36Total 7.83 260.26 279.25 3.54 145.05 -18.74 -59.22 617.97
Source: Author’s simulation results.
Concerning the imports side, Table 6b shows that due to the lowered tariff
rates levies on imports from ASEAN countries, imports from all ASEAN members
increase by the scarifying of imports from Japan and ROW. Malaysia, Singapore
and Thailand make the largest increase in total rising of imports from ASEAN, by
US$217 million, US$ 504 million and US$ 201 million, respectively. That reflects
the present high protection rates of Vietnam imposed on imports from those three
countries. The imports of electronics and machinery sector from Singapore,
Malaysia and Thailand show the largest increases. The total imports of this sector
increases by US$ 448 million or 48.9%. That followed by imports of basic
22
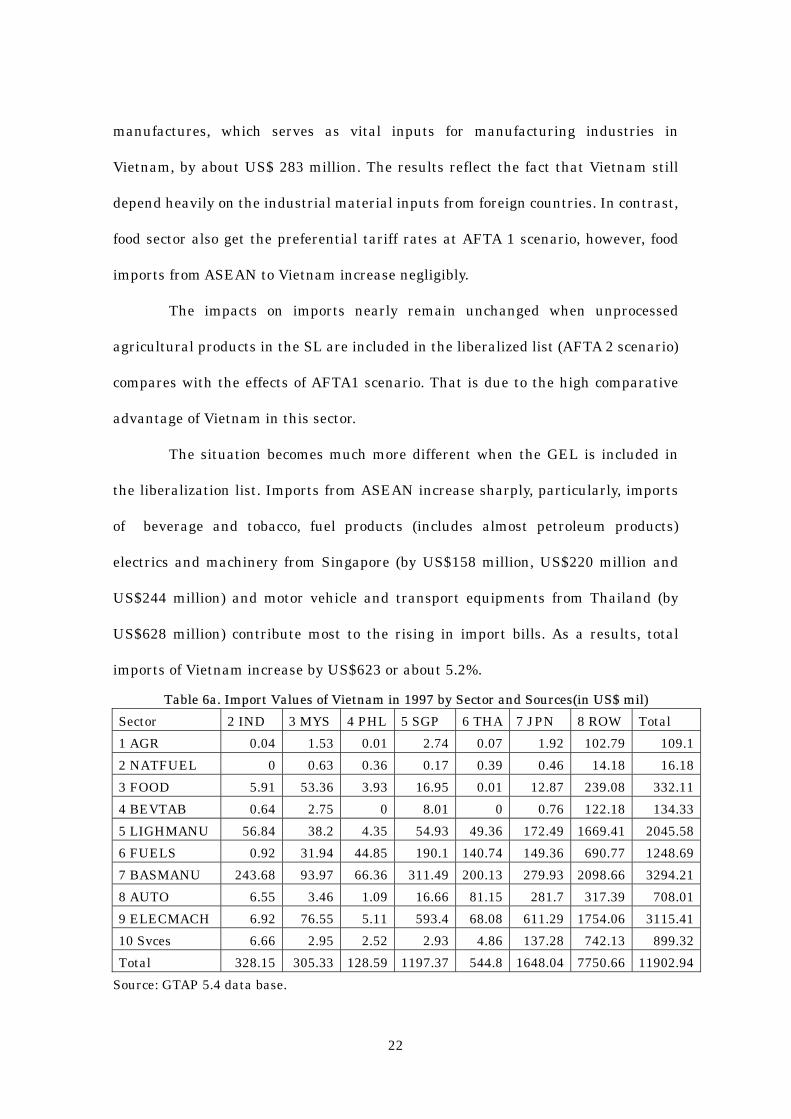
manufactures, which serves as vital inputs for manufacturing industries in
Vietnam, by about US$ 283 million. The results reflect the fact that Vietnam still
depend heavily on the industrial material inputs from foreign countries. In contrast,
food sector also get the preferential tariff rates at AFTA 1 scenario, however, food
imports from ASEAN to Vietnam increase negligibly.
The impacts on imports nearly remain unchanged when unprocessed
agricultural products in the SL are included in the liberalized list (AFTA 2 scenario)
compares with the effects of AFTA1 scenario. That is due to the high comparative
advantage of Vietnam in this sector.
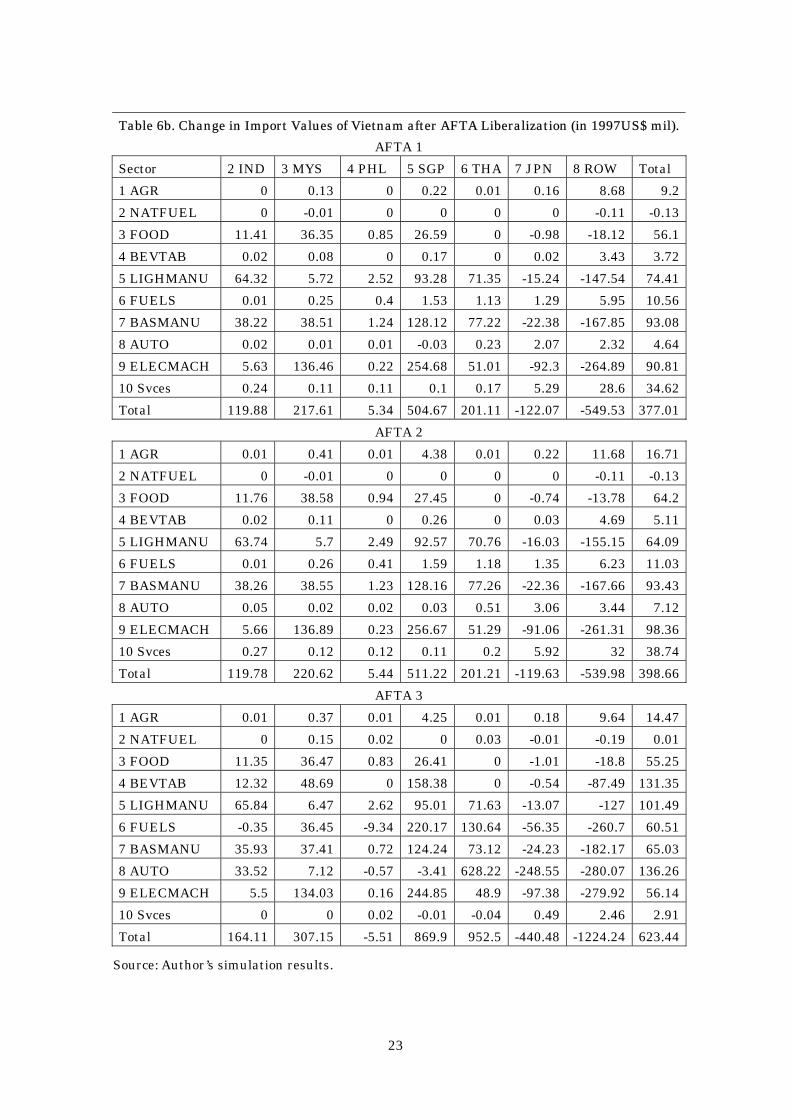
The situation becomes much more different when the GEL is included in
the liberalization list. Imports from ASEAN increase sharply, particularly, imports
of beverage and tobacco, fuel products (includes almost petroleum products)
electrics and machinery from Singapore (by US$158 million, US$220 million and
US$244 million) and motor vehicle and transport equipments from Thailand (by
US$628 million) contribute most to the rising in import bills. As a results, total
imports of Vietnam increase by US$623 or about 5.2%.
Table 6a. Import Values of Vietnam in 1997 by Sector and Sources(in US$ mil) Sector 2 IND 3 MYS 4 PHL 5 SGP 6 THA 7 JPN 8 ROW Total 1 AGR 0.04 1.53 0.01 2.74 0.07 1.92 102.79 109.12 NATFUEL 0 0.63 0.36 0.17 0.39 0.46 14.18 16.183 FOOD 5.91 53.36 3.93 16.95 0.01 12.87 239.08 332.114 BEVTAB 0.64 2.75 0 8.01 0 0.76 122.18 134.335 LIGHMANU 56.84 38.2 4.35 54.93 49.36 172.49 1669.41 2045.586 FUELS 0.92 31.94 44.85 190.1 140.74 149.36 690.77 1248.697 BASMANU 243.68 93.97 66.36 311.49 200.13 279.93 2098.66 3294.218 AUTO 6.55 3.46 1.09 16.66 81.15 281.7 317.39 708.019 ELECMACH 6.92 76.55 5.11 593.4 68.08 611.29 1754.06 3115.4110 Svces 6.66 2.95 2.52 2.93 4.86 137.28 742.13 899.32Total 328.15 305.33 128.59 1197.37 544.8 1648.04 7750.66 11902.94
Source: GTAP 5.4 data base.
23
Table 6b. Change in Import Values of Vietnam after AFTA Liberalization (in 1997US$ mil).AFTA 1
Sector 2 IND 3 MYS 4 PHL 5 SGP 6 THA 7 JPN 8 ROW Total 1 AGR 0 0.13 0 0.22 0.01 0.16 8.68 9.22 NATFUEL 0 -0.01 0 0 0 0 -0.11 -0.133 FOOD 11.41 36.35 0.85 26.59 0 -0.98 -18.12 56.14 BEVTAB 0.02 0.08 0 0.17 0 0.02 3.43 3.725 LIGHMANU 64.32 5.72 2.52 93.28 71.35 -15.24 -147.54 74.416 FUELS 0.01 0.25 0.4 1.53 1.13 1.29 5.95 10.567 BASMANU 38.22 38.51 1.24 128.12 77.22 -22.38 -167.85 93.088 AUTO 0.02 0.01 0.01 -0.03 0.23 2.07 2.32 4.649 ELECMACH 5.63 136.46 0.22 254.68 51.01 -92.3 -264.89 90.8110 Svces 0.24 0.11 0.11 0.1 0.17 5.29 28.6 34.62Total 119.88 217.61 5.34 504.67 201.11 -122.07 -549.53 377.01
AFTA 2 1 AGR 0.01 0.41 0.01 4.38 0.01 0.22 11.68 16.712 NATFUEL 0 -0.01 0 0 0 0 -0.11 -0.133 FOOD 11.76 38.58 0.94 27.45 0 -0.74 -13.78 64.24 BEVTAB 0.02 0.11 0 0.26 0 0.03 4.69 5.115 LIGHMANU 63.74 5.7 2.49 92.57 70.76 -16.03 -155.15 64.096 FUELS 0.01 0.26 0.41 1.59 1.18 1.35 6.23 11.037 BASMANU 38.26 38.55 1.23 128.16 77.26 -22.36 -167.66 93.438 AUTO 0.05 0.02 0.02 0.03 0.51 3.06 3.44 7.129 ELECMACH 5.66 136.89 0.23 256.67 51.29 -91.06 -261.31 98.3610 Svces 0.27 0.12 0.12 0.11 0.2 5.92 32 38.74Total 119.78 220.62 5.44 511.22 201.21 -119.63 -539.98 398.66
AFTA 3 1 AGR 0.01 0.37 0.01 4.25 0.01 0.18 9.64 14.472 NATFUEL 0 0.15 0.02 0 0.03 -0.01 -0.19 0.013 FOOD 11.35 36.47 0.83 26.41 0 -1.01 -18.8 55.254 BEVTAB 12.32 48.69 0 158.38 0 -0.54 -87.49 131.355 LIGHMANU 65.84 6.47 2.62 95.01 71.63 -13.07 -127 101.496 FUELS -0.35 36.45 -9.34 220.17 130.64 -56.35 -260.7 60.517 BASMANU 35.93 37.41 0.72 124.24 73.12 -24.23 -182.17 65.038 AUTO 33.52 7.12 -0.57 -3.41 628.22 -248.55 -280.07 136.269 ELECMACH 5.5 134.03 0.16 244.85 48.9 -97.38 -279.92 56.1410 Svces 0 0 0.02 -0.01 -0.04 0.49 2.46 2.91Total 164.11 307.15 -5.51 869.9 952.5 -440.48 -1224.24 623.44
Source: Author’s simulation results.
24
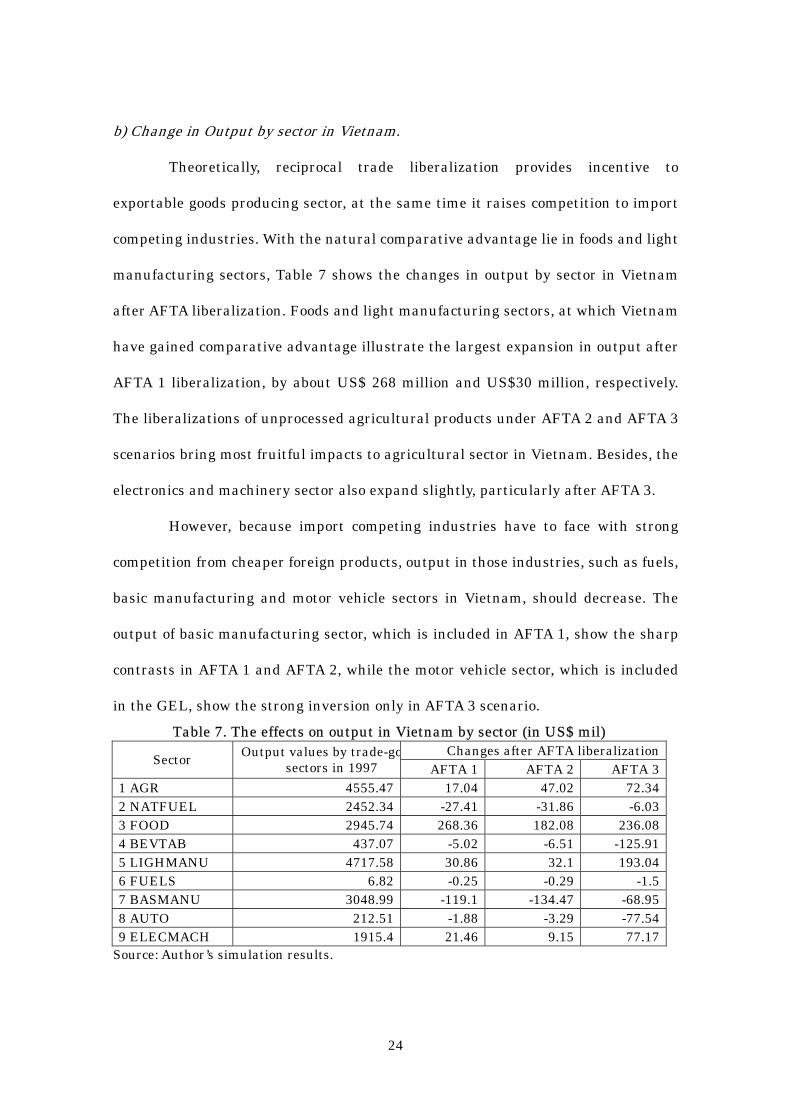
b) Change in Output by sector in Vietnam.
Theoretically, reciprocal trade liberalization provides incentive to
exportable goods producing sector, at the same time it raises competition to import
competing industries. With the natural comparative advantage lie in foods and light
manufacturing sectors, Table 7 shows the changes in output by sector in Vietnam
after AFTA liberalization. Foods and light manufacturing sectors, at which Vietnam
have gained comparative advantage illustrate the largest expansion in output after
AFTA 1 liberalization, by about US$ 268 million and US$30 million, respectively.
The liberalizations of unprocessed agricultural products under AFTA 2 and AFTA 3
scenarios bring most fruitful impacts to agricultural sector in Vietnam. Besides, the
electronics and machinery sector also expand slightly, particularly after AFTA 3.
However, because import competing industries have to face with strong
competition from cheaper foreign products, output in those industries, such as fuels,
basic manufacturing and motor vehicle sectors in Vietnam, should decrease. The
output of basic manufacturing sector, which is included in AFTA 1, show the sharp
contrasts in AFTA 1 and AFTA 2, while the motor vehicle sector, which is included
in the GEL, show the strong inversion only in AFTA 3 scenario. Table 7. The effects on output in Vietnam by sector (in US$ mil)
Changes after AFTA liberalizationSector Output values by trade-gosectors in 1997 AFTA 1 AFTA 2 AFTA 3
1 AGR 4555.47 17.04 47.02 72.342 NATFUEL 2452.34 -27.41 -31.86 -6.033 FOOD 2945.74 268.36 182.08 236.084 BEVTAB 437.07 -5.02 -6.51 -125.915 LIGHMANU 4717.58 30.86 32.1 193.046 FUELS 6.82 -0.25 -0.29 -1.57 BASMANU 3048.99 -119.1 -134.47 -68.958 AUTO 212.51 -1.88 -3.29 -77.549 ELECMACH 1915.4 21.46 9.15 77.17
Source: Author’s simulation results.
25
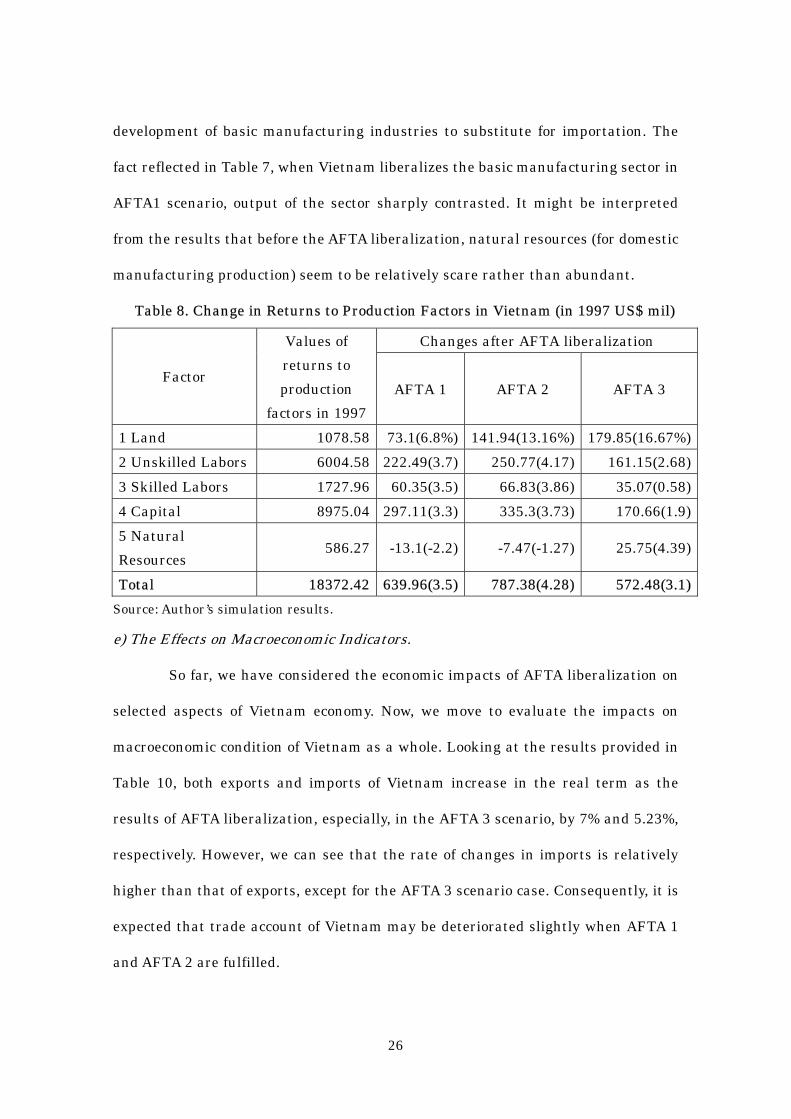
c) Change in Production Factors Incomes.
According to the simplified Heckser-Ohlin model10, it is expected that due to
the liberalization with ASEAN members, returns to capital skilled labors to fall
since Vietnam is a capital-scare economy, while the returns to land and unskilled
labor to rise. As the GTAP 5.4 data and model allowed us to disaggregate the factor
of production into five sectors, Table 8 shows the changes in returns to production
factors after each liberalizations under CEPT scheme. As it is what expected,
returns to land and unskilled labors, which is relatively abundant in Vietnam gain
the most, by 6.8%, 13.16% and 16.7% for land and 3.7%, 4.17 and 2.68% for
unskilled labors.
The change in return to natural resources surprised us mostly. No body can
imagine that Vietnam is a natural resources-scare country. Given the fact that
natural resource is relatively abundant in Vietnam, the question is that why trade
liberalization in AFTA 1 and AFTA 2 reduce the return to that factor. One
hypothesis may be proposed here. As Vietnam is still at the initial stage of economic
development, most of its natural resources are exported in the crude types. They are
not processed and are use for domestic industrial production. There are a large
portion of industrial inputs for manufacturing sectors imported every year. For
instant, while Vietnam exports a large amount of crude oil, the country has to
import all of its domestic petroleum products demands. Besides petroleum products,
iron and still, and even about 80% of material inputs for apparel, leather
industries 11 are imported. The industrialization and trade policy of Vietnam
government provide many kinds of supports and incentives to nurture the
10 Paul Krugman & Maurice Obsfel. 2000. International Economics: Theory and Policy, Fifth Edition, Addison-Wesley. 11 Those are the biggest manufacturing export products of Vietnam so far.
26
development of basic manufacturing industries to substitute for importation. The
fact reflected in Table 7, when Vietnam liberalizes the basic manufacturing sector in
AFTA1 scenario, output of the sector sharply contrasted. It might be interpreted
from the results that before the AFTA liberalization, natural resources (for domestic
manufacturing production) seem to be relatively scare rather than abundant.
Table 8. Change in Returns to Production Factors in Vietnam (in 1997 US$ mil)
Changes after AFTA liberalization
Factor
Values of returns to production
factors in 1997 AFTA 1 AFTA 2 AFTA 3
1 Land 1078.58 73.1(6.8%) 141.94(13.16%) 179.85(16.67%)2 Unskilled Labors 6004.58 222.49(3.7) 250.77(4.17) 161.15(2.68)3 Skilled Labors 1727.96 60.35(3.5) 66.83(3.86) 35.07(0.58)4 Capital 8975.04 297.11(3.3) 335.3(3.73) 170.66(1.9)5 Natural Resources
586.27 -13.1(-2.2) -7.47(-1.27) 25.75(4.39)
Total 18372.42 639.96(3.5) 787.38(4.28) 572.48(3.1)Source: Author’s simulation results.
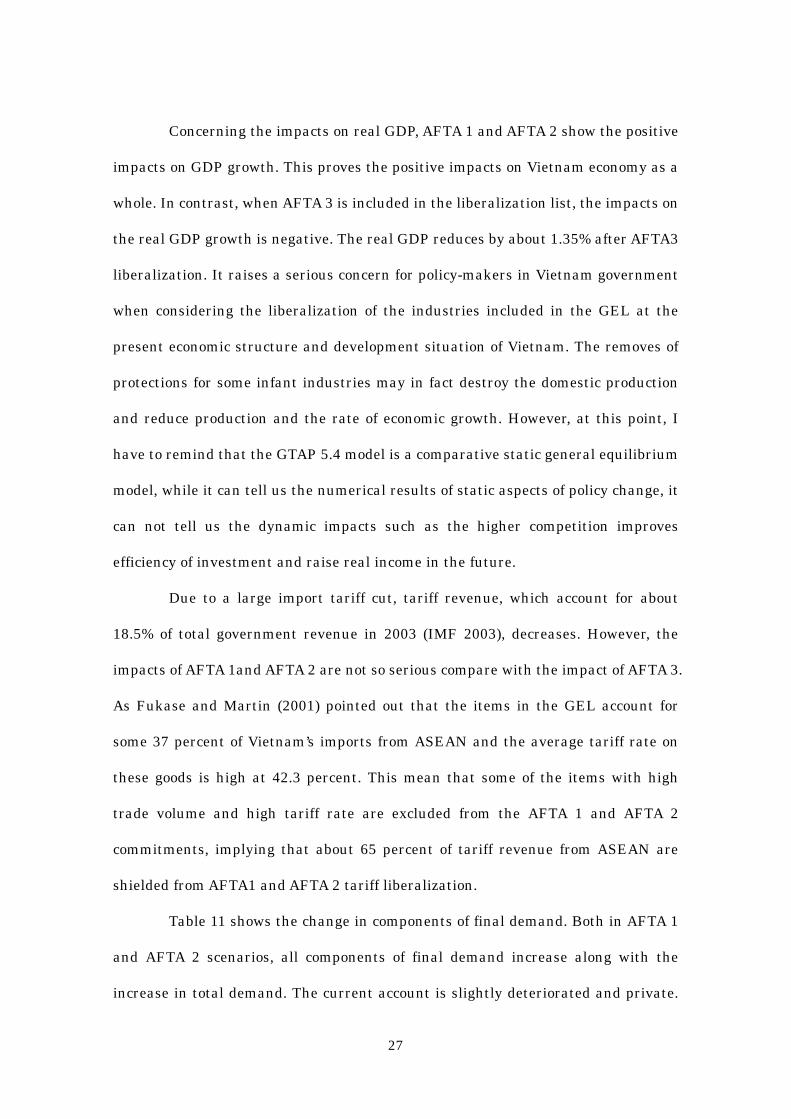
e) The Effects on Macroeconomic Indicators.
So far, we have considered the economic impacts of AFTA liberalization on
selected aspects of Vietnam economy. Now, we move to evaluate the impacts on
macroeconomic condition of Vietnam as a whole. Looking at the results provided in
Table 10, both exports and imports of Vietnam increase in the real term as the
results of AFTA liberalization, especially, in the AFTA 3 scenario, by 7% and 5.23%,
respectively. However, we can see that the rate of changes in imports is relatively
higher than that of exports, except for the AFTA 3 scenario case. Consequently, it is
expected that trade account of Vietnam may be deteriorated slightly when AFTA 1
and AFTA 2 are fulfilled.
27
Concerning the impacts on real GDP, AFTA 1 and AFTA 2 show the positive
impacts on GDP growth. This proves the positive impacts on Vietnam economy as a
whole. In contrast, when AFTA 3 is included in the liberalization list, the impacts on
the real GDP growth is negative. The real GDP reduces by about 1.35% after AFTA3
liberalization. It raises a serious concern for policy-makers in Vietnam government
when considering the liberalization of the industries included in the GEL at the
present economic structure and development situation of Vietnam. The removes of
protections for some infant industries may in fact destroy the domestic production
and reduce production and the rate of economic growth. However, at this point, I
have to remind that the GTAP 5.4 model is a comparative static general equilibrium
model, while it can tell us the numerical results of static aspects of policy change, it
can not tell us the dynamic impacts such as the higher competition improves
efficiency of investment and raise real income in the future.
Due to a large import tariff cut, tariff revenue, which account for about
18.5% of total government revenue in 2003 (IMF 2003), decreases. However, the
impacts of AFTA 1and AFTA 2 are not so serious compare with the impact of AFTA 3.
As Fukase and Martin (2001) pointed out that the items in the GEL account for
some 37 percent of Vietnam’s imports from ASEAN and the average tariff rate on
these goods is high at 42.3 percent. This mean that some of the items with high
trade volume and high tariff rate are excluded from the AFTA 1 and AFTA 2
commitments, implying that about 65 percent of tariff revenue from ASEAN are
shielded from AFTA1 and AFTA 2 tariff liberalization.
Table 11 shows the change in components of final demand. Both in AFTA 1
and AFTA 2 scenarios, all components of final demand increase along with the
increase in total demand. The current account is slightly deteriorated and private.

28
The situation turns inversely in AFTA 3 scenario, when all components of final
demand decrease with the total GDP, except exports and imports. The exports
sharply increase by US$ 691 million, while imports expand only about US$ 647
million, the impacts may improve the current account situation a bit.
Table 10. Change in Macroeconomic Indicators (%)
Variables AFTA 1 AFTA 2 AFTA 3 Total export changes - To ASEAN - To ROW
2.8 43.1 -3.3
2.1 52.15 -5.48
7 59.71 -1.02
Total import changes - From ASEAN - From ROW
3.16 41.87 -7.1
3.34 42.25 -7.01
5.23 91.37 -17.7
Changes in real GDP 1.7 2.44 -1.35 Changes in Tariff Revenue -0.2 -0.45 -31.66 Source: Author’s simulation results.
Table 11. Change in Final Demand Structure (in 1997 US$ mil). Change after liberalization Value of final
demands in 1997
AFTA 1 AFTA 2 AFTA 3
Consumption 15469 298 411 -200Investment 7247 107 149 -99Government 2203 40 56 -41Exports 9303 333 334 691Imports -12376 -391 -414 -647Total 21846 388 565 -296Source: Author’s simulation results.
V. Conclusions.
As a further attempt to open the domestic market and integrate in to the
regional and the world economy, Vietnam has joined ASEAN and became the
member of AFTA since 1995. Together with other members, Vietnam is preceding its
commitments to create a free trade area within the region. Base on the results of
29
this study, some conclusions about the economic impacts of Vietnam trade
liberalization under CEPT scheme could be drawn.
Firstly, in general speaking, taken into account the economic structure of
Vietnam in 1997 (the based year of the data base), trade liberalization under CEPT
scheme (the IL and TEL) brings somewhat fruitful impacts on economic growth of
Vietnam. However, it is worth being cautious to go another step to liberalize the
industries include in the GEL. Without further improvement of the competitiveness
of those industries, stiff competition after trade liberalization will threat the
development of those industries as well as other negative impacts that Vietnam is
still unready to cope with by restructuring the domestic economy such as the
reduction of tariff revenue and deterioration of trade account, may create inverse
effects on GDP growth.
Second, as the nature of trade liberalization under AFTA commitment is
discriminatory, the crowding out effect on trade volume with the rest of the world
and in favor of ASEAN member countries will reduce the total change in the
expansion of trade due to the trade liberalization. From this point of view, the other
negative effect may be considered. The lower rates of protection against imports
from ASEAN members may force domestic producers to change their sources of
inputs toward ASEAN market with lower quality, which previously they could
source from any cheapest suppliers with relevant quality from the world market,
when protection rates remained the same between ASEAN members and the rest of
the world. It is strongly recommend from this analysis that Vietnam should expand
its AFTA commitment to the rest of the world, on the reciprocal basic, as soon as
possible.
Thirdly, even though overall incomes increase in all sectors due to more

30
efficiently uses of production factors, the most fruitful impacts of trade
liberalization toward agricultural sectors and labor intensive sectors, which
accounts for the most portion of the poorest population of Vietnam. In other word,
trade liberalization directly contributes to the poverty reduction of Vietnam.
Fourth, due to the static nature of the working model, this study could not
evaluate the aspects of the dynamic effects that induced from CEPT scheme trade
liberalization in long-run economic growth of Vietnam. The increasing competition
followed trade liberalization will force domestic producers to improve their
competitiveness by more investment and more efficiently utilizing of inputs, more
investment in research and development and as a result improvement in technology
and productivity is expected. All of those dynamic impacts will maintain the
long-term and permanent high growth rate of the economy.

31
REFERENCE.
Amington, P.S. 1969. “A Theory of Demand for Products Distinguished by Place of Production”, IMF Staff Paper, 16, Washington DC. ASEAN Secretariat. 1996. AFTA Reader: The Fifth ASEAN Summit: Volume IV, ASEAN Secretariat, Jakarta. ASEAN Secretariat. 1998. CEPT Product List, Fourth/Fifth Edition, ASEAN Secretariat, Jakarta. ASEAN Secretariat. 2004. Consolidated 2004 CEPT Package By Country. Accessed via www.aseansec.org/2004_cept.htm Auffret, Philippe. 2003. Trade Policy Reform in Vietnam: Opportunities with Emerging Challenges, World Bank Policy Research Working Paper 3076, The World Bank, Washington DC. Center for International Economics. 1998. Vietnam’s Trade Policies 1998, Canberra & Sydney. Center for International Economics. 1999. Non-tariff Barriers in Vietnam: A Framework for Developing a Phase out Strategy, Canberra & Sydney. Center for International Economics. 1999. Trade and Industrial Policies for Economic Integration, Canberra & Sydney. Dimaranan, B. V. and Robert A. McDougall. 2002. Global Trade, Assistance, and production, The GTAP Data base, Center for Global Trade Analysis, Purdue University. Dollar, D. 1996. “Economic Reform, Openess, and Vietnam’s Entry into ASEAN”, ASEAN Economic Bulletin, 13(2), 66-87. Fujita, Mai. 1999. Vietnam in APEC: Changes in Trade Pattern after the Open Door Policy, APEC Study Center, Institute of Developing Economies, Japan.
32
Fukase, Emiko and Will Martin. 1999. The Effects of the United States’ Granting MFN Status to Vietnam, Development Research Group, the World Bank, Washington DC. Fukase, Emiko and Will Martin. 2001. “ A Quantitative Evaluation of Vietnam’s Accession to the ASEAN Free Trade Area”, Journal of Economic Integration, 16(4), 545-567. General Statistics Office. 2002. Statistic Year Book 2002, Vietnam. General Statistics Office. 2002. Vietnam Merchandise Import and Export 2002, Vietnam. Hertel, Thomas. 1997. Global Trade Analysis: Modeling and Application. Cambridge University Press. Hill, Hall. 2000. “Export Success against the Odd: A Vietnamese Case Study”, World Development, 28(2), 283-300. International Monetary Fund. 2003. Vietnam Selected Issues and Statistical Appendix. Accessed via www.imf.org Lao-Araja, Kanokpan. 2002. How can Cambodia, Lao PDR, Myanmar and Vietnam Cope with Revenue Lost due to AFTA Tariff Reduction? ERD Working paper, Asian Development Bank, Manila. Nguyen Van Ba. 2002. International Trade Liberalization and Industrial Development: Case of Thai Automotive Industry. Master Thesis, Graduate School fo International Development and Cooperation, Hiroshima University. Nguyen Van Ba. 2003. Reconsidering the Level of Openness to Trade of Vietnam Economy: Using Structural Adjusted Trade Openness Indies. Preceding of the 14th National Annual Conference of The Japanese Society for International Development, Nagoya. Patrick, Belser. 2000. Vietnam on the Road to Labor Intensive Growth, Policy Research Working Paper 2389, The World Bank, Washington DC.

33
Paul Krugman and Maurice Obsfeld. 2000. International Economics: Theory and Policy. 5th Edition, Addison-Wesley. Puga, D and Venable, A. T. 1997. “Preferential Trading Arrangement and Industrial Location”, Journal of International Economics, 43(3-4), 347-368. Timothy, J. S. 1998. The Automotive Industry in Vietnam: Prospects for Develoment in a Globalizing economy, mimeo. Tongzon, Jose. 1999. “The Challenge of Regional Economic Integration: The Vietnamese Perspective”, the Developing Economies, 37(2), 137-161.