PAPER 5: STRATEGIC COST MANAGEMENT AND...
20
PAPER – 5: STRATEGIC COST MANAGEMENT AND PERFORMANCE EVALUATION Question No. 1 is compulsory. Answer any four questions from the remaining five questions. Working notes should form part of the answers. No statistical or other table will be provided with this question paper. Wherever necessary, candidates may make appropriate assumptions and clearly state them. Question 1 GL Ltd. is a multiproduct manufacturing concern functioning with four divisions. The Electrical Division of the company is producing many electrical products including electrical switches. This division functioning at its maximum capacity sells its switches in the open market at ` 25 each. The variable cost per switch to the division is ` 16. The Household Division, another division of GL Ltd., functioning at 70% capacity asked the Electrical Division to supply 5,000 switches per month at the rate of ` 18 each to fit in night lamps produced by it. The total cost per night lamp is being estimated as detailed below; ` Components purchased from outside suppliers 50.00 Switch if purchased internally 18.00 Other variable costs 40.00 Fixed overheads 21.00 Total cost per night lamp 129.00 The Household Division is marketing night lamps at a price of ` 130 each, with a very small margin, as it is doing business in a very competitive environment. Any increase in price made by the division will push out the division from the market. Therefore, the division cannot pay anything more to switches if they the Electrical Division. Further, the manager of the division informed that it is very much essential to keep on the market share for night lamps by the Household Division to retain the experienced workers of the division. The company is using return on investments (ROI) as a scale to measure the divisional performances and also marginal costing approach for decision making. Required (i) Would you RECOMMEND the supply of switches to Household Division by Electrical Division at a price of ` 18 each? Substantiate your recommendation with suitable reasons. (5 Marks) (ii) ANALYZE whether it would be beneficial to the company as a whole the supply of switches to Household Division at a unit price of `18 by Electrical Division. (6 Marks) © The Institute of Chartered Accountants of India
Transcript of PAPER 5: STRATEGIC COST MANAGEMENT AND...

PAPER – 5: STRATEGIC COST MANAGEMENT AND PERFORMANCE EVALUATION
Question No.1 is compulsory.
Answer any four questions from the remaining five questions.
Working notes should form part of the answers.
No statistical or other table will be provided with this question paper.
Wherever necessary, candidates may make appropriate assumptions and clearly state them.
Question 1
GL Ltd. is a multiproduct manufacturing concern functioning with four divisions. The Electrical
Division of the company is producing many electrical products including electrical switches. This
division functioning at its maximum capacity sells its switches in the open market at
` 25 each. The variable cost per switch to the division is ` 16.
The Household Division, another division of GL Ltd., functioning at 70% capacity asked the
Electrical Division to supply 5,000 switches per month at the rate of ` 18 each to fit in night
lamps produced by it. The total cost per night lamp is being estimated as detailed below;
`
Components purchased from outside suppliers 50.00
Switch if purchased internally 18.00
Other variable costs 40.00
Fixed overheads 21.00
Total cost per night lamp 129.00
The Household Division is marketing night lamps at a price of ` 130 each, with a very small
margin, as it is doing business in a very competitive environment. Any increase in price made
by the division will push out the division from the market. Therefore, the division cannot pay
anything more to switches if they the Electrical Division. Further, the manager of the division
informed that it is very much essential to keep on the market share for night lamps by the
Household Division to retain the experienced workers of the division. The company is using
return on investments (ROI) as a scale to measure the divisional performances and also
marginal costing approach for decision making.
Required
(i) Would you RECOMMEND the supply of switches to Household Division by Electrical
Division at a price of ` 18 each? Substantiate your recommendation with suitable reasons.
(5 Marks)
(ii) ANALYZE whether it would be beneficial to the company as a whole the supply of switches
to Household Division at a unit price of `18 by Electrical Division. (6 Marks)
© The Institute of Chartered Accountants of India

2 FINAL (NEW) EXAMINATION: MAY, 2018
(iii) Do you feel that- the Divisional Managers should accept the inter-divisional transfers
in principle? If yes, what should be the range of transfer price? (5 Marks)
(iv) SUGGEST the steps to be taken by the chief executive of the company to change the
attitude of divisional heads if they are against the inter-divisional transfers. (4 Marks)
Answer
(a) (i) Electrical Division is operating at full capacity and selling its switches in the open
market at `25 each. Therefore, it can transfer its production internally by giving up
equal number of units saleable in the open market. In this situation, transfer pric e
should be based on variable cost plus opportunity cost {`16 + (`25 - `16)} = `25/-.
As the price quoted by Household Division `18 is less than the transfer price based
on opportunity cost, the Electrical Division should not accept internal transfer. Further,
the company is measuring divisional performances based on ROI. Therefore,
transferring for a price which is less than the minimum price would affect the return
on investments and divisional performance severely.
(ii) In the total cost per night lamp, the Fixed Overheads being a fixed cost is not relevant
for decision making. Similarly, the variable cost of switch (`16 p.u.) included in the
cost of night lamp is also irrelevant as it is common for both internal and external
transfers. The only relevant cost is the loss of revenue when units are transferred
internally.
Accordingly, the benefit from internal transfer would be {`130 - (`50 + `40) - `25)
=`15/- on each unit sale on night lamp. Therefore, it is beneficial to the company as
a whole to the extent of `15 per unit of night lamp sold.
Hence, internal transfer is profitable to the company as a whole. Further, Household
Division is operating at 70% capacity and has experienced workers which may be
utilized for other divisions requirements if any and based on contribution earned fixed
cost could be minimized due to large scale of production.
(iii) Internal transfer pricing develops a competitive setting for managers of each division,
it is possible that they may operate in the best interest of their individual performance.
This can lead to sub-optimal utilization of resources. In such cases, transfer pricing
policy may be established to promote goal congruence. The market price of `25 per
switch leaves Electrical Division in an identical position to sale outside. Thus, `25 is
top of the price range. Division Household will not pay to Electrical Division anything
above (`130 - `50 - `40) = ` 40/-. The net benefit from each unit of night lamp sold
internally is `15. Thus, any transfer price within the range of `25 to `40 per unit will
benefit both divisions. Divisional Managers should accept the inter divisional transfers
in principle when the transfer price is within the above range.
(iv) Transfer at marginal cost are unsuitable for performance evaluation since they do not
provide an incentive for the supplying division to transfer goods and services
internally. This is because they do not contain a profit margin for the supplying
© The Institute of Chartered Accountants of India

PAPER – 5: STRATEGIC COST MANAGEMENT AND PERFORMANCE EVALUATION 3
division. Chief Executive’s intervention may be necessary to instruct the supplying
division to meet the receiving division's demand at the marginal cost of the transfers.
Thus, divisional autonomy will be undermined. Transferring at cost plus a mark-up
creates the opposite conflict. Here the transfer price meets the performance
evaluation requirement but will not induce managers to make optimal decisions.
To resolve the above conflicts the following transfer pricing methods have been
suggested:
Dual Rate Transfer Pricing System
The supplying division records transfer price by including a normal profit margin
thereby showing reasonable revenue. The purchasing division records transfer price
at marginal cost thereby recording purchases at minimum cost. This allows for better
evaluation of each division’s performance. It also improves co-operation between
divisions, promoting goal congruence and reduction of sub-optimization of resources.
Two Part Transfer Pricing System
This pricing system is again aimed at resolving problems related to distortions caused
by the full cost based transfer price. Here,
transfer price = marginal cost of production + a lump-sum charge (two part to pricing).
While marginal cost ensures recovery of additional cost of production related to the
goods transferred, lump-sum charge enables the recovery of some portion of the fixed
cost of the supplying division. Therefore, while the supplying division can show better
profitability, the purchasing division can purchase the goods at lower rate compared
to the market price.
Question 2
Rohni Steel Company produces three grades of steel - super, good and normal grade. Each of
these products (Grades) has high demand in the market and company is able to sell as much
as it can produce these products.
The furnace operation is a bottle-neck in the process. The company is running at 100% of
capacity. The company wants to improve its profitability. The variable conversion cost is
`100 per process hour. The fixed cost is `48,00,000. In addition, the Cost Accountant was able
to determine the following information about the three products (grades):
Super Grade Good Grade Normal Grade
Budgeted Units Produced 6,000 6,000 6,000
Total process hours per unit 12 12 10
Furnace hours per unit 6 5 4
Unit Selling Price `3,600 `3,400 `3,000
Direct Material cost per unit `2,100 `1,900 `1,720
© The Institute of Chartered Accountants of India

4 FINAL (NEW) EXAMINATION: MAY, 2018
The furnace operation is part of the total process for each of these three products. Thus furnace
hours are the part of process hours.
Required
(i) DETERMINE the unit contribution margin for each product. (5 Marks)
(ii) Give an ANALYSIS to determine the relative product profitability, assuming that the furnace
is a bottleneck. (5 Marks)
(iii) Managements wishes to improve profitability by increasing prices on selected products. At
what price would super and good grades need to be offered in order to produce the same
relative profitability as normal grade steel? (10 Marks)
Answer
(i) Contribution Margin per unit
Particulars Super
Grade (`)
Good
Grade (`)
Normal
Grade (`)
Selling Price per unit 3,600 3,400 3,000
Less: Variable Conversion Cost per unit 1,200
(`100 × 12 hrs.)
1,200
(`100 × 12 hrs.)
1,000
(`100 × 10 hrs.)
Less: Direct Material Cost per unit 2,100 1,900 1,720
Contribution Margin per unit 300 300 280
(ii) The contribution margin per unit may give false signals when an organization has
production bottlenecks. Instead, Company should use the contribution margin per
bottleneck hour to determine relative product profitability, as follows:
Particulars Super
Grade
Good
Grade
Normal
Grade
Contribution Margin per unit (`) 300 300 280
Furnace Bottleneck hrs. per unit 6 5 4
Contribution Margin per furnace hour 50 60 70
Analysis
The Super and Good Grade steel have the highest contribution margin per unit (`300);
however, the normal grade has the highest contribution margin per furnace hour (`70).
Thus, using production bottleneck analysis indicates that the Normal Grade is actually
more profitable at a `70 contribution margin per furnace hour than Super Grade’s `50 or
Good Grade’s `60 contribution margin per furnace hour.
Therefore, the company would want to sell product in the following preference order:
I. Normal Grade
© The Institute of Chartered Accountants of India

PAPER – 5: STRATEGIC COST MANAGEMENT AND PERFORMANCE EVALUATION 5
II. Good Grade
III Super Grade
(iii) One way is to revise the pricing would be to increase the price to the point where all three
products produce profitability equal to the highest profit product. This would be determined
as follows:
Contribution Margin per furnace hour for Normal Grade =
Revised Price of Super Grade - Variable Cost per unit of Super Grade
FurnaceHoursof Super Gradeper unit
Or
` 70 = Revised Price of Super Grade - (1,200+ 2,100)
6 hrs.
`
Or, ` 420 = Revised Price of Super Grade – ` 3,300
Super grade steel would require a revised price of `3,720 in order to deliver the same
contribution margin per bottleneck hour as does Normal Grade steel.
Contribution Margin per furnace hour for Normal Grade =
Revised Price of Good Grade - Variable Cost per unit of Good Grade
FurnaceHoursof GoodGradeper unit
Or
` 70 = Revised Price of Good Grade - (1,200+1,900)
5 hrs.
`
Good grade steel would require a revised price of `3,450 in order to deliver the same
contribution margin per bottleneck hour as does Normal Grade steel.
Question 3
Trident Toys Ltd. manufactures a single product and the standard cost system is followed.
Standard cost per unit is worked out as follows:
`
Materials (10 Kgs. @ `4 per Kg) 40
Labour (8 hours @ `8 per hour) 64
Variable overheads (8 hours @ `3 per hour) 24
Fixed overheads (8 hours @ `3 per hour) 24
Standard Profit 56
© The Institute of Chartered Accountants of India

6 FINAL (NEW) EXAMINATION: MAY, 2018
Overheads are allocated on the basis of direct labour hours. In the month of April 2018, there
was no difference between the budgeted and actual selling price and there were no opening or
closing stock during the period.
The other details for the month of April 2018 are as under
Budgeted Actual
Production and Sales 2,000 Units 1,800 Units
Direct Materials 20,000 Kgs. @ `4 per kg 20,000 Kgs.@ `4 per kg
Direct Labour 16,000 Hrs. @ `8 per Hr. 14,800 Hrs. @ `8 per Hr.
Variable Overheads `48,000 `44,400
Fixed Overheads `48,000 `48,000
Required
I. RECONCILE the budgeted and actual profit with the help of variances according to each
of the following method:
(a) The conventional method
(b) The relevant cost method assuming that
(i) Materials are scarce and are restricted to supply of 20,000 Kgs. for the period.
(ii) Labour hours are limited and available hours are only 16,000 hours for the
period.
(iii) There are no scarce inputs. (12 Marks)
II. COMMENT on efficiency and responsibility of the Sales Manager for not using scarce
resources. (8 Marks)
Answer
(i) COMPUTATION OF VARIANCES
Material Usage Variance = Standard Price × (Standard Quantity – Actual Quantity)
= `4.00 × (18,000* Kgs. – 20,000 Kgs.)
= ` 8,000 (A)
*20,000 Kgs.
1,800 units2,000 units
Labour Efficiency Variance = Standard Rate × (Standard Hours – Actual Hours)
= `8.00 × (14,400* hrs. – 14,800 hrs.)
= `3,200 (A)
© The Institute of Chartered Accountants of India

PAPER – 5: STRATEGIC COST MANAGEMENT AND PERFORMANCE EVALUATION 7
*16,000 hrs.
1,800 units2,000 units
Variable Overhead Efficiency Variance
= Standard Variable Overheads for Production – Budgeted Variable Overheads for Actual hours
= (14,400 hrs. × Rs.3.00) – (`3.00 × 14,800 hrs.)
= `1,200 (A)
Fixed Overhead Volume Variance
= Absorbed Fixed Overheads – Budgeted Fixed Overheads
= (14,400 hrs. × `3.00) – (16,000 hrs. × `3.00)
= `4,800 (A)
Sales Margin Volume Variance = Standard Margin – Budgeted Margin
= (1,800 units × `56.00) – (2,000 units × `56.00)
= `11,200 (A)
Sales Contribution Volume Variance
= Standard Contribution – Budgeted Contribution
= (1,800 units × `80.00) – (2,000 units × `80.00)
= `16,000 (A)
Statement Showing “Reconciliation Between Budgeted Profit & Actual Profit”
Particulars Conventional
Method (`)
Relevant Cost Method (`)
Scarce
Material
Scarce
Labour
No Scarce
Inputs
Budgeted Profit
(2,000 units × `56)
1,12,000 1,12,000 1,12,000 1,12,000
Sales Volume Variance 11,200 (A) NIL* 12,000$ (A) 16,000 (A)
Material Usage Variance 8,000 (A) 24,000 (A) 8,000 (A) 8,000 (A)
Labour Efficiency Variance 3,200 (A) 3,200 (A) 7,200 (A) 3,200 (A)
Variable Overhead Efficiency Variance
1,200 (A) 1,200 (A) 1,200 (A) 1,200 (A)
Fixed Overhead Volume Variance
4,800 (A) N.A.# N.A. # N.A. #
Actual Profit 83,600 83,600 83,600 83,600
© The Institute of Chartered Accountants of India

8 FINAL (NEW) EXAMINATION: MAY, 2018
NOTES
Scarce Material
Based on conventional method, direct material usage variance is `8,000 (A) i.e. 2,000 Kg.
× `4. In this situation material is scarce, and, therefore, material cost variance based on
relevant cost method should also include contribution lost per unit of material. Excess
usage of 2,000 Kg. leads to lost contribution of `16,000 i.e. 2,000 Kgs. × `8. Total material
usage variance based on relevant cost method, when material is scarce will be:
`8,000 (A) + `16,000 (A) = `24,000 (A). Since labour is not scarce, labour variances are
identical to conventional method.
Excess usage of 2,000 Kgs. leads to loss of contribution from 200 units i.e. `16,000 (200
units × `80). It is not the function of the sales manager to use material efficiently. Hence,
loss of contribution from 200 units should be excluded while computing sales cont ribution
volume variance.
(*)→
Therefore, sales contribution volume variance, when materials are scarce will be NIL
i.e. `16,000 (A) - `16,000 (A).
Scarce Labour
Material is no longer scarce, and, therefore, the direct material variances are same as in
conventional method. In conventional method, excess labour hours used are: 14,400 hrs.
– 14,800 hrs. = 400 hrs. Contribution lost per hour = `10. Therefore, total contribution lost,
when labour is scarce will be: 400 hrs. × `10 = `4,000. Therefore, total labour efficiency
variance, when labour hours are scarce will be `7,200 (A) i.e. `3,200 (A) + `4,000 (A).
Excess usage of 400 hrs. leads to loss of contribution from 50 units i.e. `4,000 (50 units ×
`80). It is not the function of the sales manager to use labour hours efficiently . Hence, loss
of contribution from 50 units should be excluded while computing sales contribution volume
Variance.
($)→
Therefore, sales contribution volume variance, when labour hours are Scarce will be
`12,000 (A) i.e. `16,000 (A) - `4,000 (A).
Fixed Overhead Volume Variance
(#) →
The fixed overhead volume variance does not arise in marginal costing system. In
absorption costing system, it represents the value of the under or over absorbed fixed
overheads due to change in production volume. When marginal costing is in use there is
no overhead volume variance, because marginal costing does not absorb fixed overheads.
© The Institute of Chartered Accountants of India

PAPER – 5: STRATEGIC COST MANAGEMENT AND PERFORMANCE EVALUATION 9
(ii) Comment on Efficiency and Responsibility of the Sales Manager
In general, Gross Profit (or contribution margin) is the joint responsibility of sales managers
as well as of production managers. On one hand the sales manager is responsible for the
sales revenue part, on the other hand the production manager is accountable for the cost -
of-goods-sold component. However, it is the top management who needs to ensure that
the target profit is achieved by the organization. The sales manager is accountable for
prices, volume, and mix of the product, whereas the production manager must control the
costs of materials, labour, factory overheads and quantities of production. The purchase
manager must purchase materials at budgeted prices. The personnel manager must
employ right people at the right place with appropriate wage rates. The internal audit
manager must ensure that the budgetary figures for sales and costs are being adhered by
all departments which are directly or indirectly involved in contribution of making profit.
Thus, sales manager is not responsible for contribution lost due to excess usage or
inefficient usage of resources in case of scarce resources. Hence, such contribution lost
must be excluded from the sales contribution volume variance.
Question 4
(a) A company is planning to improve its profit level at least by 10% from the preliminary
budget estimates of a profit of `32,80,000 for the coming year. It has worked out the
following profit improvement plan:
(i) In the year just concluded the sales of the company were 10% of the total market of
12,00,000 units. For the preparation of the original budget estimate, the same market
demand and the same share of market for the company was envisaged. Now it has
been estimated that the total market demand will increase by 18% and the company's
market share will increase to 11% from the present level of 10%.
(ii) The products are sold in two sizes - large and medium. The sales mix of each size
was 50:50 so far. Now it is planned that the sales will be 40% of large and 60% of
medium. The medium packs and large packs have a contribution of `10 and `8 per
pack respectively. The budget proposes to raise the price in such a manner that the
contribution per pack will increase by `0.60 for each size.
(iii) There will be an additional expenditure on sales promotion worth `78,000.
(iv) The company proposes to save `9,000 by saving on interest cost in the coming year
by better financial management.
You are required to draw a profit improvement plan in financial terms and spell out
separately the effect of various factors on profit. (10 Marks)
(b) MNP Co. Ltd. makes digital watches. The company is preparing a product life cycle budget
for a new watch. Development on the new watch is to start shortly. Estimates for new watch
are as under:
© The Institute of Chartered Accountants of India

10 FINAL (NEW) EXAMINATION: MAY, 2018
Life Cycle Units Manufactured and Sold 2,40,000
Selling Price Per Watch (`) 500
Life Cycle Costs:
R&D and Design Cost (`) 80 Lakh
Manufacturing:
Variable Cost Per Watch (`) 120
Variable Cost Per Batch (`) 4,000
Watches Per Batch 300
Fixed Costs (`) 112 lakh
Marketing:
Variable Cost Per Batch (`) 24
Fixed Costs (`) 8 Lakh
Distribution:
Variable Cost Per Watch (`) 240
Watches Per Batch 96
Fixed Costs (`) 45 Lakh
Customer Service Cost Per Watch (`) 10
Required
(i) CALCULATE the budgeted life cycle operating income for, the new watch. (5 Marks)
OR
SUGGEST the strategies to be adopted by the MNP Co. Ltd. to develop a new watch.
(5 Marks)
(ii) What percentage of the budgeted total product life cycle costs will be incurred by the
end of the R&D and design stage? (2 Marks)
(iii) An analysis reveals that 75% of the budgeted total life cycle costs of new watch will
be locked in at the R&D and design stage. What are the implications for managing
costs of the new watch? (3 Marks)
Answer
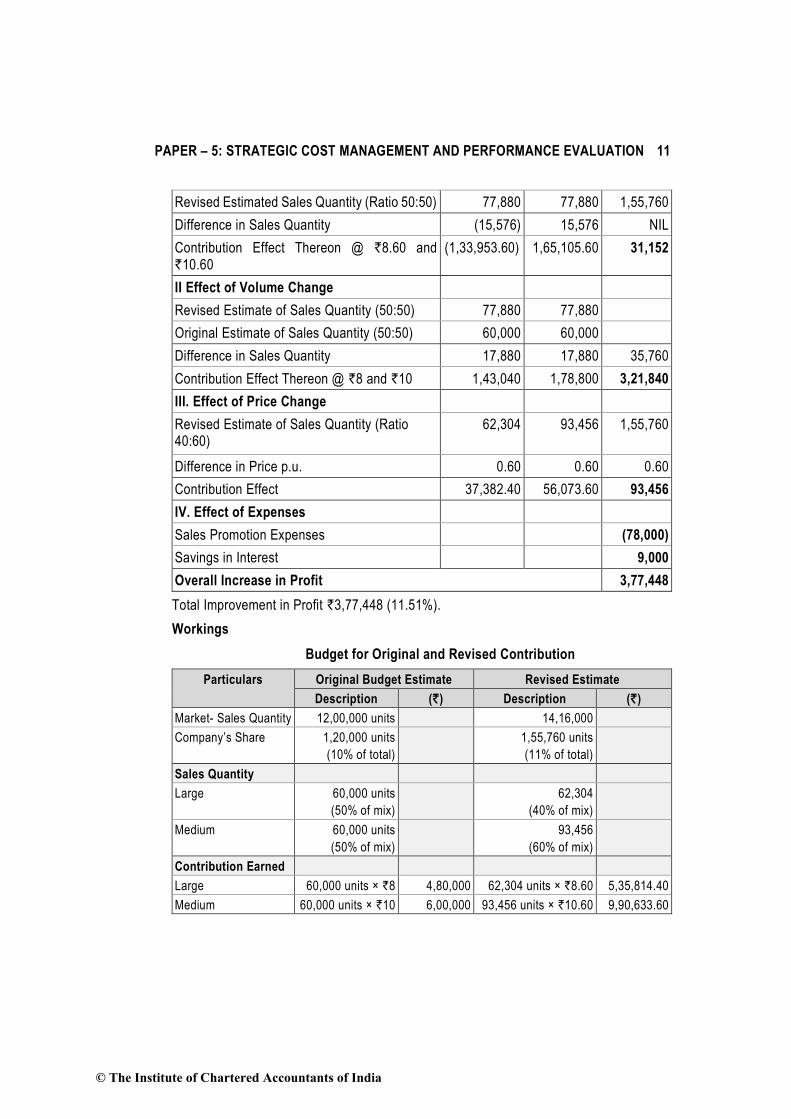
(a) Statement Showing Change in Profit
Particulars Large (`) Medium (`) Total (`)
I. Effect of Product Mix Changes
Revised Estimated Sales Quantity (Ratio 40:60) 62,304 93,456 1,55,760
© The Institute of Chartered Accountants of India
PAPER – 5: STRATEGIC COST MANAGEMENT AND PERFORMANCE EVALUATION 11
Revised Estimated Sales Quantity (Ratio 50:50) 77,880 77,880 1,55,760
Difference in Sales Quantity (15,576) 15,576 NIL
Contribution Effect Thereon @ `8.60 and `10.60
(1,33,953.60) 1,65,105.60 31,152
II Effect of Volume Change
Revised Estimate of Sales Quantity (50:50) 77,880 77,880
Original Estimate of Sales Quantity (50:50) 60,000 60,000
Difference in Sales Quantity 17,880 17,880 35,760
Contribution Effect Thereon @ `8 and `10 1,43,040 1,78,800 3,21,840
III. Effect of Price Change
Revised Estimate of Sales Quantity (Ratio 40:60)
62,304
93,456 1,55,760
Difference in Price p.u. 0.60 0.60 0.60
Contribution Effect 37,382.40 56,073.60 93,456
IV. Effect of Expenses
Sales Promotion Expenses (78,000)
Savings in Interest 9,000
Overall Increase in Profit 3,77,448
Total Improvement in Profit `3,77,448 (11.51%).
Workings
Budget for Original and Revised Contribution
Particulars Original Budget Estimate Revised Estimate
Description (`) Description (`)
Market- Sales Quantity 12,00,000 units 14,16,000
Company’s Share 1,20,000 units
(10% of total)
1,55,760 units
(11% of total)
Sales Quantity
Large 60,000 units
(50% of mix)
62,304
(40% of mix)
Medium 60,000 units
(50% of mix)
93,456
(60% of mix)
Contribution Earned
Large 60,000 units × `8 4,80,000 62,304 units × `8.60 5,35,814.40
Medium 60,000 units × `10 6,00,000 93,456 units × `10.60 9,90,633.60
© The Institute of Chartered Accountants of India

12 FINAL (NEW) EXAMINATION: MAY, 2018
Particulars Original Budget Estimate Revised Estimate
Description (`) Description (`)
Effect of Expenses
Sales Promotion --- -78,000
Interest --- 9,000
Revised Contribution 10,80,000 14,57,448
This question can also be solved by computing Sales Contribution Price Variance, Sales
Contribution Mix Variance, Market Size Variance, Market Share Variance.
(b) (i) Statement Showing Budgeted Life-Cycle Operating Income
Particulars (`)
Revenues (`500 × 2,40,000 units) 12,00,00,000
Less: R&D and Design Costs 80,00,000
Manufacturing Costs:
Variable (`120 × 2,40,000 units) 2,88,00,000
Batch 4,000
2,40,0003,000
`
32,00,000
Fixed 1,12,00,000
Marketing Costs:
Batch (`24 × 2,500* batches)
*Assuming 1 Batch = 96 Pcs.
60,000
Fixed 8,00,000
Distribution Costs:
Variable (` 240 × 2,40,000) 5,76,00,000
Fixed 45,00,000
Customer Service Cost (`10 × 2,40,000) 24,00,000
Total Costs 11,65,60,000
Operating Income 34,40,000
Or
© The Institute of Chartered Accountants of India

PAPER – 5: STRATEGIC COST MANAGEMENT AND PERFORMANCE EVALUATION 13
We can see from the above figure that approximately 80% of a product’s cost are
committed during the planning and design stage. At this stage product designers
determine the product’s design and the production process. In contrast, the majority
of costs are incurred at the manufacturing stage, but they have already become
locked in at the planning and design stage and are difficult to alter.
The pattern of cost commitment and incurrence will differ based on the industry and
specific product introduced. For developing a watch, MNP Co. Ltd. needs to commit
around 80,00,000 for its R&D and design Cost. So, Cost Management of MNP Co.
Ltd can be most effectively exercised during the planning and design stage of its new
watch and not at the manufacturing stage when the product design and processes
have already been determined and costs have been committed. At this latter stage
the focus is more on cost containment rather than on Cost Management. An
understanding of life-cycle costs and how they are committed and incurred at different
stages throughout a product’s life cycle of the watch will also led to the emergence of
target costing, a technique that focuses on managing costs during a product’s
planning and design phase.
(ii) % of Budgeted Total Product Life-Cycle Costs incurred till the R & D and Design
Stages:
80,00,000 100 6.86%
11,65,60,000
`
`
(iii) Implications:
An analysis reveals that 75% * of the total product life-cycle costs of the new watch
will be locked in at the end of the R&D and design stages when only 6.86% of the
costs are incurred (as calculated in the above case). The implication is that it will be
difficult to alter or reduce the costs of MNP digital watches once the design is
finalised. To reduce and manage total costs, MNP must act to modify the design
before costs get locked in. (Question states 75%, hence 75% is taken)
© The Institute of Chartered Accountants of India

14 FINAL (NEW) EXAMINATION: MAY, 2018
This question can be solved by taking appropriate assumption in respect of Marketing Costs
and Distribution Costs.
Question 5
(a) JK Ltd. produces and sells a single product. Presently the company is having its quality
control system in a small way at an annual external failure and internal failure costs of
`4,40,000 and `8,50,000 respectively. As the company is not able to ensure supply of
good quality products upto the expectations of its customers and wants to manage
competition to retain market share considers an alternative quality control system. It is
expected that the implementation of the system annually will lead to a prevention cost of
`5,60,000 and an appraisal cost of `70,000. The external and internal failure costs will
reduce by `1,00,000 and `4,10,000 respectively in the new system. All other activities and
costs will remain unchanged.
Required
(i) EXAMINE the new quality control proposal and recommend the acceptance or
otherwise of the proposal both from financial and non-financial perspectives.
(6 Marks)
(ii) What is your ADVICE to the company, if the company wants to achieve zero defect
through a continuous quality improvement programme? (2 Marks)
(iii) SUGGEST a suitable quality control level at a minimum cost. (2 Marks)
(b) JM Ltd. is engaged in the manufacture of plastic bottles of a standard size. The factory has
5 machines of identical size, each capable of producing 40 bottles per hour. The variable
cost per bottle is ` 0.32 and the selling price is ` 0.80 each. The company has received
an offer from another company for manufacture of 40,000 units of a plastic moulded toy.
The price per toy is ` 30 and the variable, cost is `24 each. In case of the company takes
up the job, it has to meet the expenses of making a special mould required for the
manufacture of the toy. The cost of the mould is `1,00,000. The company's time study
analysis shows that the machines can produce only 16 toys per hour. The company has a
total capacity of 10,000 hours during the period in which the toy is required to be
manufactured. The fixed costs excluding the cost of construction of the mould during the
period will be `10 Lakh.
The company has an order for the supply of 3,00,000 bottles during the period.
© The Institute of Chartered Accountants of India

PAPER – 5: STRATEGIC COST MANAGEMENT AND PERFORMANCE EVALUATION 15
Required
(i) Do you ADVISE the company to take up the order for manufacturing plastic moulded
toys during the time when it has an order in its book for the supply of 3,00,000 bottles.
(3 Marks)
(ii) If the order for the supply of bottles increases to 4,00,000 bottles, will you ADVISE
the company to accept the order for the supply of plastic moulded toys? State the
reasons. (3 Marks)
(iii) An associate company of JM Ltd. has idle capacity and is willing to take up the whole
or part of the manufacturing of the plastic moulded toys on sub-contracting basis. The
subcontract price inclusive of the cost of construction of mould is ` 28 per toy.
DETERMINE the minimum expected excess machine hour capacity needed to justify
producing any portion of the toy order by the company itself rather than
subcontracting. (4 Marks)
Answer
(a) (i) Implementation of new system will reduce costs of the non - conformance (internal
and external failure) by `5,10,000 (-40%). However, this will also increase costs of
conformance by `6,30,000. There is inverse relationship between the costs of the
conformance and the costs of non-conformance. JK Ltd. should try to avoid costs of
non- conformance because both internal and external failure affect customer’s
satisfaction and organisations profitability . The company should focus on preventing
the error such that it ensures that product is of good quality when it reaches the
customer at the very first instance. This enhances the customer experience and
therefore eliminating the scope for external failures like sales returns and warranty
claims. Better quality can yield further sales. Therefore, an increase in spending on
quality measures is justified since it not only yields significant improvements to quality
but also brings in more sales orders.
Accordingly, from the financial perspective point of view the new proposal for quality
control should not be accepted as it will lead to an additional cost of `1,20,000
(`6,30,000 - `5,10,000). However, from non-financial perspective point of view as
stated above the company should accept the new proposal.
(ii) It is possible to increase quality while at the same time reducing both conformance
and non-conformance costs if a programme of aiming for zero defect/ and or
continuous improvement is followed. Zero defect advocates continuous improvement.
To implement this elimination of all forms of waste, including reworks, yield losses,
unproductive time, over-design, inventory, idle facilities, safety accidents, etc. is
necessary.
(iii) To achieve 0% defects, costs of conformance must be high. As a greater proportion
of defects are accepted, however, these costs can be reduced. At a level of 0%
defects, cost of non-conformance should be nil but these will increase as the accepted
© The Institute of Chartered Accountants of India

16 FINAL (NEW) EXAMINATION: MAY, 2018
level of defects rises. There should therefore be an acceptable level of defects at
which the total costs of quality are at a minimum.
(b) Workings
Statement Showing “Contribution / Machine Hour”
‘Bottle’ ‘Toy’
Demand (units) 3,00,000 40,000
Sales (`/u) 0.80 30.00
Less: Variable Cost (`/u) 0.32 24.00
Less: Specific Fixed Cost (`/u) --- 2.50
Contribution (`/u) 0.48 3.50
Machine Hours Required per unit 0.025 0.0625
Contribution / Machine Hour 19.20 56.00
Advice on Supply of 3,00,000/ 4,00,000 Bottles
(i) JM Ltd. can accept plastic molded toy’s order as sufficient number of hrs. i.e. 2,500
hrs. (10,000 hrs.- 3,00,000 bottles × 0.025 hrs.) are available and would be able to
generate additional benefit of `3.50 per unit on 40,000 units of toys i.e. `1,40,000.
(ii) If the order for the supply of bottles increases to 4,00,000 bottles, then 2,500 more
hrs. will be required to produce the additional bottles. JM Ltd. has to decide whether
to utilize 2,500 hrs. for existing bottle order or for toy Order.
Machine time is limiting factor. Therefore, contribution per machine hour from both
the activities (i.e. bottles and toys) should be calculated to decide whether the order
should be accepted. Contribution per hour is more in case of toys (refer workings).
Therefore, JM Ltd. should utilize the remaining 2,500 hours for manufacturing toys
rather than to fulfil the order for supply of additional bottles.
Prioritizing production based on contribution per machine hour would maximize
profits. However, existing order fulfilment is necessary for building long term and
sustainable customer relationship. Developing and maintaining long term and intimate
relationships with the profitable customers provides valuable benefits to the company
as the relationships between company and customers grow, a customer who is
satisfied with the company’s products and services, tends to commit the relationship,
and buy more over time. Cost of keeping the existing customers is less expensive
than the cost of acquiring new customers.
Hence, JM Ltd. should be taken into consideration long term supplier relation before
accepting the toy order based on financial consideration as contribution per hour is
more in case of toys. Further, company may also explore outsourcing opportunities
for production of toys.
© The Institute of Chartered Accountants of India

PAPER – 5: STRATEGIC COST MANAGEMENT AND PERFORMANCE EVALUATION 17
(iii) Minimum number of toys needed to be manufactured to justify the increase in fixed
cost of `1,00,000 to make the mould is 25,000 toys {1,00,000/ (`28 - `24}. Thus, as
long as company has excess capacity available to manufacture more than 25,000
toys it is cheaper to produce than to buy from subcontractor.
Minimum Expected Excess Capacity hours to justify = 25,000 toys
16 toys
= 1,562.5 or 1,563 hours
This question has been solved by considering 7,500 hrs. (3,00,000 bottles/ 40 bottles per hr.) for
bottles. This question can also be solved by taking alternative assumption as well.
Question 6
(a) Hindustan Ltd. supplies the following information relating to a vital equipment used in its
production activity for April, 2018:
Total time worked during the month 210 hrs.
Total production during the month 2,800 units.
No. of units accepted out of total production 2,520 units.
Standard time for actual production of the month 180 hrs.
Time lost during the month 28 hrs.
Required
(i) STATE an appropriate approach to measure the total productive maintenance
performance of an equipment. (2 Marks)
(ii) Quantify the total productive maintenance performance of the above-mentioned
equipment by using the approach stated in (i) above. (6 Marks)
(iii) COMMENT on the effectiveness of maintenance of the equipment. (2 Marks)
(b) ABC Airlines has two divisions organised as profit centres, the Passenger Division and the
Cargo Division. The following divisional informations were given for the year ended 31st
March 2018:
Cargo
Division
Passenger
Division
Total
Number of personnel trained 200 800 1,000
Number of flights 350 250 600
Number of reservations requested Nil 7,000 7,000
© The Institute of Chartered Accountants of India

18 FINAL (NEW) EXAMINATION: MAY, 2018
Revenue `42,00,000 `42,00,000 `84,00,000
Operating Expenses (excluding service
department charges)
`36,00,000 `28,50,000 `64,50,000
Service Department Charges:
Training `3,20,000 `3,20,000 `6,40,000
Flight Scheduling `1,50,000 `1,50,000 `3,00,000
Reservation `1,05,000 `1,05,000 `2,10,000
The service department charge rate for the service department costs was based on
revenue. Since the revenue of both the divisions were the same, the service department
charges to each division were also the same.
Required
(i) Does the income from operations for the two divisions accurately measure
performance? (3 Marks)
(ii) PREPARE the divisional income statement using the activity bases provided above
in revising the service department charges. (7 Marks)
Answer
(a) (i) The most important approach to the measurement of TPM performance is known as
Overall Equipment Effectiveness (OEE) measure. The calculation of OEE measure
requires the identification of “six big losses”
1. Equipment Failure/ Breakdown
2. Set-up/ Adjustments
3. Idling and Minor Stoppages
4. Reduced Speed
5. Reduced Yield and
6. Quality Defects and Rework
The first two losses refer to time losses and are used to calculate the availability of
equipment. The third and fourth losses are speed losses that determine performance
efficiency of equipment. The last two losses are regarded as quality losses.
Performance × Availability × Quality = OEE %
OEE may be applied to any individual assets or to a process. It is unlikely that any
manufacturing process can run at 100% OEE.
© The Institute of Chartered Accountants of India

PAPER – 5: STRATEGIC COST MANAGEMENT AND PERFORMANCE EVALUATION 19
(ii) Availability Ratio per shift = 210 hrs.
100% 210 hrs.+28 hrs.
= 88.24 %
Performance Ratio = 180 hrs.
100% 210 hrs.
= 85.71%
Quality Ratio = 2,520 units
100% 2,800 units
= 90.00%
Thus, OEE = 0.8824 × 0.8571 × 0.90
= 68.06%
This question has been solved by considering “Time Available equals to Total Time
Worked plus Time Lost”.
(iii) Comment
World Class OEE is 85% or greater, Hindustan Ltd.’s OEE is somewhere around 68%.
It just means that company got some opportunities for improvement. Hindustan Ltd.
may improve OEE by collecting information related to all downtime and losses on
equipment, analyzing such information through graphs and charts, making
improvement decisions thereon like autonomous maintenance, preventive
maintenance, reduction in set up time etc. and implementing the same.
(b) (i) The reported income from operations does not accurately measure performance
because the service department charges are based on revenue. Revenue is not
associated with the profit centre manager’s use of the service department services.
For example, the Reservations Department serves only the Passenger Division and
number of reservation requested by Cargo Division is NIL. Thus, by charging this cost
based on revenue, these costs are incorrectly charged to the Cargo Division. Further,
the Passenger Division requires additional personnel. Since these personnel must be
trained, the training costs assigned to the Passenger Division should be greater than
the Cargo Division.
© The Institute of Chartered Accountants of India

20 FINAL (NEW) EXAMINATION: MAY, 2018
(ii) ABC Airlines
Divisional Income Statement
For the Year Ended March 31, 2018
Particulars Cargo
Division
(`)
Passenger
Division
(`)
Total
(`)
Revenue 42,00,000 42,00,000 84,00,000
Less: Operating Expenses
(excluding service department
charges)
36,00,000 28,50,000 64,50,000
Gross Margin 6,00,000 13,50,000 19,50,000
Less: Service Department Charges
Training 1,28,000
200 6,40,000
1,000
`
5,12,000
800 6,40,000
1,000
`
6,40,000
Flight Scheduling 1,75,000
3503,00,000
600
`
1,25,000
2503,00,000
600
`
3,00,000
Reservation NIL
2,10,000
7,0002,10,000
7,000
`
2,10,000
Operating Income 2,97,000 5,03,000 8,00,000
© The Institute of Chartered Accountants of India