Palo Verde Valley High School -...
14
2009‐10 School Accountability Report Card Published During the 2010‐11 School Year Palo Verde Valley High School GRADES 9‐12 667 North Lovekin Blvd. Blythe, CA 92225‐1136 Phone: (760) 922‐4164 ext. 239 Website: paloverdehs.sharpschool.com/ Bob Bilek AcƟng Superintendent Bonita Bradshaw Principal Principal’s Message Palo Verde Valley High School is a comprehensive public high school that serves a mulƟcultural community. Our students come from a wide range of backgrounds; some are acquiring English and many are preparing for college. With a lot of hard work, we were able to dramaƟcally im‐ prove all of our scores during the past two years. We are determined to conƟnue this improve‐ ment and to raise our academic standing. Our curriculum is focused on developing students’ reading and wriƟng skills, and on using technology to support instrucƟon. Our students and staff conƟnually work hard to improve the quality of Palo Verde Valley High School’s program. Last spring, our school scored 650 on the Academic Performance Index (API). Our tenth grade students’ pass rates on the California High School Exit Exams (CAHSEE) were 63% for math and 66% for English/language arts. For the 2009‐10 and 2010‐11 school years, staff will conƟnue their efforts to help the high school meet all student parƟcipaƟon and schoolwide growth targets on State and Federal tests. We will conƟnue to expand and reorganize our counseling services to align with naƟonal standards. Our staff will use focused intervenƟon to improve students’ test scores in reading, wriƟng, and mathe‐ maƟcs. Through staff development and strategic lesson planning, we will conƟnue to increase teacher and student use of instrucƟonal technology. We always welcome and encourage parents to take an acƟve part in our students’ educaƟon and in acƟviƟes at our school. Parental Involvement By volunteering for special projects, chaperoning school events, or serving on a decision‐making group, parents may become a member of Palo Verde Valley High School’s learning community dedicated to developing independent lifelong learners. An open invitation is extended to parents to participate in Open House, Back to School Night, Fine Arts Programs, and Mom’s and Dad’s Nights. For parents who wish to help their student succeed in school, parenting classes are offered to teach parents effective strategies on how to help and support their student’s education at home. Parents are encouraged to serve on the School Site Council (SSC), English Language Advisory Coun‐ cil (ELAC), FFA Advisory, Western Association of Schools and Colleges (WASC) focus groups and booster clubs to actively participate in the growth and improvement process of their student and the school. The SSC approves the school site plan and oversees the school budget; the ELAC helps students learning English feel welcome at school. Palo Verde Valley High School’s booster clubs for the band and athletic programs organize, support, and raise funds for students to participate in special events and to purchase equipment. School‐to‐home communication is provided in both English and Spanish throughout the year to keep parents up to date on their student’s progress and school issues. Parents may visit www.TeacherWeb.com to obtain current information, a calendar of activities, homework assign‐ ments, student grades, and special announcements from the principal, teachers, librarian, and counselors. The Principal’s Newsletter is sent home quarterly with every report card; the newslet‐ ter keeps parents apprised of school improvement efforts, staff development, scheduled events, and student achievements. The Counseling Center’s Newsletter (provided in English and Spanish) is sent to parents and students every semester; each newsletter features reminders about upcoming exams, career planning activities, and assemblies or workshops. Palo Verde Valley High School invites parents to get involved in their child’s educational experience. Any parent who wishes to donate their time and talents or would like more information may contact the principal’s secretary at (760) 922‐7148 or Bonita Bradshaw, Principal, at (760) 922‐7148, extension 2102. To ensure the safety of students, all visitors are required to obtain a fingerprint clearance before working on campus. Palo Verde Unified School District 295 N. 1st. Street Blythe, CA 92225 Phone: (760) 922‐4164 Fax: (760) 922‐5942 www.pvusd‐bly.k12.ca.us PVUSD’s Vision and Mission Vision Statement ‐ Palo Verde Unified School District will constantly seek to improve its culture of academic excel‐ lence. We expect every student to read, write, and calculate competent‐ ly. We expect every teacher to apply consistent standards, evaluate student performance accurately, and coach students with diligence and compas‐ sion. We expect every parent, student and district employee to support the mutual quest for excellence. We are unalterably commiƩed to the infinite truth of student potenƟal and the chal‐ lenging truth of student performance. Mission Statement ‐ Our Mission is to enrich, empower, and enhance our students’ lives through educaƟon.
Transcript of Palo Verde Valley High School -...

2009‐10 School Accountability Report Card Published During the 2010‐11 School Year
Palo Verde Valley High School
GRADES 9‐12 667 North Lovekin Blvd. Blythe, CA 92225‐1136 Phone: (760) 922‐4164 ext. 239 Website: paloverdehs.sharpschool.com/
Bob Bilek Ac ng Superintendent
Bonita Bradshaw Principal
Principal’s Message
Palo Verde Valley High School is a comprehensive public high school that serves a mul cultural community. Our students come from a wide range of backgrounds; some are acquiring English and many are preparing for college. With a lot of hard work, we were able to drama cally im‐prove all of our scores during the past two years. We are determined to con nue this improve‐ment and to raise our academic standing. Our curriculum is focused on developing students’ reading and wri ng skills, and on using technology to support instruc on.
Our students and staff con nually work hard to improve the quality of Palo Verde Valley High School’s program. Last spring, our school scored 650 on the Academic Performance Index (API). Our tenth grade students’ pass rates on the California High School Exit Exams (CAHSEE) were 63% for math and 66% for English/language arts.
For the 2009‐10 and 2010‐11 school years, staff will con nue their efforts to help the high school meet all student par cipa on and schoolwide growth targets on State and Federal tests. We will con nue to expand and reorganize our counseling services to align with na onal standards. Our staff will use focused interven on to improve students’ test scores in reading, wri ng, and mathe‐ma cs. Through staff development and strategic lesson planning, we will con nue to increase teacher and student use of instruc onal technology.
We always welcome and encourage parents to take an ac ve part in our students’ educa on and in ac vi es at our school.
Parental Involvement
By volunteering for special projects, chaperoning school events, or serving on a decision‐making group, parents may become a member of Palo Verde Valley High School’s learning community dedicated to developing independent lifelong learners. An open invitation is extended to parents to participate in Open House, Back to School Night, Fine Arts Programs, and Mom’s and Dad’s Nights. For parents who wish to help their student succeed in school, parenting classes are offered to teach parents effective strategies on how to help and support their student’s education at home.
Parents are encouraged to serve on the School Site Council (SSC), English Language Advisory Coun‐cil (ELAC), FFA Advisory, Western Association of Schools and Colleges (WASC) focus groups and booster clubs to actively participate in the growth and improvement process of their student and the school. The SSC approves the school site plan and oversees the school budget; the ELAC helps students learning English feel welcome at school. Palo Verde Valley High School’s booster clubs for the band and athletic programs organize, support, and raise funds for students to participate in special events and to purchase equipment.
School‐to‐home communication is provided in both English and Spanish throughout the year to keep parents up to date on their student’s progress and school issues. Parents may visit www.TeacherWeb.com to obtain current information, a calendar of activities, homework assign‐ments, student grades, and special announcements from the principal, teachers, librarian, and counselors. The Principal’s Newsletter is sent home quarterly with every report card; the newslet‐ter keeps parents apprised of school improvement efforts, staff development, scheduled events, and student achievements. The Counseling Center’s Newsletter (provided in English and Spanish) is sent to parents and students every semester; each newsletter features reminders about upcoming exams, career planning activities, and assemblies or workshops. Palo Verde Valley High School invites parents to get involved in their child’s educational experience. Any parent who wishes to donate their time and talents or would like more information may contact the principal’s secretary at (760) 922‐7148 or Bonita Bradshaw, Principal, at (760) 922‐7148, extension 2102.
To ensure the safety of students, all visitors are required to obtain a fingerprint clearance before working on campus.
Palo Verde Unified School District
295 N. 1st. Street Blythe, CA 92225
Phone: (760) 922‐4164 Fax: (760) 922‐5942
www.pvusd‐bly.k12.ca.us
PVUSD’s Vision and Mission
Vision Statement ‐ Palo Verde Unified School District will constantly seek to improve its culture of academic excel‐lence. We expect every student to read, write, and calculate competent‐ly. We expect every teacher to apply consistent standards, evaluate student performance accurately, and coach students with diligence and compas‐sion. We expect every parent, student and district employee to support the mutual quest for excellence. We are unalterably commi ed to the infinite truth of student poten al and the chal‐lenging truth of student performance.
Mission Statement ‐ Our Mission is to enrich, empower, and enhance our students’ lives through educa on.

Palo Verde Valley High School 2
Professional Development
All teachers a end three staff develop‐ment buy‐back days every year. All math and English teachers have a end‐ed a five‐day, 40‐hour AB 472 training. All staff par cipate in bimonthly Profes‐sional Learning Communi es (PLC) mee ngs collabora ng on data and instruc onal strategies. Two full‐ me academic coaches work with all teach‐ers to improve their use of data, using the EADMS student data system and instruc onal strategies. Our District par cipates with the Riverside County Office of Educa on (RCOE) Beginning Teacher Support and Assessment (BTSA) program for new teachers and RCOE specialists work with our staff throughout the year to refine the PLC process. Each staff mee ng has an EL focus lesson given by a trained teacher.
For the previous three school years, we had three days each year dedicated to staff and professional development
Class Size
The bar graph displays the three‐year data for average class size.
07‐08 08‐09 09‐10
Class Size Distribu on — Number of Classrooms By Size
07‐08 08‐09 09‐10
Subject 1‐22 23‐32 33+ 1‐22 23‐32 33+ 1‐22 23‐32 33+
English‐Language Arts 38 16 2 16 20 15
Mathema cs 22 20 5 16 24 1
Science 6 16 4 5 17 3
History‐Social Science 4 17 4 1 13 9
Enrollment and Demographics
The total enrollment at the school was 927 students for the 2009‐10 school year.
Black or African American
10%
American Indian or Alaska Native
<1%
Asian<1%
Filipino<1%
Hispanic or Latino58%
Native Hawaiian or Pacific Islander
<1%
White30%
Two or More Races<1%
2023
2628
25 2427
30
English‐Language Arts Mathematics Science History‐Social Science

2009‐10 School Accountability Report Card 3
School Facilities
Palo Verde Valley High School provides a safe, clean environment for learning through proper facili es maintenance and campus supervision. The campus of Palo Verde Valley High School has 36 regular classrooms and 10 portable classrooms. It also features an administra on building, gymnasium, library and cafeteria. There is also a stadium, baseball field, prac ce field, and out‐door basketball courts. The school also maintains a farm, which houses up to 100 animals during parts of the school year. The school was built in 1952. Several moderniza on projects have en‐sured that school facili es are kept up to date and provide adequate space for students and staff.
The school is maintained by a district maintenance crew. An electronic work order system enables Palo Verde Valley High School to communicate maintenance needs. Emergency needs are usually handled within an hour or two.
Non‐emergency requests are typically fulfilled within 24 hours. A day custodian and an evening custodian are assigned to the school. Classrooms are cleaned at least every other day.
Campus Supervision: Palo Verde Valley High School is adjacent to the Blythe Middle School cam‐pus which enables both schools to share security personnel and facili es resources. One full‐ me sheriff’s officer and two campus supervisors secure the campus five days a week.
Students may enter campus grounds early to receive breakfast or visit the library. Breakfast is supervised in the cafeteria by a school proctor; the library is open 30 minutes before school starts.
Con nued on sidebar
School Facility Good Repair Status
Items Inspected Repair Status Items Inspected Repair Status
Systems Good Restrooms/Fountains Good
Interior Good Safety Good
Cleanliness Good Structural Good
Electrical Good External Good
Overall Summary of Facility Condi ons Exemplary
Date of the Most Recent School Site Inspec on 10/26/2010
Date of the Most Recent Comple on of the Inspec on Form 10/26/2010
School Facility Good Repair Status
This inspec on determines the school facility's good repair status using ra ngs of good condi on, fair condi on, or poor condi on. The overall summary of facility condi ons uses ra ngs of exemplary, good, fair, or poor condi on.
School Facility Items Inspected
The table shows the results of the school’s most recent inspec on using the Facility Inspec on Tool (FIT) or equivalent school form. The following is a list of items inspected.
Systems: Gas Systems and Pipes, Mechanical Systems (hea ng, ven la on, and air condi oning), Sewer
Interior: Interior Surfaces (floors, ceilings, walls, and window casings)
Cleanliness: Pest/Vermin Control, Overall Cleanliness (school grounds, buildings, rooms, and common areas)
Electrical: Electrical Systems (interior and exterior)
Restrooms/Fountains: Restrooms, Sinks/Drinking Fountains (interior and exterior)
Safety: Fire Safety Equipment, Emergency Systems, Hazardous Materials (interior and exterior)
Structural: Structural Condi on, Roofs
External: Windows/Doors/Gates/Fences, Playgrounds/School Grounds
Note: At the me of this school facility inspec on, no deficiencies were found.
School Facilities
Con nued from le
Students arriving through entrance gates, bus areas, and crosswalks are greeted and supervised by assigned teachers, administrators, and security personnel. During lunch, some teach‐ers, the counselors, administrators, and all security staff patrol the campus and share supervisory responsibility of the cafeteria and common areas. At the end of the day, assigned teachers, all administrators, all counselors, and all security staff are strategically placed on campus, supervising the bus, student pickup, and exit areas to help with traffic flow and ensure students depart safely.
During the past school year, the Sco Stadium (sports venue) project was completed. This projected included a new eight‐lane all‐weather track and new concession building with new re‐strooms. New bleachers were also in‐stalled.
A recent State grant has provided fund‐ing for a new swimming pool, which is now under construc on. The planned comple on date for the pool is March 2009.
The District par cipates in the State School Deferred Maintenance Program, which provides state matching funds on a dollar‐for‐dollar basis, to assist school districts with expenditures for major repair or replacement of exis ng school building components. Typically, this includes roofing, plumbing, hea ng, air condi oning, electrical systems, interior or exterior pain ng, and floor systems. For the 2010‐11 school year, the Dis‐trict budgeted $114,348.00 for the Deferred Maintenance Program. This represents 0.00365% of the District's general fund budget.

Palo Verde Valley High School 4
Textbooks and Instructional Materials
Subject Textbook Adopted
English‐Language Arts Hampton Brown; High Point 2002
English‐Language Arts McGraw‐Hill; Fast Track 2004
English‐Language Arts McDougal Li ell, Language of Literature 2002
Mathema cs Pren ce Hall; Algebra II 2002
Mathema cs Pren ce Hall; Pre‐Algebra 2002
Mathema cs Pren ce Hall; Algebra 2002
Textbooks and Instruc onal Materials List
History‐Social Science Pren ce Hall; Economic 2006
History‐Social Science McDougal Li ell; The Americans 2004
History‐Social Science Pren ce Hall; World History 2006
History‐Social Science McDougal Li ell; American Government 2004
Science Hold; Modern Chemistry 2002
Science Pren ce Hall; Biology 2002
Science Cummings; Conceptual Chemistry 2004
Science Addison; Conceptual Physics 2002
Science Pren ce Hall; Earth Science 2006
Science Glencoe; Life Science 2002
Note: This data was most recently collected and verified in September 2010.
Availability of Textbooks and Instructional Materials
The following lists the percentage of pupils who lack their own assigned text‐books and instructional materials:
Palo Verde Valley HS
Subject Percent Lacking
Reading/Language Arts 0%
Mathema cs 0%
Science 0%
History‐Social Science 0%
Visual and Performing Arts 0%
Foreign Language 0%
Health 0%
Science Laboratory Equipment (Grades 9‐12)
0%
All textbooks used in the core curriculum throughout the Palo Verde Unified School District are aligned to the California Content Standards and Frameworks. Instruc onal materials for grades K‐8 are selected from the state’s most recent list of standards‐based materials and adopted by the State Board of Educa on. Instruc onal materials for grades 9‐12 are approved by the Board of Trustees. The District follows the State Board of Educa on's six‐year adop on cycle for core con‐tent materials. District textbook review and adop on ac vi es occur the year following the State's adop on. Site level and District level commi ees meet to select textbooks and instruc on‐al materials. Every student including English Learners have access to their own textbooks and instruc onal materials.
On September 28, 2010, the Palo Verde Unified School District Board of Trustees held a public hearing to cer fy the extent to which textbooks and instruc onal materials have been provided to students, including English Learners, in the district.
The Board of Trustees adopted a resolu on which cer fies, as required by Educa on Code sec on 60119, that:
1. Each student in each school in the Palo Verde Unified School District has a standards‐aligned textbook or instructional materials, or both, to use in class and to take home,
2. Sufficient textbooks and instructional materials were provided to each student, including English learners, that are aligned to the academic content standards and are consistent with the cycles and content of the curriculum frameworks in mathematics, science, history‐social science, and English language arts, including the English language development component of an adopted program,
Con nued on sidebar
Textbooks and Instructional Materials
Con nued from right
3. Sufficient textbooks or instruction‐al materials were provided to each pupil enrolled in foreign language or health classes, and
4. Sufficient laboratory science equip‐ment was provided for science laboratory classes offered in grades 9‐12, inclusive. The Califor‐nia Department of Education re‐quires the most recent information to be provided regarding instruc‐tional materials; data collected and disclosed in this report regarding instructional materials was ac‐quired in September 2010.

2009‐10 School Accountability Report Card 5
Standardized Testing and Reporting Program
The Standardized Tes ng and Repor ng (STAR) Program consists of several key tests, including the California Standards Test (CST), California Modified Assess‐ment (CMA), and California Alternate Performance Assessment (CAPA). The CSTs are mul ple choice tests in English‐language arts, mathema cs, science, and history‐social science for varying grade levels. Some grade levels also par cipate in an essay wri ng test.
The CSTs are used to determine stu‐dents’ achievement of the California Academic Content Standards. These standards describe the knowledge and skills that students are expected to learn at each grade level and subject.
The CMA is a modified assessment for students with disabili es who have an individualized educa on program (IEP). It is designed to assess those students whose disabili es prevent them from achieving grade‐level proficiency on an assessment of the content standards with or without accommoda ons.
The CAPA is an alternate assessment for students with significant cogni ve disabili es who are unable to take the CST with accommoda ons or modifica‐ons or the CMA with accommoda‐ons.
For a complete report on all tests, par‐cipa on, groups, and their scores by
grade level, please visit h p://star.cde.ca.gov/. To learn more about the STAR Program, please visit the guide at www.cde.ca.gov/ta/tg/sr/documents/starpkt5intrpts.pdf.
STAR Results for All Students: Three‐Year Comparison
The Standardized Tes ng and Repor ng (STAR) results are reported as performance levels in or‐der to compare student achievement to state standards. The five performance levels are: Ad‐vanced (exceeds state standards); Proficient (meets state standards); Basic; Below Basic; and Far Below Basic. Students scoring at the Proficient or Advanced level meet state standards in that content area. The tables below show the percentage of students that scored at Proficient or Ad‐vanced levels in English‐language arts, mathema cs, science, and history‐social science.
Percentage of Students Scoring At Proficient or Advanced Levels
Palo Verde Valley HS Palo Verde USD California
07‐08 08‐09 09‐10 07‐08 08‐09 09‐10 07‐08 08‐09 09‐10
English‐Language Arts 27% 30% 32% 29% 29% 33% 46% 50% 52%
Mathema cs 7% 5% 9% 29% 29% 32% 43% 46% 48%
Science 28% 36% 35% 33% 35% 39% 46% 50% 54%
History‐Social Science 16% 16% 24% 17% 17% 21% 36% 41% 44%
STAR Results by Student Group: English‐Language Arts, Mathematics, Science, and History‐Social Science
Scores are not shown when the number of students tested is 10 or less, either because the number of students tested in this category is too small for sta s cal accuracy or to protect student privacy.
Percentage of Students Scoring At Proficient or Advanced Levels
Spring 2010 Results
Group English‐
Language Arts Mathema cs Science
History‐ Social Science
All Students in the District 33% 32% 39% 21%
All Students at the School 32% 9% 35% 24%
Male 27% 9% 35% 27%
Female 35% 9% 35% 22%
Black or African American 18% 2% 14% 11%
American Indian or Alaska Na ve
Asian
Filipino
Hispanic or La no 26% 9% 30% 21%
Na ve Hawaiian or Pacific Islander
White 45% 10% 53% 34%
Two or More Races
Socioeconomically Disadvantaged 23% 6% 25% 16%
English Learners 0% 0% 5% 2%
Students with Disabili es 4% 2% 5%
Students Receiving Migrant Educa on Services
17% 0% 14%

Palo Verde Valley High School 6
API Ranks
Schools are ranked in ten categories of equal size, called deciles, from 1 (lowest) to 10 (highest) based on their API Base reports. A school’s “statewide rank” compares its API to the APIs of all other schools statewide of the same type (elementary, middle, or high school). A “similar schools rank” reflects how a school compares to 100 statistically matched similar schools. This table shows the school’s three‐year data for statewide API rank and similar schools API rank, for which information is available.
API Growth by Student Group
This table displays, by student group, the actual API change in points added or lost for the past three years.
Academic Performance Index
The Academic Performance Index (API) is an annual measure of the academic performance and progress of schools in California. The API is a score on a scale of 200 to 1,000 that reflects a school’s, district’s or a student group’s performance level, based on the results of statewide tes ng. An API score of 800 is set as the statewide target.
Each annual API repor ng cycle includes a Base and a Growth API. The Base API starts the re‐por ng cycle and is released approximately a year a er tes ng (i.e., The 2009 Base is calculated from results of statewide tes ng in spring 2009 but is released in May 2010). The Growth API is released a er the Base API but is calculated from test results from the following year (i.e., The Growth API is calculated from results of statewide tes ng in spring 2010 and released in August 2010). Therefore, for the 2009‐10 API repor ng cycle, the 2009 Base indicator and 2010 Growth indicator are used. To learn more about API, please visit the API informa on guide at www. cde.ca.gov/ta/ac/ap/documents/infoguide09.pdf and the API overview guide at www.cde.ca.gov/ta/ac/ay/documents/overview10.pdf.
API Ranks — Three Year Comparison
2007 2008 2009
Statewide API Rank 3 3 2
Similar Schools API Rank 3 3 1
API Ranks
API Growth by Student Group
Data are reported only for numerically significant groups.
API Growth by Student Group — Three Year Comparison
Group Actual API Change
07‐08 08‐09 09‐10
All Students at the School 4 ‐24 5
Black or African American
American Indian or Alaska Na ve
Asian
Filipino
Hispanic or La no 25 ‐32 17
Na ve Hawaiian or Pacific Islander
White ‐17 ‐15 ‐7
Two or More Races
Socioeconomically Disadvantaged 8 ‐26 ‐4
English Learners ‐21
Students with Disabili es
2009‐10 School Accountability Report Card 7
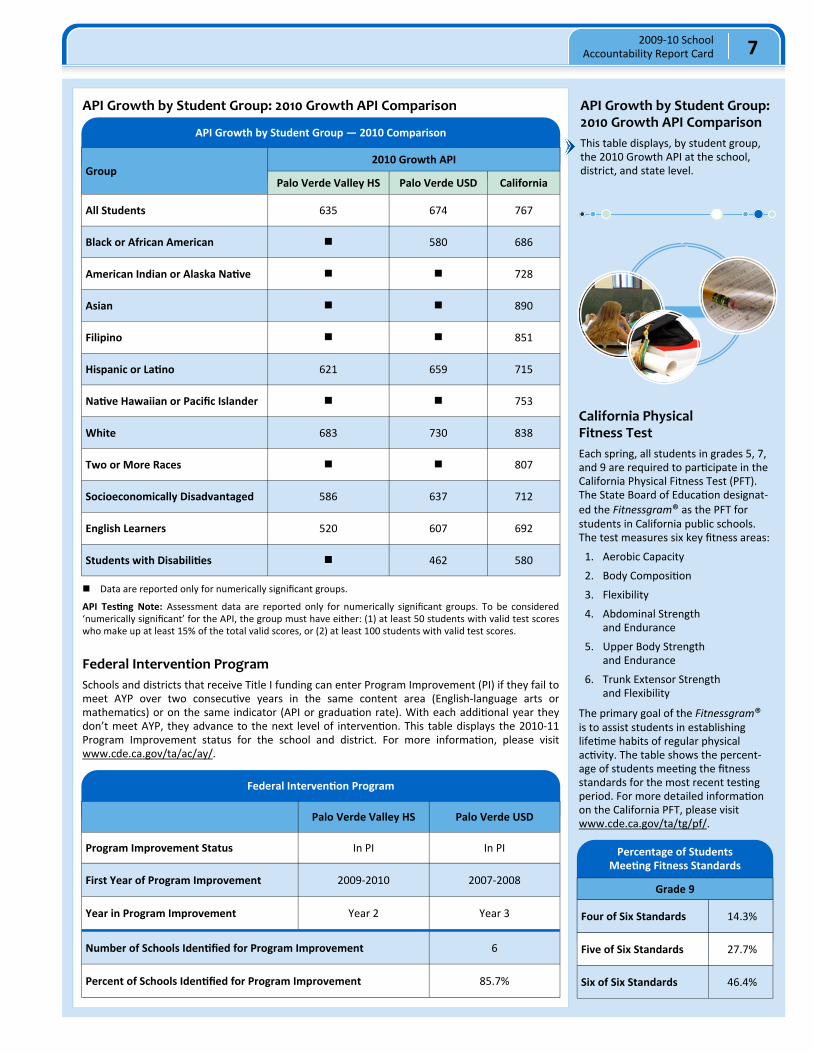
API Growth by Student Group: 2010 Growth API Comparison
This table displays, by student group, the 2010 Growth API at the school, district, and state level.
API Growth by Student Group: 2010 Growth API Comparison
Data are reported only for numerically significant groups.
API Tes ng Note: Assessment data are reported only for numerically significant groups. To be considered ‘numerically significant’ for the API, the group must have either: (1) at least 50 students with valid test scores who make up at least 15% of the total valid scores, or (2) at least 100 students with valid test scores.
API Growth by Student Group — 2010 Comparison
Group 2010 Growth API
Palo Verde Valley HS Palo Verde USD California
All Students 635 674 767
Black or African American 580 686
American Indian or Alaska Na ve 728
Asian 890
Filipino 851
Hispanic or La no 621 659 715
Na ve Hawaiian or Pacific Islander 753
White 683 730 838
Two or More Races 807
Socioeconomically Disadvantaged 586 637 712
English Learners 520 607 692
Students with Disabili es 462 580
Federal Interven on Program
Palo Verde Valley HS Palo Verde USD
Program Improvement Status In PI In PI
First Year of Program Improvement 2009‐2010 2007‐2008
Year in Program Improvement Year 2 Year 3
Number of Schools Iden fied for Program Improvement 6
85.7% Percent of Schools Iden fied for Program Improvement
Federal Intervention Program
Schools and districts that receive Title I funding can enter Program Improvement (PI) if they fail to meet AYP over two consecu ve years in the same content area (English‐language arts or mathema cs) or on the same indicator (API or gradua on rate). With each addi onal year they don’t meet AYP, they advance to the next level of interven on. This table displays the 2010‐11 Program Improvement status for the school and district. For more informa on, please visit www.cde.ca.gov/ta/ac/ay/.
California Physical Fitness Test
Each spring, all students in grades 5, 7, and 9 are required to par cipate in the California Physical Fitness Test (PFT). The State Board of Educa on designat‐ed the Fitnessgram® as the PFT for students in California public schools. The test measures six key fitness areas:
1. Aerobic Capacity
2. Body Composi on
3. Flexibility
4. Abdominal Strength and Endurance
5. Upper Body Strength and Endurance
6. Trunk Extensor Strength and Flexibility
The primary goal of the Fitnessgram® is to assist students in establishing life me habits of regular physical ac vity. The table shows the percent‐age of students mee ng the fitness standards for the most recent tes ng period. For more detailed informa on on the California PFT, please visit www.cde.ca.gov/ta/tg/pf/.
Percentage of Students Mee ng Fitness Standards
Grade 9
Four of Six Standards 14.3%
Five of Six Standards 27.7%
Six of Six Standards 46.4%

Palo Verde Valley High School 8
Public Internet Access
Internet access is available at public libraries and other loca ons that are publicly accessible (i.e., the California State Library). Access to the Internet at libraries and public loca ons is generally provided on a first‐come, first‐served basis. Other use restric ons include the hours of opera on, the length of me that a worksta on may be used (depending on availability), the types of so ‐ware programs available at a worksta on, and the ability to print documents.
Academic Counselors and School Support Staff
Academic Counselors
Number of Academic Counselors (FTE) 2.0
Ra o of Students Per Academic Counselor 463.5:1
Support Staff FTE
Counselor (Social/Behavioral or Career Development) 0.0
Library Media Teacher (Librarian) 0.0
Library Media Services Staff (Paraprofessional) 1.0*
Psychologist 1.0*
Social Worker 1.0*
Nurse 1.0*
Speech/Language/Hearing Specialist 1.0*
Resource Specialist (non‐teaching) 0.0
Other: Career Technician 1.0
FTE and Ra o
* District support staff
Academic Counselors and School Support Staff
Adequate Yearly Progress
Adequate Yearly Progress Criteria
Palo Verde Valley HS Palo Verde USD
Met Overall AYP No No
AYP Criteria English‐
Language Arts Mathema cs
English‐Language Arts
Mathema cs
Par cipa on Rate Yes Yes Yes Yes
Percent Proficient No No No No
API Yes Yes
Gradua on Rate No No
Adequate Yearly Progress
The No Child Le Behind (NCLB) Act requires that all schools and districts meet Adequate Yearly Progress (AYP) requirements. To meet these stand‐ards, California public schools and dis‐tricts must meet or exceed criteria in four target areas:
1. Par cipa on rate on statewide assessments in English‐language arts and mathema cs
2. Percentage of students scoring proficient on statewide assessments in English‐language arts and mathema cs
3. API scores
4. Gradua on rate for high schools
The table displays whether or not the school and district made AYP overall and met each of the AYP criteria for 2009‐10. For more informa on, visit www.cde.ca.gov/ta/ac/ay/.
Academic Counselors and School Support Staff
This table displays informa on about academic counselors and support staff at the school and their full‐ me equiva‐lent (FTE).

2009‐10 School Accountability Report Card 9
Graduates and Dropouts
This table displays the gradua on and one‐year dropout rates for the most recent three‐year period for which data is available.
Graduate and Dropout Rates
Palo Verde Valley HS Palo Verde USD California
06‐07 07‐08 08‐09 06‐07 07‐08 08‐09 06‐07 07‐08 08‐09
Gradua on Rate
84.71% 86.39% 82.01% 69.75% 75.82% 72% 80.61% 80.21% 78.59%
1‐year Dropout Rate
2.73% 3.54% 2.99% 7.44% 7.17% 6.07% 5.46% 4.88% 5.69%
Career Technical Education Programs
The District provides Career Technical Educa on in Agriculture (Ag. Mechan‐ics, Ag. Science, Plant and Soil Science, and Ag. Commons) and Home Econom‐ics (Child Development, Foods and Clothing and Tex les) at Palo Verde High School. Riverside County offers a Regional Occupa onal Program in Com‐puters also at PVHS.
Mr. Mark Mullion is the representa ve of the District’s Career Technical Advi‐sory Commi ee and it represents the Agricultural Industry in the area.
Career Technical Education Participation
This table displays informa on about par cipa on in the school’s Career Technical Educa on (CTE) programs.
Career Technical Educa on Data
2009‐10 Par cipa on
Number of Pupils Par cipa ng in CTE
Percentage of Pupils Who Completed a CTE Program and Earned a High School Diploma
Percentage of CTE Courses that are Sequenced or Ar culated Between a School and Ins tu ons of Postsecondary Educa on
Please see the District Office.
Completion of High School Graduation Requirements
Scores are not shown when the number of students tested is 10 or less, either because the number of students tested in this category is too small for sta s cal accuracy or to protect student privacy.
Comple on of High School Gradua on Requirements
Group Gradua ng Class of 2010
Palo Verde Valley HS Palo Verde USD
All Students 93.8% 80.2%
Socioeconomically Disadvantaged 96.4% 107.2%
English Learners 85.7% 84.4%
Students with Disabili es 85.7% 85.7%
Black or African American 68.4% 66.7%
American Indian or Alaska Na ve
Asian
Filipino
Hispanic or La no 100.0% 76.4%
Na ve Hawaiian or Pacific Islander
Two or More Races
White 92.5% 80.8%
California
94.5%
91.3%
98.5%
53.4%
89.7%
95.3%
97.4%
98.2%
91.6%
95.2%
98.1%
Types of Services Funded
Palo Verde High School provides a number of supplemental services to support and assist stu‐dents. A tutoring lab is provided a er school with cer ficated teachers available to assist stu‐dents. CAHSEE English and Math classes are offered during the school day for 11th and 12th grade students who have not passed the state exit exam. A Career Center is open three hours each day. It provides informa on on colleges and careers and provides a place for military recruiters to meet with students. Categorical funds pay for two instruc onal aides who assist English learners.
Data not available from the state at this me.
Completion of High School Graduation Requirements
This table shows the percentage of students (that began the 2009‐10 school year in the 12th grade) who met all state and local gradua on re‐quirements for receiving a high school diploma including having passed both the English‐language arts and mathe‐ma cs por ons of the CAHSEE or re‐ceived a local waiver or state exemp‐on. For more informa on, visit
www.cde.ca.gov/ta/tg/hs.
Palo Verde Valley High School 10
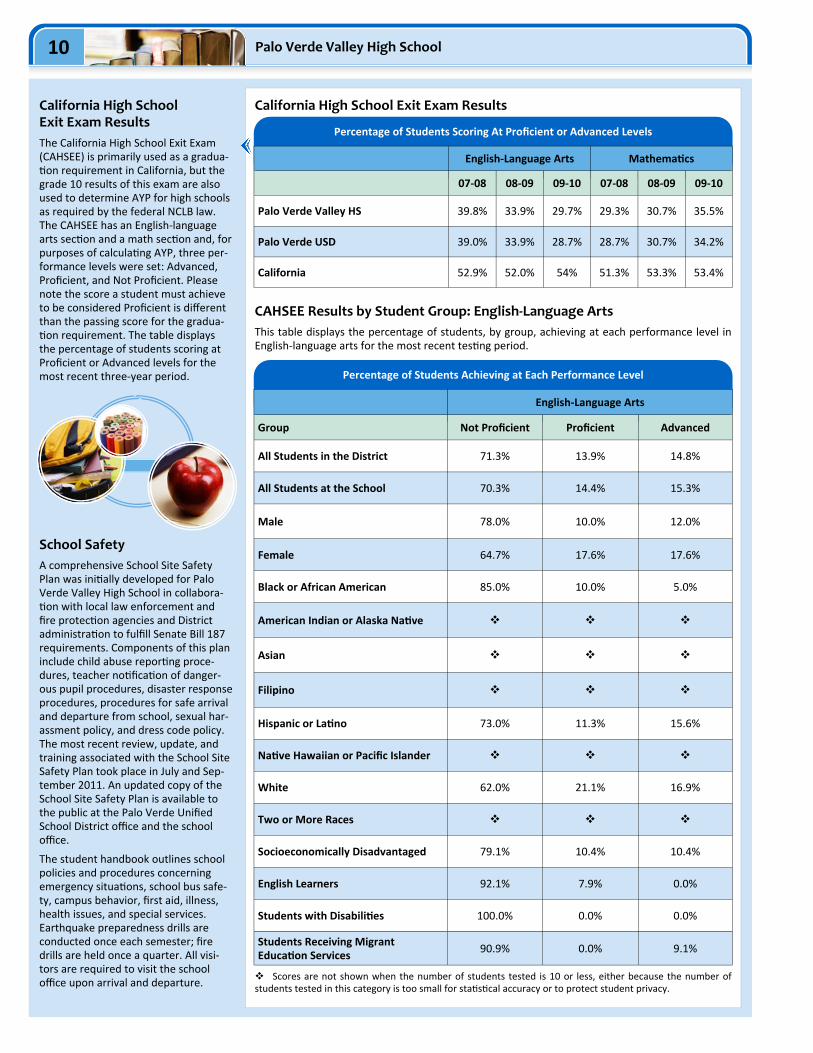
California High School Exit Exam Results
Percentage of Students Scoring At Proficient or Advanced Levels
English‐Language Arts Mathema cs
07‐08 08‐09 09‐10 07‐08 08‐09 09‐10
Palo Verde Valley HS 39.8% 33.9% 29.7% 29.3% 30.7% 35.5%
Palo Verde USD 39.0% 33.9% 28.7% 28.7% 30.7% 34.2%
California 52.9% 52.0% 54% 51.3% 53.3% 53.4%
CAHSEE Results by Student Group: English‐Language Arts
This table displays the percentage of students, by group, achieving at each performance level in English‐language arts for the most recent tes ng period.
Scores are not shown when the number of students tested is 10 or less, either because the number of students tested in this category is too small for sta s cal accuracy or to protect student privacy.
Percentage of Students Achieving at Each Performance Level
English‐Language Arts
Group Not Proficient Proficient Advanced
All Students in the District 71.3% 13.9% 14.8%
All Students at the School 70.3% 14.4% 15.3%
Male 78.0% 10.0% 12.0%
Female 64.7% 17.6% 17.6%
Black or African American 85.0% 10.0% 5.0%
American Indian or Alaska Na ve
Asian
Filipino
Hispanic or La no 73.0% 11.3% 15.6%
Na ve Hawaiian or Pacific Islander
White 62.0% 21.1% 16.9%
Two or More Races
Socioeconomically Disadvantaged 79.1% 10.4% 10.4%
English Learners 92.1% 7.9% 0.0%
Students with Disabili es 100.0% 0.0% 0.0%
Students Receiving Migrant Educa on Services
90.9% 0.0% 9.1%
School Safety
A comprehensive School Site Safety Plan was ini ally developed for Palo Verde Valley High School in collabora‐on with local law enforcement and
fire protec on agencies and District administra on to fulfill Senate Bill 187 requirements. Components of this plan include child abuse repor ng proce‐dures, teacher no fica on of danger‐ous pupil procedures, disaster response procedures, procedures for safe arrival and departure from school, sexual har‐assment policy, and dress code policy. The most recent review, update, and training associated with the School Site Safety Plan took place in July and Sep‐tember 2011. An updated copy of the School Site Safety Plan is available to the public at the Palo Verde Unified School District office and the school office.
The student handbook outlines school policies and procedures concerning emergency situa ons, school bus safe‐ty, campus behavior, first aid, illness, health issues, and special services. Earthquake preparedness drills are conducted once each semester; fire drills are held once a quarter. All visi‐tors are required to visit the school office upon arrival and departure.
California High School Exit Exam Results
The California High School Exit Exam (CAHSEE) is primarily used as a gradua‐on requirement in California, but the
grade 10 results of this exam are also used to determine AYP for high schools as required by the federal NCLB law. The CAHSEE has an English‐language arts sec on and a math sec on and, for purposes of calcula ng AYP, three per‐formance levels were set: Advanced, Proficient, and Not Proficient. Please note the score a student must achieve to be considered Proficient is different than the passing score for the gradua‐on requirement. The table displays
the percentage of students scoring at Proficient or Advanced levels for the most recent three‐year period.

2009‐10 School Accountability Report Card 11
Courses Required for UC/CSU Admission
University of California: Admission requirements for the University of California (UC) follow guidelines set forth in the Master Plan, which requires that the top one‐eighth of the state’s high school graduates, as well as those transfer students who have successfully completed specified college work, be eligible for admission to the UC. These requirements are designed to ensure that all eligible students are adequately prepared for University‐level work. For more in‐forma on on general admissions requirements, please visit the University of California Web site at www.universityofcalifornia.edu/admissions/general.html.
California State University: Admission requirements for the California State University (CSU) use three factors to determine eligibility. They are: specific high school courses; grades in specified courses and test scores; and gradua on from high school. Some campuses have higher standards for par cular majors or students who live outside the local campus area. Because of the number of students who apply, a few campuses have higher standards (supplementary admission criteria) for all applicants. Most CSU campuses u lize local admission guarantee policies for students who graduate or transfer from high schools and colleges that are historically served by a CSU campus in that region. For general admissions requirements, please visit the California State University Web site at www.calstate.edu/admission.
Course Enrollment for UC/CSU Admission
The table displays two measures relat‐ed to the school’s courses that are re‐quired for University of California (UC) and/or California State University (CSU) admission for the most recent year for which data is available. For more detailed informa on, please visit h p://dq.cde.ca.gov/dataquest/.
UC/CSU Admission Data
2008‐09 Admission
Percentage of Students Enrolled in Courses Required for UC/CSU Admission
Percentage of Graduates Who Completed All Courses Required for UC/CSU Admission
Please see the District Office.
CAHSEE Results by Student Group: Mathematics
This table displays the percentage of students, by group, achieving at each performance level in mathema cs for the most recent tes ng period.
Scores are not shown when the number of students tested is 10 or less, either because the number of students tested in this category is too small for sta s cal accuracy or to protect student privacy.
Percentage of Students Achieving at Each Performance Level
Mathema cs
Group Not Proficient Proficient Advanced
All Students in the District 65.8% 21.8% 12.3%
All Students at the School 64.5% 22.6% 12.8%
Male 65.3% 18.4% 16.3%
Female 64.0% 25.7% 10.3%
Black or African American 90.0% 10.0% 0.0%
American Indian or Alaska Na ve
Asian
Filipino
Hispanic or La no 66.4% 22.1% 11.4%
Na ve Hawaiian or Pacific Islander
White 54.3% 27.1% 18.6%
Two or More Races
Socioeconomically Disadvantaged 72.7% 17.4% 9.9%
English Learners 89.7% 10.3% 0.0%
Students with Disabili es 95.7% 4.3% 0.0%
Students Receiving Migrant Educa on Services
81.8% 18.2% 0.0%
Suspensions and Expulsions
This table shows the rate of suspen‐sions and expulsions (the total number of incidents divided by the school’s total enrollment) for the most recent three‐year period.
Suspension Rate
Palo Verde Valley HS
07‐08 08‐09 09‐10
21% 8% 0%
Palo Verde USD
07‐08 08‐09 09‐10
21% 8% 0%
Expulsion Rate
Palo Verde Valley HS
07‐08 08‐09 09‐10
3% 1% 0%
Palo Verde USD
07‐08
2% 0% 0%
08‐09 09‐10

Palo Verde Valley High School 12
Teacher Qualifications
Teacher Misassignments and Vacant Teacher Positions
This table displays the number of teacher misassignments (teachers assigned without proper legal authoriza on) and the number of vacant teacher posi ons (not filled by a single designated teacher assigned to teach the en re course at the beginning of the school year or semester). Please note: Total teacher misassignments includes the number of misassignments of teachers of English Learners.
No Child Left Behind Compliant Teachers
NCLB requires that all teachers of core academic subject areas be “highly qualified.” In general, for a teacher to be considered highly qualified, they must have a bachelor’s degree, an appropri‐ate California teaching creden al, and have demonstrated competence for each core subject he or she teaches. The table displays data regarding NCLB compliant teachers from the 2009‐10 school year. For more informa on on teacher qualifica ons related to NCLB, please visit www.cde.ca.gov/nclb/sr/tq.
Teacher Creden al Informa on
Palo Verde USD Palo Verde Valley HS
Teachers 09‐10 07‐08 08‐09 09‐10
With Full Creden al 145 38 44 32
Without Full Creden al 7 9 5 2
0 4 3 Teaching Outside Subject Area of Competence
Teacher Misassignments and Vacant Teacher Posi ons
Palo Verde Valley HS
08‐09 09‐10 10‐11
Teacher Misassignments of English Learners 0 0 0
Total Teacher Misassignments 0 0 0
Vacant Teacher Posi ons 0 0 0
No Child Le Behind Compliant Teachers
Taught by NCLB
Compliant Teachers Taught by Non‐NCLB Compliant Teachers
Palo Verde Valley HS 96.2% 3.8%
All Schools in District 90.6% 9.4%
Low‐Poverty Schools in District
Percent of Classes in Core Academic Subjects
High‐Poverty Schools in District 100.0% 0.0%
Not applicable.
NCLB Note: High‐poverty schools are defined as those schools with student par cipa on of approximately 75% or more in the free and reduced priced meals program. Low‐poverty schools are those with student par cipa on of approximately 25% or less in the free and reduced priced meals program.
Advanced Placement Courses
The following is a list of advanced placement (AP) courses offered by subject at the school.
Advanced Placement Courses
Computer Science
English
Fine and Performing Arts
Foreign Language
Mathema cs
Science
Social Science
Teacher Qualifications
This table shows informa on about teacher creden als and teacher qualifica ons. More informa on can be found by visi ng h p://data1.cde.ca.gov/dataquest/.
Please see the District Office.

2009‐10 School Accountability Report Card 13
Financial Data
The financial data displayed in the SARC is from the 2008‐09 fiscal year. The most current fiscal informa on available provided by the state is always two years behind the current school year, and one year behind most other data included in this report. For more detailed financial informa on, please visit www.cde.ca.gov/ds/fd/cs and www.cde.ca.gov/ds/fd/ec.
District Financial Data
District Salary Data
Category Palo
Verde USD Similar Sized
District
Beginning Teacher Salary $38,895 $38,970
Mid‐Range Teacher Salary $60,906 $59,776
Highest Teacher Salary $78,552 $78,072
Average Principal Salary (Elementary School) $86,817 $94,605
Average Principal Salary (Middle School) $103,818 $98,480
Average Principal Salary (High School) $110,631 $106,266
Superintendent Salary $156,795 $144,721
Teacher Salaries — Percent of Budget 32.4% 38.8%
Administra ve Salaries — Percent of Budget 5.8% 6%
School Financial Data
School Financial Data
Palo Verde Valley HS
Total Expenditures Per Pupil $7,941
Expenditures Per Pupil From Restricted Sources $3,302
Expenditures Per Pupil From Unrestricted Sources $4,639
Annual Average Teacher Salary $56,419
Financial Data Comparison
The following table displays the school’s per pupil expenditures from unrestricted sources and the school’s average teacher salary and compares it to the district and state data.
Financial Data Comparison
Expenditures Per Pupil From
Unrestricted Sources
Annual Average Teacher
Salary
Palo Verde Valley HS $4,639 $56,419
Palo Verde USD $6,039 $56,419
California $5,681 $61,706
School and District — Percent Difference ‐30.2% +0.0%
School and California — Percent Difference ‐22.5% ‐9.4%
District Financial Data
This table displays district teacher and administra ve salary informa on and compares the figures to the state averages for districts of the same type and size based on the salary schedule. Note the district salary data does not include benefits.
School Financial Data
The following table displays the school’s average teacher salary and a breakdown of the school’s expenditures per pupil from unrestricted and restricted sources.

Palo Verde Unified School District
GRADES 9‐12 667 North Lovekin Blvd. Blythe, CA 92225‐1136 Phone: (760) 922‐4164 ext. 239 Website: paloverdehs.sharpschool.com/
Data in this report are provided by the California Department of Educa on (CDE), school and the district office. For addi onal informa on on facts about California schools and districts, please visit DataQuest at h p://data1.cde.ca.gov/dataquest. DataQuest is an online resource that provides reports for accountability, test data, enrollment, graduates, dropouts, course enrollments, staffing and data regarding English Learners.
All data accurate as of February 2011.
PUBLISHED BY: School Innovations & Advocacy | www.sia‐us.com | 800.487.9234
Palo Verde Valley High School